Embed Size (px)
Citation preview
COMPARISON OF GASOMETRIC, COLORIMETRIC, AND TITRIMETRIC DETERMINATIONS OF AMINO
NITROGEN IN BLOOD AND URINE
BY DONALD D. VAN SLYKE AND ESBEN KIRK
(From the Hospital of The Rockefeller Institute for Medical Research, New York)
(Received for publication, July 19, 1933)
Of the titrimetric, calorimetric, and gasometric methods now available for determination of amino acids, none is entirely specific. Consequently it has been impossible to tell what proportion of the “amino acid nitrogen” determined in blood or urine with any one of these procedures really represents the amino acids, and what proportion is due to other substances capable of reacting with the reagents used. However, if it can be shown that methods based on
several different reactions yield similar results for preexisting amino acids in blood and urine, and afford accurate measurement of added known amounts, it may be assumed with a reasonable degree of probability that the effect of interfering substances is not impor- tant. The desirability for a study of the question presented itself to the writers when one of them (Kirk), using the gasometric nitrous acid method, observed regularly in uremic coma a several fold increase in the amino nitrogen of the blood, whereas the numerous clinical studies appearing in recent years with the Folin (1922, a) calorimetric method had disclosed no such phenomenon.
The methods chosen for the present study are the formaldehyde titration of Sorensen (1907), the calorimetric method of Folin (1922, a, b), and the nitrous acid gasometric procedure of the authors (Van Slyke, 1929; Van Slyke and Kirk, 1932), each applied to both blood and urine, and the acetone titration of Linderstrem-Lang (1928) applied to blood as described by Zirm and Benedict (1931).
Zirm and Benedict appear to be the only previous authors who have reported comparative results on blood or urine by different methods. They analyzed four blood filtrates by their application of the acetone titration, by the Folin calorimetric method, and by
651
by guest on April 7, 2020
http://ww
w.jbc.org/
Dow
nloaded from
652 Amino N in Blood and Urine
the gasometric method of Van Slyke (1929). Results of the same order of magnitude (6 to 8 mg. of amino N per 100 cc. in three normal bloods and 9 to 11 mg. in one leucemic blood) were obtained with all three procedures, but the gasometric method in the three normal bloods gave 0.6 to 1.0 mg. more than the other analyses. In applying the gasometric method Zirm and Benedict apparently omitted the preliminary removal of urea prescribed by Van Slyke (1929). The effect of this omission in blood of ordinary urea con- tent would be to raise the apparent amino nitrogen content by 0.5 to 1.0 mg. per 100 cc., the extent by which Zirm and Benedict’s gasometric values exceed their titration results. Alanine added to blood by Zirm and Benedict was accurately determined by the acetone titration, but not by the calorimetric method.
Schmidt (1929) and Re and Potick (1930) also found that the col- orimetric method failed to determine completely amounts of amino nitrogen greater than those ordinarily found in human blood. Hiller and Van Slyke (1922) found that amino acids added to blood were accurately determined by the gasometric method.
The different methods do not yield identical results with all the amino acids derived from proteins. Further, with either titration method applied to a diamino or dicarboxylic acid, the result ob- tained when the starting point is the pH spontaneously assumed by a solution of the pure amino acid (its isoelectric point) is altogether different from the result obtained when the starting point is arbi- trarily adjusted to a given pH. The difference in the behavior of the different types of amino acids towards the reagents used for their determination, and, in the titrations, the further differences introduced by preliminary pH adjustment, appear never to have been summarized. Without such a summary it would be difficult to know what concordance is theoretically possible among results of the various methods. We shall therefore precede our experi- mental report with a resume of the principles of the titrations, the effects upon them of preliminary pH adjustments, and of the be- havior of the reagents used for the calorimetric and gasometric determinations.
Theory of Amino Acid Titrations
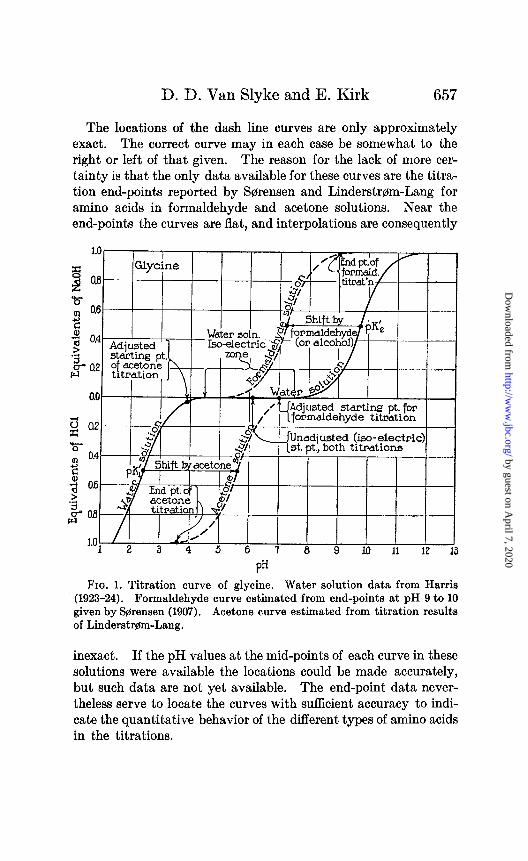
Most monoaminomonocarboxylic acids have similar titration curves, which vary but slightly from that given in Fig. 1. There
by guest on April 7, 2020
http://ww
w.jbc.org/
Dow
nloaded from
D. D. Van Slyke and E. Kirk 653
are in each such amino acid two buffer groups, with pK’ values’ in the neighborhood of 2 and 9.5, respectively (Harris, 1923-24; Kirk and Schmidt, 1929). Which buffer group represents the amino group and which the carboxyl is at present not entirely cer- tain, and for defining the titration behavior it is not necessary to know which is which. We shall, therefore, for this discussion, simply characterize the two groups as the first, or lower, with pK’1 = about 2, and the second, or upper, with pK’n = about 9.5. For dicarboxylic and diamino acids, with three buffer groups each, the pK’ values will similarly be indicated in order from least to greatest as PK’~, pKfz, and pKla.
The necessity of using such devices as addition of acetone, alcohol, or formaldehyde in order to make amino acid titrations practicable is indicated by the curves of Figs. 1 to 5. In simple water solution titration of the group with lowest pK’ would, in each type of amino acid illustrated, involve use of an end-point of about pH 1.5, while titration of the groups with the highest pK’ values would require end-points of pH 11 or higher. At pH 1.5 the correction for the free HCI necessary to give this reac- tion becomes an important part of 6he total HCl utilized in titrating a dilute amino acid solution; and the curve at this point is so steep thclt accuracy in fixing the end-point is difficult. Furthermore, such end-points as pH 1.5 and 11 are outside the
1 .The symbol pK’ is used in the sense employed by one of the writers in a discussion of buffers (Van Slyke, 1922). It is the pH of the buffer solution when the buffer group, if acid, is half neutralized by strong alkali, or, if basic, is half neutralized by strong acid. In the case of an acid buffer, such as acetic acid, pK’ = -log K’,, where K ‘,, is the apparent acid dissociation
constant. In the case of a basic buffer, pK’ = -logs, where K’a is the b
apparent basic dissociation constant and K, is the dissociation constant of water, approximately lo+*. When pK’ is thus defined a strong acid is one with a low pK’, while a strong base is one with a high pK’.
The use of pK’ in this sense was found to be advantageous in discussing the general behavior of buffers. In the present connection it has a partic- ular advantage in that for a curve with a given location the pK’ has the same value whether the buffer group is basic or acidic. When the buffer groups are characterized by pK’ values in this sense, the curves can be discussed without assumption as to whether, in Fig. 1 for example, the upper curve represents the NH, group and the lower the carboxyl group, or vice versa.
by guest on April 7, 2020
http://ww
w.jbc.org/
Dow
nloaded from
654 Amino N in Blood and Urine
practicable range of indicators, which, being buffers themselves, are applicable only between pH 2 and 11, and preferably between 3 and 10. To make the amino acids titratable with indicators, devices have therefore been introduced to change either the media in which they are dissolved or the structures of the amino acids themselves in such a manner that at least one of the buffer groups has its pK’ moved within the range between 5 and 8, so that titra- tions can be carried out with end-points not lower than pH 3 nor higher than pH 10.
In the titration methods of Foreman (1920), of Willstatter and Waldschmidt-Leitz (1921), and of Linderstrom-Lang (1928), the solvent is changed to one of lower dielectric constant by addition of 10 or more volumes of alcohol or acetone. Alcohol, used by Foreman and by WillsMter and Waldschmidt-Leitz, moves PK’~ down far enough to bring its buffer group within the zone practic- able for titration with alkali. Acetone, used by Linderstr@m-Lang, moves PK’~ up far enough to make its buffer group titratable with HCI (see Fig. 1).2
Sorensen (1907), in the first and most widely applied titration method, added formaldehyde, which, like alcohol, lowers the upper pK’. In this ca.se the change is not in the dielectric constant of the medium, but in the structure of the amino acids. Schiff (1899,1901, 1902) showed that forma.ldehyde reacts with primary and secondary aliphatic smines a.s indicated by the equations, RNHz + OCH:! = RN :CH2 + Hz0 and 2RzNH + OCHz = (R2N)&H2 + HzO. (The latter reaction occurs with imino groups in proline, oxypro- line, and perhaps histidine.) The resulting condensation products, RN : CH2 and (R2N)2CH2, are much weaker bases than the original amines; and their upper titration curves are shifted towards the left when plotted as in Fig. 1. Sorensen applied the reaction to amino acids, and found that addition of formaldehyde moved the second pK’ down to the neighborhood of pH 7, so that this buffer group could be titrated with NaOH to pH 9 with phenolphthalein
* Presumably alcohol and acetone, which have similar dielectric con- stants (26 and 21 respectively compared with 81 for water), have nearly like
effects on both types of buffer groups in the amino acids. It happens that conditions for titration in alcohol have been worked out for the upper group and in acetone for the lower.
by guest on April 7, 2020
http://ww
w.jbc.org/
Dow
nloaded from
D. D. Van Slyke and E. Kirk 655
as indicator, or in some amino acids more completely to pH 10 with thymolphthalein.
Nature of Bu$er Groups Titrated
Since titration of a monoamino acid in water solution with HCl leads to the lower titration curve with its mid-point near pH 2 (Fig. l), it was at first natural to assume that this curve was that of the basic NH2 group directly neutralized by the added HCl. And similarly that titration with NaOH, leading to the curve with mid- point near pH 9.5, represented the course of neutralization of the carboxyl group by the alkali. This assumption was made in the earlier work of S@rensen and others, and must still be admitted as a possible explanation of the observed titration curves. In ac- cordance with it, however, the NH2 group would have to possess an extremely weak basicity, similar to that of aniline, and the carboxyl group a very weak acidity, similar to that of phenol. An equimolar mixture of phenol and aniline would give a complete titration curve almost identical with that of glycine in Fig. 1. In the isoelectric zone between pH 4 and 7 such weakly basic and acidic substances would be free from salt-like combination, either with other acids or bases or with each other. If the acid and basic groups of an amino acid are of this weak type the state of the amino acid in the isoelectric zone is represented by the ordinary structural formula, HOOCRNH2, with no charges or other evidence of elec- trolyte behavior of either the NH2 or COOH group.
Bjerrum (1923), however, has pointed out that it is improbable that aliphatic amino and carboxyl groups should be so weakly basic and acidic, respectively, as is required by the above hy- pothesis. Aliphatic amines ingeneral are strong bases, with high pK’ values resembling that of ammonia, which is about 10. And ali- phatic acids have pK’ values mostly between 3 and 5, and therefore much nearer the pK’1 than the pKlz values of the monoamino acids. Bjerrum believes therefore that in an amino acid of the type of glycine (Fig. 1) the pK’1 is that of the carboxyl group, the PK’~ is that of the amino group, and that the amino acid has in the isoelectric state the character of an internal ammonium salt of an unusually strong organic acid. This internal salt he represents by the formula, -OOCRNH,+, and terms it a zwitter ion, since it carries in itself the charges of both a positive and a negative ion. In accordance
by guest on April 7, 2020
http://ww
w.jbc.org/
Dow
nloaded from
656 Amino N in Blood and Urine
with this explanation, when glycine is titrated with HCl the latter sets free the carboxyl group from this salt combination, as HCl sets free lactic acid from ammonium lactate (Fig. 6), and the hydrogen ions in the titrated glycine solution are those liberated by dissociation of the carboxyl H in HOOCCHzNH&l. The accordance of this explanation with the facts is shown by the similarity of the titration curves of glycine (Fig. 1) and ammonium lactate (Fig. 6). The accordance extends also to the similarity of behavior of lactic acid and the lower buffer group of glycine in the acetone titration, and to the similarity of behavior of ammonia and the upper buffer group of glycine in the formaldehyde titration (Figs. 1 and 6). The fact that the upper buffer group of glycme is the one to have its pK’ chiefly affected by reaction with formalde- hyde is also readily comprehensible in accordance with the hy- pothesis that this group is the NH2group. It appears more probable that the formaldehyde condensation affects chiefly the basicity of the NH2 group that is changed to N:CHs rather than the acidity of a carboxyl group not altered by the condensation. Other evi- dences favoring the zwitter ion theory have been advanced by Bor- sook and MacFadyen (1930).
The alcohol titration appears not yet to have been applied to blood or urine, but the formaldehyde and acetone titrations have found application under conditions which it appears desirable to examine in some detail, in order to ascertain the significance of the results and the possible sources of error.
Titration Curves of Amino Acids
The types of titration curves given in water solution by the dif- ferent types of amino acids and by ammonium lactate are repre- sented in the solid curves of Figs. 1 to 6. The titrations in the presence of acetone and formaldehyde are indicated, as accurately as available data permit, by the dash line curves. Acetone in the case of each amino acid increases the lowest pK’, which according to Bjerrum represents a carboxyl group. Formaldehyde on the other hand lowers the uppermost pK’, and in diamino acids the intermediate pK’ also, which according to Bjerrum represent the reacting NH2 and NH groups. In consequence the titration curves of the affected buffer groups are shifted to the right or left as indicated by the arrows.
by guest on April 7, 2020
http://ww
w.jbc.org/
Dow
nloaded from
D. D. Van Slyke and E. Kirk 657
The locations of the dash line curves are only approximately exact. The correct curve may in each case be somewhat to the right or left of that given. The reason for the lack of more cer- tainty is that the only data available for these curves are the titra- tion end-points reported by Sorensen and Linden&em-Lang for amino acids in formaldehyde and acetone solutions. Near the end-points the curves are flat, and interpolations are consequently
Fra. 1. Titration curve of glycine. Water solution data from Harris (1923-24). Formaldehyde curve estimated from end-points at pH 9 to 10 given by &rensen (1907). Acetone curve estimated from titration results of Linderstrem-Lang.
inexact. If the pH values at the mid-points of each curve in these solutions were available the locations could be made accurately, but such data are not yet available. The end-point data never- theless serve to locate the curves with sufficient accuracy to indi- cate the quantitative behavior of the different types of amino acids in the titrations.
by guest on April 7, 2020
http://ww
w.jbc.org/
Dow
nloaded from
658 Amino N in Blood and Urine
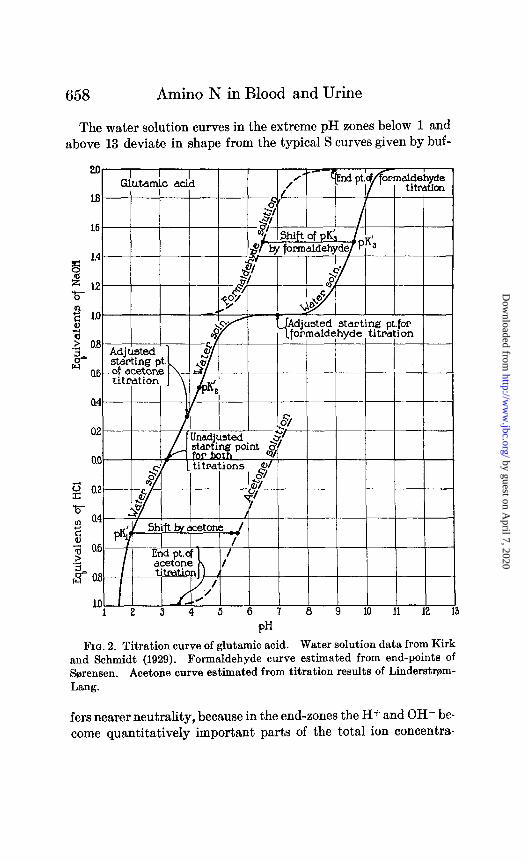
The water solution curves in the extreme pH zones below 1 and above 13 deviate in shape from the typical S curves given by buf-
20 I I I Glutamb aci$
/ .’
1 2 3 4 5 6 7 8 9 10 11 12 13
PH
FIG. 2. Titration curve of glutamic acid. Water solution data from Kirk and Schmidt (1929). Formaldehyde curve estimated from end-points of Sa;rensen. Acetone curve estimated from titration results of Linderstram- Lang.
fers nearer neutrality, because in the end-zones the H+ and OH- be- come quantitatively important parts of the total ion concentra-
by guest on April 7, 2020
http://ww
w.jbc.org/
Dow
nloaded from
D. D. Van Slyke and E. Kirk 659
tions. The nature of the effect has been discussed in connection with Equation 30 of Van Slyke’s paper on buffers (1922). In Figs.
4 5 6 7 8 9 10 11 12
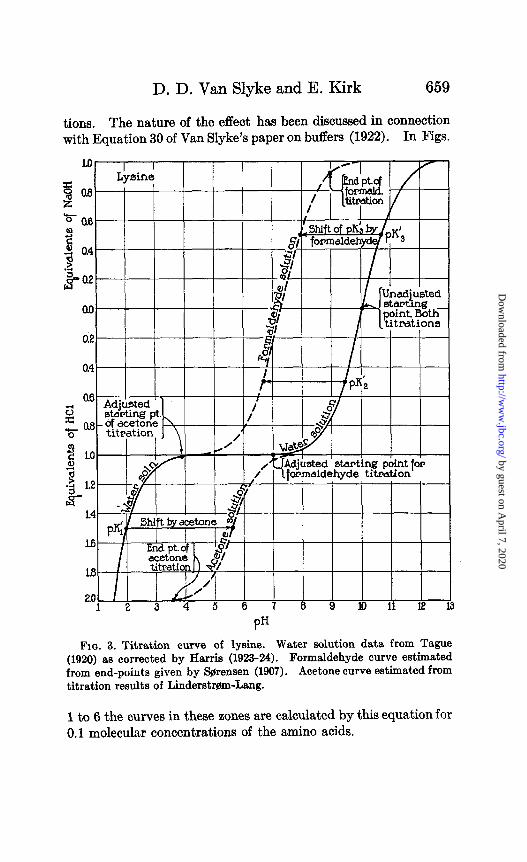
Fla. 3. Titration curve of lysine. Water solution data from Tague (1920) as corrected by Harris (1923-24). Formaldehyde curve estimated from end-points given by S$rensen (1907). Acetone curve estimated from titration results of Liiderstr~m-Lang.
1 to 6 the curves in these zones are calculated by this equation for 0.1 molecular concentrations of the amino acids.
by guest on April 7, 2020
http://ww
w.jbc.org/
Dow
nloaded from
660 Amino N in Blood and Urine
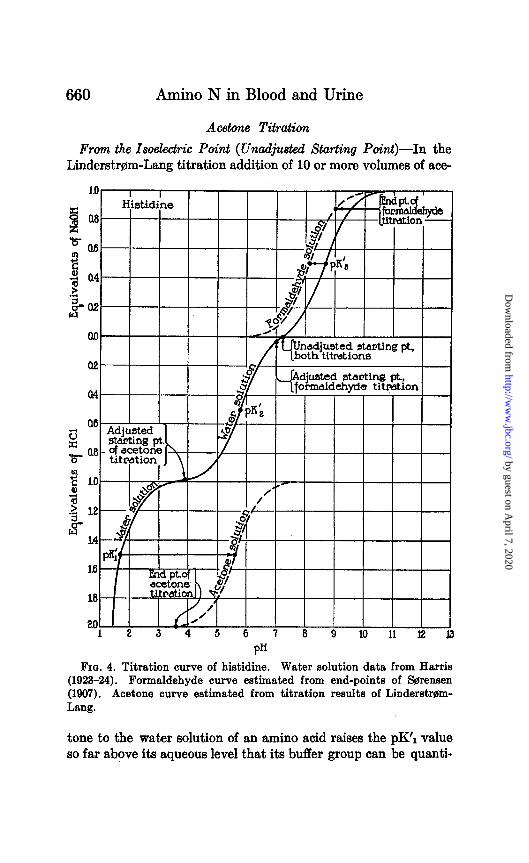
Acetone Titration
From the Isoelectric Point (Unadjusted Starting Point)-In the Linderstr@m-Lang titration addition of 10 or more volumes of ace-
18
20 1 2 3 4 5 6 7 8 9 10 11 12 j3
FIG. 4. Titration curve of histidine. Water solution data from Harris (1923-24). Formaldehyde curve estimated from end-points of S$rensen (1907). Acetone curve estimated from titration results of Linderstmm- Lang.
tone to the water solution of an amino acid raises the pK’1 value so far above its aqueous level that its buffer group can be quanti-
by guest on April 7, 2020
http://ww
w.jbc.org/
Dow
nloaded from
D. D. Van Slyke and E. Kirk 661
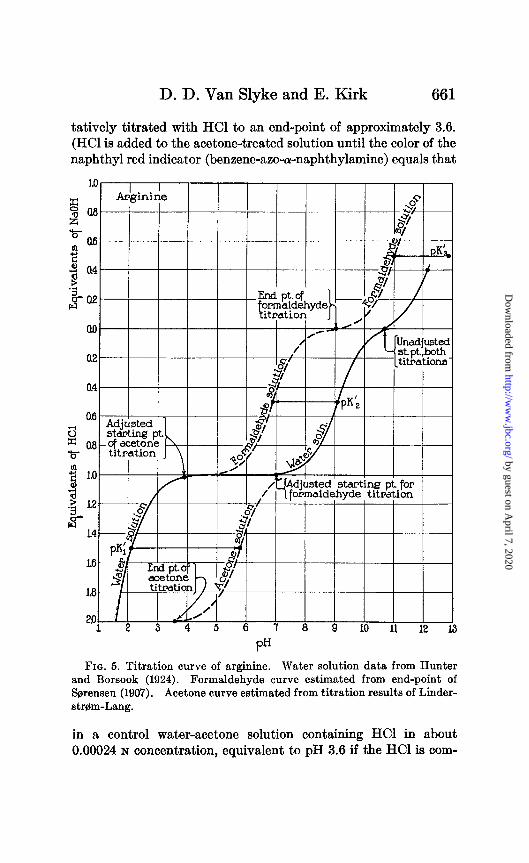
tatively titrated with HCl to an end-point of approximately 3.6. (HCl is added to the acetone-treated solution until the color of the naphthyl red indicator (benzene-azo-a-naphthylamine) equals that
-
ed A pt:both
itrations
FIQ. 5. Titration curve of arginine. Water solution data from Hunter and Borsook (1924). Formaldehyde curve estimated from end-point of &rensen (1907). Acetone curve estimated from titration results of Linder- strgm-Lang.
in a control water-acetone solution containing HCl in about 0.00024 N concentration, equivalent to pH 3.6 if the HCl is com-
by guest on April 7, 2020
http://ww
w.jbc.org/
Dow
nloaded from
662 Amino N in Blood and Urine
pletely dissociated.) This procedure was shown to yield theoret- ical results with pure amino acids when no preliminary adjust- ment of the pH was made, the starting point of the titration being in each case the isoelectric point of the amino acid. Under this condition each monoamino acid neutralizes 1 equivalent of HCl and each diamino acid 2 equivalents (see Figs. 1 to 5, HCl required
/I$$& -Water ~CJIII. - 3 r 8
Iso-electric k/ zone.Ammon
,B
- lactate, no free LA.or NH$
/ s I -.--
2 3 4 5 6 7 8 9 10 11 12
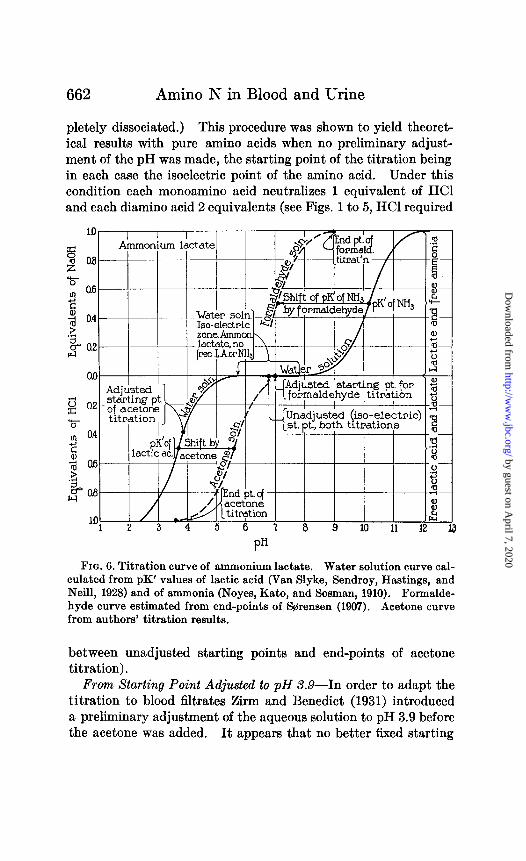
FICJ. 6. Titration curve of ammonium lactate. Water solution curve cal- culated from pK’ values of lactic acid (Van Slyke, Sendroy, Hastings, and Neill, 1928) and of ammonia (Noyes, Kato, and Sosman, 1910). Formalde- hyde curve estimated from end-points of Brensen (1907). Acetone curve from authors’ titration results.
between unadjusted starting points and end-points of acetone titration).
From Starting Point Adjusted to pH X9-In order to adapt the titration to blood filtrates Zirm and Benedict (1931) introduced a preliminary adjustment of the aqueous solution to pH 3.9 before the acetone was added. It appears that no better fixed starting
by guest on April 7, 2020
http://ww
w.jbc.org/
Dow
nloaded from
D. D. Van Slyke and E. Kirk 663
point for the titration could have been chosen. It is the one point on the curves, not only of the monoaminomonocarboxylic acids (Fig. l), but also of the diamino acids (Figs. 3 to 5) from which in every case an exact, or almost exact, equivalent of HCI is required to react completely with the first buffer group. After acetone addi- tion each amino acid of these two classes requires 1 equivalent of HCl per mol for titration, the difference between mono- and di- amino acids being eliminated by the preliminary pH adjustment. In the case of the dicarboxylic acids, exemplified by glutamic acid in Fig. 2, the adjustment is not quite so fortunate. The pH 3.9 point falls at a point on the middle curve which is reached by neu- tralizing from 0.3 to 0.5 of the second buffer (carboxyl) group with added alkali. Consequently the amount of HCI required after acetone addition to titrate back this alkali (0.3 equivalent in the case of glutamic acid) is added to the 1 equivalent required for the lowest group. To obtain an approximate mean titration value of 1 equivalent of HCl for each amino acid in a mixture of all those derived from proteins, the starting point used by Zirm and Bene- dict seems nevertheless to be the best that could be chosen.
Its necessary use, however, exposes the method to error by par- tial inclusion of any non-amino organic acids that may be present in the mixtures titrated. The addition of acetone shifts upwards the pK’ values of such acids so far that they become neutral to naphthyl red (see experimental part of this paper for demonstra- tion with lactic and acetic acids). The carboxyl groups are af- fected by acetone in the same manner as the first buffer groups of the amino acids (a fact which again makes it easy to believe with Bjerrum that the first buffer group is the carboxyl). If to a water solution of an organic acid, such as lactic, enough alkali is added to raise the pH to 3.9, and then acetone is added and HCl titration carried out as in Linderstrom-Lang’s determination, an amount of HCl is used equivalent to the alkali added in the preliminary adjustment. Therefore non-amino organic acids titrate more or less completely as amino acids by the Zirm and Benedict technique, the extent to which they thus titrate being measured by the amount of alkali required to bring each one to the pH 3.9 of the starting point. The fraction of an equivalent of alkali bound by any buffer acid at pH 3.9 can be calculated from the pK’ by Henderson’s equation (see Henderson’s graph in Fig. 9 of Van Slyke (1922), or
by guest on April 7, 2020
http://ww
w.jbc.org/
Dow
nloaded from
664 Amino N in Blood and Urine
in Fig. 90, p. 893, of Peters and Van Slyke (1931) ). Thus by calcu- lation acetic and hydroxybutyric acids, with pK’ about 4.7 each, bind 0.14 equivalent of alkali; acetoacetic acid with pK’ of 3.8 (Henderson and Spiro, 1909) binds 0.56 equivalent; and lactic acid with pK’ of about 3.7 (Van Slyke, Sendroy, Hastings, and Neill, 1928) binds 0.62 equivalent. Therefore, if these organic acids are present, they will be included as amino acids in the Zirm and Benedict titration to the extent of approximately 12, 14, 56, and 62 per cent respectively of their molar concentra- tions. Experimental results in this paper with lactic and acetic acids accord with these calculations.
In the dicarboxylic amino acids (Fig. 2) the second carboxyl group of each behaves in the same manner as an added organic acid. In these three amino acids, glutamic, hydroxyglutamic, and aspartic, the second carboxyl group has pK’ values given respec- tively as 4.2,4.2, and 3.96 (Kirk and Schmidt, 1929; Hopfield et al., 1920). They therefore bind at pH 3.9 approximately 0.33, 0.33, and 0.46 equivalents of alkali, and will theoretically require in the acetone titration by Zirm and Benedict’s technique 1.33, 1.33, and 1.46 equivalents of HCl respectively (for behavior of glutamic acid see Fig. 2). Experimentally the writers have obtained 1.36 ar.d 1.5 equivalents for glutamic and aspartic acids. Because of the strong buffer effects of both at pH 3.9 the preliminary adjust- ment to this point does not take a sharply defined amount of alkali, and the difference between the results obtained and those theoretically calculated is within the limit of error of the former.
The effects of Zirm and Benedict’s insertion of a preliminary adjustment to pH 3.9 before the acetone titration may be sum- marizcd as follows: (1) The titration of monoaminomonocarboxylic acids is unaffected; (2) the diamino acids titrate with 1 instead of 2 equivalents of HCI each; (3) the dicarboxylic acids titrate with 1.3 to 1.5 instead of 1 equivalent of HCl; (4) non-amino organic acids are included in t.he titration to an extent measured by the amount of alkali which they bind at pH 3.9. This exceeds 0.5 equivalent per mol in the case of acids as strong as lactic and aceto- acetic. It is evident that the Zirm and Benedict application of the acetone titration is valid for amino acids only in the absence of significant amounts of other organic acids.
Of sub&ances other than amino and organic a.cids, Linderstrgm-
by guest on April 7, 2020
http://ww
w.jbc.org/
Dow
nloaded from
D. D. Van Slyke and E. Kirk 665
Lang showed that about 1 per cent of urea nitrogen is measured as amino acid nitrogen in the acetone titration. Ammonium chloride and sulfate are not included, and do not interfere. The titration curve of ammonia is at so much higher a pH range than that of the groups included in the acetone titration that the latter is not affected (see Fig. 6).
S$rensen’s Formaldehyde Titration
From the Isoelectric Point (Unadjusted Starting Point)-The theory of this titration has already been discussed, and the results with the different types of amino acids and ammonia can be de- duced from Figs. 1 to 6. Although it appears to be the basicity of the NH2 or NH group that is really affected by formaldehyde in each case, yet the location and behavior of the different buffer groups is such that the average amount of alkali used in the titra- tion, when its starting point is the isoelectric point of the amino acid, is more nearly 1 equivalent for each carboxyl group than 1 for each basic nitrogen. Thus, in the dicarboxylic acids (Fig. 2) the extra carboxyl group (with PK’~) neutralizes, independently of the actionof formaldehyde, 1 equivalent of NaOH in the titration. To this is then added another equivalent, utilized after formalde- hyde addition by t,he uppermost buffer group (presumably the NHs), so that the total alkali required is 2 equivalents. In the three diamino acids, for reasons most easily deduced from Figs. 3 to 5, relations are such that 1 equivalent of alkali is used permol, except in the case of arginine, where none is used. Except for arginine, there- fore, in the formaldehyde titration with unadjusted starting points approximately 1 equivalent of alkali is used for each amino acid carboxyl group present.
Ammonia and amines in the free state are, after treatment with formaldehyde, so nearly neutral to phenolphthalein that they are practically without effect on the titration.
From Starting Point Adjusted to pH r-This preliminary adjust- ment was introduced by Henriques (1909) for urine titrations and by Northrop (1926) for biological fluids in general. Such adjust- ment has different effects on the different types of amino acids as follows:
The monoaminomonocarboxylic acids (Fig. 1) are unaffected. Their isoelectric zones cover the pH range 4 to 7 (Harris, 1923-24;
by guest on April 7, 2020
http://ww
w.jbc.org/
Dow
nloaded from
666 Amino N in Blood and Urine
Kirk and Schmidt, 1929), so that the amount of acid or alkali required to adjust this type of amino acid to pH 7 is practically negligible.
The dicarbozylic acids (Fig. 2) titrate with 1 instead of 2 equiva- lents of alkali. The PK’~ value of each of these amino acids is about 4. Consequently, to bring its water solution to pH 7 requires addition of a complete equivalent of alkali. The upper- most buffer group (PK’~ = 9 - 10) then behaves, after formalde- hyde addition, exactly like the upper buffer group of a monocar- boxylic amino acid, and only 1 equivalent of alkali is used in the final titration.
In the diamino acids, lysine and arginine, adjustment to pH 7 requires the addition of 1 equivalent of HCl (Figs. 3 and 5), and therefore increases by 1 equivalent the amount of alkali required in the final titration. Histidine (Fig. 4) has an isoelectric point at practically pH 7, so that it acts, either with or without preliminary adjustment, like a monoamino acid, and requires 1 equivalent of alkali in the titration in either case.
Aliphatic amines of the types RNHz and R2NH, when brought to pH 7 form salts of the types RNHz.HC1 and RzNH.HC1. On subsequent formaldehyde addition their basicities are so weakened (pK’ values diminished) that they set free the HCl for titration. Ammonia behaves in a similar way, with formation of tetramethylene amine (Fig. 6).
The effect of preliminary neutralization of an amino acid mixture on the results of the formaldehyde titration may be summarized by stating that such neutralization changes the titration from an approximate measure of the carboxyl groups to an approximate measure of the primary NH2 groups plus the NH groups of the proline and oxyproline, together with any ammonia and free amines that may be present.
The results are not sharply stoichiometric in all cases. In pro- line, oxyproline, and histidine the shift of the pK’ of the upper buffer group by formaldehyde appears to be not so great as in other amino acids. Consequently, when the titration is carried out with pH 9 as end-point, the results with proline and oxyproline are only about 80 per cent quantitative, and with histidine about 88 per cent (Serensen, 1907; Iodidi, 1918). In tyrosine, on theother hand, the amount of alkali required is a few per cent above 1 equivalent, because the phenol hydroxyl neutralizes a little alkali at pH 9.
by guest on April 7, 2020
http://ww
w.jbc.org/
Dow
nloaded from
D. D. Van Slyke and E. Kirk
The Folin (19.22, a, b) Calorimetric Method-A colored product is formed by reaction of the amino acids with sodium naphthoqui- none-psulfonate, and the intensity of the color serves as a measure of the concentration of amino acid. The colored compounds ap- pear not to have been isolated, nor the reaction identified by which they are formed, but the reaction appears to be with the amino groups. Ammonia is stated by Folin to be an interfering substance. In determinability of the nitrogen of the individual amino acids the method appears to approximate the formaldehyde titration, but to be somewhat less sharply quantitative.
Gasometric Method (Van Slyke, 1911,19lW, 1929)
The amino acids react with nitrous acid, RNHz + HNOz = Nz + ROH + HzO, and the N, set free is measured. In the 3 to 4 minutes time required for complete reaction by the a-amino acids, ammonia reacts to the extent of about 25 per cent and urea to 7 per cent of its nitrogen. Hence both these substances must be removed if present in interfering amounts.
Summary of Results Yielded by Diferent Methods with Different Types of Amino Acids
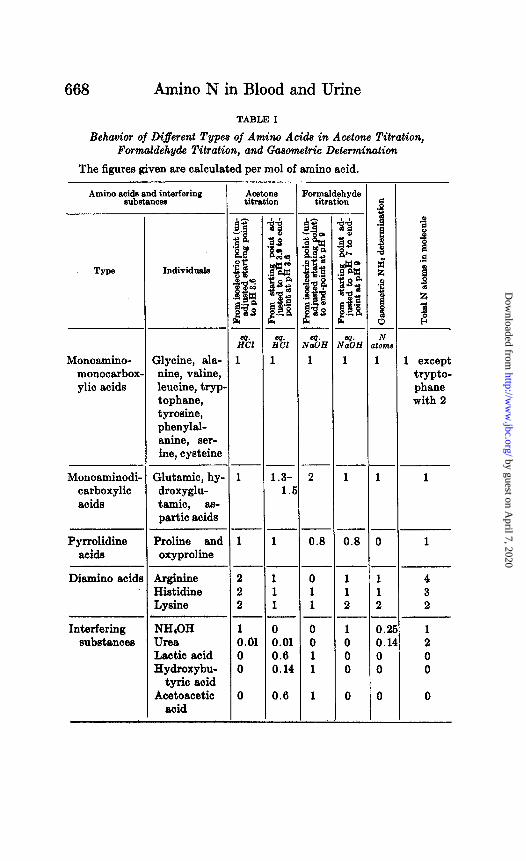
From the summary given in Table I it appears t>hat the two ti- trations, when used with adjusted end-points, give approximately the same results with all the amino acids except the following: The three dicarboxylic and the two pyrrolidine acids, each meas- ures only about 80 per cent as much by the formaldehyde as by the acetone titration. Lysine, on the other hand, measures 200 per cent as much by the formaldehyde as by the acetone titration. It appears that in mixtures of the amino acids such as are likely to result from breakdown of proteins no great difference is to be ex- pected from the results by the two methods. The 100 per cent difference of lysine in one direction would be more or less balanced by the 20 per cent differences of 5 other amino acids in the opposite direction.
The gasometric method gives approximately the same results as the formaldehyde titration, except that proline and oxyproline give zero reaction with t,he gasometric reagents. One may there- fore expect the .,ga,sometric method to g@e results, mar&dly dif- .._ _ ferent fro& those 6i the titrations only when proline and oxypro- line make an important part of the amino acid mixture. They do
by guest on April 7, 2020
http://ww
w.jbc.org/
Dow
nloaded from
668 Amino N in Blood and Urine
TABLE! I
Behavior of Different Types of Amino Acids in Acetone Titration, Formaldehyde Titration, and Gasometric Determination
The figures given are calculated per mol of amino acid.
Amino acids and interfering substances
Type Individuals
Monoamino- monocarbox ylic acids
Glycine, ala- nine, valine, leucine, tryp tophane, tyrosine, phenylal- anine, ser- ine, cysteine
Monoaminodi carboxylic acids
Glutamic, hy- droxyglu- tamic, as- partic acids
Pyrrolidine Praline and acids oxyproline
Diamino acid1
Interfering substances
Argiuiue Histidine Lysine
NH,OH Urea Lactic acid Hydroxybu-
tyric acid Acetoacetic
acid
AO&Xle titmtion
I% 1
2 2 2
1 0.01 0 0
0
1 1 1
0 0.01 0.6 0.14
0.0
~ommldehyde titration
2
0.8
4%
1
1
0.8
1 1 2
- .j 4 ii * z 3 l - N
tom
1
-
1
-
0
-
1 1 2 - 0.2 0.1 0 0
0
-
1 except trypto- phane with 2
1
1
by guest on April 7, 2020
http://ww
w.jbc.org/
Dow
nloaded from
D. D. Van Slyke and E. Kirk
so in the hydrolytic products of gelatin, and it will be seen later (Table V) that after gelatin feeding the increased amino acid excre- tion measured gasometrically is definitely less than that measured by the formaldehyde titration.
EXPERIMENTAL
Behavior of Lactic and Acetic Acids in Acetone Titration
Standards-In the experiments here described Zirm and Bene- dict’s Standards I and II are used.
Standard I is made by diluting 1 cc. of 0.025 N HCl to 200 cc. with water. 2 cc. of this solution are mixed with 4 drops of a 0.1 per cent alcoholic solution of naphthyl red. The HCl concentra- tion is 0.000125 N, and the pH therefore approximately 3.9. When the preliminary adjustment of the unknown is nearly finished to the color of this standard, the latter is diluted by adding enough of the 0.000125 N HCl to bring its volume up to that of the unknown.
Standard II is prepared by mixing 2 cc. of water, 0.3 cc. of 0.025 N HCI, 4 drops of 0.1 per cent naphthyl red solution, and 30 cc. of acetone. The pH is 3.6 if the activity coeflicient of the Hf ions is unity. The color, however, because of the effect of the acetone on the pK’ of the indicator, is that of a water solution of pH about 4.8.
Lactic Acid Titration without Preliminary pH Adjustment-To 2 cc. of 0.1 N lactic acid were added 4 drops of naphthyl red. The solution assumed the deep red of a markedly acid reaction. Then 30 cc. of acetone were added, and the color changed to the yellow which the indicator assumes in neutral or alkaline water solutions. To change to the slightly acid color of Standard II, 0.08 cc. of 0.1 N HCl was required. This amount is, within the limit of titration error, equivalent to the 0.3 cc. of 0.025 N HCl used in preparing Standard II. The lactic acid, in the presence of the acetone, therefore behaved as a neutral substance to the indicator.
Lactic Acid, with Preliminary pH Adjustment to S.9-To 2 cc. of 0.1 N lactic acid 4 drops of naphthyl red were added, then 0.1 N
sodium hydroxide until the color was that of Standard I. The amount of 0.1 N alkali required was 1.2 f 0.1 cc. in repetitions of the experiment. The preliminary end-point was not sharp, be- cause lactic acid is a good buffer at this pH. To the solution thus
by guest on April 7, 2020
http://ww
w.jbc.org/
Dow
nloaded from
670 Amino N in Blood and Urine
titrated to pH 3.9,30 cc. of acetone were added. The color changed to the clear alkaline yellow. Alcoholic 0.1 N HCI was then added until the color equaled that of Standard II. The amount re- quired, corrected for the free HCl in Standard II, was 1.2 f 0.1 cc., equivalent to 60 f 5 per cent of the lactic acid present. In the discussion of the principle of the acetone titration we have cal- culated that the amount titrated in this method would be 62 per cent.
Acetic Acid without Preliminary pH Adjustment-This behaved precisely as the lactic acid. The acidity of the carboxyl group towards the indicator used was depressed to zero by addition of acetone.
Acetic Acid with Preliminary pH Adjustment-2 cc. portions of 0.1 N acetic acid were treated like the lactic acid in the correspond- ing experiment. A volume of 0.3 f 0.02 cc. of 0.1 N sodium hy- droxide was taken to bring the acetic acid to the color of Standard I, and the same volume of 0.1 N alcoholic HCl, within the limit of titration end-point error, was required after acetone addition to titrate back to the color of Standard II. An average of 0.15 cc. equivalent of 0.1 N hydrochloric acid was therefore used for each mol of acetic acid, approximating the 0.14 equivalent calculated in the discussion of the principle of the acetone titration.
Blood and Urine Analyses
The methods were applied as described below. It will be noted that in preparing the blood filtrates colloidal iron is used for the two titrations and the gasometric analysis, while tungstic acid is used in preparing the filtrate for the calorimetric determination, in order to adhere to Folin’s conditions. Hiller and Van Slyke (1922), however, have found that when a mixture of amino acids from hydrolyzed protein was added to blood the added amino nitrogen could be quantitatively recovered in filtrates prepared by either method.
Acetone Titration. Blood-The Linderstdm-Lang method was applied to blood filtrates as described by Zirm and Benedict (1931)) except that in preparing the blood filtrates we used less colloidal iron than the latter authors.
5 cc. of whole blood, without addition of anticoagulants, were diluted with 35 cc. of distilled water and heated to boiling in an
by guest on April 7, 2020
http://ww
w.jbc.org/
Dow
nloaded from
D. D. Van Slyke and E. Kirk 671
Erlenmeyer flask. 1 CC. of a 10 per cent solution of “colloidal iron oxide” was added, a few drops at a time, and the mixture was shaken after each addition. The clear supernatant fluid separated readily, and showed no protein when tested with sulfosalicylic acid. The mixture was transferred to a Pyrex tube, made up with boiling water to a volume of 52 cc. ( = 50 cc. at 20”), and immediately filtered. The filtrate was cooled to room temperature, and 15 cc. aliquots were concentrated to dryness on the steam bath. Each residue was redissolved in 2 cc. of distilled water and the pH adjusted as de- scribed by Zirm and Benedict, by adding 0.025 N alcoholic HCl until the color changed to that of Standard I. Then after addition of 30 cc. of acetone, the solution was titrated by adding more 0.025 N alcoholic HCl till the color became that of Standard II (the standards are described in the first paragraph under “Experi- mental”). As indicator 4 drops of 0.1 per cent alcoholic naphthyl red solution were used, in each standard and in the blood filtrate titrated. A Bang microburette was used both in the preliminary pH adjustment and in the titration. From the HCl used in the titration the amino nitrogen content of the blood is calculated.
Mg. amino N in sample = 14 X 0.025 X (A - 0.3) “ N per 100 cc. blood = 23.3 (A - 0.3)
A represents the cc. of 0.025 N hydrochloric acid used in the final titration. The correction of 0.3 cc. is made for this amount of acid added to the standard to which the color of the titrated solution is brought.
An error of 0.01 cc. in the titration causes an error of 0.2 mg. of amino nitrogen per 100 cc. of blood in the result, and this represents the constancy with which titrations can usually be duplicated in a blood analysis.
Fomaldehyde Titration. Blood-The micro form of Sorensen titration described by Northrop (1926) was used. The tungstic acid filtrate did not prove suitable for it, but the colloidal iron filtrate, prepared as described above, was satisfactory.
From each blood four 15 cc. portions of this filtrate, each equiva- lent to 1.5 cc. of blood, were concentrated to dryness and the resi-
dues were each redissolved in 2 cc. of water. The standard colored solutions with neutral red and phenolphthalein for the starting point (pH about 7) and end-point (pH about 9) were prepared by
by guest on April 7, 2020
http://ww
w.jbc.org/
Dow
nloaded from
672 Amino N in Blood and Urine
Northrop’s technique from two of these portions of blood filtrate, so that any preformed color in the filtrate was compensated. The titrations were carried out in duplicate on the other two portions a,s described by Northrop, except that for the 2 cc. portions of solu- tion 0.4 as much of each reagent was used as directed by Northrop for 5 cc. portions. From the volume of 0.01 N hydroxide used a correction was subtracted for the volume required to neutralize the amount of formaldehyde added. The calculation is
Amino N in sample = O.lU “ “ per 100 cc. blood = 9.34A
A represents the corrected cc. of 0.01 N alkali used in the final titration.
The titra,tion error does not appear to exceed 0.02 cc. of 0.01 N
alkali, equivalent to 0.2 mg. of amino N per 100 cc. of blood. Formaldehyde Titration of Urine. Henriques’ (1909) Method-
Henriques’ application of the Sorensen method was slightly modi- fied to fit it to albuminous urines, and the ammonia was removed by vacuum distillation, instead of being determined and corrected for.
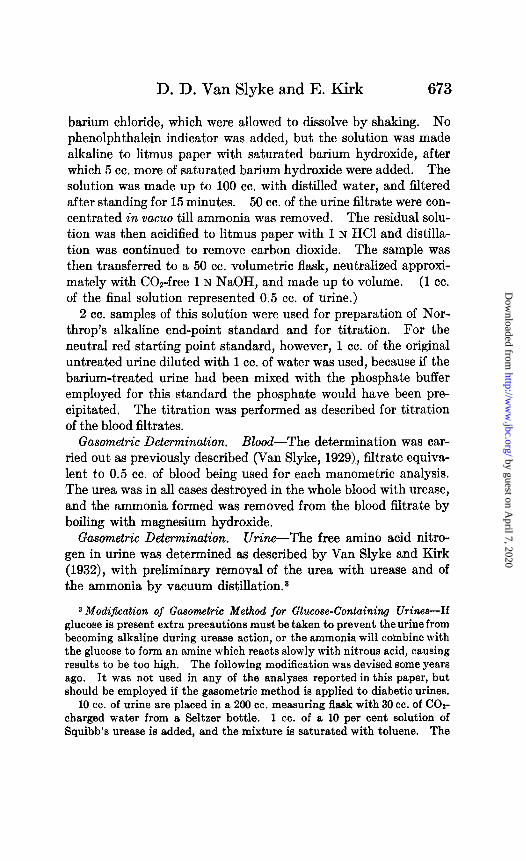
The proteins of nephritic urine were precipitated by heating on a steam bath after addition of 5 drops of 10 per cent acetic acid per 50 cc. of urine. The sample was then washed into a volume- tric flask, phenolphthalein was added, and the urine phosphates were precipitated by addition of barium chloride in substance, followed by barium hydroxide sufficient to render the urine alkaline to the phenolphthalein. The mixture was then made up to volume with distilled water and filtered. A known volume of the alkaline filtrate was concentrated in vacua to remove the ammonia, and was then acidified with hydrochloric acid and transferred to an Erlen- meyer flask by means of COTfree water. After neutralization to sensitive litmus paper (first end-point) freshly prepared neutral formaldehyde solution was added, and the solution was titrated with 0.2 N barium hydroxide till it attained the full red color of an alkaline standard.
Formaldehyde Titration of Urine (Northrop)-The procedure for removal of phosphate and carbonate was essentially the same as used in preparation of urine samples for the Henriques titration. To 50 cc. of urine in a 100 cc. volumetric flask were added 2 gm. of
by guest on April 7, 2020
http://ww
w.jbc.org/
Dow
nloaded from
D. D. Van Slyke and E. Kirk 673
barium chloride, which were allowed to dissolve by shaking. No phenolphthalein indicator was added, but the solution was made alkaline to litmus paper with saturated barium hydroxide, after which 5 cc. more of saturated barium hydroxide were added. The solution was made up to 100 cc. with distilled water, and filtered after standing for 15 minutes. 50 cc. of the urine filtrate were con- centrated in vacua till ammonia was removed. The residual solu- tion was then acidified to litmus paper with 1 N HCl and distilla- tion was continued to remove carbon dioxide. The sample was then transferred to a 50 cc. volumetric flask, neutralized approxi- mately with COz-free 1 N NaOH, and made up to volume. (1 cc. of the final solution represented 0.5 cc. of urine.)
2 cc. samples of this solution were used for preparation of Nor- throp’s alkaline end-point standard and for titration. For the neutral red starting point standard, however, 1 cc. of the original untreated urine diluted with 1 cc. of water was used, because if the barium-treated urine had been mixed with the phosphate buffer employed for this standard the phosphate would have been pre- cipitated. The titration was performed as described for titration of the blood filtrates.
Gasometric Determination. Blood-The determination was car- ried out as previously described (Van Slyke, 1929), filtrate equiva- lent to 0.5 cc. of blood being used for each manometric analysis. The urea was in all cases destroyed in the whole blood wit,h urease, and the ammonia formed was removed from the blood filtrate by boiling with magnesium hydroxide.
Gasometric Determination. Urine-The free amino acid nitro- gen in urine was determined as described by Van Slyke and Kirk (1932), with preliminary removal of the urea with urease and of the ammonia by vacuum distillation.s
3 Modification of Gasometric Method for Glucose-Containing Urines-If glucose is present extra precautions must be taken to prevent theurine from becoming alkaline during urease action, or the ammonia will combine with the glucose to form an amine which reacts slowly with nitrous acid, causing results to be too high. The following modification was devised some years ago. It was not used in any of the analyses reported in this paper, but should be employed if the gasometric method is applied to diabetic urines.
10 cc. of urine are placed in a 200 cc. measuring flask with 30 cc. of COP charged water from a Seltzer bottle. 1 cc. of a 10 per cent solution of Squibb’s urease is added, and the mixture is saturated with toluene. The
by guest on April 7, 2020
http://ww
w.jbc.org/
Dow
nloaded from
674 Amino N in Blood and Urine
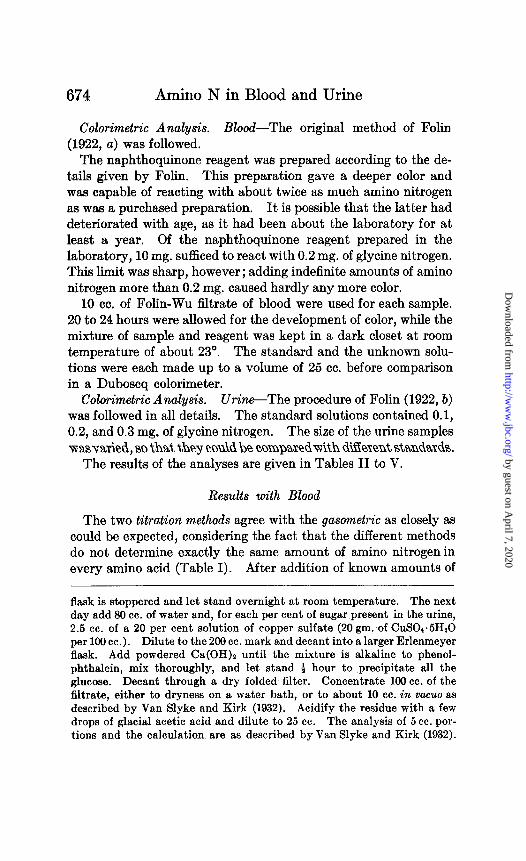
Calorimetric Analysis. Blood-The original method of Folin (1922, a) was followed.
The naphthoquinone reagent was prepared according to the de- tails given by Folin. This preparation gave a deeper color and was capable of reacting with about twice as much amino nitrogen as was a purchased preparation. It is possible that the latter had deteriorated with age, as it had been about the laboratory for at least a year. Of the naphthoquinone reagent prepared in the laboratory, 10 mg. sufficed to react with 0.2 mg. of glycine nitrogen. This limit was sharp, however; adding indefinite amounts of amino nitrogen more than 0.2 mg. caused hardly any more color.
10 cc. of Folin-Wu filtrate of blood were used for each sample. 20 to 24 hours were allowed for the development of color, while the mixture of sample and reagent was kept in a dark closet at room temperature of about 23”. The standard and the unknown solu- tions were each made up to a volume of 25 cc. before comparison in a Duboscq calorimeter.
Calorimetric Analysis. Urine-The procedure of Folin (1922, b) was followed in all details. The standard solutions contained 0.1, 0.2, and 0.3 mg. of glycine nitrogen. The size of the urine samples waRva+d, 90 that they couM be comparedwith different standards.
The results of the analyses are given in Tables II to V.
Results with Blood
The two titration methods agree with the gasometric as closely as could be expected, considering the fact that the different methods do not determine exactly the same amount of amino nitrogen in every amino acid (Table I). After addition of known amounts of
flask is stoppered and let stand overnight at room temperature. The next day add SO cc. of water and, for each per cent of sugar present in the urine, 2.5 cc. of a 20 per cent solution of copper sulfate (20 gm. of CuSO4.5HgO per 100 cc.). Dilute to the 200 cc. mark and decant into a larger Erlenmeyer flask. Add powdered Ca(OH)s until the mixture is alkaline to phenol- phthalein, mix thoroughly, and let stand + hour to precipitate all the glucose. Decant through a dry folded filter. Concentrate 100 cc. of the filtrate, either to dryness on a water bath, or to about 10 cc. in uacuo as described by Van Slyke and Kirk (1932). Acidify the residue with a few drops of glacial acetic acid and dilute to 25 cc. The analysis of 5 cc. por- tions and the calculation are as described by Van Slyke and Kirk (1932).
by guest on April 7, 2020
http://ww
w.jbc.org/
Dow
nloaded from
D. D. Van Slyke and E. Kirk 675
amino acid to blood quantitative recovery was obtained, both gasometrically and by both titrations (Table III).
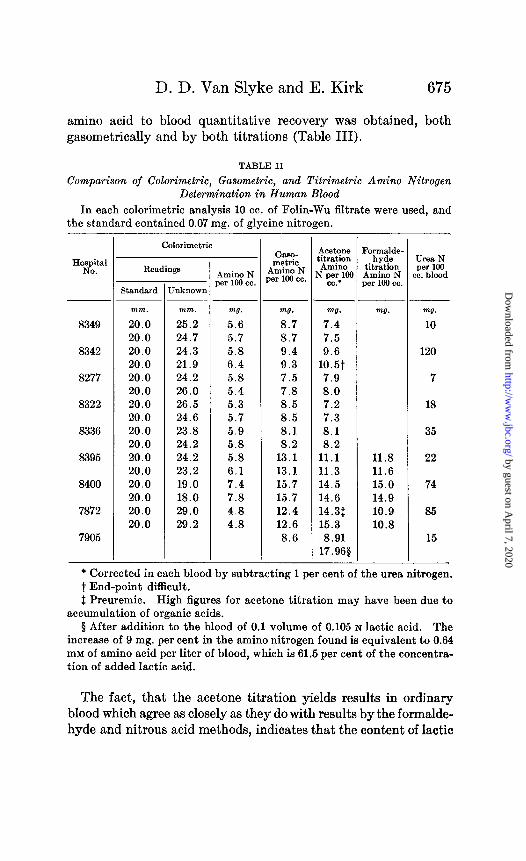
TABLE II
Comparison of Calorimetric, Gasometric, and Titrimetric Amino Nitrogen Determination in Human Blood
In each calorimetric analysis 10 cc. of Folin-Wu filtrate were used, and the standard contained 0.07 mg. of glycine nitrogen.
H”zJ?’ Readings
8349
8342
8277
8322
8336
8395
8400
7872
7905
Calorimetric
Jnknown Standard
Amino N 381‘ loo cc. 1
-
mm. mm. m7.
20.0 25.2 5.6 20.0 24.7 5.7 20.0 24.3 5.8 20.0 21.9 6.4 20.0 24.2 5.8 20.0 26.0 5.4 20.0 26.5 5.3 20.0 24.6 5.7 20.0 23.8 5.9 20.0 24.2 5.8 20.0 24.2 5.8 20.0 23.2 6.1 20.0 19.0 7.4 20.0 18.0 7.8 20.0 29.0 4.8 20.0 29.2 4.8
1
-
GasO- metric
Amino N xr loo cc.
Tl.
8.7 8.7 9.4 9.3 7.5 7.8 8.5 8.5 8.1 8.2
13.1 13.1 15.7 15.7 12.4 12.6 8.6
-
AC&OW3 ;itration Amino
?pXlCM CC.’
7.5 9.6
10.5t 7.9 8.0 7.2 7.3 8.1 8.2
11.1 11.3 14.5 14.6 14.3$ 15.3 8.91
17.968
1
I ,
I
_-
-
?ormJde- hyde
titration Amino N ,cr loo cc.
ml7.
11.8 11.6 15.0 14.9 10.9 10.8
urea N per loo IC. blood
mg. 10
120
7
18
35
22
74
85
15
* Corrected in each blood by subtracting 1 per cent of the urea nitrogen. t End-point difficult. $ Preuremic. High figures for acetone titration may have been due to
accumulation of organic acids. $ After addition to the blood of 0.1 volume of 0.105 N lactic acid. The
increase of 9 mg. per cent in the amino nitrogen found is equivalent to 0.64 mM of amino acid per liter of blood, which is 61.5 per cent of the concentra- tion of added lactic acid.
The fact, that the acetone titration yields results in ordinary blood which agree as closely as they do with results by the formalde- hyde and nitrous acid methods, indicates that the content of lactic
by guest on April 7, 2020
http://ww
w.jbc.org/
Dow
nloaded from
Amino N in Blood and Urine
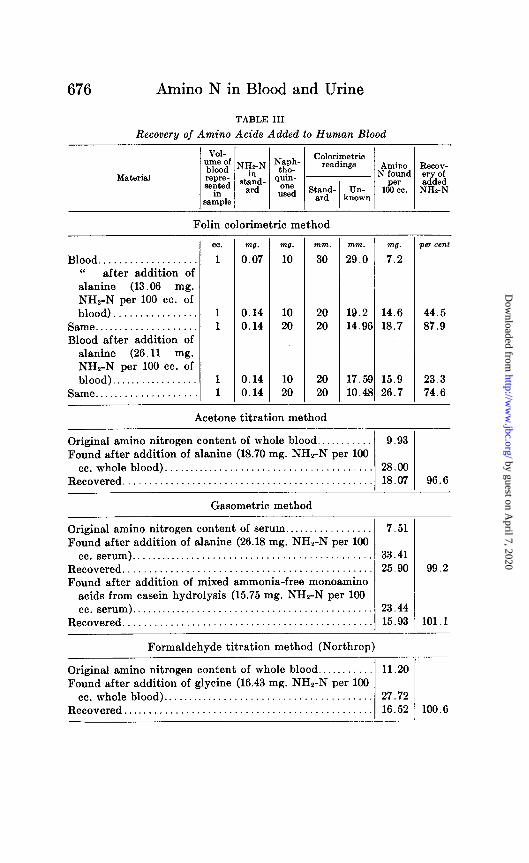
TABLE III
Recovery of Amino Acids Added to Human Blood
Folin calorimetric method
Blood................... after addition of
if anine (13.06 mg. NH2-N per 100 cc. of blood)................
Same. . . . . . . . Blood after addition of
alanine (26.11 mg. NH,-N per 100 cc. of blood). . . . .
Same . . . .
cc.
1
1 1
1 1
ml.
0.07
0.14 0.14
0.14 0.14
m7.
10
10 20
10 20
mm.
30
20 20
20 20
Acetone titration method
mm.
29.0
19.2 14.9f
17.5% 10.42
-
i
) 3 -
TJ.
7.2
-
1 wr cent
14.6 44.5 18.7 87.9
15.9 23.3 26.7 74.6
Original amino nitrogen content of whole blood ........... Found after addition of alanine (18.70 mg. NH,-N per 100
cc.whole blood) ....................................... Recovered ..............................................
9.93
28.00 18.07 96.6
Gasometric method
Original amino nitrogen content of serum.. . . . . . . . 7.51 Found after addition of alanine (26.18 mg. NHZ-N per 100
cc. serum).............................................. 33.41 Recovered............................................... 25.90 Found after addition of mixed ammonia-free monoamino
acids from casein hydrolysis (15.75 mg. NHz-N per 100 cc. serum).............................................. 23.44
Recovered............................................... 15.93
Formaldehyde titration method (Northrop)
99.2
101.1
Original amino nitrogen content of whole blood ........... 11.20 Found after addition of glycine (16.43 mg. NH,-N per 100
cc.whole blood) ........................................ 27.72 Recovered ............................................... 16.52 100.6
by guest on April 7, 2020
http://ww
w.jbc.org/
Dow
nloaded from
D. D. Van Slyke and IX. Kirk 677
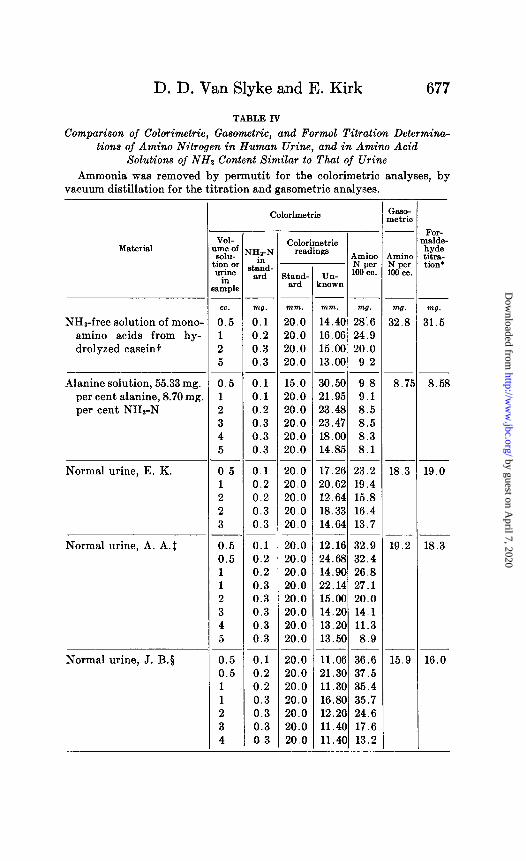
TABLE IV
Comparison of Calorimetric, Gasometric, and Form01 Titration Determina- tions of Amino Nitrogen in Human Urine, and in Amino Acid
Solutions of NH2 Content Similar to That of Urine
Ammonia was removed by permutit for the calorimetric analyses, by vacuum distillation for the titration and gasometric analyses.
-i- ( :aso-
II oetric
-
A rmino i per 00 cc.
w.
32.8
;
-
.-
-
n
,
.-
a.75
- I
-
Calorimetric
IHz-P in
Qand wd
w3.
0.1 0.2 0.3 0.3
0.1 0.1 0.2 0.3 0.3 0.3
0.1 0.2 0.2 0.3 0.3
0.1 0.2 0.2 0.3 0.3 0.3 0.3 0.3
0.1 0.2 0.2 0.3 0.3 0.3 0.3
FOP nalde- hyde titra- tion’
VOI- ,me of SohI-
ion or urine
in Mllple
cc.
0.5 1 2 5
0.5 1 2 3 4 5
0.5 1 2 2 3
0.5 0.5 1 1 2 3 4 5
0.5 0.5 1 1 2 3 4
-
J
Calorimetric readings
Amino - Nper
- Un- 100 cc.
known
mm.
20.0 20.0 20.0 20.0
15.0 20.0 20.0 20.0 20.0 20.0
20.0 20.0 20.0 20.0 20.0
-- -- mm. mg. 14.40 28:6 16.06 24.9 15.00 20.0 13.00 9.2
_- -- 30.50 9.8 21.95 9.1 23.48 8.5 23.47 8.5 18.00 8.3 14.85 8.1
-- -- 17.26 23.2 20.62 19.4 12.64 15.8 18.33 16.4 14.64 13.7
20.0 20.0 20.0 20.0 20.0 20.0 20.0 20.0
12.16 32.9 24.68 32.4 14.90 26.8 22.14 27.1 15.00 20.0 14.20 14.1 13.20 11.3 13.50 8.9 -- 11.06 36.6 21.30 37.5 11.30 35.4
/ 16.80 35.7 / 12.20 24.6 , 11.40 17.6 I 11.40 13.2 -
20.0 20.0 20.0 20.0 20.0 20.0 20.0
Material I
I
8
--
-_
-.
- -
t
- .
--
--
-
mg.
31.5 NH,-free solutron of mono- amino acids from hy- drolyzed caseint
Alanine solution, 55.33 mg. per cent alanine, 8.70 mg per cent NHs-N
18.3
8.58
19.0 Normal urine, E. K.
Normal urine, A. A.1 19.2 18.3
Normal urine, J. B.5 15.9 16.0
by guest on April 7, 2020
http://ww
w.jbc.org/
Dow
nloaded from
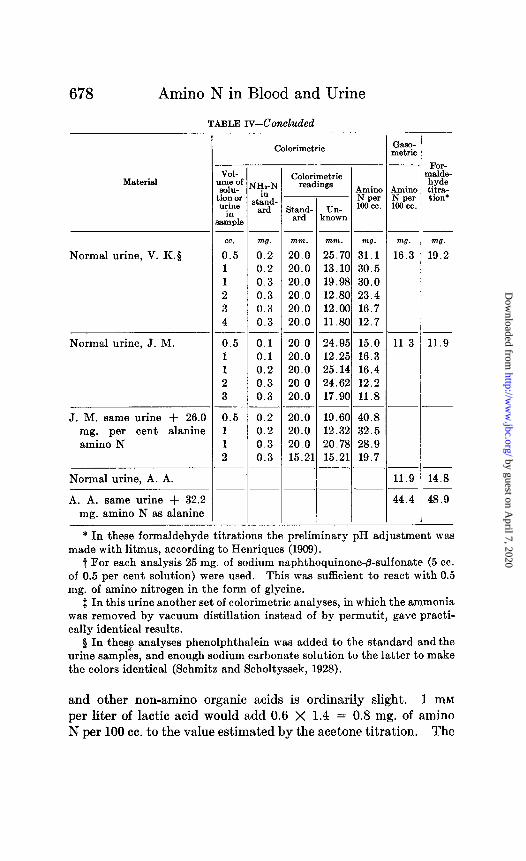
678 Amino N in Blood and Urine
TABLE rv-Concluded
I Calorimetric
netric
VOI- Lnl.3 of SolU- ion o* urine
in ample
cc.
0.5 1 1 2 3 4
0.5 1 1 2 3
0.5 1 1 2
T
Calorimetric readings
Amino J ~ N per
Stand. Un- loocc. j
ard known
mm.
20.0 20.0 20.0 20.0 20.0 20.0
20.0 20.0 20.0 20.0 20.0
_ --
nwn. mg.
25.70 31.1 13.10 30.5 19.98 30.0 12.80 23.4 12.00 16.7 11.80 12.7
_ -- 24.95 15.0 12.25 16.3 25.14 16.4 24.62 12.2 17.90 11.8 -- 19.60 40.8 12.32 32.5 20.78 28.9
1 15.21 19.7 _- --
20.0 20.0 20.0 15.2’
Material NY-N
stand- ard
u
t
8
-
-
m!J.
0.2 0.2 0.3 0.3 0.3 0.3
w?. mg. 16.3 19.2 Normal urine, V. K.8
Normal urine, J. M. 0.1 0.1 0.2 0.3 0.3
11.3 11.9
0.2 0.2 0.3 0.3
J. M. same urine + 26.0 mg. per cent alanine amino N
Normal urine, A. A. 11.9 14.8
A. A. same urine + 32.2 mg. amino N as alanine
44.4 48.9
* In these formaldehyde titrations the preliminary pH adjustment was made with litmus, according to Henriques (1909).
t For each analysis 25 mg. of sodium naphthoquinone-@-sulfonate (5 cc. of 0.5 per cent solution) were used. This was sufficient to react with 0.5 mg. of amino nitrogen in the form of glycine.
$: In this urine another set of calorimetric analyses, in which the ammonia was removed by vacuum distillation instead of by permutit, gave practi- cally identical results.
# In thes? analyses phenolphthalein was added to the standard and the urine samples, and enough sodium carbonate solution to the latter to make the colors identical (Schmitz and Scholtyssek, 1928).
and other non-amino organic acids is ordinarily slight. 1 mM per liter of lactic acid would add 0.6 X 1.4 = 0.8 mg. of amino N per 100 cc. to the value estimated by the acetone titration. The
by guest on April 7, 2020
http://ww
w.jbc.org/
Dow
nloaded from
D. D. Van Slyke and E. Kirk 679
amount of interfering organic acid present in ordinary human blood appears to cause no greater error than this.
With the calorimetric method the amino nitrogen values obtained in whole blood were only from 60 to 80 per cent as great as those by titration or gasometric methods. When sufficient alanine was added to blood to raise the amino nitrogen content to levels such as have been gasometrically observed in uremia (20 to 30 mg. per cent) the increases in amino nitrogen, determined with the usual
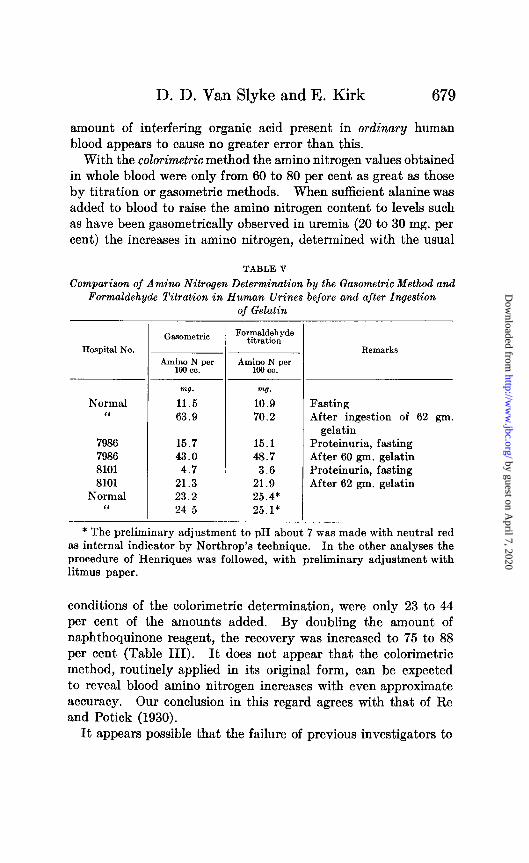
TABLE V
Comparison of Amino Nitrogen Determination by the Gasometric Method and Formaldehyde Titration in Human Urines before and after Ingestion
of Gelatin
Hospital No.
Normal I<
7986 7986 8101 8101
Normal “
-
- Ca.mmetrio
w7. mg.
11.5 10.9 63.9 70.2
15.7 15.1 43.0 48.7
4.7 3.6 21.3 21.9 23.2 25.4* 24.5 25.1*
Formaldehyde titration
Remarks
Fasting After ingestion of 62 gm.
gelatin Proteinuria, fasting After 60 gm. gelatin Proteinuria, fasting After 62 gm. gelatin
* The preliminary adjustment to pH about 7 was made with neutral red as internal indicator by Northrop’s technique. In the other analyses the
procedure of Henriques was followed, with preliminary adjustment with litmus paper.
conditions of the calorimetric determination, were only 23 to 44
per cent of the amounts added. By doubling the amount of napht.hoquinone reagent, the recovery was increased to 75 to 88 per cent (Table III). It does not appear that the calorimetric method, routinely applied in its original form, can be expected to reveal blood amino nitrogen increases with even approximate accuracy. Our conclusion in this regard agrees with that of Re and Potick (1930).
It appears possible that the failure of previous investigators to
by guest on April 7, 2020
http://ww
w.jbc.org/
Dow
nloaded from
680 Amino N in Blood and Urine
note calorimetrically in uremic coma the marked increases in blood amino nitrogen which one of the writers (Kirk) has regularly ob- served by the gasometric method may have been due to the de- ficiency of the calorimetric method. It also appears that absence of amino acidemia reported by the calorimetric method inother conditions cannot be accepted as conclusive.
Results with Urine
The formaldehyde titration and the gasometric method yielded results which agreed with each other as well as could be expected (Tables IV and V). The fact that after gelatin feeding (Table V) the titration indicated somewhat greater increases of amino acid nitrogen excretion than the gasometric method, is presumably due to the exceptional richness of gelatin in proline and oxyproline. These two amino acids are determined in the formaldehyde ti- tration butnotin the gasometric method (Table I). The formalde- hyde titration and gasometric method both yielded accurate re- coveries of amino acids added to urine.
With the calorimetric method, used as applied to urine (Folin, 1922, b), approximately accurate results were obtained with pure alanine solutions when standard and solution analyzed did not differ much (Table IV). With the solution of mixed amino acids from casein, however, wide variations in results (from 9.2 to 28.6 mg. per cent) in the same solution were obtained when the size of the sample was varied, even though in no case did the difference between standard and unknown readings exceed a 1.5: 1 ratio. The smaller the sample, the higher was the result obtained. Urine showed a similar behavior. When alanine was added to urine (bottom of Table IV) erratic results were obtained.
SUMMARY
The similarity of results obtained in urine with the gasometric method and the formaldehyde titration, and in blood by these two methods and the acetone titration, indicate that, when unusual interfering substances are absent, these methods serve as approxi- mate measures of amino acid nitrogen.
The gasometric method and the formaldehyde titration appear to be generally applicable to both blood and urine, normal and abnormal.
by guest on April 7, 2020
http://ww
w.jbc.org/
Dow
nloaded from
D. D. Van Slyke and E. Kirk
The acetone titration has not yet been tried with urine. With blood it appears satisfactory unless there is an accumulation of organic acids. Lactic, acetoacetic, and other organic acids of similar strength require in the Zirm and Benedict application of the acetone titration 0.6 as much HCl per mol, and the weaker hydroxybutyric acid requires 0.14 as much, as do amino acids. Ordinarily the amounts of organic acids in the blood appear in- sufficient to cause serious errors. Accumulations of lactic acid, however, such as occur in severe exercise or anoxia, or of acetoacetic and hydroxybutyric acids such as occur in diabetic acidosis, would invalidate the acetone titration as a measure of the blood amino acids.
The calorimetric method of Folin, when applied to blood or urine in its original form, did not in our hands agree with the other methods, nor did it measure with accuracy amino acids added to either blood or urine.4
Of the two methods capable of general application to blood and urine, the gasometric method, in the micro form applied with the manometric apparatus, proved preferable for blood, with respect both to economy of material and convenience. In the urine, on the other hand, where economy of material is not necessary, and where the gasometric method involves removal of large amounts of urea, the Sorensen-Henriques formaldehyde titration in the form developed by Northrop proved the more convenient.
BIBLIOGRAPHY
Borsook, H., and MacFadyen, D. A., J. Gen. Physiol., 13, 509 (1930). Bjerrum, N., 2. physik. Chem., 104, 147 (1923). Danielson, I. S., J. Biol. Chem., 101, 505 (1933). Folin, O., J. Biol. Chem., 61,377 (1922, a); 61,393 (1922,6). Foreman, F. W., Biochem. J., 14, 451 (1920). Harris, L. J., Proc. Roy. Sot. London, Series B, 96, 440, 500 (1923-24). Henderson, L. J., and Spiro, K., J. Biol. Chem., 6, xxxix (1909). Henriques, V., 2. physiol. Chem., 60, 1 (1909). Hiller, A., and Van Slyke, D. D., J. BioZ. Chem., 63,253 (1922). Hopfield, H., Halstead, J. B., Brennan, M. A., and Acree, S. F., Science, 62,
614 (1920); Chem. Abst., 16, 4237 (1922).
4 Danielson (1933), in a paper from Folin’s laboratory which appears as this goes to press, publishes a modification of the calorimetric method which is stated to be less liable to error.
by guest on April 7, 2020
http://ww
w.jbc.org/
Dow
nloaded from
Amino N in Blood and Urine
Hunter, A., and Borsook, H., Biochem. J., 18,883 (1924). Iodidi, S. L., J. Am. Chem. Sot., 40, 1031 (1918). Kirk, P. L., and Schmidt, C. L. A., J. Biol. Chem., 81,237 (1929). Linderstrem-Lang, K., 2. physiol. Chem., 173, 32 (1928). Northrop, J. H., J. Gen. Physiol., 9, 767 (1926). Noyes, A. A., Kato, Y., and Sosman, R. B., 2. physik. Chem., 73,2 (1910). Peters, J. P., and Van Slyke, D. D., Quantitative clinical chemistry, Balti-
more, 1 (1931). Re, P. M., and Potick, D., Compt. rend. Sot. biol., 103, 1283 (1930). Schiff, H., Ann. Chem., 310, 25 (1899); 319, 59, 287 (1901); 326, 348 (1902). Schmidt, E. G., Arch. Int. Med., 44, 351 (1929). Schmitt, E., and Scholtyssek, H., 2. physiol. Chem., 178, 89 (1928). S@rensen, S. P. L., Compt.-rend. trav. Lab. Curlsberg, 7, 1 (1907). Tague, E., J. Am. Chem. Sot., 42, 173 (1920). Van Slyke, D. D., J. BioZ. Chem., 9,185 (1911); 12,275 (1912); 62,525 (1922);
83,425 (1929). Van Slyke, D. D., and Kirk, E., in Peters, J. P., and Van Slyke, D. D.,
Quantitative clinical chemistry, Baltimore, 2, 926 (1932). Van Slyke, D. D., Sendroy, J., Jr., Hastings, A. B., and Neill, J. M., J.
BioZ. Chem., 78, 789 (1928). Willstatter, R., and Waldschmidt-Leitz, E., Ber. them. Ges., 64,298S (1921). Zirm, K. L., and Benedict, J., Biochem. Z., 243, 312 (1931).
by guest on April 7, 2020
http://ww
w.jbc.org/
Dow
nloaded from
Donald D. Van Slyke and Esben KirkNITROGEN IN BLOOD AND URINE
DETERMINATIONS OF AMINOCOLORIMETRIC, AND TITRIMETRIC
COMPARISON OF GASOMETRIC,
1933, 102:651-682.J. Biol. Chem.
http://www.jbc.org/content/102/2/651.citation
Access the most updated version of this article at
Alerts:
When a correction for this article is posted•
When this article is cited•
alerts to choose from all of JBC's e-mailClick here
tml#ref-list-1
http://www.jbc.org/content/102/2/651.citation.full.haccessed free atThis article cites 0 references, 0 of which can be by guest on A
pril 7, 2020http://w
ww
.jbc.org/D
ownloaded from