Embed Size (px)
Citation preview
1
Citation: Rexer, M.; Hirt, C.: Comparison of free high-resolution digital elevation data sets (ASTER 1 GDEM2, SRTM v2.1/v4.1) and validation against accurate heights from the Australian National 2 Gravity Database; Australian Journal of Earth Sciences, pp 1-15, DOI: 3 10.1080/08120099.2014.884983, 2014. 4
5
Note: This is an Author’s Original Manuscript of an article whose final and definitive form, the Version of Record, has been 6 published in the Australian Journal of Earth Sciences (2014, ©Taylor and Francis), available at : 7 http://dx.doi.org/10.1080/08120099.2014.884983. 8
9
Comparison of free high-resolution digital elevation data sets (ASTER GDEM2, 10
SRTM v2.1/v4.1) and validation against accurate heights from the Australian 11
National Gravity Database 12
13
M. REXER1,2 AND C. HIRT1,2 14
1Western Australian Centre for Geodesy, Curtin University of Technology, GPO Box U1987, Perth, WA 15 6845, Australia 16
2Institute for Astronomical and Physical Geodesy, Technische Universität München, Arcisstrasse 21, D-17 80333 München, Germany 18
E-mail: [email protected] , [email protected] 19
20
Received: 10 Oct 2013; Accepted: 7 Jan 2014: Published Online: 24 Feb 2014 21
22
ABSTRACT 23
Today, several global digital elevation models (DEMs) are freely available on the web. This study 24 compares and evaluates the latest release of the Advanced Spaceborne Thermal Emission 25 Reflectometer DEM (ASTER GDEM2) and two DEMs based on the Shuttle Radar Topography Mission 26 (SRTM) as released by the United States Geological Survey (SRTM3 USGS version 2.1) and by the 27 Consortium for Spatial Information (SRTM CGIAR-CSI version 4.1) over the Australian continent. 28
The comparison generally shows a very good agreement between both SRTM DEMs, however, data 29 voids contained in the USGS model over steep topographic relief are filled in the CGIAR-CSI model. 30 ASTER GDEM2 has a northeast- to southwest-aligned striping error at the 10 m level and shows an 31 average height bias of –5 m relative to SRTM models. The root-mean square (RMS) height error 32 obtained from the differences between ASTER GDEM2 and SRTM over Australia is found to be around 33 9.5 m. An external validation of the models with over 228,000 accurate station heights from the 34 Australian National Gravity Database allows estimating each models’ elevation accuracies over 35 Australia: ASTER GDEM2 ~ 8.5 m, SRTM3 USGS ~ 6 m, SRTM CGIAR-CSI ~ 4.5 m (RMS). In addition, the 36 dependence of the DEM accuracy on terrain type and land cover is analysed. Applying a cross-37 correlation image co-registration technique to 529 1 x 1 degree tiles and 138 2 x 2 degree tiles reveals 38 a mean relative shift of ASTER GDEM2 compared with SRTM of –0.007 and –0.042 arc-seconds in 39 north–south and –0.100 and –0.136 arc-seconds in east–west direction over Australia, respectively. 40
KEYWORDS: digital elevation model, DEM evaluation, ASTER GDEM2, SRTM3 USGS v2.1, SRTM 41 CGIAR-CSI v4.1, Australian National Gravity Database, elevation accuracy, georeferencing 42

2
INTRODUCTION 43
Accurate models of the topography are important from a scientific as well as from a socio-economic 44 point of view. In science, digital elevation models (DEMs) play a crucial role, e.g. for navigation, 45 hydrology, gravity field modelling, geology and other Earth-related disciplines (e.g. Forsberg 1984; 46 Müller-Wohlfeil et al. 1996). A society can benefit from the scientific advances based on widespread, 47 reliable topographic information, e.g. from precise flood prediction and management (McLuckie & 48 NFRAC 2008) or local-scale weather forecasts (Truhetz 2010). Today, elevation data over Australia’s 49 landmass is either available from point-wise terrestrial observation techniques (e.g. conventional 50 levelling or GPS (Global Positioning Sytem)/levelling) or air- or satellite-borne sensors (e.g. RADAR (Farr 51 et al. 2007), LIDAR (Zwally et al. 2002), stereoscopic photogrammetry (Abrams et al. 2002)). The latter 52 techniques are capable of providing height information in terms of homogeneous, equally gridded 53 digital elevation models. Many parts of Australia are rather flat with only about 6% of the landmass 54 exceeding elevations of 600 m; mountainous terrain is only found over few regions of the continent, 55 such as Australia’s eastern highlands and the Great Dividing Range. These circumstances and the fact 56 that a large part of the continent is not or only little vegetated (~ 40%) are beneficial for creating 57 accurate topography models from space- or airborne sensors, as they favour a direct line-of-sight to 58 bare ground. 59
Apart from the Australian national topographic model GEODATA DEM-9S (version 3) (Carroll & Morse 60 1996), a number of open access (global) digital elevation models exist that describe the topography of 61 Australia. Various DEMs over Australian territory have been compared and validated to develop 62 reliable accuracy estimates. Hilton et al. (2003) compared five pre-SRTM-era (Shuttle Radar 63 Topography Mission; Farr et al. 2007) DEMs with the Australian GEODATA DEM-9s (version 1) and 64 validated all models using ERS-1 satellite altimeter-derived topographic heights. More recently Hirt et 65 al. (2010) compared three DEMs, namely ASTER GDEM (version 1), the SRTM DEM release (version 66 4.1) by the Consortium for Spatial Information of the Consultative Group for International Agricultural 67 Research (CGIAR-CSI) and GEODATA DEM-9S (version 3), and evaluated them using 6392 levelling and 68 911 GPS/levelling ground control points. 69
In this study, three DEMs, namely SRTM3 version 2.1 released by United States Geological Survey 70 (USGS), the SRTM model released by CGIAR-CSI (version 4.1) and ASTER GDEM2 (version 2), are 71 compared and evaluated against a large and for DEM-evaluation little-used ground truth data set. The 72 data set contains station heights from the Australian National Gravity Database and provides a much 73 larger set of ground truth points than previously used (e.g. Hirt et al. 2010). Covering various regions 74 of the Australian continent, the data set allows further study of the DEM accuracy as a function of a) 75 terrain type, and b) ground cover. The ground cover model used here is a generalised version of ESA’s 76 (European Space Agency) GlobeCover map (Bontemps et al. 2011), which is reduced to three land cover 77 types. By including CGIAR-CSI in this evaluation, we are able to directly compare our results to the 78 study by Hirt et al. (2010), who evaluate the data over Australian territory. Further, our study provides 79 new information about both SRTM data sets in Australia (e.g. its performance over different types of 80 land cover). The second version of ASTER GDEM is reported to have improved significantly with respect 81 to its predecessor, e.g. in terms of vertical height bias, striping error and voids over Australia that have 82 been filled to some extent (Krieger et al. 2010; Carabajal 2011; Gesh et al. 2011; Tachikawa et al. 83 2011b). We assess whether ASTER GDEM2 can be considered as a serious alternative to the SRTM 84 models over Australia. 85
In this paper all the elevation data used in this study are reviewed. Firstly, the three global DEMs under 86 evaluation are described and results from previous studies on their performance are briefly 87 summarised. Secondly, the ground truth data set (the Australian National Gravity Data Base) is 88 presented and analysed regarding its positioning accuracy. The different models are compared and 89 validated against the ground truth data. The vertical accuracy of the DEMs is assessed as a function 90
3
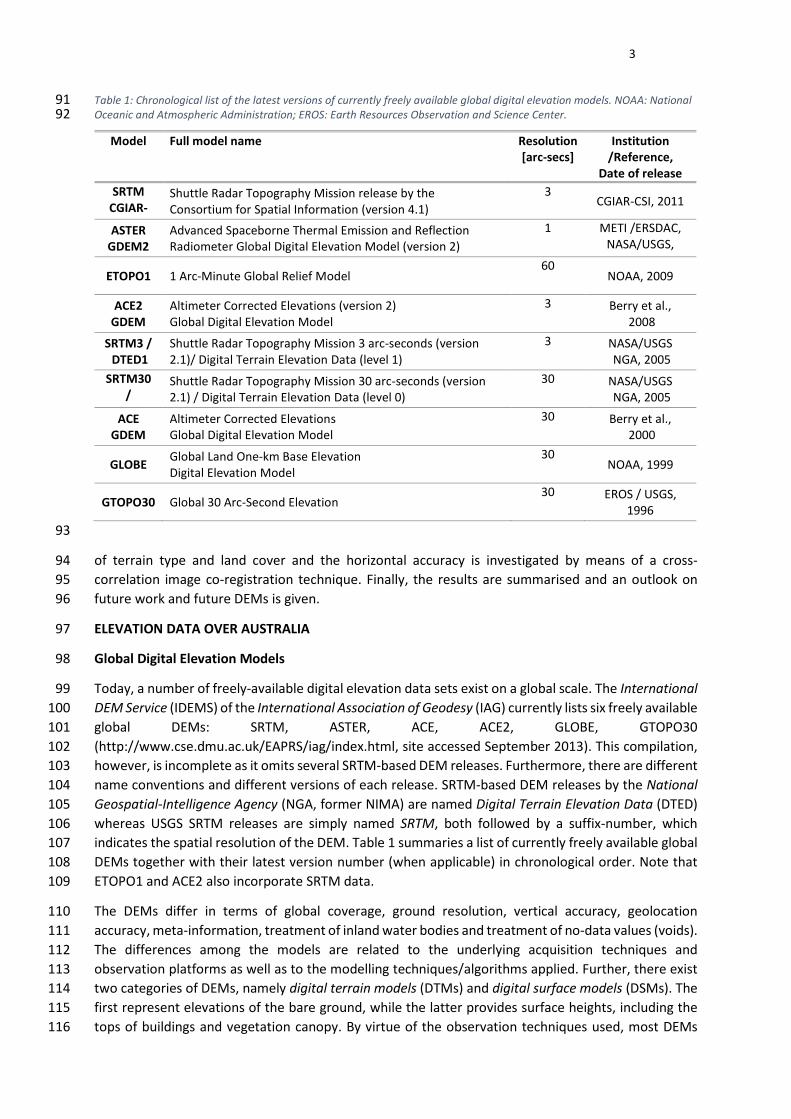
Table 1: Chronological list of the latest versions of currently freely available global digital elevation models. NOAA: National 91 Oceanic and Atmospheric Administration; EROS: Earth Resources Observation and Science Center. 92
93
of terrain type and land cover and the horizontal accuracy is investigated by means of a cross-94 correlation image co-registration technique. Finally, the results are summarised and an outlook on 95 future work and future DEMs is given. 96
ELEVATION DATA OVER AUSTRALIA 97
Global Digital Elevation Models 98
Today, a number of freely-available digital elevation data sets exist on a global scale. The International 99 DEM Service (IDEMS) of the International Association of Geodesy (IAG) currently lists six freely available 100 global DEMs: SRTM, ASTER, ACE, ACE2, GLOBE, GTOPO30 101 (http://www.cse.dmu.ac.uk/EAPRS/iag/index.html, site accessed September 2013). This compilation, 102 however, is incomplete as it omits several SRTM-based DEM releases. Furthermore, there are different 103 name conventions and different versions of each release. SRTM-based DEM releases by the National 104 Geospatial-Intelligence Agency (NGA, former NIMA) are named Digital Terrain Elevation Data (DTED) 105 whereas USGS SRTM releases are simply named SRTM, both followed by a suffix-number, which 106 indicates the spatial resolution of the DEM. Table 1 summaries a list of currently freely available global 107 DEMs together with their latest version number (when applicable) in chronological order. Note that 108 ETOPO1 and ACE2 also incorporate SRTM data. 109
The DEMs differ in terms of global coverage, ground resolution, vertical accuracy, geolocation 110 accuracy, meta-information, treatment of inland water bodies and treatment of no-data values (voids). 111 The differences among the models are related to the underlying acquisition techniques and 112 observation platforms as well as to the modelling techniques/algorithms applied. Further, there exist 113 two categories of DEMs, namely digital terrain models (DTMs) and digital surface models (DSMs). The 114 first represent elevations of the bare ground, while the latter provides surface heights, including the 115 tops of buildings and vegetation canopy. By virtue of the observation techniques used, most DEMs 116
Model Full model name Resolution [arc-secs]
Institution /Reference,
Date of release SRTM
CGIAR-
Shuttle Radar Topography Mission release by the Consortium for Spatial Information (version 4.1)
3 CGIAR-CSI, 2011
ASTER GDEM2
Advanced Spaceborne Thermal Emission and Reflection Radiometer Global Digital Elevation Model (version 2)
1 METI /ERSDAC, NASA/USGS,
2011 ETOPO1 1 Arc-Minute Global Relief Model
60 NOAA, 2009
ACE2 GDEM
Altimeter Corrected Elevations (version 2) Global Digital Elevation Model
3 Berry et al., 2008
SRTM3 / DTED1
Shuttle Radar Topography Mission 3 arc-seconds (version 2.1)/ Digital Terrain Elevation Data (level 1)
3 NASA/USGS NGA, 2005
SRTM30 /
DTED0
Shuttle Radar Topography Mission 30 arc-seconds (version 2.1) / Digital Terrain Elevation Data (level 0)
30 NASA/USGS NGA, 2005
ACE GDEM
Altimeter Corrected Elevations Global Digital Elevation Model
30 Berry et al., 2000
GLOBE Global Land One-km Base Elevation Digital Elevation Model
30 NOAA, 1999
GTOPO30 Global 30 Arc-Second Elevation 30 EROS / USGS,
1996

4
(e.g. ASTER and SRTM) are DSMs or mixed DSM/DTMs rather than pure representations of the terrain 117 (DTMs). 118
Table 2: Basic features of the three global digital elevation models ASTER GDEM2, SRTM3 USGS v2.1 and SRTM CGIAR-CSI 119 v4.1. JPL: Jet Propulsion Laboratory; WGS84: World Geodetic System 1994; EGM96: Earth Gravitational Model 1984. 120
ASTER GDEM2 SRTM3 USGS v2.1 SRTM CGIAR-CSI v4.1
Satellite Mission Terra Shuttle Radar Topography Mission
Shuttle Radar Topography Mission
Institutions METI, NASA NASA, USGS, JPL CGIAR-CSI
Instrument ASTER (optical) Space Shuttle Radar C / X-band SAR
Space Shuttle Radar C/ X-band SAR
Height Reference WGS84 / EGM96 WGS84 / EGM96 WGS84 / EGM96
Height Type Orthometric Heights Orthometric Heights Orthometric Heights
Coverage +83 N to -83 S latitude +60 N to -56 S latitude +60 N to -56 S latitude
Resolution 30 m / 1 arc-second 90 m / 3 arc-seconds 90 m / 3 arc-seconds
Elevation Accuracy < 17 m (at 95 % confidence)
< 16 m (at 90 % confidence)
< 16 m (at 90 % confidence)
Download http://gdem.ersdac. jspacesystems.or.jp/
http://dds.cr.usgs.gov/srtm/ version2_1/SRTM3
http://srtm.csi.cgiar.org
121
In the following, three prominent DEM (actually DSM) releases, namely ASTER-GDEM2, SRTM3 v2.1 122 (USGS) and SRTM v4.1 (CGIAR/CSI), are described and available accuracy assessments are briefly 123 summarised. The basic features and the URL web addresses of the three DEMs are given in Table 2. 124
ASTER-GDEM2 125
The joint Japanese–US Advanced Spaceborne Thermal Emission and Reflection Radiometer (ASTER) 126 (Abrams et al. 2002) Global Digital Elevation Model (GDEM) version 2 was released in October 2011 127 (three years after its predecessor, version 1) by the Ministry of Economy, Trade and Industry (METI) of 128 Japan together with the United States National Aeronautics and Space Administration (NASA). Since 129 2000 the Japanese ASTER instrument, payload on NASA’s Terra satellite, acquires stereo image data 130 with its two nadir- and backward-viewing telescopes, which are sensitive in the near infrared spectral 131 band. The Sensor Information Laboratory Corporation (SILC) has developed an automatic processing 132 methodology for the generation of the GDEM from ASTER’s along-track stereoscopic sensors 133 measurements. The Terra spacecraft’s near-polar orbit covers the Earth’s land surfaces between ± 83 134 degrees latitude and the nominal ground sampling distance is 15 m. The GDEM heights refer to the 135 WGS84/EGM96 geoid and are provided as 1 x 1 degree tiles in GeoTIFF format with geographic 136 latitude/longitude coordinates sampled to a one arc-second (approximately 30 m) grid. In total 22,600 137 tiles, each of 24.7 MB size (accounting for almost 560 GB in total) can be downloaded free of charge, 138 e.g. at the Earth Remote Sensing Data Analysis Center (ERSDAC) of Japan. The basic features of ASTER 139 GDEM2 are listed in Table 2 (c.f. Tachikawa et al. 2011a). 140
In a summarising study by the joint Japan–US ASTER Science Team (Tachikawa et al. 2011b) comprising 141 a total of four independent validation studies, the vertical accuracy of ASTER GDEM2 is estimated to 142 be around 17 m at a confidence interval of 95%. The major drawback of ASTER is that it is an optical 143 sensor and thus constant cloud cover over certain areas may lead to data voids (”holes”) or artefacts 144 in the GDEM. Further, it is important to remember that ASTER maps the surface of the Earth including 145 all buildings and plant canopy, so heights do not reflect the bare ground where the ground is covered. 146 When validated against different height data sets, ASTER generally showed higher offsets in the 147 canopy, exceeding even SRTM elevations in forested areas, and negative offsets were observed over 148 low- or non-vegetated areas. Compared to version 1, the updates in the algorithm to generate version 149 2 lead to a finer horizontal resolution, a correct detection of water bodies as small as 1 km2, and the 150

5
global adjustment of an elevation offset of –5 m (Tachikawa et al. 2011a). Furthermore, two additional 151 years of observation are incorporated in GDEM2, reducing the data voids and artefacts in areas of 152 sparse observations. 153
ASTER GDEM products have already been subject to evaluations and to comparisons with ground-truth 154 data. ASTER GDEM1 (version 1) has been evaluated in several studies and we refer to the list of 155 publications given at the IDEMS homepage (http://www.cse.dmu.ac.uk/EAPRS/iag 156 /relevant_publications.html) for further information. The findings of the four studies of the joint 157 Japan–US ASTER validation team dealing with the quality assessment of ASTER GDEM2 (Krieger et al. 158 2010; Carabajal 2011; Gesh et al. 2011; Tachikawa et al. 2011a) shall not be repeated here, but relevant 159 results are discussed and compared to our computations. 160
SRTM1-3 161
SRTM digital elevation data sets are the joint effort of NASA, NGA and the German Aerospace Center 162 (DLR) and the Italian Space Agency (ASI). The SRTM elevations are based on interferometric evaluations 163 of observations of the dual radar antennas (sensitive for C- and X-band) on board of the Shuttle Radar 164 Topography Mission’s spacecraft, which flew in February 2000 (Farr et al. 2007). All landmass between 165 56 degrees south and 60 degrees north (that is around 80% of the Earth’s total landmass) are covered 166 by SRTM observations and are contained in SRTM DEMs. 167
Since 2000, a number of SRTM DEMs have been created and made available for the public, initially by 168 the USGS, with different ground sampling (SRTM1: 1 arc-second/30 m; SRTM3: 3 arc-seconds/90 m; 169 SRTM30: 30 arc-seconds/900 m) and spatial coverage. The highest resolution data set (SRTM1) 170 available over US territory. Since the release of the initial SRTM data sets, which are also referred to 171 as ”research grade”, improved ”finished-grade” models have become available. Currently, the latest 172 version number for the finished grade release is v2.1. Version 2.0 improved over the first unedited 173 release, as water bodies and coastlines have been incorporated accurately and single pixel errors have 174 been removed in the latter. However, the second version contained occasional artefacts, stripes 175 beyond 50 degrees latitude and no-data areas. The latest SRTM3 version is based on an averaging 176 method (each 3 x 3 pixels) that leads to an elimination of most high-frequency artefacts (USGS 2009). 177 The no-data areas are still present in the latest version, which is a major drawback of the data set, as 178 it is up to the user to fill the data ’holes’. The centre column of Table 2 lists the basic features of the 179 SRTM3 v2.1 release. 180
The SRTM DEMs generally suffer from different kinds of errors, which can only be removed to some 181 extent a posteriori. First of all, SRTM does not always map the bare ground surface. The measurement 182 is influenced by buildings, vegetation and snow cover (especially the northern hemisphere), as radar 183 waves only partially penetrate the vegetation canopy, snow, ice and very dry soil (Farr et al. 2007). 184 Additionally, in case of extremely smooth areas or water surfaces, sometimes no radar signal returned 185 to the antenna and respective areas were given the void value. In Rodriguez et al. (2005), those and 186 other typical SRTM error sources such as radar shadows and foreshortening, which appear at steep 187 slopes, are explained in more detail and absolute error estimates are given for various continents 188 based on comparisons to independent ground control points. It is found, that SRTM meets and often 189 exceeds the official performance criteria (16 m) as absolute vertical errors are below 9 m (90% 190 confidence). 191
SRTM V4.1 (CGIAR-CSI) 192
The latest SRTM release (version 4.1) by the Consortium for Spatial Information (CSI) of the 193 Consultative Group for International Agricultural Research (CGIAR) is a further processed version of the 194 original (finished grade/version 2) NASA/USGS SRTM (Farr et al. 2007) 1-degree tiles at 3 arc-seconds 195 (90 m) ground resolution (Table 2). The post-processed CGIAR-CSI SRTM release provides seamless and 196
6
complete elevation surfaces for the globe (between 56°S and 60°N). They are complete due to a SRTM 197 tailored void-filling interpolation method described in Reuter et al. (2007) and due to auxiliary data 198 sets, used to fill-in even large data ’holes’ that were present in the USGS releases (Rodriguez et al. 199 2005). Over Australia 255,471 no-data pixels, corresponding to approximately 0.03% of the Australian 200 landmass, could be filled making use of Geoscience Australia’s GEODATA TOPO 100 k data in CGIAR-201 CSI’s SRTM release (Hirt et al. 2010). With their processing efforts CGIAR-CSI aims to enable SRTM data 202 to be used for a wide range of applications, such as hydrological and gravity modelling, without the 203 necessity of (void-treating) pre-processing steps. 204
The CGIAR-CSI SRTM v4.1 DEM has been evaluated over Australian territory in Hirt et al. (2010) and 205 compared with ASTER GDEM1, Australia’s national elevation data set GEODATA DEM-9s (ver3) and 206 ground-truth data sets (comprising 911 GPS/levelling and 6392 levelling ground control points (GCPs)). 207 The SRTM v4.1 data set was found to be a serious alternative to the GEODATA DEM-9s (which among 208 others has been used to fill SRTM holes in mountainous areas) and shows RMS (root-mean-square) 209 values around 6 m when compared to the GCPs. However, due to the location of the GCPs, the RMS is 210 only representative for rather less-vegetated areas. Systematic biases (too large SRTM heights) are 211 generally to be expected in densely vegetated areas (as shown e.g. in Germany (Denker 2004) and 212 Switzerland (Marti 2004)). 213
Australian National Gravity Database 214
The Australian National Gravity Database (ANGD), compiled by Geoscience Australia, comprises the 215 data of a multitude of national gravity surveys conducted all over the Australian continent from as 216 early as 1938. The records of over 1700 surveys provide information on the Earth’s gravity acceleration 217 at more than 1.6 million stations in Australia (Wynne & Bacchin 2009). Importantly, the ANGD provides 218 – with varying accuracy – 3D-positions (latitude, longitude and heights above mean sea level) of the 219 gravity stations. As such, parts of the 3D-positions available through the ANGD represent a valuable 220 source of information on the topography, which are exploited here as ground-truth comparison data 221 for the evaluation of digital elevation models. 222
The ANGD inherent heterogeneity in terms of data quality mainly results from the technical and 223 methodological progress of surveying engineering since 1938. The single surveys were conducted by 224 individuals, governmental institutions and private companies, using different quality requirements. 225 The accuracy of the gravity measurements and 3-D station information were improving in the course 226 of time. Geoscience Australia has put considerable effort in providing metadata on the single surveys 227 in the ANGD by creating an Index of Gravity Surveys (Wynne & Bacchin 2009). ANGD is to be used with 228 some care, as already five different geodetic datums find application in the database. 229
In terms of station distribution, the entire Australian continent is well covered by the ANGD. However, 230 the station spacing varies from 11 km in remote areas (parts of Western Australia and Northern 231 Territory) to 1.5 km in urban areas (c.f. Wynne & Bacchin 2009). 232
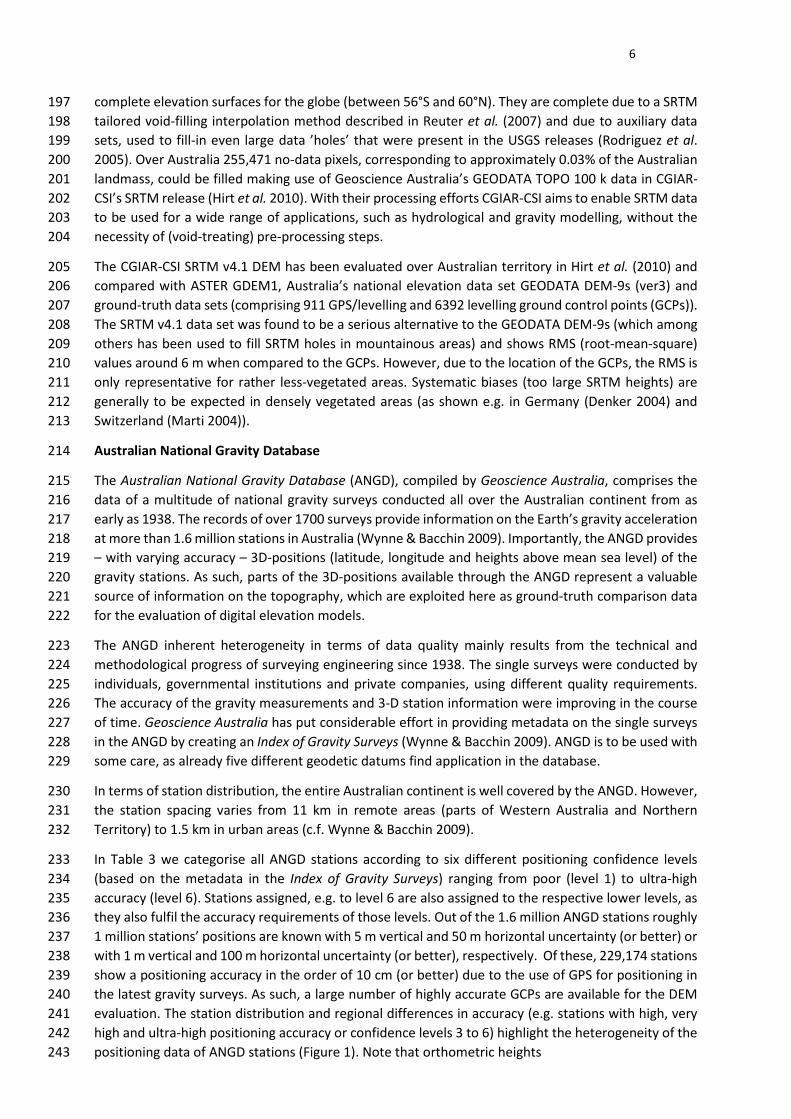
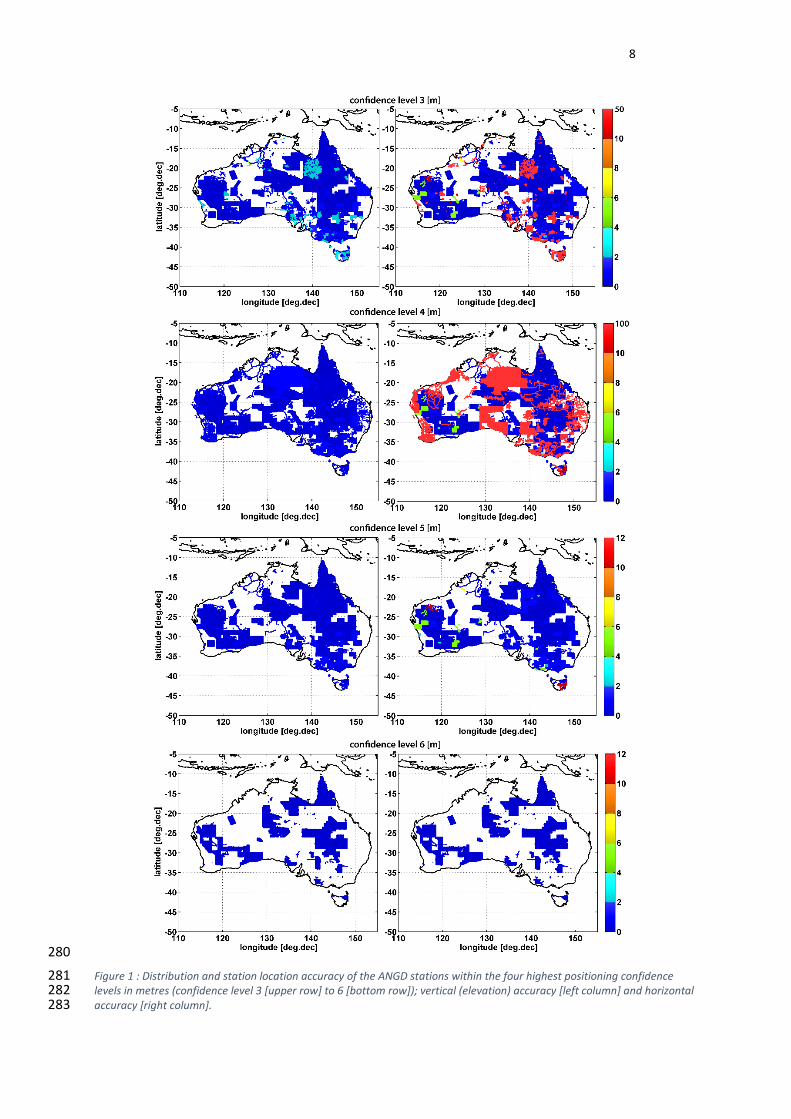
In Table 3 we categorise all ANGD stations according to six different positioning confidence levels 233 (based on the metadata in the Index of Gravity Surveys) ranging from poor (level 1) to ultra-high 234 accuracy (level 6). Stations assigned, e.g. to level 6 are also assigned to the respective lower levels, as 235 they also fulfil the accuracy requirements of those levels. Out of the 1.6 million ANGD stations roughly 236 1 million stations’ positions are known with 5 m vertical and 50 m horizontal uncertainty (or better) or 237 with 1 m vertical and 100 m horizontal uncertainty (or better), respectively. Of these, 229,174 stations 238 show a positioning accuracy in the order of 10 cm (or better) due to the use of GPS for positioning in 239 the latest gravity surveys. As such, a large number of highly accurate GCPs are available for the DEM 240 evaluation. The station distribution and regional differences in accuracy (e.g. stations with high, very 241 high and ultra-high positioning accuracy or confidence levels 3 to 6) highlight the heterogeneity of the 242 positioning data of ANGD stations (Figure 1). Note that orthometric heights 243

7
Table 3: Number of ANGD stations with 3-D positions complying different positioning accuracy levels (cumulative). 244
Positioning confidence
Positioning confidence
level
Elevation (Vertical)
accuracy [m]
Location (Horizontal) accuracy [m]
Number of ANGD
stations Poor 1 20 1000 1,624,954 Medium 2 5 100 1,403,052 High 3 5 50 959,663 High 4 1 100 956,155 Very High 5 1 10 775,437 Ultra High 6 0.1 0.1 229,174
245
(heights relative to the geoid) as well as ellipsoidal heights (heights relative to the WGS84 ellipsoid) 246 are provided for each station. In this study, only the ellipsoidal heights that were transformed to 247 orthometric heights by consistently subtracting the geoid heights obtained from EGM96, are used. 248
DEM EVALUATION 249
Vertical (elevation) accuracy assessment methods 250
The vertical (elevation) accuracy assessment yields quality estimates for the (orthometric) heights that 251 are given by all individual digital elevation models relative to the geodetic datum WGS84/EGM96. 252
In a first step, the models are intercompared grid-wise by calculating elevation differences for the 253 entire Australian continent. These differences help to identify large-scale systematic errors (such as 254 offsets) and small-scale anomalies (such as voids) in the individual models. In the comparison of ASTER 255 GDEM2 with the two SRTM DEMs, the ASTER grid is down-sampled to the coarser SRTM grid-spacing 256 (3 arc-seconds) by arithmetically averaging 3 x 3 ASTER pixel arrays. This method is similar to the 257 production of the finished grade SRTM3 USGS release (which also is the basis for the CGIAR-CSI release) 258 itself (c.f. USGS 2009), and ensures that both datasets become spectrally consistent. Therefore down-259 sampling ASTER seems the most adequate method to deal with the different DEM resolutions. 260 Consistent land–water masking using the SRTM Water Body Data ensures that water-values do not 261 distort the comparison. Further, only areas where both data sets have valid topographic information 262 were taken into account (data-voids were masked out). 263
In a second step, the models are compared to GCPs from the ANGD at the two highest confidence 264 levels. The models’ heights at the ANGD stations’ locations are retrieved by means of a bicubic 265 interpolation. In order to be consistent with the orthometric DEM heights 𝐻𝐻𝐷𝐷𝐷𝐷𝐷𝐷𝑜𝑜𝑜𝑜𝑜𝑜ℎ𝑜𝑜 the respective geoid 266 heights 𝑁𝑁𝐷𝐷𝐸𝐸𝐷𝐷96 taken from the EGM96 (Earth Gravitational Model 1996; Lemoine et al. 1998) are 267 subtracted from the ellipsoidal ANGD heights 𝐻𝐻𝐴𝐴𝐴𝐴𝐸𝐸𝐷𝐷
𝑒𝑒𝑒𝑒𝑒𝑒𝑒𝑒𝑒𝑒 . Expressed by formula, the difference Δh is 268 obtained in the following way: 269
Δh = HDEMortho − (HANGD
ellip − NEGM96) 270
Those differences are used subsequently to determine statistical values, such as mean, standard 271 deviation, median, minimum, maximum and root-mean-square differences. Further, these statistics 272 evaluated as well as a function of the land cover and terrain type present at the ANGD stations’ 273 locations, allows a more precise interpretation of the DEM’s performance. In the case of land cover 274 analyses, we use ESA’s open access GlobCover 2009 map (Bontemps et al. 2011), based on ENVISAT-275 MERIS observations (Defourny et al. 2009), with 300 m ground resolution. The originally provided 23 276 land cover types are reduced down to three categories that approximately represent bare ground 277 areas (~ 46%), shrub- and grassland (~ 36%) and forest areas (~ 10%) (see Figure 2). GlobCover types 278 that did not overlap with ANGD stations are classified as “unused / non-classified” (~ 8%). Table 4 279
8
280
Figure 1 : Distribution and station location accuracy of the ANGD stations within the four highest positioning confidence 281 levels in metres (confidence level 3 [upper row] to 6 [bottom row]); vertical (elevation) accuracy [left column] and horizontal 282 accuracy [right column]. 283

9
284
Figure 2: Spatial distribution of the three land cover types ‘forest areas’, ‘shrub- and grassland’ and ‘bare areas’ over 285 Australia [left plot] and the shares of the individual GlobCover land cover types in the Australian landmass in percent by 286 GlobCover ID [right plot]. 287
shows the detailed assignment of the GlobCover land-types (with ID and label) to the three groups. In 288 the case of terrain analyses, we categorise each ANGD station by the RMS of the heights (later referred 289 to as terrain RMS) in a 1 x 1 degree sized tile in which the station is located. The parameter terrain type 290 then relates directly to the height amplitudes of the topographic relief in the station’s vicinity. 291
The vertical accuracy is correlated to and deteriorated by shortcomings in horizontal positioning 292 (georeferencing accuracy) in the DEMs as well as in the GCPs. Consequently, the DEMs are corrected 293 for the calculated horizontal offsets in the following analyses of the vertical accuracy. 294
Vertical accuracy assessment results 295
The results of the intercomparison of the three DEMs over the entire Australian continent reveal 296 interesting differences among the models. Figure 3 (b-d) shows the RMS of 0.25 x 0.25 degree sized 297 tiles (each comprising 360 000 points). The comparisons indicate that the ASTER GDEM2 data set has 298 northeast- to southwest-aligned stripes with RMS amplitudes at the 10 m level (maximum up to 25 m). 299 Independent vidence that the stripes are a problem in the ASTER data was given by comparisons to 300 ANGD stations (not shown). The SRTM data sets show very good agreement (RMS < 1 m) except for a 301 1 degree-wide east–west (E–W) oriented stripe, centred at –29.5° latitude. The good agreement 302 between both SRTM releases reflects the dependence of the two data sets, as CGIAR-CSI is based upon 303 the finished grade USGS SRTM3. Close-up comparisons to USGS SRTM3 and ASTER GDEM2 (not shown 304 here) reveal a geolocation offset of 1 pixel in north–south (N–S) direction of the SRTM CGIAR-CSI 305 release between –30.01° and –29° latitude. The error generally is of minor amplitude (< 10 m) 306 compared to the error inherent to ASTER GDEM2, and therefore the differences in Figure 3c do not 307 display the stripe but the artefact is partially visible in the comparison of ASTER GDEM2 and SRTM 308 CGIAR-CSI around 152° longitude and −29.5° latitude. 309
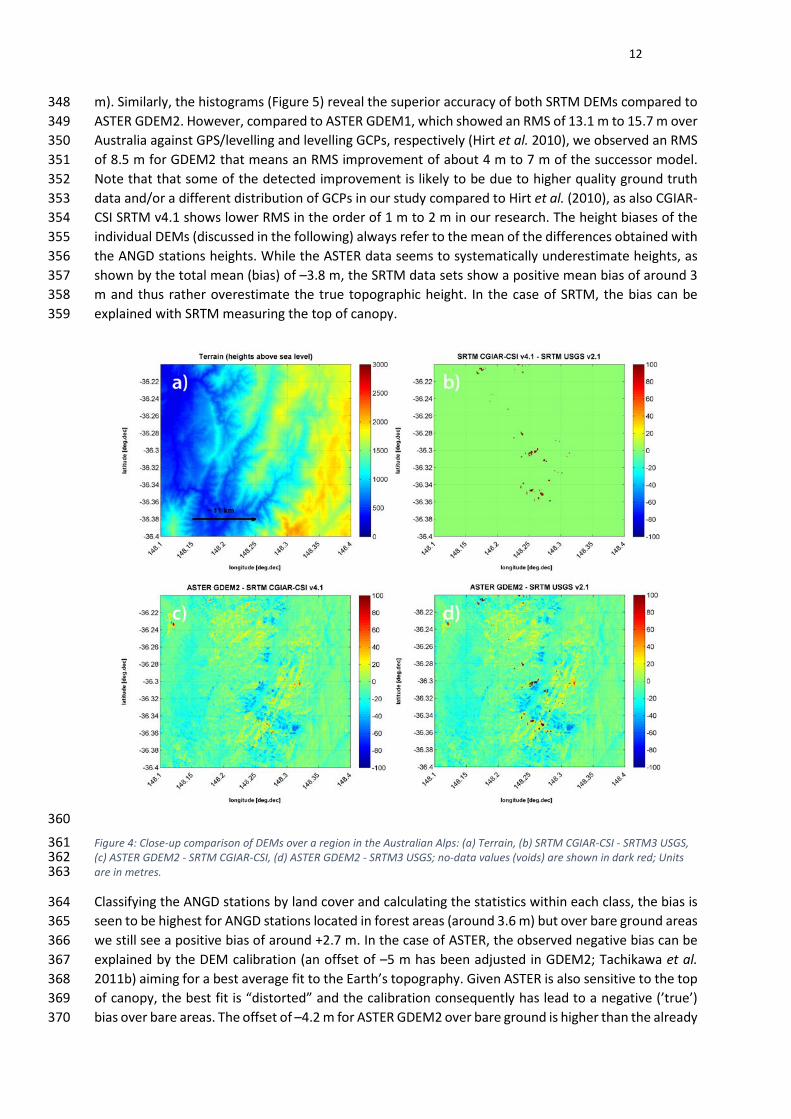
Apart from the stripes, there is no notable systematic error visible and no obvious correlation with 310 topography in comparisons between ASTER and SRTM (compare Figure 3a, c or d). Only in the area of 311 the highest elevations in the Australian Alps (around 147.5° longitude and −36.5° latitude) the RMS is 312 larger. A more detailed visualisation of a region in the Australian Alps covering 726 m² (Figure 4) reveals 313 the no-data values in the USGS data set (accounting for 273 pixels in dark red), which predominately 314 appear in steep valleys or along the southeastern slope of mountains. 315

10
Table 4: Composition of the land cover groups ’Bare areas’, ’Shrubland’ and ’Forest areas’ with GlobCover land cover types. 316
Land cover group
GlobCover Label GlobCover ID
Bare areas Sparse (<15%) vegetation 150 Bare areas 200
Shrubland Post-flooding or irrigated croplands (or aquatic) 11 Rainfed croplands 14 Mosaic grassland (50-70%) / forest or shrubland (20-50%) 120 Closed to open (>15%) (broadleaved or needle-leaved, evergreen or deciduous) shrubland (<5m)
130
Closed to open (>15%) herbaceous vegetation (grassland, savannas or lichens/mosses)
140
Forest areas Closed (>40%) broadleaved deciduous forest (>5m) 50 Open (15-40%) broadleaved deciduous forest/woodland (>5m) 60 Closed (>40%) needleleaved evergreen forest (>5m) 70 Open (15-40%) needleleaved deciduous or evergreen forest (>5m) 90 Mosaic forest or shrubland (50-70%) / grassland (20-50%) 110
Unsed / non-
classified
Mosaic cropland (50-70%) / vegetation (grassland,shrubland,forest) (20-50 %)
20
Mosaic egetation (grassland,shrubland,forest) (50-70 %) / cropland (20-50 %)
30
Closed to open (>15%) broadleaved evergreen/ semi-deciduous forest (>5m)
40
Closed to open (>15%) mixed broad- and needleleaved forest (>5m) 100 Closed to open (>15%) broadleaved forest regularly flooded 160 Closed (>40%) broadleaved forest or shrubland permanently flooded or waterlogged soil
170
Closed to open (>15%) grassland or woody vegetation on regularly flooded or waterlogged soil
180
Artificial surfaces and associated areas (Urban areas > 50%) 190 Permanent snow and ice 220 No data (burnt areas, clouds,… ) 230
317
Table 5 summarises the intercomparison of the DEMs. ASTER GDEM2 shows a negative bias of –5 m (= 318 mean difference: ASTER minusSRTM) and a RMS deviation of almost 9.5 m relative to SRTM over 319 Australia. The negative bias means that ASTER are “below” SRTM heights. Similar comparisons with 320 ASTER GDEM1 made by Hirt et al. (2010) indicate an improvement of GDEM2 over GDEM1 of about 2 321 m RMS compared with the SRTM data. The comparison of both SRTM data sets reveals a very good fit 322 with no elevation bias and an RMS of 1.2 m, which is likely to reflect the differences of the post-323 processing in the CGIAR-CSI v4.1 and the USGS SRTM3 v2.1 release (and the stripe). 324
Note that within the intercomparison of the DEMs, water areas and voids of the involved data sets 325 have been masked out. Consequently, in the statistics (Table 5) CGIAR-CSI shows a misleadingly worse 326 performance than USGS SRTM3 (in comparisons to ASTER GDEM2), because in the latter DEM the 327 problematic regions (voids) are neglected whereas in the first DEM the holes were filled (Reuter et al. 328 2007). Additionally, the stripe resulting from the georeferencing offset found in CGIAR-CSI also 329 accounts for some increase of the RMS. 330

11
331
Figure 3: Comparison of DEMs over Australia: (a) Terrain of Australia, (b) SRTM CGIAR-CSI - SRTM3 USGS, (c) SRTM CGIAR-332 CSI - ASTER GDEM2, (d) SRTM3 USGS - ASTER GDEM2; Units are in metres. 333
334
The comparison of the DEMs with ANGD GCPs as a function of the land cover is summarised statistically 335 in Table 6 for positioning confidence level 5 (dH ≤ 10 m, dXY ≤ 1 m) and level 6 (dH ≤ 0.1 m, dXY ≤ 0.1 336 m). When comparing the total RMS generated with level 5 and level 6 GCPs, a significant deterioration 337 of the statistics, due to the less accurate positioning of the level 5 GCPs, becomes visible. Conversely, 338 lower standard deviations reflect the higher confidence of level 6 GCPs. In consequence only the 339 statistics with level 6 GCPs are discussed in the following, although in a relative sense the level 5 GCPs 340 allow similar findings. 341
Table 5: Statistical results of the DEM intercomparison over Australia; no-data areas were excluded for the comparisons 342 including the SRTM USGS data set. 343
Comparison Min [m]
Max [m]
Mean [m]
RMS [m]
ASTER GDEM2 vs. CGIAR-CSI SRTM
-583.0 4288.0 -5.0 9.36
ASTER GDEM2 vs. USGS SRTM3
-553.6 3920.3 -5.0 9.21
CGIAR-CSI SRTM vs. USGS SRTM3
-201.0 359.0 0 1.21
344
From the total RMS of 4.4 m and the total standard deviation of 3.2 m, the CGIAR-CSI v4.1 SRTM release 345 shows the best fit to all ANGD stations of confidence level 6. It is followed by the USGS SRTM3 v2.1 346 release with 6.2 m RMS. ASTER GDEM2 shows the largest discrepancies to the ANGD GCPs (RMS of 8.5 347
12
m). Similarly, the histograms (Figure 5) reveal the superior accuracy of both SRTM DEMs compared to 348 ASTER GDEM2. However, compared to ASTER GDEM1, which showed an RMS of 13.1 m to 15.7 m over 349 Australia against GPS/levelling and levelling GCPs, respectively (Hirt et al. 2010), we observed an RMS 350 of 8.5 m for GDEM2 that means an RMS improvement of about 4 m to 7 m of the successor model. 351 Note that that some of the detected improvement is likely to be due to higher quality ground truth 352 data and/or a different distribution of GCPs in our study compared to Hirt et al. (2010), as also CGIAR-353 CSI SRTM v4.1 shows lower RMS in the order of 1 m to 2 m in our research. The height biases of the 354 individual DEMs (discussed in the following) always refer to the mean of the differences obtained with 355 the ANGD stations heights. While the ASTER data seems to systematically underestimate heights, as 356 shown by the total mean (bias) of –3.8 m, the SRTM data sets show a positive mean bias of around 3 357 m and thus rather overestimate the true topographic height. In the case of SRTM, the bias can be 358 explained with SRTM measuring the top of canopy. 359
360
Figure 4: Close-up comparison of DEMs over a region in the Australian Alps: (a) Terrain, (b) SRTM CGIAR-CSI - SRTM3 USGS, 361 (c) ASTER GDEM2 - SRTM CGIAR-CSI, (d) ASTER GDEM2 - SRTM3 USGS; no-data values (voids) are shown in dark red; Units 362 are in metres. 363
Classifying the ANGD stations by land cover and calculating the statistics within each class, the bias is 364 seen to be highest for ANGD stations located in forest areas (around 3.6 m) but over bare ground areas 365 we still see a positive bias of around +2.7 m. In the case of ASTER, the observed negative bias can be 366 explained by the DEM calibration (an offset of –5 m has been adjusted in GDEM2; Tachikawa et al. 367 2011b) aiming for a best average fit to the Earth’s topography. Given ASTER is also sensitive to the top 368 of canopy, the best fit is “distorted” and the calibration consequently has lead to a negative (’true’) 369 bias over bare areas. The offset of –4.2 m for ASTER GDEM2 over bare ground is higher than the already 370
13
observed ’true’ negative elevation bias of 1 m (Tachikawa et al. 2011b). Compared to the investigations 371 in Hirt et al. (2010) over Australia, where ASTER GDEM1 reported a mean negative bias 372
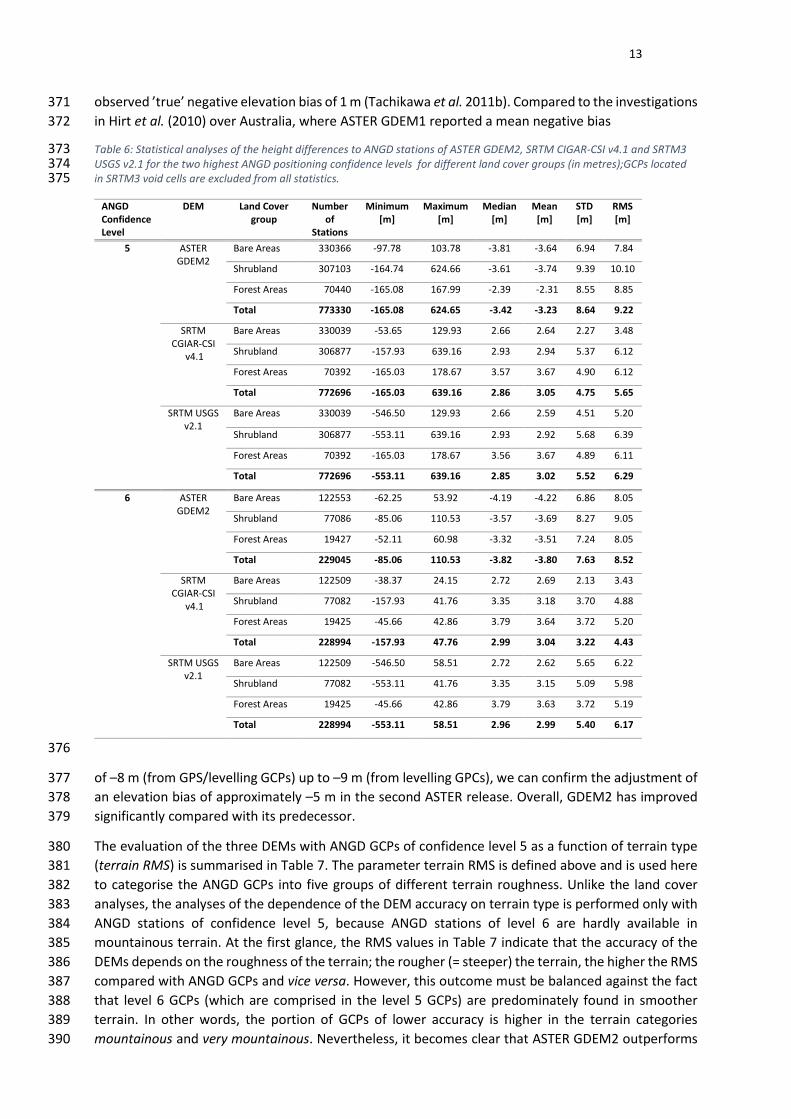
Table 6: Statistical analyses of the height differences to ANGD stations of ASTER GDEM2, SRTM CIGAR-CSI v4.1 and SRTM3 373 USGS v2.1 for the two highest ANGD positioning confidence levels for different land cover groups (in metres);GCPs located 374 in SRTM3 void cells are excluded from all statistics. 375
ANGD Confidence Level
DEM Land Cover group
Number of
Stations
Minimum [m]
Maximum [m]
Median [m]
Mean [m]
STD [m]
RMS [m]
5 ASTER GDEM2
Bare Areas 330366 -97.78 103.78 -3.81 -3.64 6.94 7.84
Shrubland 307103 -164.74 624.66 -3.61 -3.74 9.39 10.10
Forest Areas 70440 -165.08 167.99 -2.39 -2.31 8.55 8.85
Total 773330 -165.08 624.65 -3.42 -3.23 8.64 9.22
SRTM CGIAR-CSI
v4.1
Bare Areas 330039 -53.65 129.93 2.66 2.64 2.27 3.48
Shrubland 306877 -157.93 639.16 2.93 2.94 5.37 6.12
Forest Areas 70392 -165.03 178.67 3.57 3.67 4.90 6.12
Total 772696 -165.03 639.16 2.86 3.05 4.75 5.65
SRTM USGS v2.1
Bare Areas 330039 -546.50 129.93 2.66 2.59 4.51 5.20
Shrubland 306877 -553.11 639.16 2.93 2.92 5.68 6.39
Forest Areas 70392 -165.03 178.67 3.56 3.67 4.89 6.11
Total 772696 -553.11 639.16 2.85 3.02 5.52 6.29
6 ASTER GDEM2
Bare Areas 122553 -62.25 53.92 -4.19 -4.22 6.86 8.05
Shrubland 77086 -85.06 110.53 -3.57 -3.69 8.27 9.05
Forest Areas 19427 -52.11 60.98 -3.32 -3.51 7.24 8.05
Total 229045 -85.06 110.53 -3.82 -3.80 7.63 8.52
SRTM CGIAR-CSI
v4.1
Bare Areas 122509 -38.37 24.15 2.72 2.69 2.13 3.43
Shrubland 77082 -157.93 41.76 3.35 3.18 3.70 4.88
Forest Areas 19425 -45.66 42.86 3.79 3.64 3.72 5.20
Total 228994 -157.93 47.76 2.99 3.04 3.22 4.43
SRTM USGS v2.1
Bare Areas 122509 -546.50 58.51 2.72 2.62 5.65 6.22
Shrubland 77082 -553.11 41.76 3.35 3.15 5.09 5.98
Forest Areas 19425 -45.66 42.86 3.79 3.63 3.72 5.19
Total 228994 -553.11 58.51 2.96 2.99 5.40 6.17
376
of –8 m (from GPS/levelling GCPs) up to –9 m (from levelling GPCs), we can confirm the adjustment of 377 an elevation bias of approximately –5 m in the second ASTER release. Overall, GDEM2 has improved 378 significantly compared with its predecessor. 379
The evaluation of the three DEMs with ANGD GCPs of confidence level 5 as a function of terrain type 380 (terrain RMS) is summarised in Table 7. The parameter terrain RMS is defined above and is used here 381 to categorise the ANGD GCPs into five groups of different terrain roughness. Unlike the land cover 382 analyses, the analyses of the dependence of the DEM accuracy on terrain type is performed only with 383 ANGD stations of confidence level 5, because ANGD stations of level 6 are hardly available in 384 mountainous terrain. At the first glance, the RMS values in Table 7 indicate that the accuracy of the 385 DEMs depends on the roughness of the terrain; the rougher (= steeper) the terrain, the higher the RMS 386 compared with ANGD GCPs and vice versa. However, this outcome must be balanced against the fact 387 that level 6 GCPs (which are comprised in the level 5 GCPs) are predominately found in smoother 388 terrain. In other words, the portion of GCPs of lower accuracy is higher in the terrain categories 389 mountainous and very mountainous. Nevertheless, it becomes clear that ASTER GDEM2 outperforms 390

14
both SRTM releases in very mountainous terrain, as both SRTM DEMs show an RMS of 15 m as opposed 391 to the 11.3 m RMS of ASTER GDEM2. This behaviour indicates that the 3 arc-seconds SRTM resolution 392 is not good enough to accurately represent the terrain shape in steep terrain. The higher RMS of SRTM 393 DEMs may also be related to known SRTM problems, such as radar-shadows or foreshortening in the 394 presence of steep slopes (Rodriguez et al. 2005). In the other terrain categories (apart from very 395 mountainous terrain) CGIAR-CSI SRTM v4.1 shows the best fit to ANGDGCPs, followed by SRTM USGS 396 v2.1. 397
398
Figure 5: Histogram showing the distribution of the height differences to ANGD stations of ASTER GDEM2 (a), SRTM CIGAR-399 CSI v4.1 (b), and SRTM3 USGS v2.1 (c) for the two highest ANGD positioning confidence levels (in metres); plots 1a–1c: 400
confidence level 5; plots 2a-2c: confidence level 6. 401
Horizontal (georeferencing) accuracy assessment methods and results 402
In the following, the methods and the results of the determination of possible georeferencing offsets 403 between the different DEMs are described. Knowledge of georeferencing offsets is of great importance 404 as the horizontal location errors deteriorate correct height information. 405
For the determination of the georeferencing offset with subpixel resolution (1/1000 of a pixel) we 406 make use of the cross-correlation procedure by Guizar-Sicairos et al. (2008), which efficiently 407 computes the offset between two 2D images by means of a matrix-multiply Digital Fourier 408 Transformation (DFT). Again, data sets of different resolution are made compatible in terms of 409 resolution and spectral content by down-sampling ASTER to the coarser SRTM grid. Note that tests 410 showed that by up-sampling SRTM to the ASTER resolution the calculated horizontal offsets of single 411 tiles deviate in the sub-pixel range. However, in our analyses we focus on the down-sampling 412 approach, as in the up-sampling approach both data sets are not spectrally consistent. 413
Comparing both SRTM releases no horizontal offset could be discovered, apart from a 1 degree E–W 414 aligned stripe centred at –29.5° latitude. As found above, within this stripe the respective CGIAR-CSI 415 SRTM tiles show a 1 pixel shift relative to the rest of the tiles (and relative to the SRTM3 USGS release). 416
15
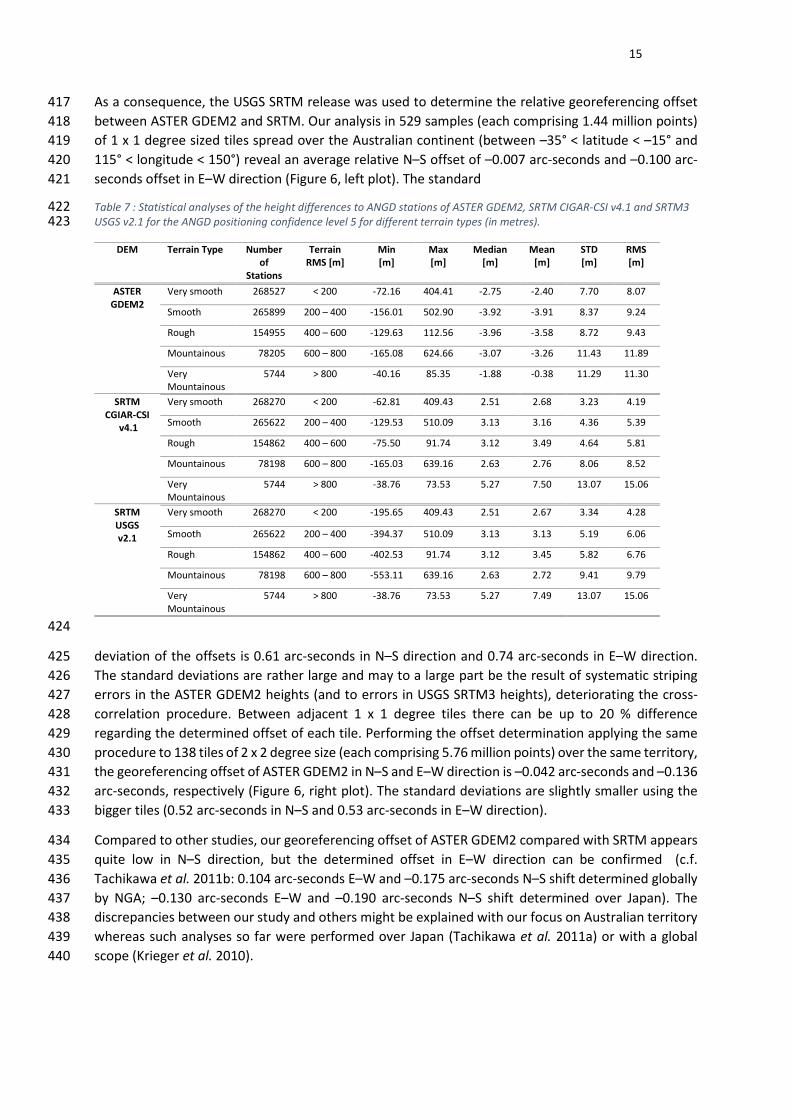
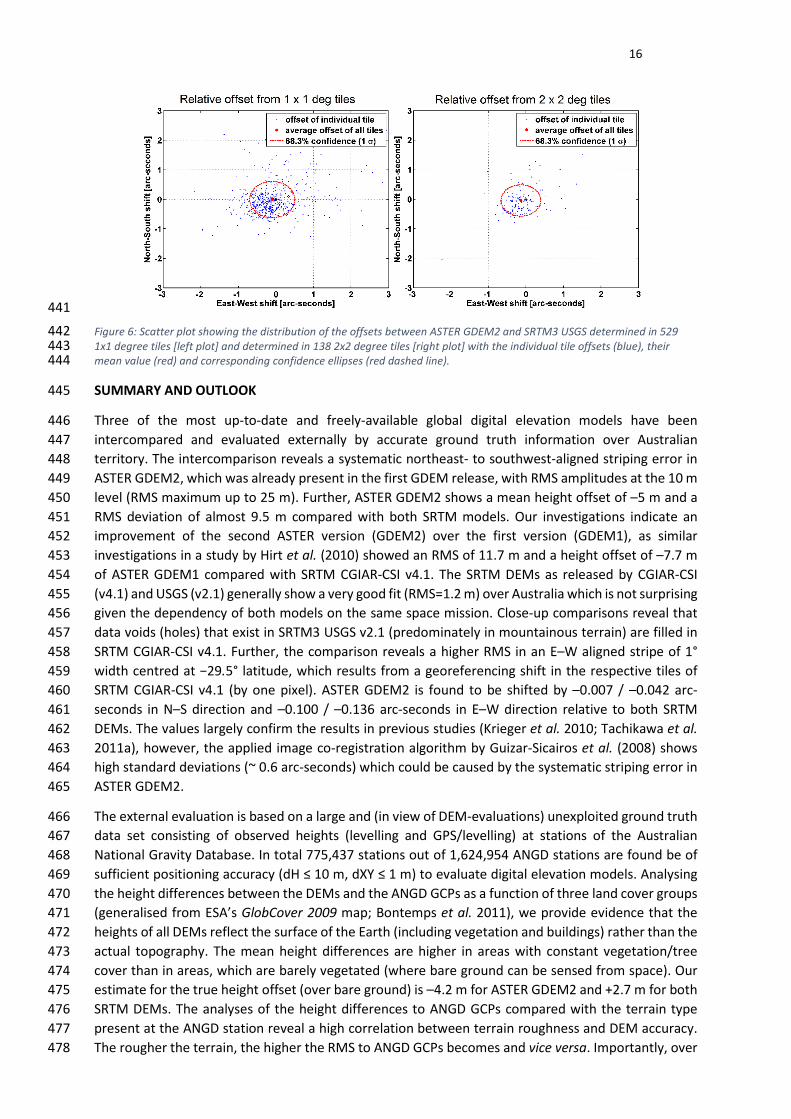
As a consequence, the USGS SRTM release was used to determine the relative georeferencing offset 417 between ASTER GDEM2 and SRTM. Our analysis in 529 samples (each comprising 1.44 million points) 418 of 1 x 1 degree sized tiles spread over the Australian continent (between –35° < latitude < –15° and 419 115° < longitude < 150°) reveal an average relative N–S offset of –0.007 arc-seconds and –0.100 arc-420 seconds offset in E–W direction (Figure 6, left plot). The standard 421
Table 7 : Statistical analyses of the height differences to ANGD stations of ASTER GDEM2, SRTM CIGAR-CSI v4.1 and SRTM3 422 USGS v2.1 for the ANGD positioning confidence level 5 for different terrain types (in metres). 423
DEM Terrain Type Number of
Stations
Terrain RMS [m]
Min [m]
Max [m]
Median [m]
Mean [m]
STD [m]
RMS [m]
ASTER GDEM2
Very smooth 268527 < 200 -72.16 404.41 -2.75 -2.40 7.70 8.07
Smooth 265899 200 – 400 -156.01 502.90 -3.92 -3.91 8.37 9.24
Rough 154955 400 – 600 -129.63 112.56 -3.96 -3.58 8.72 9.43
Mountainous 78205 600 – 800 -165.08 624.66 -3.07 -3.26 11.43 11.89
Very Mountainous
5744 > 800 -40.16 85.35 -1.88 -0.38 11.29 11.30
SRTM CGIAR-CSI
v4.1
Very smooth 268270 < 200 -62.81 409.43 2.51 2.68 3.23 4.19
Smooth 265622 200 – 400 -129.53 510.09 3.13 3.16 4.36 5.39
Rough 154862 400 – 600 -75.50 91.74 3.12 3.49 4.64 5.81
Mountainous 78198 600 – 800 -165.03 639.16 2.63 2.76 8.06 8.52
Very Mountainous
5744 > 800 -38.76 73.53 5.27 7.50 13.07 15.06
SRTM USGS v2.1
Very smooth 268270 < 200 -195.65 409.43 2.51 2.67 3.34 4.28
Smooth 265622 200 – 400 -394.37 510.09 3.13 3.13 5.19 6.06
Rough 154862 400 – 600 -402.53 91.74 3.12 3.45 5.82 6.76
Mountainous 78198 600 – 800 -553.11 639.16 2.63 2.72 9.41 9.79
Very Mountainous
5744 > 800 -38.76 73.53 5.27 7.49 13.07 15.06
424
deviation of the offsets is 0.61 arc-seconds in N–S direction and 0.74 arc-seconds in E–W direction. 425 The standard deviations are rather large and may to a large part be the result of systematic striping 426 errors in the ASTER GDEM2 heights (and to errors in USGS SRTM3 heights), deteriorating the cross-427 correlation procedure. Between adjacent 1 x 1 degree tiles there can be up to 20 % difference 428 regarding the determined offset of each tile. Performing the offset determination applying the same 429 procedure to 138 tiles of 2 x 2 degree size (each comprising 5.76 million points) over the same territory, 430 the georeferencing offset of ASTER GDEM2 in N–S and E–W direction is –0.042 arc-seconds and –0.136 431 arc-seconds, respectively (Figure 6, right plot). The standard deviations are slightly smaller using the 432 bigger tiles (0.52 arc-seconds in N–S and 0.53 arc-seconds in E–W direction). 433
Compared to other studies, our georeferencing offset of ASTER GDEM2 compared with SRTM appears 434 quite low in N–S direction, but the determined offset in E–W direction can be confirmed (c.f. 435 Tachikawa et al. 2011b: 0.104 arc-seconds E–W and –0.175 arc-seconds N–S shift determined globally 436 by NGA; –0.130 arc-seconds E–W and –0.190 arc-seconds N–S shift determined over Japan). The 437 discrepancies between our study and others might be explained with our focus on Australian territory 438 whereas such analyses so far were performed over Japan (Tachikawa et al. 2011a) or with a global 439 scope (Krieger et al. 2010). 440
16
441
Figure 6: Scatter plot showing the distribution of the offsets between ASTER GDEM2 and SRTM3 USGS determined in 529 442 1x1 degree tiles [left plot] and determined in 138 2x2 degree tiles [right plot] with the individual tile offsets (blue), their 443 mean value (red) and corresponding confidence ellipses (red dashed line). 444
SUMMARY AND OUTLOOK 445
Three of the most up-to-date and freely-available global digital elevation models have been 446 intercompared and evaluated externally by accurate ground truth information over Australian 447 territory. The intercomparison reveals a systematic northeast- to southwest-aligned striping error in 448 ASTER GDEM2, which was already present in the first GDEM release, with RMS amplitudes at the 10 m 449 level (RMS maximum up to 25 m). Further, ASTER GDEM2 shows a mean height offset of –5 m and a 450 RMS deviation of almost 9.5 m compared with both SRTM models. Our investigations indicate an 451 improvement of the second ASTER version (GDEM2) over the first version (GDEM1), as similar 452 investigations in a study by Hirt et al. (2010) showed an RMS of 11.7 m and a height offset of –7.7 m 453 of ASTER GDEM1 compared with SRTM CGIAR-CSI v4.1. The SRTM DEMs as released by CGIAR-CSI 454 (v4.1) and USGS (v2.1) generally show a very good fit (RMS=1.2 m) over Australia which is not surprising 455 given the dependency of both models on the same space mission. Close-up comparisons reveal that 456 data voids (holes) that exist in SRTM3 USGS v2.1 (predominately in mountainous terrain) are filled in 457 SRTM CGIAR-CSI v4.1. Further, the comparison reveals a higher RMS in an E–W aligned stripe of 1° 458 width centred at −29.5° latitude, which results from a georeferencing shift in the respective tiles of 459 SRTM CGIAR-CSI v4.1 (by one pixel). ASTER GDEM2 is found to be shifted by –0.007 / –0.042 arc-460 seconds in N–S direction and –0.100 / –0.136 arc-seconds in E–W direction relative to both SRTM 461 DEMs. The values largely confirm the results in previous studies (Krieger et al. 2010; Tachikawa et al. 462 2011a), however, the applied image co-registration algorithm by Guizar-Sicairos et al. (2008) shows 463 high standard deviations (~ 0.6 arc-seconds) which could be caused by the systematic striping error in 464 ASTER GDEM2. 465
The external evaluation is based on a large and (in view of DEM-evaluations) unexploited ground truth 466 data set consisting of observed heights (levelling and GPS/levelling) at stations of the Australian 467 National Gravity Database. In total 775,437 stations out of 1,624,954 ANGD stations are found be of 468 sufficient positioning accuracy (dH ≤ 10 m, dXY ≤ 1 m) to evaluate digital elevation models. Analysing 469 the height differences between the DEMs and the ANGD GCPs as a function of three land cover groups 470 (generalised from ESA’s GlobCover 2009 map; Bontemps et al. 2011), we provide evidence that the 471 heights of all DEMs reflect the surface of the Earth (including vegetation and buildings) rather than the 472 actual topography. The mean height differences are higher in areas with constant vegetation/tree 473 cover than in areas, which are barely vegetated (where bare ground can be sensed from space). Our 474 estimate for the true height offset (over bare ground) is –4.2 m for ASTER GDEM2 and +2.7 m for both 475 SRTM DEMs. The analyses of the height differences to ANGD GCPs compared with the terrain type 476 present at the ANGD station reveal a high correlation between terrain roughness and DEM accuracy. 477 The rougher the terrain, the higher the RMS to ANGD GCPs becomes and vice versa. Importantly, over 478
17
very mountainous terrain ASTER GDEM2 shows a better fit to ANGD stations (RMS=11.3 m) than SRTM 479 CGIAR-CSI v4.1 or SRTM3 USGS (RMS = 15.1 m), which might be linked to the higher spatial resolution 480 of ASTER GDEM2. Over all other (less rough) terrain types, however, SRTM CGIAR-CSI shows superior 481 fit compared with the GCPs. 482
Taking into account only the 229,147 most accurate ANGD stations, CGIAR-CSI SRTM v4.1 clearly shows 483 the best vertical accuracy (RMS=4.4 m) followed by USGS SRTM3 v2.1 (RMS=6.2 m) and ASTER GDEM2 484 (RMS=8.5 m). On the one hand, ASTERGDEM2 is still not comparable to the SRTM DEMs in terms of 485 vertical accuracy. On the other hand, ASTER GDEM2 has improved significantly compared with its 486 predecessor as the comparisons of ASTER GDEM1 with levelling and GPS/levelling heights by Hirt et al. 487 (2010) revealed a RMS of 13.1 m and 15.7 m, respectively. 488
This study demonstrated that the latest freely-available digital elevation models relying on the data of 489 the Shuttle Radar and Topography Mission are mostly superior to the stereoscopic ASTER GDEM2 over 490 Australia. Nevertheless, ASTER GDEM2 can be regarded as a fairly good data base over areas that are 491 not covered by SRTM (between +60°N and +83°N and between +56°S and +83°S) and where SRTM 492 shows shortcomings and voids, e.g. in very mountainous regions. The (truly) global digital elevation 493 model WorldDEM (http://www.astrium-geo.com/worlddem/), which will become available in ~ 2015, 494 will probably set a new milestone in terms of highly-accurate information on Earth’s topography 495 (predicted vertical accuracy: 2 m relative / 10 m absolute). It will be generated from data of TanDEM-496 X (Moreira et al. 2004; Bartusch et al. 2008), another space-borne radar mission. First validation results 497 show that with a block adjustment approach and ground control points as ties even an absolute vertical 498 accuracy of 1–2 m seems possible (Gruber et al. 2012). Unfortunately, WorldDEM will not be free-of-499 charge at resolutions better than 90 m, thus SRTM based DEMs will continue to be of great importance. 500
501
ACKNOWLEDGEMENTS 502
This study was supported by the Australian Research Council (Grant DP120102441) and through 503 funding from Curtin University’s Office of Research and Development. Further, it was created with the 504 support of the Technische Universität München - Institute for Advanced Study, funded by the German 505 Excellence Initiative. We thank Matthew Garthwaite and one anonymous reviewer for the constructive 506 review of our article. 507
508
REFERENCES 509
ABRAMS M., HOOK S. & RAMACHANDRAN B. 2002. ASTER user handbook version 2. Jet Propulsion 510 Laboratory, EROS Data Center, Pasadena CA. 511
BARTUSCH M., BERG H. & SIEBERTZ O. 2008. The TanDEM-X Mission. In: Synthetic Aperture Radar 512 (EUSAR), 2008 7th European Conference on, pp 1–4. 513
BERRY P., PINNOK R., HILTON R. & JOHNSON C. 2000. ACE: a new GDEM incorporating satellite 514 altimeter derived heights. In: ERS-Envisat Symposium – ESA, Gothenburg, ESA 515 Publication SP-461. 516
BERRY P., SMITH R. & BENVENISTE J. 2008. Ace2: the new global digital elevation model. In: IAG 517 International Symposium on Gravity, Geoid & Earth Observation 2008, Chania, Crete, 518 23–27th June 2008. 519
BONTEMPS S., DEFOURNY P., VAN BOGAERT E., ARINO E., KALOGIROU V. & PEREZ J. 2011. GLOBCOVER 520 2009 – Products Description and Validation Report, ESA / UCL. 521
18
CARABAJAL C. 2011. ASTER Global DEM Version 2.0 Evaluation using ICESat Geodetic Ground 522 Control. NASA Goddard Space Flight Center, Greenbelt Maryland. 523
CARROLL D. & MORSE M. 1996. A national digital elevation model for resource and 524 environmental management. Cartography 25, 395–405 525
DEFOURNY P., BICHERON P., BROCKMANN C., BONTEMPS S., VAN BOGAERT E., VANCUTSEM C., HUC M., 526 LEROY M., RANERA F., ACHARD F., DI GREGORIO A. & HEROLD M. O. A. 2009. The first 300-m 527 Global Land Cover Map for 2005 using ENVISAT MERIS time series: a Product of the 528 GlobCover System. In: Proceedings of the 33rd International Symposium on Remote 529 Sensing of Environment (ISRSE), Stresa, Italy. 530
DENKER H. 2004. Evaluation of SRTM3 and GTOPO30 Terrain Data in Germany. In: Jekeli C., 531 Bastos L. & Fernandes J. eds. Gravity, geoid and space-missions, pp 218–223. GGSM 532 2004 IAG International Symposium Porto, Portugal, Springer, Heidelberg. 533
FARR T., ROSEN P., CARO E., CRIPPEN R., DUREN R., HENSLEY S., KOBRICK M., PALLER M., RODRIGUEZ E., 534 ROTH L., SEAL D., SHAFFER S., SHIMADA K., UMLAND J., WERNER M., OSKIN M., BURBANK D. & 535 ALSDORF D. 2007. The shuttle radar topography mission. Reviews of Geophysics 45 536 (RG2004), doi 10.1029/2005RG000183. 537
FORSBERG R. 1984. A study of terrain reductions, density anomalies and geophysical inversion 538 methods in gravity field modelling. 5, Ohio State University. 539
GESH D., OIMOEN M., ZHANG Z., DANIELSON J. & MEYER D. 2011. Validation of the ASTER Global 540 Digital Elevation Model (GDEM) Version 2 over the Conterminous United States. U.S. 541 Geological Survey, Earth Resources Science Center. 542
GRUBER A., WESSEL B., HUBER M. & ROTH A. 2012. Operational TanDEM-X DEM calibration and 543 first validation results. ISPRS Journal of Photogrammetry and Remote Sensing 73, 39–544 49, DOI http://dx.doi.org/10.1016/j.isprsjprs.2012.06.002 545
GUIZAR-SICAIROS M., THURMAN S. & FIENUP J. 2008. Efficient subpixel image registration 546 algorithms. Optical Letters 3, 156–158. 547
HILTON R., FEATHERSTONE W., BERRY P., JOHNSON C. & KIRBY J. 2003. Comparison of digital 548 elevation models over Australia and external validation using ERS-1 satellite radar 549 altimetry. Australian Journal of Earth Sciences 50, 157–168. 550
HIRT C., FILMER M. & FEATHERSTONE W. 2010. Comparison and validation of the recent freely 551 available ASTER-GDEM ver 1, SRTM ver 4.1 and GEODATA DEM-9S ver3 digital 552 elevation models over Australia. In: Hirt et al. (2010), pp 337–347 553
KRIEGER T., CURTIS W. & HAASE J. 2010. Global Validation of the ASTER Global Digital Elevation 554 Model (GDEM) version 2. National Geospatial-Intelligence Agency, USA. 555
LEMOINE F., KENYON S., FACTOR J., TRIMMER N., PAVLIS N., CHINN D., COX C., KLOSKO S., LUTHCKE S., 556 TORRENCE M., WANG Y., WILLIAMSON R., PAVLIS E., RAPP R. & OLSON T. 1998. The 557 Development of the Joint NASA GSFC and NIMA Geopotential Model EGM96. NASA 558 Goddard Space Flight Center, Greenbelt, Maryland, 20771 USA. 559
MARTI U. 2004. Comparison of SRTM data with the national DTMs of Switzerland. In: GGSM 560 2004 – IAG International Symposium Porto, Portugal, Springer Berlin Heidelberg. 561
MCLUCKIE D., NFRAC 2008. Flood risk management in Australia. The Australian Journal of 562 Emergency Management 23 (2), 21–27. 563
MOREIRA A., KRIEGER G., HAJNSEK I., HOUNAM D., WERNER M., RIEGGER S. & SETTELMEYER E. 2004. 564 TanDEM – X: a TerraSAR-X add-on satellite for single-pass SAR interferometry. In: 565 Geoscience and Remote Sensing Symposium, 2004. IGARSS ’04. Proceedings. 2004 IEEE 566 International, vol 2, pp. 1000–1003 vol.2, DOI 10.1109/IGARSS.2004.1368578. 567

19
MÜLLER-WOHLFEIL D.I., LAHMER W., KRYSANOVA V. & BECKER A. 1996. Topography-based 568 hydrological modeling in the Elbe River drainage basin. In: Third International 569 Conference/Workshop on Integrating GIS and Environmental Modeling, Santa Fe, 21–570 26 January 1996, National Center for Geographic Information and Analysis, C.A. 571
REUTER H., NELSON A. & JARVIS A. 2007. An evaluation of void filling interpolation methods for 572 SRTM data. International Journal of Geographic Information Science 21:9, 983–1008. 573
RODRIGUEZ E., MORRIS C., BELZ J., CHAPIN E., MARTIN J., DAFFER W. & HENSLEY S. 2005. An 574 assessment of the SRTM topographic products. JPL D-31639, JPL. 575
TACHIKAWA T., HATO M., KAKU M. & IWASAKI A. 2011a. Characteristics of ASTER GDEM version 2. 576 In: Geoscience and Remote Sensing Symposium (IGARSS), 2011 IEEE International, 577 IEEE, pp. 3657–3660, Vancouver BC. 578
TACHIKAWA T., KAKU M., IWASAKI A., GESCH D., OIMOEN M., ZHANG Z., DANIELSON J., KRIEGER T., CURTIS 579 B., HAASE J., ABRAMS M., CRIPPEN R. & CARABAJAL C. 2011b. ASTER Global Digital Elevation 580 Model Version 2–Summary of Validation Results. Joint Japan–US ASTER Science Team, 581 URL 582 http://www.jspacesystems.or.jp/ersdac/GDEM/ver2Validation/Summary_GDEM2_vali583 dation_report_final.pdf 584
TRUHETZ H. 2010. High resolution wind field modelling over compex topography: analysis and 585 future scenario. PhD thesis, Karl-Franzens-Universität Graz – Wegener Center for 586 Climate and Global Change. 587
USGS 2009. SRTM v2.1 Topography. , USGS, URL 588 http://dds.cr.usgs.gov/srtm/version21/Documentation/SRTMTopo.pdf 589
WYNNE P. & BACCHIN M. 2009. Index of Gravity Surveys (Second Edition). Geoscience Australia 590 Record 2009/07, Canberra ACT. 591
ZWALLY H., SCHUTZ B., ABDALATI W., ABSHIRE J., BENTLEY C., BRENNER A., BUFTON J., DEZIO J., HANCOCK 592 D., HARDING D., HERRING T., MINSTER B., QUINN K., PALM S., SPINHIRNE J. & THOMAS R. 2002. 593 ICESat’s laser measurements of polar ice, atmosphere, ocean, and land. Journal of 594 Geodynamics 34 (3–4), 405–445, doi http://dx.doi.org/10.1016/S0264-3707(02)00042-595 X, URL : http://www.sciencedirect.com/science/article/pii/S026437070200042X 596
597