Embed Size (px)
Citation preview

Department of Chemistry and Chemical Engineering CHALMERS UNIVERSITY OF TECHNOLOGY Gothenburg, Sweden 2019
Comparison of FBRM® and PIA for investigating the precipitation of Kraft lignin
from aqueous solutions: Influence of salt type, concentration, temperature
and pH
Master’s Thesis-Chemistry and Chemical Engineering
Joakim Thorstensson
1
REPORT NO. xxxx/xxxx ???
Comparison of FBRM® and PIA for investigating the precipitation of Kraft lignin from
aqueous solutions: Influence of salt type, concentration, temperature and pH
Joakim Thorstensson
Department of Chemistry and Chemical Engineering
CHALMERS UNIVERSITY OF TECHNOLOGY
Göteborg, Sweden 2019
2
Comparison of FBRM® and PIA for investigating the precipitation of Kraft lignin
from aqueous solutions: Influence of salt type, concentration, temperature
and pH
Joakim Thorstensson
© Joakim Thorstensson, 2019
Technical report no xxxx:xx ???
Department of Chemistry and Chemical Engineering
Chalmers University of Technology
SE-412 96 Göteborg
Sweden
3
Comparison of FBRM® and PIA for investigating the precipitation of Kraft lignin from
aqueous solutions: Influence of salt type, concentration, temperature and pH
Joakim Thorstensson
Department of Chemistry and Chemical Engineering
CHALMERS UNIVERSITY OF TECHNOLOGY
Abstract
In this work, precipitation of softwood Kraft lignin was studied. Two methods for measuring
the particle size distribution were used and compared to each other. The first method has
been successfully used in other studies and is called FBRM® (focused beam reflectance
measurement), which is a laser-based light technique. The other is a new optical measuring
method referred to as particle size analyzer or PIA. The experimental parameters in this study
was temperature, pH, lignin concentration, salt type and concentration. FBRM®
measurements were done in situ in order to gain further understanding of the precipitation.
The effect of salt addition beyond the amount needed for onset of precipitation has also been
studied. The study has been focused on commissioning the PIA-equipment, development of
the PIAs experimental method and analysis of its performance. Analyzing the PIA was done by
comparing the volume based particle size distribution from it with a calculated volume based
particle size distribution from the FBRM® results. The chord length distribution from the
FBRM® was extremely consistent in between all the experiments with the only truly deviating
result coming from a single experiment. The deviating result came from an experiment at
room temperature where the solution underwent gelation. Adding additional salt increased
the chord counts but did not change the chord distribution. The PIA’s results were poor and
inconsistent to begin with, but semi-decent results were obtained after developing the
methodology. The total counts registered by the PIA in a single trial proved to be an indicator
of the results. Good results came from total counts above 1 000 000. The PIA’s video display
was another useful tool for developing the experimental method. The methodology
developed for the PIA worked by initially lowering the lignin concentration. Then the lignin
was dosed or sampled in by turning off selected pumps which led to consistent results. Further
improvements are still needed if the PIA is to be used in laboratory or industrial settings.
Keywords: Lignin, precipitation, FBRM, PIA, chord
4
Contents Background ............................................................................................................................................. 5
Biorefinery/introduction .................................................................................................................... 5
Particle size measurement methods .................................................................................................. 6
Kraft lignin/Kraft process ................................................................................................................... 7
Precipitation/ particle agglomeration of kraft lignin ........................................................................ 9
Experimental ......................................................................................................................................... 10
Method/experiments ....................................................................................................................... 10
Experimental overview ..................................................................................................................... 10
Preparation ....................................................................................................................................... 11
FBRM® ........................................................................................................................................... 13
PIA ................................................................................................................................................. 13
Data treatment/Assumptions .......................................................................................................... 15
Results/discussion ................................................................................................................................ 17
Experiment table .............................................................................................................................. 17
FBRM® ............................................................................................................................................... 18
Course of precipitation .................................................................................................................. 18
Chord distribution ......................................................................................................................... 20
PIA methodology .............................................................................................................................. 22
FBRM® vs PIA .................................................................................................................................... 25
Discussion ............................................................................................................................................. 28
FBRM® ............................................................................................................................................... 28
Evaluation of the PIA ........................................................................................................................ 29
Conclusions ........................................................................................................................................... 31
Future work ........................................................................................................................................... 32
Acknowledgments ................................................................................................................................ 33
Sources .................................................................................................................................................. 34
5
Background
Biorefinery/introduction
Modern society is built on a foundation of cheap and plentiful fossil fuels. These fuels are a
finite resource and are becoming increasingly more expensive to extract (Roeger 2005). As
easily available deposits run out, harder challenges must be met by more expensive
technology to continue extraction. The cost of fossil fuels has increased but there is also an
environmental perspective to consider. Global warming with its resulting climate change is a
concern. The price of crop failure and climate change migrations (Leatherman 2001) are
currently disconnected from the actual price of oil. The cost from such issues will need to be
addressed eventually and can as such be seen as an associated cost to the fossil fuels.
Finding alternatives to fossil fuels is thus of interest. They are however difficult to replace due
to their suitability as fuels and chemical feedstock. Fossil fuels sheer convenience in industrial
processing is also a factor. Progress has and is being made, however. Some examples such as
bio-based plastics, fibers and fuels made from straw, wood, vegetable oil and sugar plants
have all been made with various degrees of efficiency (Aresta, Dibenedetto et al. 2015, Olsson,
Sjöholm et al. 2017). Even if a complete replacement isn’t possible, partially replacing fossil
fuels with bio-based alternatives are a good way to lessen the impact on the climate. An
example is the E95 petrol fuel in Europe where 5 % of the petrol is replace with ethanol.
As the world’s population grows, land usage increases in intensity and in area of land under
cultivation. The raw material used in the biorefinery must thus come from food production
leftovers or more marginal land unsuitable for farming. That means that wood, algae or
straw/grasses (Aresta, Dibenedetto et al. 2015) are of interest as raw feedstock for chemicals
and fuels. As the processes based on these materials develops and demonstrates possibilities
of profitability, industries seeking any advantage over their competitors will find the new
methods very intriguing. The paper industry for example are looking for new opportunities as
the increased digitalization of the world leads to a shrinking newspaper consumption. Shifting
the production into new areas would thus generate profits especially if the raw materials were
previously considered waste. Older mills may even be able to increase production. In many
plants the production bottle neck is the recovery boiler where the black liquor is burnt for
production of electricity and process steam, but also recovery of cooking chemicals. If part of
the biomass can be processed into a market commodity, capacity is freed up in the recovery
boiler that can be used for increased production of the main process. Kraft lignin is a promising
possibility in this regard as lignin is normally burnt in the furnace of Kraft pulp plants.
A bio refinery based on Kraft lignin offers many possibilities but also has challenges that need
to be addressed. Kraft lignin is a very complex molecule with an irregular chemical
composition, shape and size making it difficult to process. Kraft lignin is also distinctly different
from the natural lignin in wood. A recent development is the Lignoboost ™ process which
separates Kraft lignin from the black liquor in the Kraft mill. The Lignoboost ™ process consists
6
of several steps: a Lignin precipitation step, filtration, re-slurring of the filter cake, another
filtration step and a final washing (Öhman, Wallmo et al. 2007). The process produces a lignin
that has a lower ash content and a higher dry content than other alternatives (Wallmo,
Theliander et al. 2009). Products such as carbon fibers (Meek, Penumadu et al. 2016), fuels
and aromatics (Azadi, Inderwildi et al. 2013) are all possible products emerging from Kraft
lignin and the Lignoboost ™ process.
An overview of how the Lignoboost ™ process would be used in an industrial setting goes like
this: a part of the black liquor stream in the Kraft mill is diverted, has its pH lowered, causing
the lignin to precipitate out of the solution. A filtering stage then forms a cake of lignin with a
rather low purity. The cake is re-suspended in the previously used wash water with added
acid. Finally, the slurry is washed again, this time with acidified washing water producing a
cake with very high purity. This process avoids the problems with high filtering resistance in
normal, older filtration and precipitation processes not using acidic washing liquid. As a result,
the need for extremely large amounts of washing water or large filter areas are avoided
(Tomani 2010).
To improve the process further greater understanding is needed regarding particle formation.
Particle formation will be further discussed in the “Precipitation/particle agglomeration of
Kraft lignin” section. The filter cake formation and filtration resistance are highly dependent
on particles size and the size distribution(Tarleton and Wakeman 2005). Investigating these
factors is thus important and have been performed previously (Sewring 2017) by using FBRM®
(focused beam reflectance measurement). In this work FBRM® is used alongside a new
method for determining the particle size distribution. The new method uses a particle size
analyzer called PIA (particle image analyzer) built and owned by Valmet® based on optical
measurement. The particle size distributions from both methods are compared to each other
with the combined result used to deepen the understanding of the lignin precipitation
process. An experimental procedure for using the PIA has been developed over the course of
this work.
Particle size measurement methods
Measuring the precipitation process is of interest from a scientific and an industrial
perspective. FBRM® can be used in situ both in a lab and in a mill. The allocation procedure of
the FBRM® can be adjusted in order to assign more focus on the most likely particle size. For
well mixed solutions with particles that respond well to the chosen laser wavelength it gives
an accurate summary of the particle dimensions. The FBRM® has weaknesses however: It is
unable to measure below one µm and measures the chords of particles, which may be difficult
to convert to particle size in some cases. For a spherical particle, statistic ensure that the
measure chord length will likely correspond rather well to the diameter. Non-spherical
particles chord lengths can however be significantly different to its actual size.
The PIA is also intended to be used in a mill and its suitability for this along with possible
strengths and weaknesses will be investigated. Particle size investigation can be done with
light scattering methods such as the FBRM® as well as optical methods such as image analysis
which the PIA uses. The PIA is of great interest as it has the possibility of measuring the shape
of the lignin particles which the FBRM® is unable to do. The accuracy of the PIA is unknown
7
however and must be investigated. Another issue is the possibility of particles lining up behind
each other as the camera in the PIA takes 2-D images. This possibility and its influence on the
results might be too large for particle-dense solutions.
Sedimentation (Contado, Ravani et al. 2013) and sieving (Plana, Carpentier et al. 2018) are two
other methods that can be used to determine particle size. Both can be done in several ways
using various types of equipment. Sieving is best done with particles that do not stick to each
other after they have formed as it risks forming a cake, capturing particles that would pass
through the apertures. This method is obviously ex situ and works best on larger particles
above 60 µm. Combing sieving with other measurement methods such as electron
microscopes allows a glimpse of how the particles of different sizes look. Sedimentation
requires that the density of the particles is known and cannot be done in situ. Very small
particles in the micrometer range are difficult to measure with sedimentation.
Kraft lignin/Kraft process
Wood is a complex material composed of mostly cellulose, hemicellulose and lignin (Sjöström
1993). The structure of wood varies to a large extent on the type of tree species adding to the
complexity of the material. The two main sub-groupings are softwood, such as pine, and
hardwood, such as oak (Sjöström 1993). Cellulose remains the same among all species while
the hemicellulose and lignin differs between species. Cellulose are chains of glucose units
combined into a homopolysaccharide. The hemicelluloses come in many variants, but there
are trends common to the two types of wood. In softwood the main types of hemicelluloses
are (galacto)glucomannan and arabinoglucoronoxylan. In hardwood the main types are
glucuronxylan and glucomannan.
Lignin is a very diverse and branched polymer constituted by phenylpropane units. There are
three monolignols units guaiacyl, syringyl and p-hydroxyphenyl that can bond with the
propane units, resulting in a very complex molecule with a diverse molecular structure. The
most common monolignol unit in the lignin depends upon which type of wood it is.
Polymerized guaiacyl units or coniferyl alcohol is the most common in softwood. Syringyl
propane, sinapyl alchohol and guicacyl propane is more common in hardwood with guiacyl
and sinapyl being the most common with different ratios depending upon the tree species
(Higuchi 1997). Complex radical reactions catalyzed by enzymes combine these molecules,
constructing the final lignin molecule. These units are connected to each other by covalent
carbon-carbon or ether bonds of which approximately half of all bonds is the β-O-4 bond
depending upon tree type. Soft and hardwood also have different ratios of the monomers to
each other. The irregular manner of these bonds is what forms the branching and
unsymmetrical structure of the larger lignin molecule (Sjöström 1993).
Adding to the complexity of the overall lignin molecule are the different functional groups
present. Methoxyl, phenolic hydroxyl, aliphatic alcohol and carboxyl groups are all present in
various amounts depending upon the wood species. There are other, rarer groups adding to
the lignin molecules complexity. All these variations and option come together with a marked
structural difference in the lignin depending upon where in the cell it comes from. Lignin is
also bonded to the carbohydrates present in the cell i.e. hemicelluloses, named lignin
carbohydrate complexes LCC’s.(Sjöström 1993)
8
In the pulping process the structure of lignin changes greatly, from native lignin to what is
referred to as technical lignin e.g. kraft lignin (Sjöström 1993), which is of interest in this work.
The kraft lignin is formed as a result of the kraft pulping process. The Kraft pulping process is
as follows (Sjöström 1993): Wood chips enter a impregnation chamber where the cooking
chemicals impregnate the chips. Then the chips enter the digester and are heated up to the
cooking temperature (150-170 °C) at elevated pressure. It is in the digester that the cooking
reactions take place. Controlling the temperature, time and cooking chemicals present is of
great importance to ensure a high yield of cellulose and hemicellulose. Lignin have been
treated as an as a byproduct as the main purpose of the cooking have been to separate the
primary product cellulosic fibers and hemicelluloses from the lignin.
The highly alkaline conditions in the digester causes the cooking chemicals, NaOH and Na2S to
react with the lignin. The produced kraft lignin will thus contain some of the sulfur from the
Na2S. As the main purpose of the cooking is to delignify the pulp, a great quantity of the β-O-
4 bonds are cleaved resulting in an increase of the number phenolic hydroxyl groups. This
obviously alters characteristics of the kraft lignin molecules from the native counterparts.
There are other reactions occurring to varying degrees but the most common one is the
breaking of the β-O-4 bond mentioned above. There are also reactions with lignin molecules
containing β-aryl ether bonds that results in different compounds depending upon the present
molecules in the local environment. Ether bonds can be cleaved by hydroxide ions, mostly
resulting in formaldehyde. Lignin can be demethylated by hydrogen sulfide ions and have a
variety of possible condensation reactions. These condensation reaction links phenolic groups
together, slowing the delignification (Sjöström 1993).
After the kraft process the kraft lignin is still present inside the wood cell necessitating
transportation out of it. Mass transportation occurs here by diffusion, with the smaller
molecules emerging faster from the wood tissue(Sjöström 1993). The resulting liquor is then
separated from the pulp in the washing stage resulting in black liquor. Various separation
stages are used to remove pollutants and larger particles/solids before proceeding to the
extraction of lignin from the black liquor, e.g. by means of the Lignoboost™ process. The
concentrated liquor entering the recovery boiler has a dry content around 70 percent or
higher. In general, some 40-50 % of the organic material in the black liquor is various forms of
kraft lignin. About a third is various hydroxyl acids. Formic acid, acetic acid, extractives and
other compounds makes up the rest of the organic matter. The remaining cooking chemicals
are present as various inorganic ions. The general characteristics of kraft lignin follow certain
trends but vary widely: More phenolic hydroxyl and carboxyl groups are present after the
pulping process. The bonds between aromatic rings have also been changed (Sjöström 1993).
The process of acidification of a concentrated black liquor to precipitate lignin have been
known for some time(Merewether 1961). Lignoboost™ is a far more effective process,
rendering a higher yield with lower ash content and at a lower cost due to lower filter areas
needed and less acidic washing required (Tomani 2010). The Lignoboost™ process then
separates solid kraft lignin from the liquor through filtration. Consequently, since solid
material has to be formed, the solubility of the kraft lignin is of vital importance(Zhu, Westman
et al. 2014). The overall kraft lignin is a molecule with a negatively charged surface at a high
9
pH: this is due to the ionizable groups being ionized at sufficiently high pH. The temperature
at precipitation also have an effect, as lignin precipitation yield increases as the temperature
decreases. Around 85 °C precipitated lignin also becomes ”soft” and ”tacky” (Uloth 1989).
Moreover, the size or molecular weight of the lignin macromolecules influences the solubility
(Zhu, Westman et al. 2014).
Precipitation/ particle agglomeration of kraft lignin
Experiments indicate that phenolic groups and ionization of said groups are a critical factor
for the solubility of kraft lignin in aqueous solutions (Sewring 2017). Increased ion strength
increases the yield of precipitated lignin and so does a lower pH. The temperature also has an
effect, e.g. it affects the activity of the hydrogen ions. Other temperature effects may be
possible but is not certain as literature indicate. Lower pH increases the amount of small lignin
molecules precipitated which may be due to those having a larger ratio of phenolic hydroxyl
groups (Zhu, Westman et al. 2014).
A kraft lignin macromolecule has a very complex and unregular structure but some particular
properties are suggested to be important for precipitation(Sjöström 1993). The molecule has
many ionized groups that orient themselves outwards, preventing the separate molecules
from agglomerating and precipitating out of the solutions. To precipitate the lignin, the
solubility is decrease by protonation of phenolic groups as negatively charged phenolic groups
play a critical role for the repulsive forces between lignin macromolecules and particles. With
enough H+ ions in the aqueous phase the phenolic groups are protonated forming a new near
neutral surface layer. When the surface has been sufficiently protonated the van der Waals
and other hydrophobic forces dominate the overall interaction. The molecules then
aggregate, forming solid particles which may grow in size and/or agglomerate further, i.e.
precipitating out of the solution(Sewring 2017).
10
Experimental
Method/experiments
The experimental procedure was as follows: first solid lignin blocks were ground to powder
and dissolved in a mixture of distillated water and sodium hydroxide. The sodium
concentration was set to 0,8 molal with the lignin making up 18 percent of the total weight.
The concentrations of sodium and lignin were diluted to half of the above-mentioned values
by using distilled water. The solution was then filtered using regenerated cellulose filter paper.
After that the solution is precipitated using sodium chloride (6 M) and hydrochloric acid or
sodium sulfate and sulphuric acid (6 M). During the precipitation the FBRM® was used to
monitor the formed particles. The final step was to analyze the obtained lignin suspension
from the precipitation-stage using the PIA (particle image analyzer). The PIA needs to dilute
the suspension in order to be able to distinguish individual particle. The dilution liquid used
was a mix of distillated water and sodium chloride or disodium sulfate, corresponding to the
salt used in the precipitation. The pH of the dilution liquid was matched to the pH of the
suspension of precipitated lignin using sodium hydroxide and the same acid as in the
precipitation. A scheme of the process is shown in Figure 1.
Figure 1:Flow scheme of how the experiments were performed
The experimental procedure conducted in this work is similar to an earlier study (Sewring
2017). The lignin used in all experiments is a softwood kraft lignin produced at a Nordic pulp
mill extracted by the LignoboostTM process. The lignin used in these experiments comes from
the same batch that was characterized in (Aminzadeh, Lauberts et al. 2018): The ionisable
groups on the lignin, phenolic and carboxylic groups were found in contents of 4,27 mmol/g
and 0,45 mmol/g respectively. The aqueous solution for the experiments were made by ball-
milling lignin and mixing it with deionized water and NaOH (Sigma Aldrich, purity ≥ 98%). The
salt used in the aqueous solution to achieve precipitation and increase salt concentration level
was NaCl (Sigma Aldrich, purity ≥99,5%) and Na2SO4 (Fisher Chemical, purity ≥99,5%). The
same salt used in the dilution liquid was NaCl (VWR chemicals, assay 100%) and Na2SO4 (VWR
chemicals, assay ≥98%) mixed with deionized water. The acid used for acidification was a 6-
molar solution of HCL (VWR chemicals, 37%) and H2SO4 (Emsure, 95-97%). The pH
adjustments to the dilution liquid was done by addition of NaOH (Sigma Aldrich, purity ≥ 98%)
tablets and respective acid for the experiment.
Experimental overview
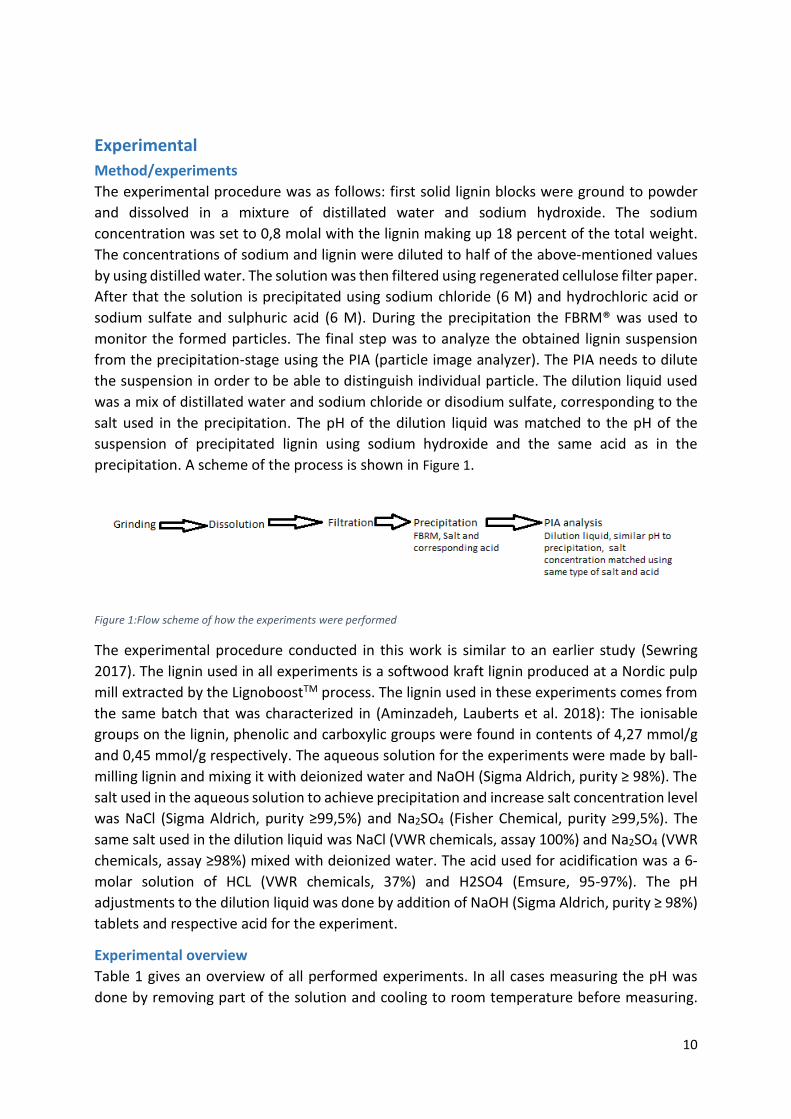
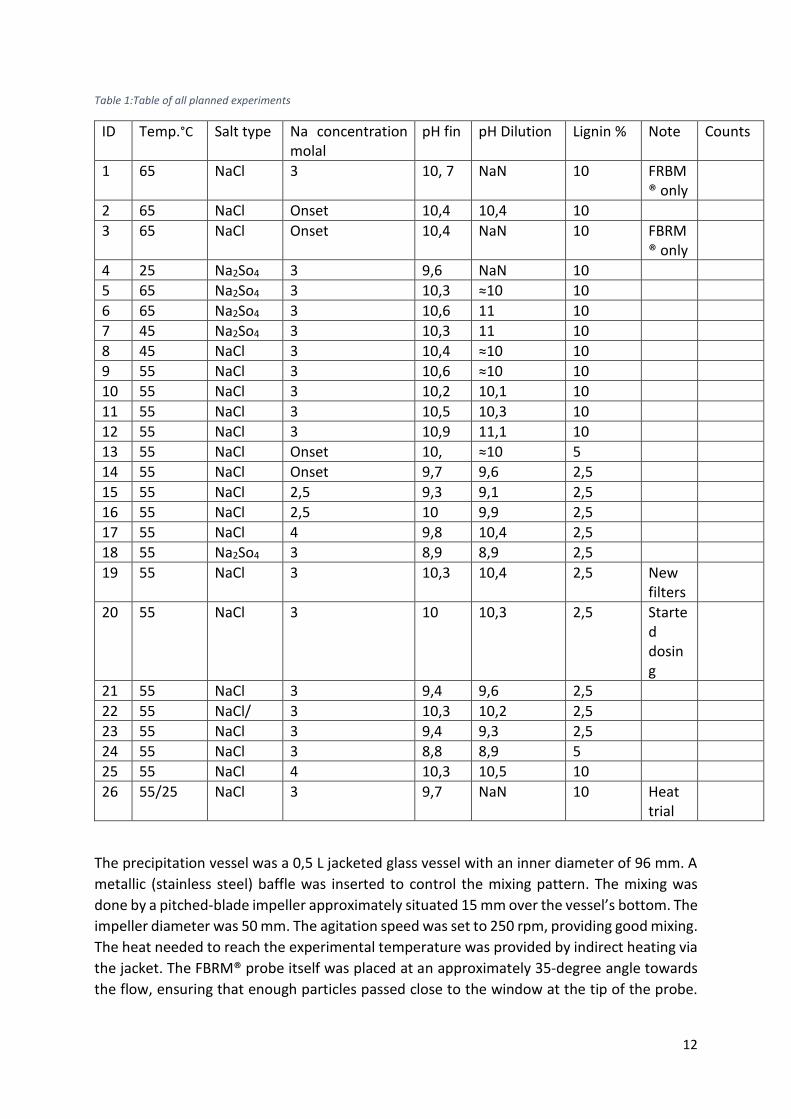
Table 1 gives an overview of all performed experiments. In all cases measuring the pH was
done by removing part of the solution and cooling to room temperature before measuring.
11
The sample was then returned to the vessel. The temperature of the samples for the pH-
measurements varied with the lowest at 20°C and highest at 27°C. In general, the lignin
suspension used in the PIA would be at room temperature, somewhere between 23 and 25
degrees Celsius. The temperature of the dilution liquid was 20-22 degrees °C. The salt
concentration in table 1 is the final concentration in the aqueous phase of the lignin
suspension. The salt concentration was 3 molal in the dilution liquid for all experiments except
the one where the lignin suspension reached a 4 molal concentration in which the dilution
liquid concentration was also prepared correspondingly.
Some experiments were conducted to reach the onset of formation of micron-sized particles
while others proceeded beyond that. Experiment 4 was carried out without heating.
Experiment 26 was carried out to see if lowering the temperature after onset had occurred
had any effect. The experiment reached onset, was salted until final concentration was
reached and was then left under agitation in the precipitation vessel overnight. The lignin
concentration in the experiments started at 10 % to compare with previous studies (Sewring
2017). As insight was gained into the operation of the PIA over the course of this study a
decision was made to start lowering the lignin concentration. The concentration was halved
after experiment 12 and then halved again after experiment 13. As a better experimental
method for the PIA was developed and proper results were obtained the lignin concentration
was raised to 5 and 10 percent again.
Preparation Lignin is dissolved in an aqueous solution of 1 M NaOH and mixed at least over night before
being filtrated at room temperature. Experiments 1 through 18 were filtrated with a
regenerated cellulose filter of type 184 Sartorius stedim, with a pore size of 0,045 µm. The
later experiments used filters from Munktell, quality 5, diameter 100 mm. The filtration was
performed by using a Buchner funnel inserted into the neck of a glass flask by vacuum suction.
The rate of material caught by the filter varied as the success of every filtration was not
uniform. The most common error occurred when the filter paper did not seal uniformly but
left a small flap which allowed the solution to bypass much of the filter. The lignin content was
10, 5 and 2,5 % in different experiments but all the solution had a molar content of NaOH of
1 Molar.
12
Table 1:Table of all planned experiments
ID Temp.°C Salt type Na concentration molal
pH fin pH Dilution Lignin % Note Counts
1 65 NaCl 3 10, 7 NaN 10 FRBM® only
2 65 NaCl Onset 10,4 10,4 10
3 65 NaCl Onset 10,4 NaN 10 FBRM® only
4 25 Na2So4 3 9,6 NaN 10
5 65 Na2So4 3 10,3 ≈10 10
6 65 Na2So4 3 10,6 11 10
7 45 Na2So4 3 10,3 11 10
8 45 NaCl 3 10,4 ≈10 10
9 55 NaCl 3 10,6 ≈10 10
10 55 NaCl 3 10,2 10,1 10
11 55 NaCl 3 10,5 10,3 10
12 55 NaCl 3 10,9 11,1 10
13 55 NaCl Onset 10, ≈10 5
14 55 NaCl Onset 9,7 9,6 2,5
15 55 NaCl 2,5 9,3 9,1 2,5
16 55 NaCl 2,5 10 9,9 2,5
17 55 NaCl 4 9,8 10,4 2,5
18 55 Na2So4 3 8,9 8,9 2,5
19 55 NaCl 3 10,3 10,4 2,5 New filters
20 55 NaCl 3 10 10,3 2,5 Started dosing
21 55 NaCl 3 9,4 9,6 2,5
22 55 NaCl/ 3 10,3 10,2 2,5
23 55 NaCl 3 9,4 9,3 2,5
24 55 NaCl 3 8,8 8,9 5
25 55 NaCl 4 10,3 10,5 10
26 55/25 NaCl 3 9,7 NaN 10 Heat trial
The precipitation vessel was a 0,5 L jacketed glass vessel with an inner diameter of 96 mm. A
metallic (stainless steel) baffle was inserted to control the mixing pattern. The mixing was
done by a pitched-blade impeller approximately situated 15 mm over the vessel’s bottom. The
impeller diameter was 50 mm. The agitation speed was set to 250 rpm, providing good mixing.
The heat needed to reach the experimental temperature was provided by indirect heating via
the jacket. The FBRM® probe itself was placed at an approximately 35-degree angle towards
the flow, ensuring that enough particles passed close to the window at the tip of the probe.
13
This placement of the probe prevents lignin clogging of the window and thus poor
measurement.
Most of the FBRM® experiment were designed to salt out the lignin. The other experiments
had the salt added beforehand and was then acidified with acid until precipitation. Salting out
a solution works by increasing the concentration of the counter ions until they cause the lignin
particles to agglomerate. This was done by lowering the pH of the solution to approximately
10 and then salting until onset occurs. Onset occurs when the total amount of chords increases
rapidly and stable particles larger than 1 µm are recorded.
Some of the experiments have more salt added after the initial precipitation occurs to
investigate if and how the solution/particles changes upon further increase in salt
concentration. At the end the pH value was measured, and the dilution liquid was adjusted to
the approximately same value. This is done with NaOH tablets and the same acid used in the
lignin solution precipitation.
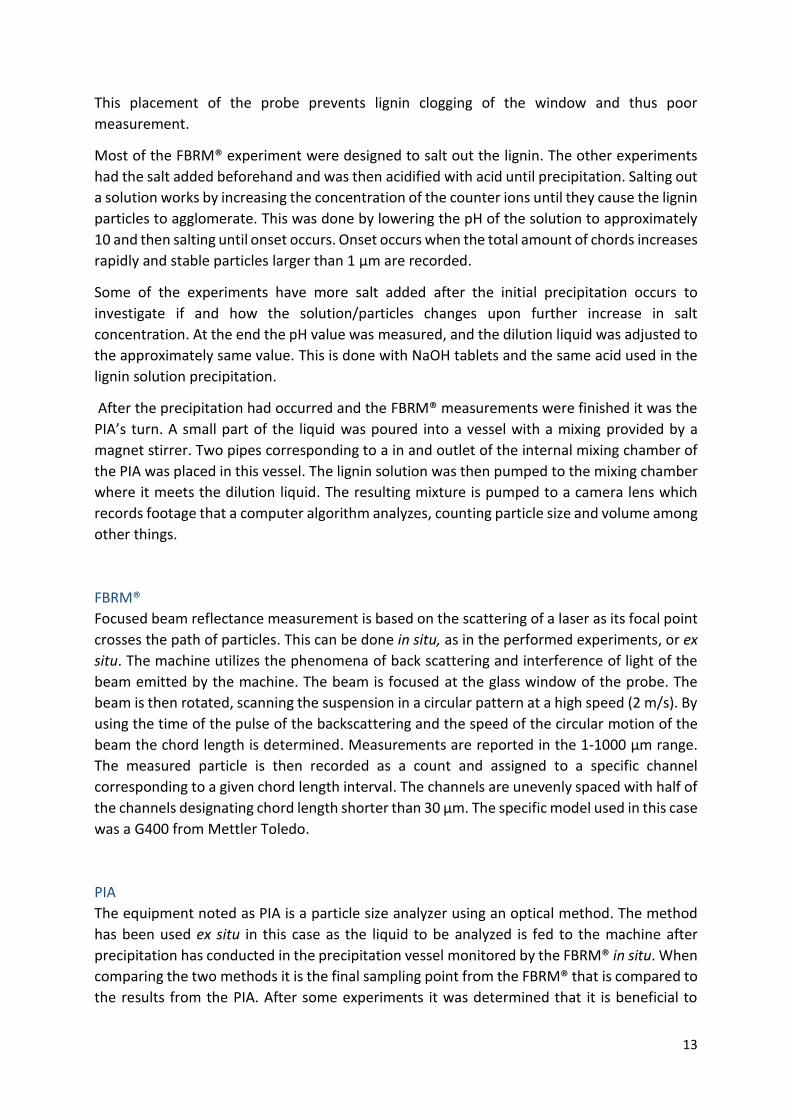
After the precipitation had occurred and the FBRM® measurements were finished it was the
PIA’s turn. A small part of the liquid was poured into a vessel with a mixing provided by a
magnet stirrer. Two pipes corresponding to a in and outlet of the internal mixing chamber of
the PIA was placed in this vessel. The lignin solution was then pumped to the mixing chamber
where it meets the dilution liquid. The resulting mixture is pumped to a camera lens which
records footage that a computer algorithm analyzes, counting particle size and volume among
other things.
FBRM®
Focused beam reflectance measurement is based on the scattering of a laser as its focal point
crosses the path of particles. This can be done in situ, as in the performed experiments, or ex
situ. The machine utilizes the phenomena of back scattering and interference of light of the
beam emitted by the machine. The beam is focused at the glass window of the probe. The
beam is then rotated, scanning the suspension in a circular pattern at a high speed (2 m/s). By
using the time of the pulse of the backscattering and the speed of the circular motion of the
beam the chord length is determined. Measurements are reported in the 1-1000 µm range.
The measured particle is then recorded as a count and assigned to a specific channel
corresponding to a given chord length interval. The channels are unevenly spaced with half of
the channels designating chord length shorter than 30 µm. The specific model used in this case
was a G400 from Mettler Toledo.
PIA
The equipment noted as PIA is a particle size analyzer using an optical method. The method
has been used ex situ in this case as the liquid to be analyzed is fed to the machine after
precipitation has conducted in the precipitation vessel monitored by the FBRM® in situ. When
comparing the two methods it is the final sampling point from the FBRM® that is compared to
the results from the PIA. After some experiments it was determined that it is beneficial to
14
keep the lignin suspension under agitation during any duration of time between the
precipitation-stage and the PIA-procedure in order to prevent sedimentation.
The machine itself is a combination of different devices. The camera is a Valmet® automation
microscope with a 0,5 mm cuvette. A Valmet® PC operates the camera and the computer
program it uses to count and determine the size of the particles in the solution. There are four
pumps which distribute the two liquid streams. There is the dilution pump, an IWAKI EWN-
B31VC-ER feeding dilution liquid into the system. The dilution liquid is designed to have a
sodium ion concentration as close as possible to that of the lignin solution. In the onset
experiments the lignin solution was precipitated but no more salt added after that. The
dilution solution however had a salt concentration of 3 Molar. The pH is adjusted using NaOH
tablets and the same acid as used in the FBRM® i.e. HCl or H2SO4. The dilution tank can heat
the dilution liquid up to 30 degrees. The heating elements was not used as 30 degrees is far
below the temperature in the precipitation stage. In addition to the temperature difference
the heating element was small and would take a long time to heat the tank to desired
temperature.
The camera pump is a Grundfoss Alldos DDA 17-7-FCM PV/T/C-F-31U2U2FG pump and supply
the mixed liquid from the mixing vessel. The mixing vessel mixes dilution liquid from dilution
tank and sample liquid pumped in by the sample pump, a Watson Marlow 323S/D Perisferal
pump. The sample pump pumps liquid from an internal circuit that that is pumped around by
the circulation pump. The circulation pump Watson Marlow 530S Perisferal pumps is thus the
one which pumps in the sample liquid in the first place. As this is a new type of device under
development the experimental method was slowly developed over the course of the study.
The camera works by initially taking a background image. The image is then referred to as a
reference for incoming measurements. It is thus of utmost importance that the image is clear
from impurities. The camera then films the liquid and a computer algorithm compares the
recorded images with the saved background image. The program then begins processing the
video/pictures during a set time interval. A total length is decided which is then divided up
into active segments where the computer calculates and inactive ones where it does not.
Multiple such time intervals can be processed during an experiment, each yielding a set
number of results.
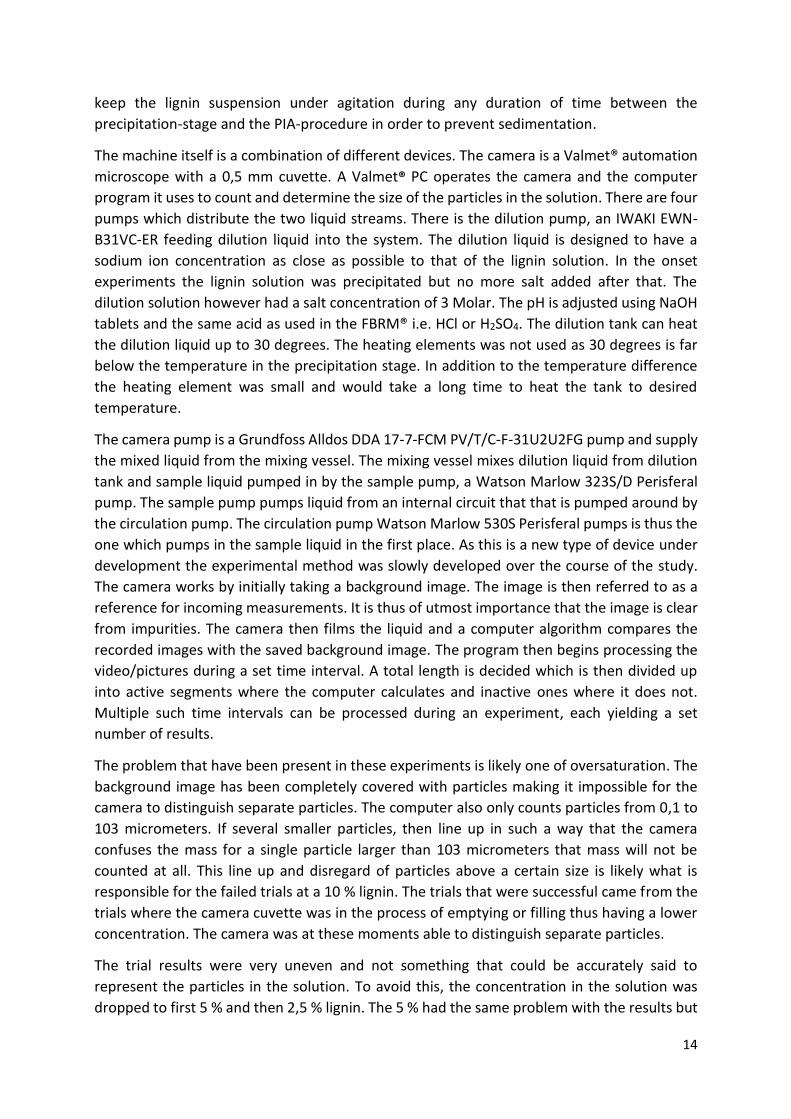
The problem that have been present in these experiments is likely one of oversaturation. The
background image has been completely covered with particles making it impossible for the
camera to distinguish separate particles. The computer also only counts particles from 0,1 to
103 micrometers. If several smaller particles, then line up in such a way that the camera
confuses the mass for a single particle larger than 103 micrometers that mass will not be
counted at all. This line up and disregard of particles above a certain size is likely what is
responsible for the failed trials at a 10 % lignin. The trials that were successful came from the
trials where the camera cuvette was in the process of emptying or filling thus having a lower
concentration. The camera was at these moments able to distinguish separate particles.
The trial results were very uneven and not something that could be accurately said to
represent the particles in the solution. To avoid this, the concentration in the solution was
dropped to first 5 % and then 2,5 % lignin. The 5 % had the same problem with the results but
15
was deemed to be a step in the right direction. The 2,5-percentage produced even and visible
results during the experiments. The results were not at all close to the FBRM’s results.
The volume distribution had seemingly formed a mostly even ridge over all measured particles
instead of a similar curve as seen in the FBRM® results. When compared to the results from
the FBRM® it was clear that something more was needed. Trying to vary the pumping speed
did not appear to produce any visible changes. Eventually a method was found. The circulation
pump allowed to introduce some lignin solution and then turned off. This diluted the solution
entering the camera house enough to produce even and repeatable results. The volume
distribution formed a curve and reported much larger number of particles than what had been
previously had. This was initially done with 2,5 % percent. Increasing the lignin concentration
to 5% yielded even larger counts and repeatable results. Finally, the same method was tried
with 10 % to no success.
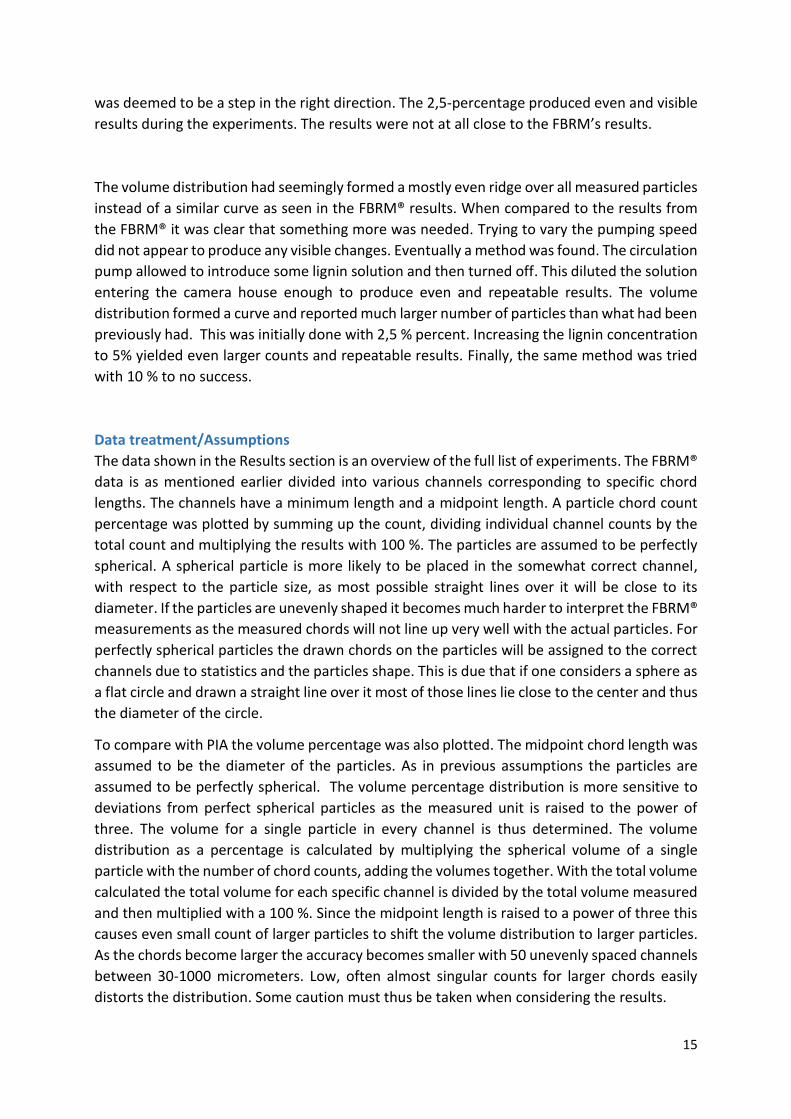
Data treatment/Assumptions
The data shown in the Results section is an overview of the full list of experiments. The FBRM®
data is as mentioned earlier divided into various channels corresponding to specific chord
lengths. The channels have a minimum length and a midpoint length. A particle chord count
percentage was plotted by summing up the count, dividing individual channel counts by the
total count and multiplying the results with 100 %. The particles are assumed to be perfectly
spherical. A spherical particle is more likely to be placed in the somewhat correct channel,
with respect to the particle size, as most possible straight lines over it will be close to its
diameter. If the particles are unevenly shaped it becomes much harder to interpret the FBRM®
measurements as the measured chords will not line up very well with the actual particles. For
perfectly spherical particles the drawn chords on the particles will be assigned to the correct
channels due to statistics and the particles shape. This is due that if one considers a sphere as
a flat circle and drawn a straight line over it most of those lines lie close to the center and thus
the diameter of the circle.
To compare with PIA the volume percentage was also plotted. The midpoint chord length was
assumed to be the diameter of the particles. As in previous assumptions the particles are
assumed to be perfectly spherical. The volume percentage distribution is more sensitive to
deviations from perfect spherical particles as the measured unit is raised to the power of
three. The volume for a single particle in every channel is thus determined. The volume
distribution as a percentage is calculated by multiplying the spherical volume of a single
particle with the number of chord counts, adding the volumes together. With the total volume
calculated the total volume for each specific channel is divided by the total volume measured
and then multiplied with a 100 %. Since the midpoint length is raised to a power of three this
causes even small count of larger particles to shift the volume distribution to larger particles.
As the chords become larger the accuracy becomes smaller with 50 unevenly spaced channels
between 30-1000 micrometers. Low, often almost singular counts for larger chords easily
distorts the distribution. Some caution must thus be taken when considering the results.

16
The PIA gives a list of data concerning various properties of the particle solution. The data
used is the volume distribution. This data is given in the form of a list of volume percentages.
The data is divided up into 1 micrometer intervals from 0 to 103 micrometers. The volume
percentages are then plotted in Matlab® in to ensure a constant x axis. These are the plots in
the results.
17
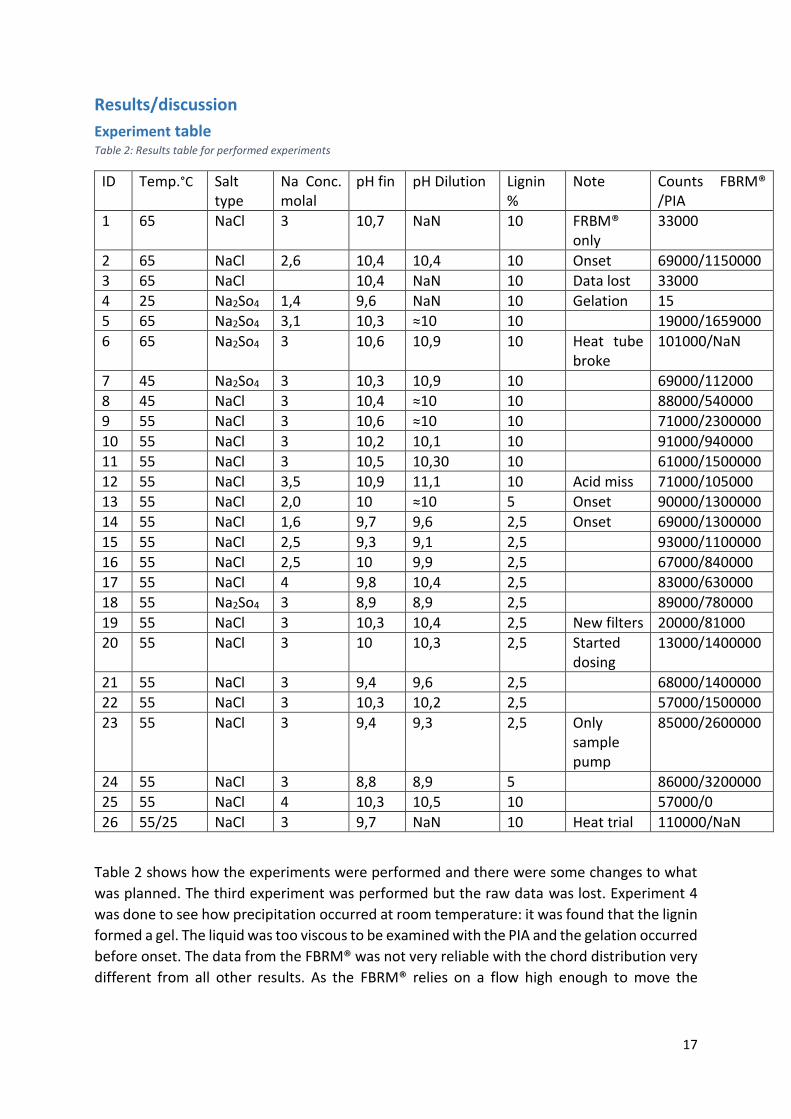
Results/discussion
Experiment table Table 2: Results table for performed experiments
ID Temp.°C Salt type
Na Conc. molal
pH fin pH Dilution Lignin %
Note Counts FBRM® /PIA
1 65 NaCl 3 10,7 NaN 10 FRBM® only
33000
2 65 NaCl 2,6 10,4 10,4 10 Onset 69000/1150000
3 65 NaCl 10,4 NaN 10 Data lost 33000
4 25 Na2So4 1,4 9,6 NaN 10 Gelation 15
5 65 Na2So4 3,1 10,3 ≈10 10 19000/1659000
6 65 Na2So4 3 10,6 10,9 10 Heat tube broke
101000/NaN
7 45 Na2So4 3 10,3 10,9 10 69000/112000
8 45 NaCl 3 10,4 ≈10 10 88000/540000
9 55 NaCl 3 10,6 ≈10 10 71000/2300000
10 55 NaCl 3 10,2 10,1 10 91000/940000
11 55 NaCl 3 10,5 10,30 10 61000/1500000
12 55 NaCl 3,5 10,9 11,1 10 Acid miss 71000/105000
13 55 NaCl 2,0 10 ≈10 5 Onset 90000/1300000
14 55 NaCl 1,6 9,7 9,6 2,5 Onset 69000/1300000
15 55 NaCl 2,5 9,3 9,1 2,5 93000/1100000
16 55 NaCl 2,5 10 9,9 2,5 67000/840000
17 55 NaCl 4 9,8 10,4 2,5 83000/630000
18 55 Na2So4 3 8,9 8,9 2,5 89000/780000
19 55 NaCl 3 10,3 10,4 2,5 New filters 20000/81000
20 55 NaCl 3 10 10,3 2,5 Started dosing
13000/1400000
21 55 NaCl 3 9,4 9,6 2,5 68000/1400000
22 55 NaCl 3 10,3 10,2 2,5 57000/1500000
23 55 NaCl 3 9,4 9,3 2,5 Only sample pump
85000/2600000
24 55 NaCl 3 8,8 8,9 5 86000/3200000
25 55 NaCl 4 10,3 10,5 10 57000/0
26 55/25 NaCl 3 9,7 NaN 10 Heat trial 110000/NaN
Table 2 shows how the experiments were performed and there were some changes to what
was planned. The third experiment was performed but the raw data was lost. Experiment 4
was done to see how precipitation occurred at room temperature: it was found that the lignin
formed a gel. The liquid was too viscous to be examined with the PIA and the gelation occurred
before onset. The data from the FBRM® was not very reliable with the chord distribution very
different from all other results. As the FBRM® relies on a flow high enough to move the
18
particles past the probe window the results from the viscous solution is not trustworthy. The
gelation was also likely built up of a network of particles smaller than 1 µm.
From experiment 5 to 20 various pumping ratios were tried in order to improve the results
from the PIA, but no obvious improvements were obtained from those changes. The real
changes instead came from the variation of the lignin concentration. As of experiment 20 a
new method of running the PIA was tried. The method worked by dosing in the sample liquid
into the mixing chamber. The circulation and sample pump ran for a short time and then was
then turned off. Further improvements came during experiment 23 when only the circulation
pump was turned off. With a working method the concentration was restored to five percent
and then ten percent. The lignin concentration of five percent produced reliable results, but
the 10 percent solution produced blanks only.
In the final experiment the lignin was precipitated at 55 °C. After waiting a few hours to allow
the chord distribution to reach a steady state the heating was turned off. This was done to see
if and how the lignin solution would change.
FBRM®
Course of precipitation
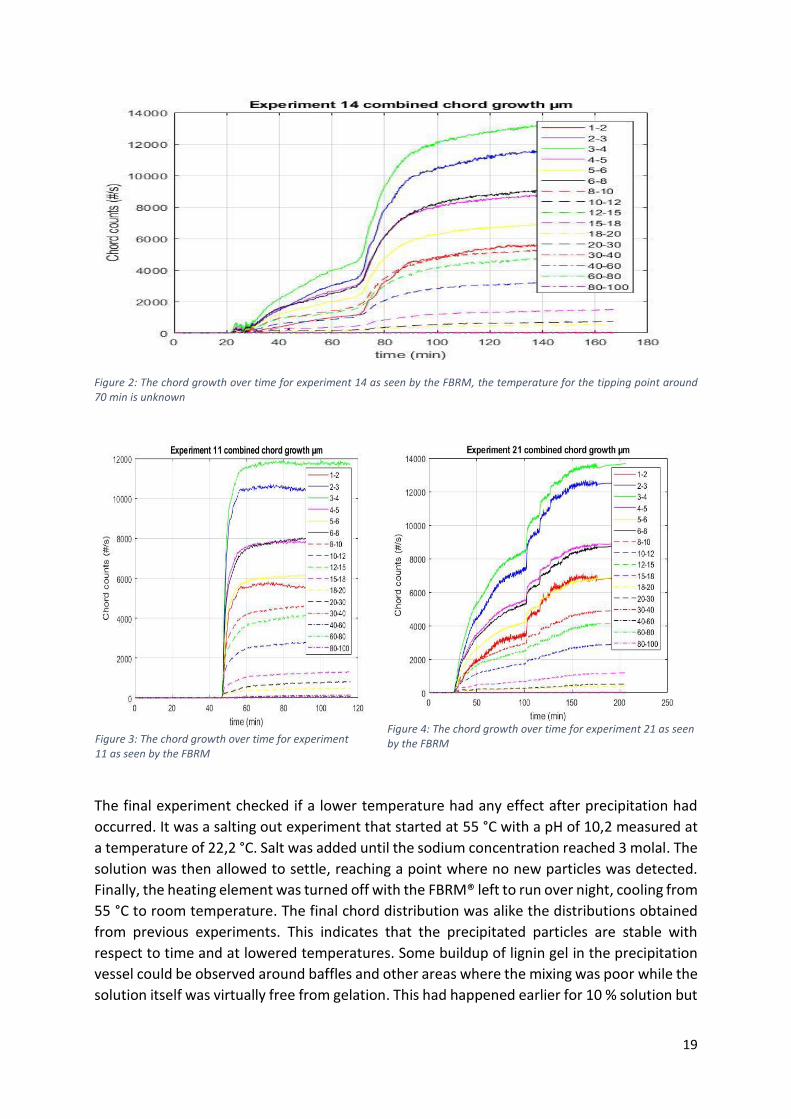
In general, the course of precipitation occurred in two forms. An initial rapid growth followed
by stabilization with a slight decline in some cases. The other form was a slower growth that
was more constant and tapered off at steady state. The growth in Error! Reference source not
found. is of the second type. The growth that happened in experiment 11 as shown in Error!
Reference source not found. is of the first type. No clear correlation to pH, salt concentration
or temperature was found. Instead the likely reason for the different forms is how far beyond
onset the solution is when precipitation occurs. How much more salt or acid is introduced at
once into the solution beyond what is needed for onset. The closer to the actual precipitation
point the slower the growth is. A solution condition that has jumped beyond the onset point
instead of closing in on it is likely to have the type of rapid growth that is seen in Error!
Reference source not found.. The addition of salt after onset had occurred gave an initial jump
in recorded chords that stabilized but did not shift the distribution. At the investigated
conditions onset in general seemed to occur around 1,5 molal of sodium ions and around a
pH of 10 and a temperature higher than 25°C. The actual system conditions at onset point was
not determined.
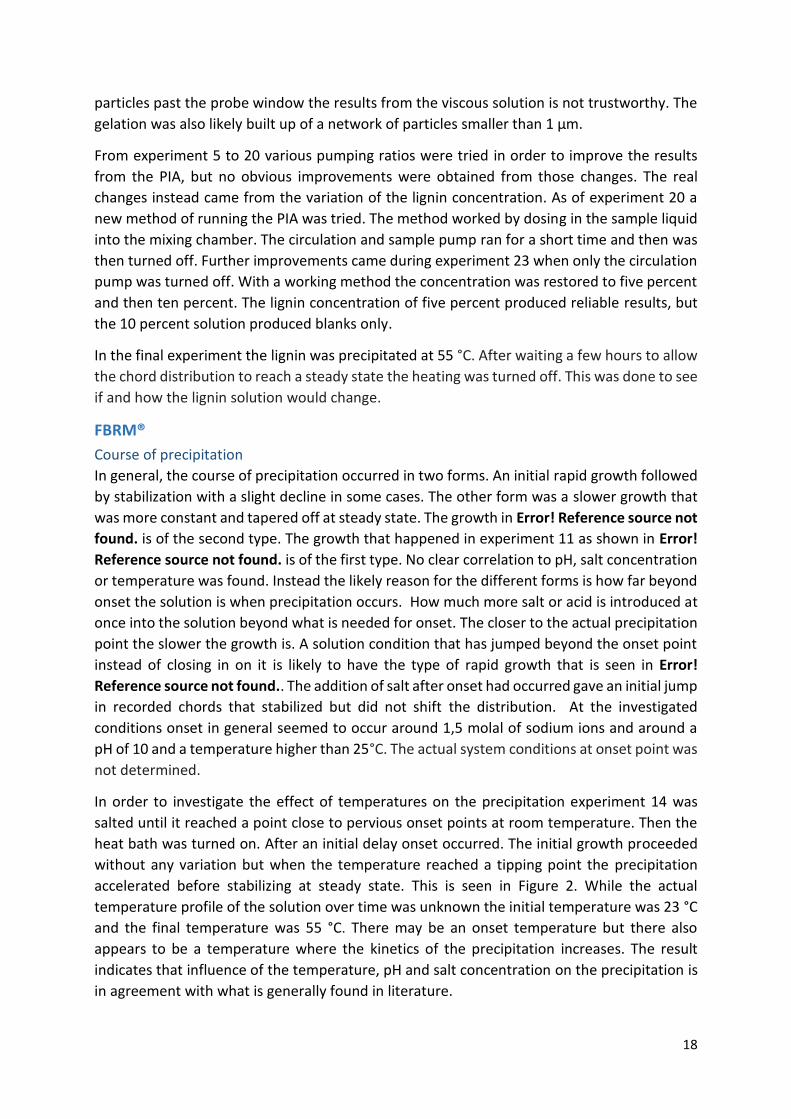
In order to investigate the effect of temperatures on the precipitation experiment 14 was
salted until it reached a point close to pervious onset points at room temperature. Then the
heat bath was turned on. After an initial delay onset occurred. The initial growth proceeded
without any variation but when the temperature reached a tipping point the precipitation
accelerated before stabilizing at steady state. This is seen in Figure 2. While the actual
temperature profile of the solution over time was unknown the initial temperature was 23 °C
and the final temperature was 55 °C. There may be an onset temperature but there also
appears to be a temperature where the kinetics of the precipitation increases. The result
indicates that influence of the temperature, pH and salt concentration on the precipitation is
in agreement with what is generally found in literature.
19
Figure 2: The chord growth over time for experiment 14 as seen by the FBRM, the temperature for the tipping point around 70 min is unknown
The final experiment checked if a lower temperature had any effect after precipitation had
occurred. It was a salting out experiment that started at 55 °C with a pH of 10,2 measured at
a temperature of 22,2 °C. Salt was added until the sodium concentration reached 3 molal. The
solution was then allowed to settle, reaching a point where no new particles was detected.
Finally, the heating element was turned off with the FBRM® left to run over night, cooling from
55 °C to room temperature. The final chord distribution was alike the distributions obtained
from previous experiments. This indicates that the precipitated particles are stable with
respect to time and at lowered temperatures. Some buildup of lignin gel in the precipitation
vessel could be observed around baffles and other areas where the mixing was poor while the
solution itself was virtually free from gelation. This had happened earlier for 10 % solution but
Figure 3: The chord growth over time for experiment 11 as seen by the FBRM
Figure 4: The chord growth over time for experiment 21 as seen by the FBRM
20
not to this extent, the experiment that underwent gelation being the exception. Some buildup
of gelatinous material happened during all the previous experiments with lower lignin
concentrations producing smaller amounts of gelation. The larger build up was thus likely due
to the experiments longer timespan. Lignin sedimentation and stickiness likely causes it to
attach to areas where the turbulence is not as strong and then start growing over time.
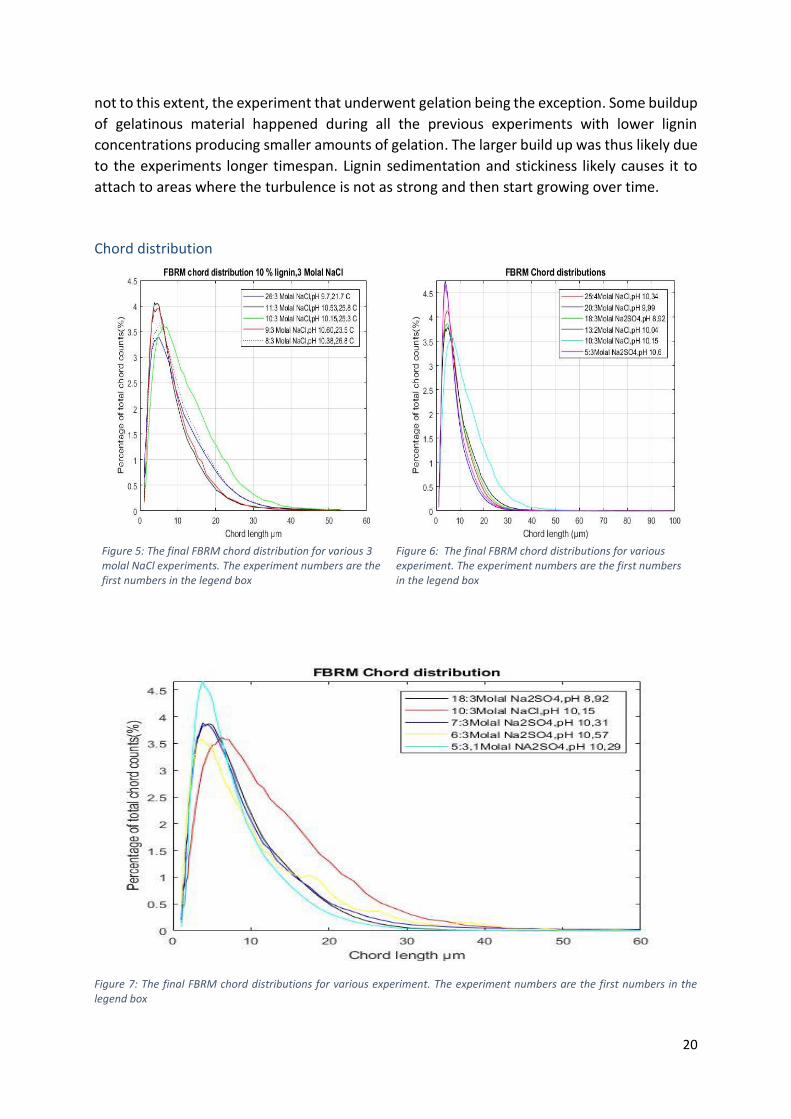
Chord distribution
Figure 5: The final FBRM chord distribution for various 3 molal NaCl experiments. The experiment numbers are the first numbers in the legend box
Figure 6: The final FBRM chord distributions for various experiment. The experiment numbers are the first numbers in the legend box
Figure 7: The final FBRM chord distributions for various experiment. The experiment numbers are the first numbers in the legend box
21
The chord distribution of the various experiments was virtually similar except for experiment
4 which gelation occurred. The distribution varied to a minor degree although not enough to
indicate a significant difference due to any specified factor. As seen in Error! Reference source
not found. and Error! Reference source not found. most of the measured chord lengths are
in the 3-6 µm range. Slight changes of the chord length distribution exist between experiments
but there were no divergences large enough to draw any conclusions from. The experimental
factor that varied the widest was the amount of salt, 1,4-4 molal, and type, but they seemed
to have had a minor effect on the distribution. The addition of more salt merely increased the
number of recorded chords but did not change the distribution. The two salt types have no
apparent effect when compared to each other as in Figure 7 and between that figure and
Error! Reference source not found..
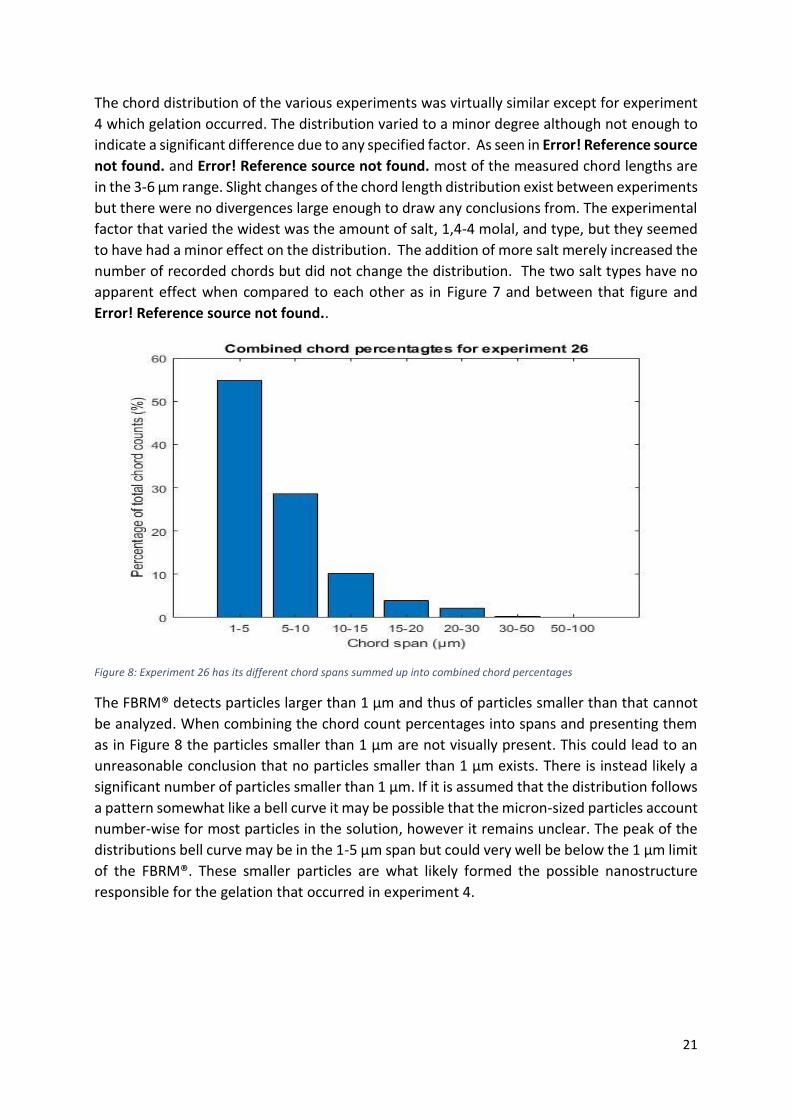
Figure 8: Experiment 26 has its different chord spans summed up into combined chord percentages
The FBRM® detects particles larger than 1 µm and thus of particles smaller than that cannot
be analyzed. When combining the chord count percentages into spans and presenting them
as in Figure 8 the particles smaller than 1 µm are not visually present. This could lead to an
unreasonable conclusion that no particles smaller than 1 µm exists. There is instead likely a
significant number of particles smaller than 1 µm. If it is assumed that the distribution follows
a pattern somewhat like a bell curve it may be possible that the micron-sized particles account
number-wise for most particles in the solution, however it remains unclear. The peak of the
distributions bell curve may be in the 1-5 µm span but could very well be below the 1 µm limit
of the FBRM®. These smaller particles are what likely formed the possible nanostructure
responsible for the gelation that occurred in experiment 4.
22
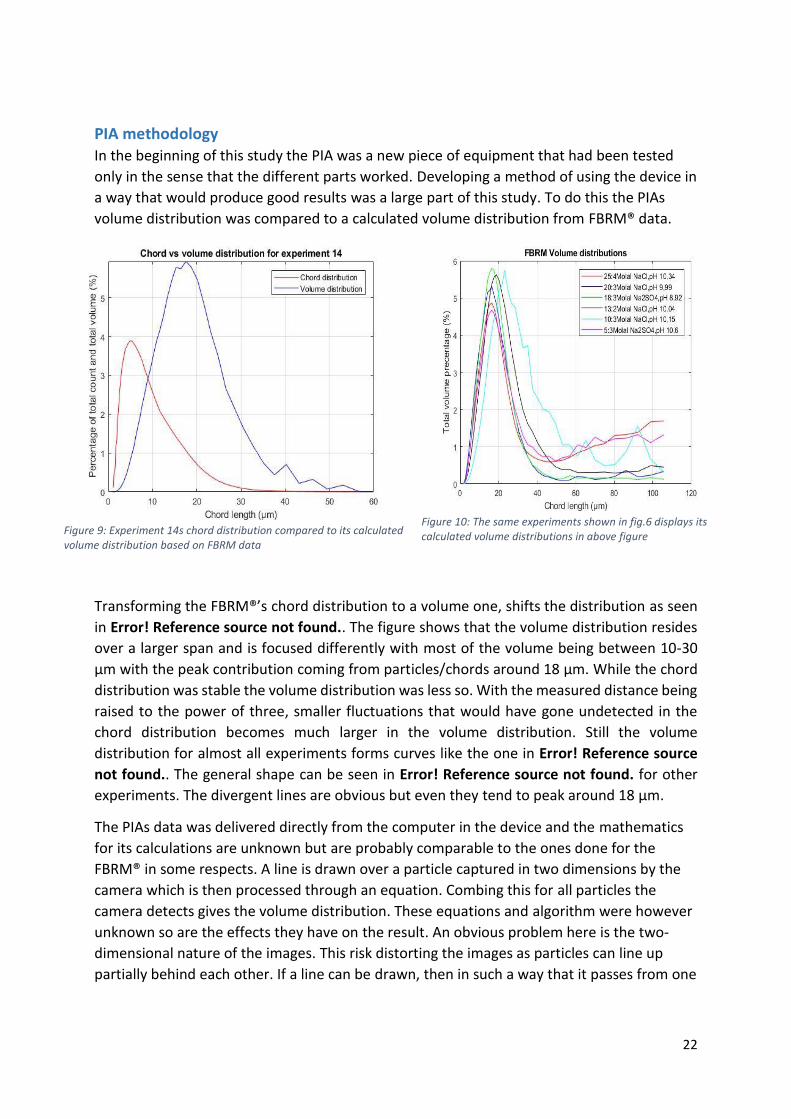
PIA methodology In the beginning of this study the PIA was a new piece of equipment that had been tested
only in the sense that the different parts worked. Developing a method of using the device in
a way that would produce good results was a large part of this study. To do this the PIAs
volume distribution was compared to a calculated volume distribution from FBRM® data.
Figure 9: Experiment 14s chord distribution compared to its calculated volume distribution based on FBRM data
Figure 10: The same experiments shown in fig.6 displays its calculated volume distributions in above figure
Transforming the FBRM®’s chord distribution to a volume one, shifts the distribution as seen
in Error! Reference source not found.. The figure shows that the volume distribution resides
over a larger span and is focused differently with most of the volume being between 10-30
µm with the peak contribution coming from particles/chords around 18 µm. While the chord
distribution was stable the volume distribution was less so. With the measured distance being
raised to the power of three, smaller fluctuations that would have gone undetected in the
chord distribution becomes much larger in the volume distribution. Still the volume
distribution for almost all experiments forms curves like the one in Error! Reference source
not found.. The general shape can be seen in Error! Reference source not found. for other
experiments. The divergent lines are obvious but even they tend to peak around 18 µm.
The PIAs data was delivered directly from the computer in the device and the mathematics
for its calculations are unknown but are probably comparable to the ones done for the
FBRM® in some respects. A line is drawn over a particle captured in two dimensions by the
camera which is then processed through an equation. Combing this for all particles the
camera detects gives the volume distribution. These equations and algorithm were however
unknown so are the effects they have on the result. An obvious problem here is the two-
dimensional nature of the images. This risk distorting the images as particles can line up
partially behind each other. If a line can be drawn, then in such a way that it passes from one
23
particle to another the computer risks counting several smaller particles as fewer large
particles.
The early experiments had a lignin concentration of 10 percent and most of the results from
these experiments were blank. The computer was unable to distinguish individual particles in
the solution and thus reported the solution to be empty of particles. The trials that produced
results reported very uneven distributions in the same experiments and between different
experiments regardless of the experimental factors. The results came from the parts of the
experiments when the camera house was being filled or emptied of the lignin solution. The
video from the camera also showed a roiling black mass instead of a particle solution with the
background visible. Changing the various pump ratios had negligible effect.
To resolve the issue of particle overload which rendering the camera unable to distinguish
separate particle the lignin concentration was lowered. Initially the concentration was
brought down to half, 5 percent but it was not enough to produce any real change. Most of
the results were blank and only the results coming from when the camera house was being
filled or emptied reported anything. Those results were uneven and unstable as well. Thus,
the concentration was halved again to 2,5 % which started producing consistent results. With
a concentration of 2,5 % no results were blank anymore and there were general similarities
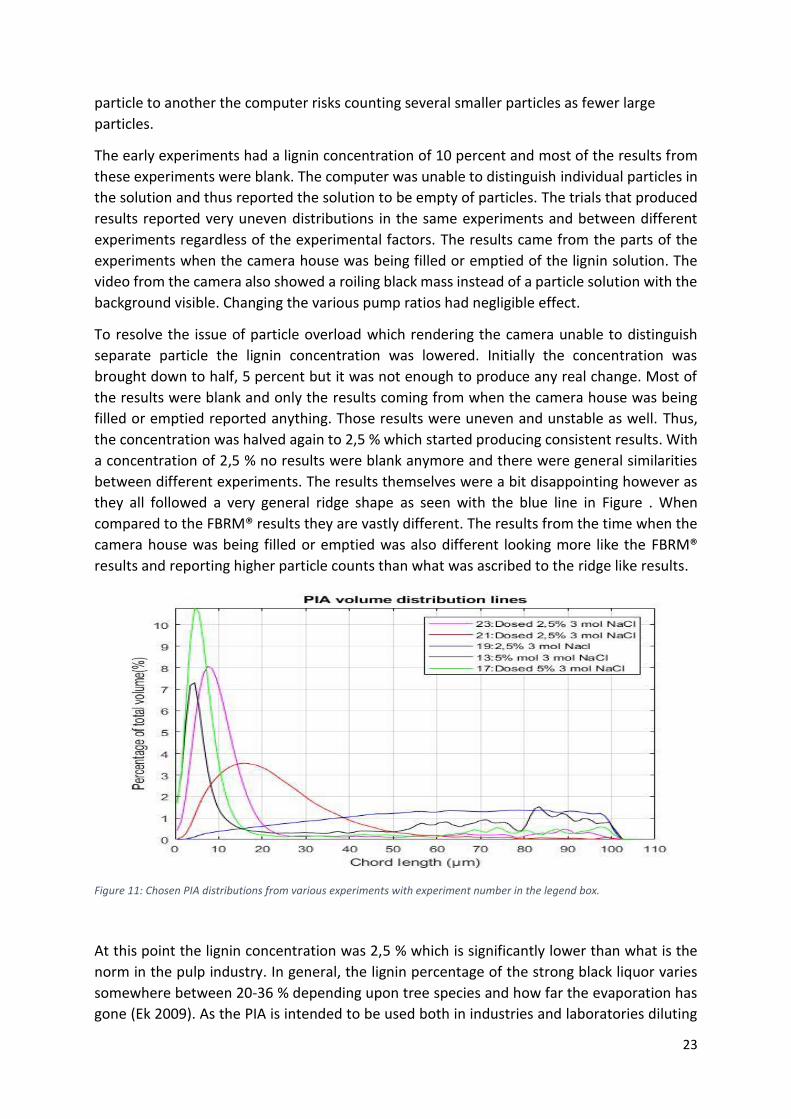
between different experiments. The results themselves were a bit disappointing however as
they all followed a very general ridge shape as seen with the blue line in Figure . When
compared to the FBRM® results they are vastly different. The results from the time when the
camera house was being filled or emptied was also different looking more like the FBRM®
results and reporting higher particle counts than what was ascribed to the ridge like results.
Figure 11: Chosen PIA distributions from various experiments with experiment number in the legend box.
At this point the lignin concentration was 2,5 % which is significantly lower than what is the
norm in the pulp industry. In general, the lignin percentage of the strong black liquor varies
somewhere between 20-36 % depending upon tree species and how far the evaporation has
gone (Ek 2009). As the PIA is intended to be used both in industries and laboratories diluting
24
the sample liquid too far should if possible be avoided. Taking a clue from how the results
closes to the FBRM® came from when the camera house was being filled or emptied an
attempt was made to only introduce a little of the solution. This small sample was then
recycled through the machine instead of continuously introducing new material and
overwhelming the camera. Essentially a small part of the lignin solution was “dosed” into the
internal circuit of the PIA. This was done by letting the dilution and camera pump run the
entire time but only letting the circulation and sample pump run for a short time before being
turned off. This dilutes the solution in the camera house much more and stops new lignin from
overwhelming the sample in place. With this procedure the results improved markedly as can
be seen in Figure . Shutting of the circulation pump but letting the sample pump keep running
improved the end results even more which can be seen when one compares the purple line
to the red line in Figure with the purple line being more focused and closer to the chord length
distribution. With a working method the concentration was raised up to 5 % and gave
satisfactory results. In the last PIA experiment the concentration as brought back to the initial
value of 10 % but the solution proved too particle dense even with the method of only
introducing a small sample.
Even with a working method of 5 percent a few questions remain. If one is to trust Figure part
of the volume is always made up of larger particles with part of the volume being very evenly
spread out over a particle length from 20-60 µm. After 60 µm and especially between 80-100
µm the contribution doesn’t appear to fade but instead grows and does so unevenly. This
could come from extremely few particles having significantly larger volume than a particle of
smaller size would but could also be evidence of particle line up with the low contribution
coming from the rarity of the events. There is also a sharp drop of around 103 µm after which
no particles appear at all. The drop off is most visible for the blue line in Figure but can be
seen to some extent in the other lines as well. This is believed to be a result of the algorithm
ignoring counts beyond a certain size, likely to filter out contaminants or disturbance as the
algorithm gives datapoints beyond 103 µm but reports them as empty.
25
FBRM® vs PIA The initial experiments are not considered here as it was not until the “dosing” method was developed
that good results were obtained. Thus, all the results here are from the “dosing” method and of lignin
concentration being 2,5 and 5 %. The previous experiments were either unstable or blank. Eventually
stable and consistent results were obtained but all of them looked like ridges with the total volume
being evenly distributed over the possible particle lengths and not an expected curve.
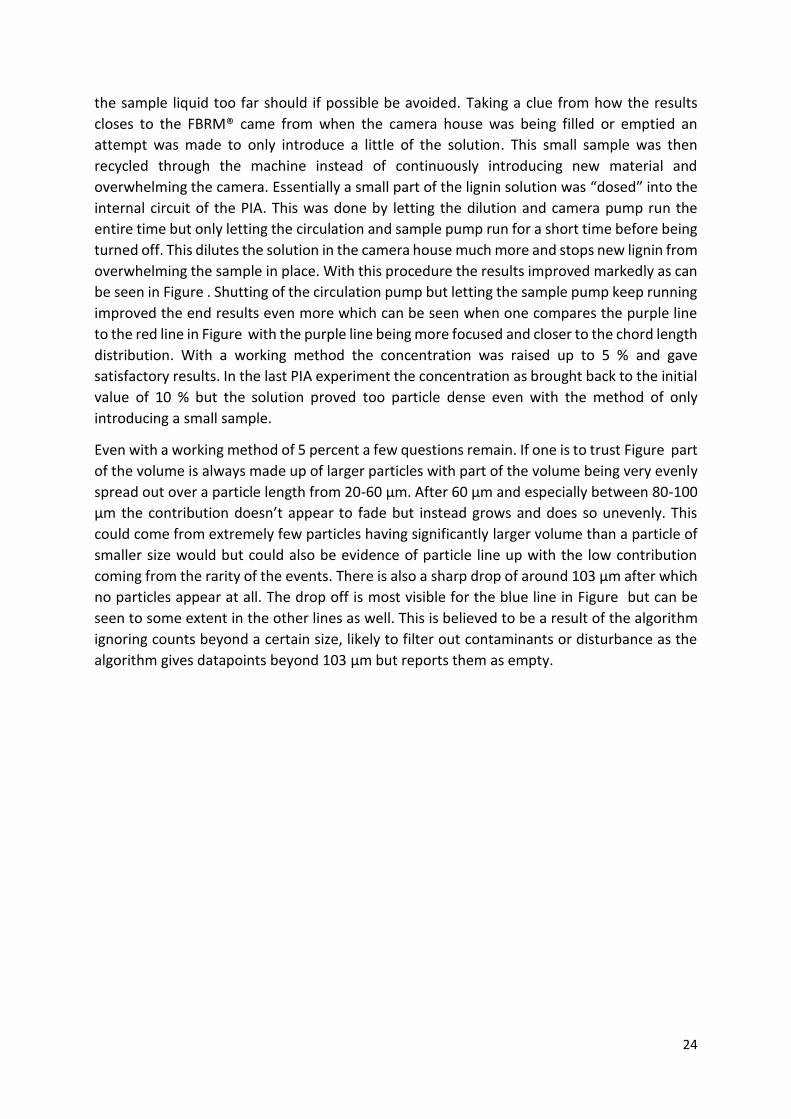
Figure 12: Comparison between the results from the FBRM® and PIA volume distributions for experiment 20
Experiment 20 was a salting out experiment with the temperature turned on after enough salt
had been added to reach onset. The onset concentration was 1,9 molal. When the heat bath
was switched on the solution eventually reached a temperature where precipitation
happened. This initial growth in particles then reached a second point which led to an
increased growth rate. Figure demonstrates the volume distribution of the FBRM® and the
PIA with experiment 20 being the first experiment using the dosing method. As seen in Figure
there is some overlay between the PIA and the FBRM®. The initial volume distribution is very
similar with the first real differences showing itself for particles larger than 10 µm. The peaks
of both the FBRM® and the PIA are close to each other on the x axis even if the PIA results are
close to two percent units lower. Both also have some distortions coming from particles larger
than 60 µm. The real difference comes from particles between 30 and 60 µm. The FBRM® s
volume distribution rises quickly from 1 to 18 µm and then falls close to zero at 40 µm with
the rest being distortions from singular particle counts. The PIAs volume distribution on the
other hand decreases much slower with more of the volume coming from particles larger than
30 µm.
This discrepancy between the FBRM® and the PIA’s results could come from larger particles
that the PIA spots but managed to avoid detection by the FBRM®. Another possibility is that
smaller particles line up behind each other and to the PIA then looks like a single large particle
instead.
26
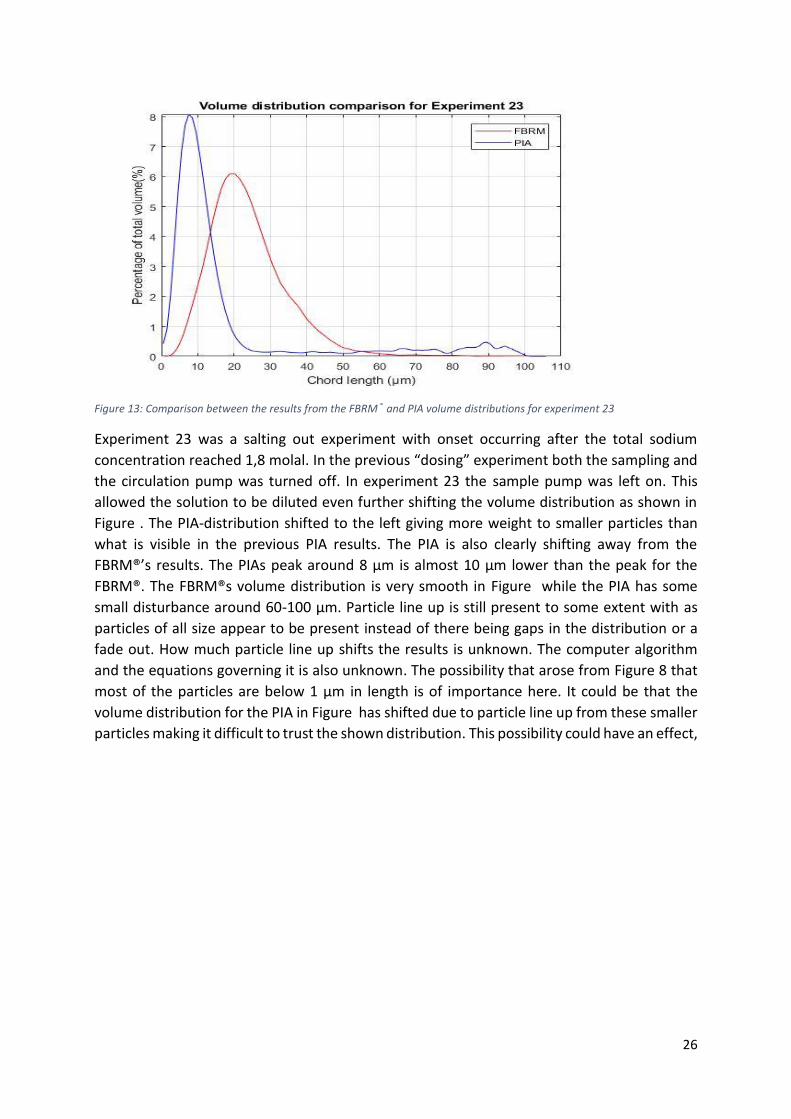
Figure 13: Comparison between the results from the FBRM® and PIA volume distributions for experiment 23
Experiment 23 was a salting out experiment with onset occurring after the total sodium
concentration reached 1,8 molal. In the previous “dosing” experiment both the sampling and
the circulation pump was turned off. In experiment 23 the sample pump was left on. This
allowed the solution to be diluted even further shifting the volume distribution as shown in
Figure . The PIA-distribution shifted to the left giving more weight to smaller particles than
what is visible in the previous PIA results. The PIA is also clearly shifting away from the
FBRM®’s results. The PIAs peak around 8 µm is almost 10 µm lower than the peak for the
FBRM®. The FBRM®s volume distribution is very smooth in Figure while the PIA has some
small disturbance around 60-100 µm. Particle line up is still present to some extent with as
particles of all size appear to be present instead of there being gaps in the distribution or a
fade out. How much particle line up shifts the results is unknown. The computer algorithm
and the equations governing it is also unknown. The possibility that arose from Figure 8 that
most of the particles are below 1 µm in length is of importance here. It could be that the
volume distribution for the PIA in Figure has shifted due to particle line up from these smaller
particles making it difficult to trust the shown distribution. This possibility could have an effect,
27
but one must consider that even if a majority of the particles are smaller than 1 µm the
majority of the volume could instead come from larger particles rendering the issue moot.
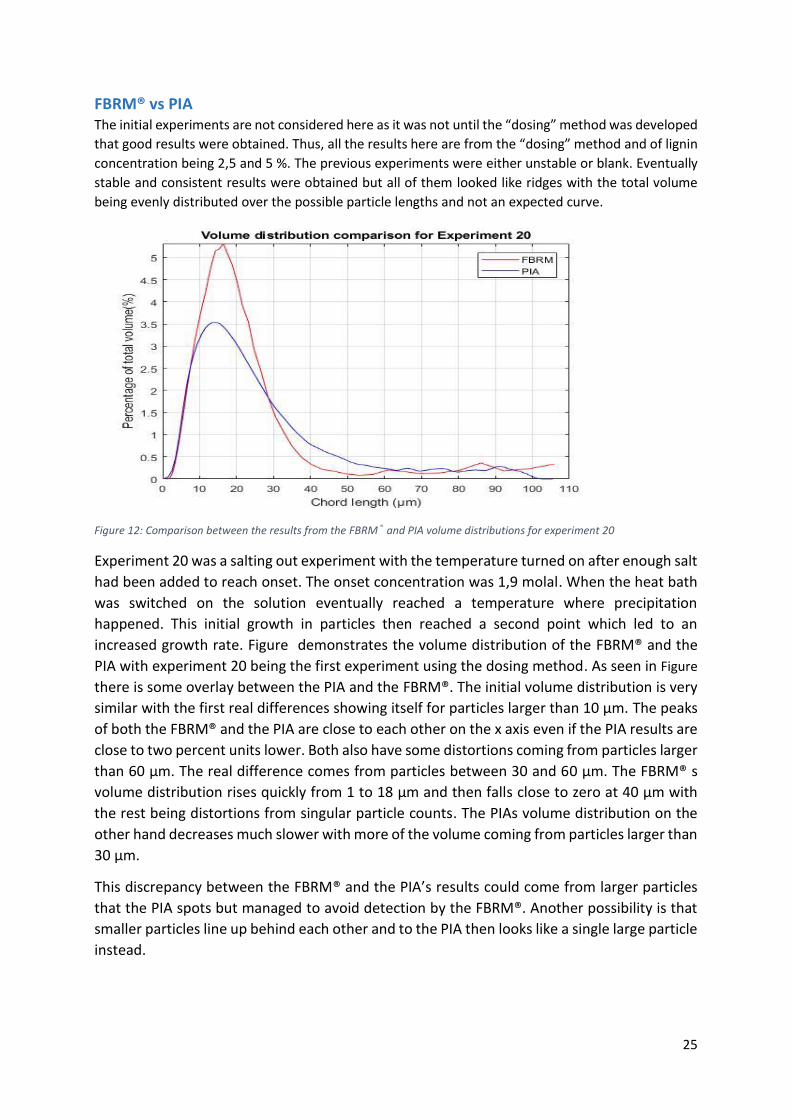
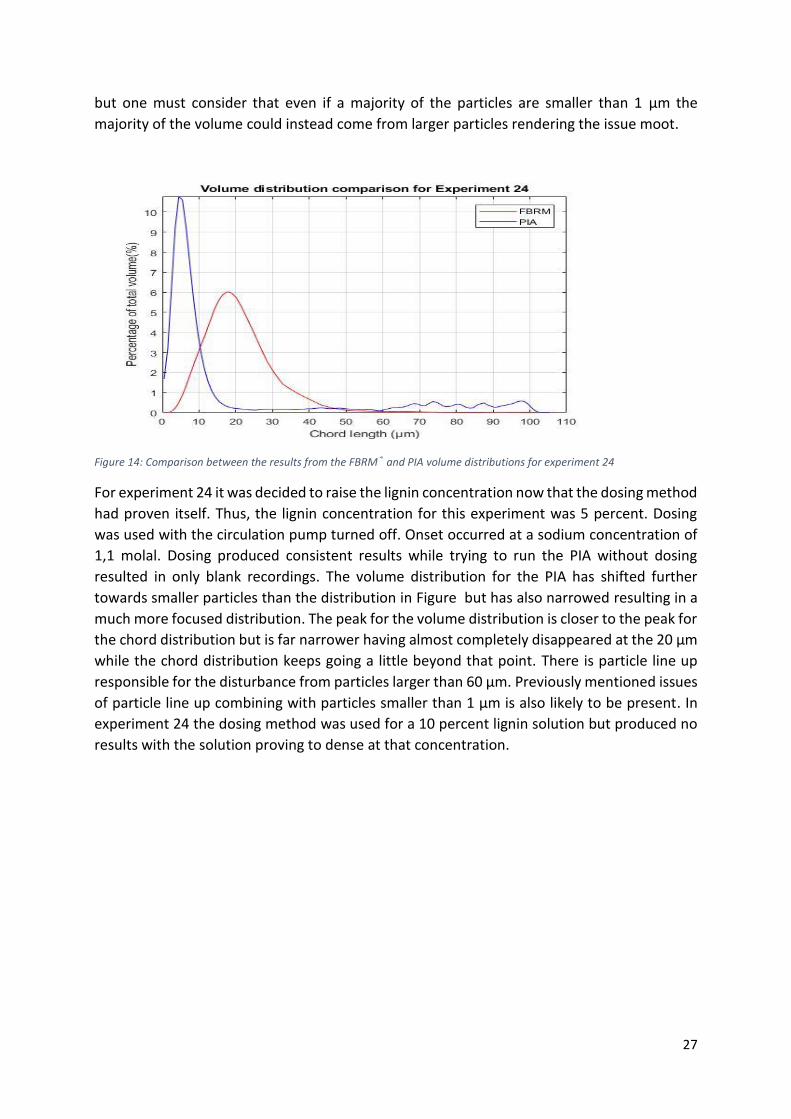
Figure 14: Comparison between the results from the FBRM® and PIA volume distributions for experiment 24
For experiment 24 it was decided to raise the lignin concentration now that the dosing method
had proven itself. Thus, the lignin concentration for this experiment was 5 percent. Dosing
was used with the circulation pump turned off. Onset occurred at a sodium concentration of
1,1 molal. Dosing produced consistent results while trying to run the PIA without dosing
resulted in only blank recordings. The volume distribution for the PIA has shifted further
towards smaller particles than the distribution in Figure but has also narrowed resulting in a
much more focused distribution. The peak for the volume distribution is closer to the peak for
the chord distribution but is far narrower having almost completely disappeared at the 20 µm
while the chord distribution keeps going a little beyond that point. There is particle line up
responsible for the disturbance from particles larger than 60 µm. Previously mentioned issues
of particle line up combining with particles smaller than 1 µm is also likely to be present. In
experiment 24 the dosing method was used for a 10 percent lignin solution but produced no
results with the solution proving to dense at that concentration.
28
Discussion
FBRM®
The results from the FBRM® have been very consistent with each other despite the different
experimental factors imposed. Salt type appears to have no effect on the chord distribution,
or the precipitation process itself. The concentration of sodium between 1,4-4 molal in the
solution appears to have very little effect on the actual size distribution with more salt simply
increasing the amount of precipitated lignin. The precipitation process is somewhat sensitive
to the amount of salt added but this sensitivity comes in the form of the growth rate after
onset has occurred. The closer to the point of onset the slower the precipitation happens while
an overshot result in an incredibly fast particle growth. How the amount of precipitated lignin
relates to the pH and added salt is not completely determined but increasing the salt amount
and lowering the pH increases the yield of lignin.
The temperature in the trials did in general not appear to have any significant effect on the
result of the precipitation. Gelation is a risk with lignin precipitation as demonstrated, if the
precipitation is conducted at room temperature. Precipitation is temperature dependent as
demonstrated by experiment 14. Precipitation did not occur until the heating element had
been turned on and allowed to heat the solution. The precipitation began at a certain
temperature only to speed up past another temperature. These unknown temperatures may
be of interest in further studies for more reasons than to know how to avoid gelation. If there
is a minimum temperature needed for precipitation to occur that is important information as
is the possibility of a higher temperature speeding up the precipitation process. If the
temperature has an effect beyond the impact it has on the effective pH is also of interest.
The pH of the solution is extremely important for the precipitation process which is easily
demonstrated by any of the titration experiments. A lower pH causes precipitates at a lower
salt concentration and vice versa. Lowering the pH after precipitation occurs is quite likely to
precipitate more lignin as the addition of more salt does but was not attempted in this study.
If the chord distribution changes as the pH lowers is thus unknown.
29
Evaluation of the PIA
As the PIA is a completely new method under development it was likely to have flaws and
undiscovered limitations. Problems can possibly be fixed by changing the operating method,
flaws skew the received data while limits determine the possibilities of the system. A working
operating method had to be developed and the flaws and limitations identified. A potential
issue of the camera may render it unable to distinguish individual particles if the concentration
of particles becomes too high and could thus be is a limitation. Finding the boundary of this
limitation could be worth to further investigate. The possibility of adjusting the computer and
programming may also be of interest if there is unused capability there.
The flow of solution and thus particles is also a factor of possible importance. Is there a
preference to size from the flow shifting the results? Many of the particle agglomerates are
likely a loose formation of smaller particles attached to each other and this formation could
be damaged or break effecting the results. The mixing that takes place is also of interest. The
actual level of dilution of the liquid inside the camera house is unknown and as such the
concentration of the liquid that the PIA sees and draws its results from. As the dilution pump
pumps liquid into the mixing vessel and the circulation circuit the actual ratio of the solutions
to each other is unknown. The efficiency of the mixing vessel is also a factor even without the
possibility of short circuit.
The method of dosing in some sample liquid produces consistent results with a starting lignin
concentration of 5 %. Different pump ratios using dosing and a 5 % lignin solution may have
an effect but was not tried due to time constraints. The actual concentration in front of the
camera is decidedly lower due to the dilution of the PIA. The actual concentration however is
not known.
The difference between the results from the PIA and the FBRM® are quite large but they are
consistent in respect to themselves. The FBRM® have been used in earlier experiments and as
such is used as a benchmark for the newer PIA. The large difference in between the results
makes it difficult to say how accurate the PIAs results are. The two methods are also based on
different methodologies which could be what is causing the differences. Particle line up is
problematic as the extent of its effect on the PIA result is unknown. Particle line up is
functionally impossible for the FBRM®. Thus, any actual difference from the PIA result when
comparing the two is distorted. Particle line up may also possibly mask other issues that may
be present. The distortion from particle line up is increased by the possibility that particles
smaller than 1 µm are responsible for parts of it. As these particles are invisible to the FBRM®
they are only seen due to particle line up by the PIA. Thus, the FBRM® and the PIA are not
quite measuring the same things and if the reasoning around Figure 8 is correct this could have
a large effect.
To proceed with the PIA some issues should be addressed. The pumping ratios should be
investigated as should the effect of a wider range of different particle concentrations. The
camera and the computer algorithm can likely be optimized further. The FBRM® returns chord
counts only while the PIA determines the volume distribution along with other forms of data.
Possible comparisons using other investigative methods focusing on the other forms of data
is worth doing to determine if the volume distribution alone is skewed but the other results

30
are fine. In an industrial setting the FBRM® works just fine for the chord distribution leading
to the PIAs main attraction being the other type information about the particles it acquires.
The type of data of greatest interest is likely to be the aspect ratio which could help determine
the shape of the lignin particles.
31
Conclusions During this study these are the conclusions that have been drawn:
• FBRM® produces consistent results. The various conditions: temperature, salt type,
salt concentration and pH had no visible effects on the chord/particle distribution. The
volume, while much easier to shift and disturb, was also quite similar. The chord
lengths responsible for the majority in the chord distribution are found at 3-6 µm
which had a corresponding volume distribution peaking at 18-22 µm.
• The temperature is an important factor in the precipitation process but after
precipitation has occurred the solution is unaffected by the temperature being
lowered to room temperature.
• PIA results are significantly different from that of the FBRM®. Early trials produced
uneven results which were rarely repeated during the same experiments. This
improved with a lowering of the lignin concentration and eventually dosing in the
lignin-containing liquid. The PIA is limited by how concentrated the solution that enters
it can be. More testing is required to define this limit of lignin concentration in a black
liquor but below 5 percent is a reasonable region considering the dilution factor of the
dilution liquid in this study.
• PIA is a combination of pumps and a camera with added tubes, making it is a rather
complex system. This complexity makes it difficult to understand individual influences
on the result. Flow friction and pumping forces may influence the result and is not
currently understood and thus suggests further investigation.
• PIA offers other forms of data that can be of interest such as vertical to horizontal
aspect ratios which could give insight to the shape of the lignin particles but from a
purely particle size and distribution perspective the FBRM® is the superior method
now.
32
Future work There are two parts of future work possible. One is to continue investigating the precipitation
of lignin and the other is to turn the PIA into a reliable experimental machine. When
investigating the precipitation, temperature is of interest in order to find the point where
gelation starts so it can be avoided. The filtration process depends on particle size and volume
which determines the filtration resistance and therefore the volume of washing liquid
required. Both the size distribution and the volume distribution are thus of interest and
further effect of pH and salt on the volume distribution are of interest. Some suggestions for
further PIA developments: try running it normally but keep adding dilution liquid but no lignin
solution, to see how retention affects the results. Try the PIA with known dilution and particle
solutions to determine the PIA’s own overall effect on the result. Find the concentration
limitations of the PIA along with accuracy of the camera and computer. How/if the camera
and computer program could be improved is beyond the scope of this work. There are also
the effects of the tubes and pumps themselves to be considered. Finally, the wagon the PIA is
compact and handy from an experimental and transport perspective, however quite difficult
to clean and tinker with.

33
Acknowledgments I am very grateful for the guidance and constructive criticism of Dr.Tor Sewring who
supervised my work. Neither could this thesis have been done without the technical support
of Aaro Knuts of Sci-Tech Service Oy Ltd. Advice and support given by examiner Professor Hans
Theliander have also been of great help.
34
Sources
Aminzadeh, S., et al. (2018). "Membrane filtration of kraft lignin: Structural charactristics and antioxidant activity of the low-molecular-weight fraction." Industrial Crops and Products 112: 200-209.
Aresta, M., et al. Biorefineries - An Introduction, De Gruyter: 257-277, 2015.
Azadi, P., et al. (2013). "Liquid fuels, hydrogen and chemicals from lignin: A critical review." Renewable and Sustainable Energy Reviews 21: 506-523.
Contado, C., et al. (2013). "Size characterization by Sedimentation Field Flow Fractionation of silica particles used as food additives." Analytica Chimica Acta 788: 183-192.
Higuchi T (1997). Chapter 4-Biosynthesis of Wood Compontents. Biochemistry and molecular biology of wood.Springer-Verlag Berlin Heidelberg. ISBN 3-540-61367-6 pp 93-262
Ek, Monica Gellerstedt, Göran Henriksson, Gunnar. (2009). Pulp and Paper Chemistry and Technology - Pulping Chemistry and Technology, Volume 2 - 12.1 Introduction. De Gruyter. Retrieved from https://app.knovel.com/hotlink/pdf/id:kt011L20J4/pulp-paper-chemistry/recovery-c-introduction
Leatherman, S. P. (2001). Chapter 8 Social and economic costs of sea level rise. International Geophysics. B. C. Douglas, M. S. Kearney and S. P. Leatherman, Academic Press. 75: 181-223.
Meek, N., et al. (2016). "Synthesis and characterization of lignin carbon fiber and composites." Composites Science and Technology 137: 60-68.
Merewether, J. (1961). "Lignin XIV. The Precipitation of Lignin from Kraft Black Liquor." Holzforschung-International Journal of the Biology, Chemistry, Physics and Technology of Wood 15(6): 168-177.
Öhman, F., et al. (2007). "A novel method for washing lignin precipitated from kraft black liquor û€“ Laboratory trials." Nordic Pulp & Paper Research Journal 22(1): 009-016.
Olsson, C., et al. (2017). "Carbon fibres from precursors produced by dry-jet wet-spinning of kraft lignin blended with kraft pulps." Holzforschung 71(4): 275-283.
Plana, Q., et al. (2018). "Grit particle characterization: influence of sample pretreatment and sieving method." Water Science and Technology 78(6): 1400-1406.
Roeger, W. (2005). "International oil price changes: impact of oil prices on growth and inflation in the EU/OECD." International Economics and Economic Policy 2(1): 15-32.
This paper uses an open economy DSGE model to analyse the short and long run quantitative impact of a permanent oil price increase for output and inflation in the euro area and compares the results to the predictions of other models currently in use. Special emphasis is
35
devoted to the issue of stagflation. It is found that with standard monetary feedback rules as currently estimated for the euro area, there is no severe inflation risk. The paper also addresses the issue to what extent there is a short run trade off between inflation and output with an adverse supply shock.
Sewring, T. (2017). The precipitation of kraft lignin from aqueous solutions : the influence of pH, temperature and xylan, Göteborg : Chalmers University of Technology, 2017.
Sjöström, E. (1993). Chapter 1 - THE STRUCTURE OF WOOD. Wood Chemistry (Second Edition). San Diego, Academic Press: 1-20.
Sjöström, E. (1993). Chapter 2 - INTRODUCTION TO CARBOHYDRATE CHEMISTRY. Wood Chemistry (Second Edition). San Diego, Academic Press: 21-50.
Sjöström, E. (1993). Chapter 4 - LIGNIN. Wood Chemistry (Second Edition). San Diego, Academic Press: 71-89.
Sjöström, E. (1993). Chapter 7 - WOOD PULPING. Wood Chemistry (Second Edition). San Diego, Academic Press: 114-164.
Tarleton, S. and R. Wakeman (2005). Solid/liquid separation: principles of industrial filtration, Elsevier.
Tomani, P. (2010). The Lignoboost ™process.
Uloth, V. (1989). "Kraft Lignin Recovery: Acid Precipitation Versus Ultrafiltration, Part I: Laboratory Test Results", by V.C. Uloth and J.T. Wearing, Pulp and Paper Canada, 90 (9): T310-T314 (1989).
Wallmo, H., et al. (2009). "The influence of hemicelluloses during the precipitation of lignin in kraft black liquor." Nordic Pulp & Paper Research Journal 24(2): 165-171.
Zhu, W., et al. (2014). "Investigation and characterization of lignin precipitation in the Lignoboost ™process." Journal of Wood Chemistry and Technology 34(2): 77-97.

36