Embed Size (px)
Citation preview

Comparison of failure mechanisms between rubber-modifiedand unmodified epoxy adhesives under mode II loading condition
Makoto Imanaka Æ Ryousuke Orita ÆYosinobu Nakamura Æ Masaki Kimoto
Received: 30 October 2007 / Accepted: 13 February 2008 / Published online: 11 March 2008
� Springer Science+Business Media, LLC 2008
Abstract The effect of rubber modification on fracture
toughness of adhesive joints under mode II loading con-
dition was investigated in comparison with that under
mode I loading, wherein the two adhesives rubber-modified
and unmodified were used. To evaluate the fracture
toughness on the basis of R-curve characteristics under
mode II loading condition, four-point bend tests had been
conducted for the adhesively bonded end-notched flexure
(ENF) specimens. Thus obtained R-curves revealed the
following trend: its behavior did not appear for the
unmodified adhesive, whereas the rubber-modified adhe-
sive exhibited a typical behavior. In the initial stage of
crack propagation, GIIC of the rubber-modified adhesive is
lower than that of the unmodified adhesive, but becomes
greater in the range of Da [ 25 mm. Nevertheless, the
significant improvement of the fracture toughness with the
rubber modification under mode I loading condition was
not observed under mode II loading. Moreover, FEM
analysis was made to elucidate the relation between the
above fracture behavior and stress distributions near the
crack tip. The results gave the reasonable relationship
between evolution of plastic zone and the area with high
void-fraction as well as the R-curves behavior. In addition,
macroscopic and SEM observations for the fracture
surfaces were also conducted.
Introduction
Rubber-modified epoxy adhesives have attracted special
interest from satisfying static strength and toughness
simultaneously; numerous studies have been conducted on
fracture toughness of several types of adhesive joints
bonded with the rubber-modified adhesives, in special,
under mode I loading condition [1–6]. In such situation, it
is well known that the main improvement mechanism of
the fracture toughness is shear banding in the epoxy matrix
running among the rubber particles and plastic void growth
initiated with cavitation or debonding of the rubber parti-
cles due to the high expansion stress in front of the crack
tip [7]. Although adhesive joints are usually designed to
minimize any applied mode I loading, there are little
studies on fracture toughness under mode II loading con-
dition [8–12]. Expansion stress under mode II loading is
remarkably small in contrast with that under mode I
loading; hence, both cavitation and debonding of the rubber
particles are expected to be suppressed for lack of expan-
sion stress. Thus it is necessary to clarify whether the
rubber modification improves the fracture toughness under
mode II loading or not. Unfortunately, there are few liter-
atures concerned with the effect of rubber modification
[13–15]. In the present situation, it is still unclear that the
rubber modification improves the fracture toughness under
mode II loading or not.
In this study, the effect of rubber modification on the
fracture toughness of adhesive joints under mode II
loading condition was investigated in comparison with
M. Imanaka (&) � R. Orita
Department of Technology Education, Osaka University
of Education, Kashiwara, Osaka 582-582, Japan
e-mail: [email protected]
Y. Nakamura
Department of Applied Chemistry, Osaka Institute
of Technology, Osaka 535-8585, Japan
M. Kimoto
Department of Chemistry and Environment, Technical Research
Institute of Osaka Prefecture, Osaka 594-1157, Japan
123
J Mater Sci (2008) 43:3223–3233
DOI 10.1007/s10853-008-2557-6

that under mode I loading, wherein four-point bend tests
for adhesively bonded end-notched flexure (ENF) speci-
mens were conducted to evaluate the fracture toughness
on the basis of R-curve characteristics. To elucidate its
modification effect, macroscopic and SEM observations
for the fracture surfaces were also made together with
stress whitening and void distribution. Furthermore elas-
tic-plastic finite element analyses were carried out to
obtain the stress and strain distributions near the crack
tip, in which Gurson’s model was applied for the rubber-
modified adhesive to take the extension of void-fraction
from rubber particles into account. Based on these results,
the effect of rubber modification on the crack initiation
and its propagation behavior was discussed.
Preparation of adhesives and mechanical properties
Two kinds of epoxy adhesives were used in the present
study. One was a rubber-modified epoxy adhesive prepared
from dispersing cross-linked rubber particles (XER-91,
JSR) in bis-phenol epoxy resin (Epikote 828); the other
was an unmodified epoxy adhesive without rubber parti-
cles. For both the adhesives, piperidine was used as a
curing agent; the mix proportion of the adhesives and
curing conditions are listed in Table 1.
To investigate the effect of rubber modification on the
mechanical properties of the bulk adhesives, tensile tests
were conducted by using dumbel (JIS.K7113) type speci-
mens at the cross-head speed of 1 mm/min. Figure 1 shows
stress–strain curves of the modified and unmodified adhe-
sives, whose mechanical properties are summarized in
Table 2. As Fig. 1 shows, both the adhesives clearly yield
the behavior before the final fracture, also indicating that
the rubber modification decreases both the Young’s mod-
ulus and fracture stress, but increases the breaking strain
dramatically.
Experimental procedure of fracture toughness tests
Figure 2a and b shows the shape and sizes of the adhesively
bonded end-notched flexure (ENF) and double cantilever
beam specimens, respectively. The former specimen was
used for fracture toughness tests under mode II loading, the
latter for that under mode I loading. A tool steel (JIS.SKD11)
and structural carbon steel (JIS S55C) were used as adher-
ents for the ENF and DCB specimens, respectively. A filler
gage of 0.01 mm in thickness, treated with a release agent,
was used as a pre-crack between Teflon sheets of 0.1-mm
thickness as in Fig. 2a. We adapted similar method to induce
a pre-crack in the adhesive layer of the DCB specimen as in
Fig. 2b.
Schematic illustration of four-point bend test for the
ENF specimen is shown in Fig. 3. The load is introduced
via steel ball onto a loading platen, allowing it to rotate
freely, which ensures that the applied load on the right
loading pin is equal to that on the left one. The bending
test was conducted at the cross-head speed of 1 mm/min,
then the deflection of the specimen being monitored on a
clip gage inserted between the loading platen and base
plate. To obtain R-curves, the crack extension was mea-
sured in several stages before failure in accordance with
the following method. The specimen was rapidly unloa-
ded before unstable crack propagation, the removed
specimen being immersed in a solution of fluorescent to
mark the cracked surface. The crack extension was
measured from the fracture surface under UV light. The
energy release rate was calculated in terms of the crack
extension and the load just before unloading; the detail
will be described later. Furthermore, to observe the
behavior of the damage evolution, the crack tip region
was monitored with the aid of high-magnified video
camera during loading.
Table 1 Preparation of the epoxy adhesives
Composition Curing
condition
Rubber-modified
adhesive
Epoxy resin 8.6 g 20 h at 393 K
Rubber particles
(XER-91a)
1.4 g
Piperidine 0.43 g
Unmodified
adhesive
Epoxy resin 8.6 g
Piperidine 0.43 g
XER-91a: cross-linked rubber particles
(Mean diameter 70 nm)
Fig. 1 Stress–strain curves of bulk adhesives
3224 J Mater Sci (2008) 43:3223–3233
123

Tensile load under mode I loading condition was applied
to the DCB specimen by use of a universal testing machine
(Shimadzu Autograph, DCS-500), whereby the cross-head
speed for loading is 1 mm/min. The displacement of the
loading points was measured on a clip gage, crack exten-
sion being also measured by the same method as that under
mode II loading.
Experimental results and discussion
Compliance calibration tests
Based on the beam model of the 4ENF specimen, the
average displacement and compliance for the configuration
illustrated in Fig. 3 [16] are given as Eqs. 1 and 2,
dmax ¼d1 þ d2
2¼ S2
L
8Ebh3ð6L� 10SL þ 9aÞPþ 3SLP
5Gbhð1Þ
C ¼ dave
P¼ S2
L
8Ebh3ð6L� 10SL þ 9aÞ þ 3SL
5Gbhð2Þ
where d1 and d2 represent the deflection of the specimen
underneath the left and right loading pin, respectively. a is
the crack length which is represented as the distance from
crack tip to the left loading roller. b and h are the width and
thickness of the adherent, respectively, E and G are
Young’s and shear moduli of the adherent, respectively. P
is the applied load. The other symbols are defined in Fig. 3.
Equation 2 indicates a linear relationship between com-
pliance and crack length. Figure 4a shows the experimental
result for the ENF specimen together with a theoretical line
based on Eq. 2. To prevent the influence of the loading
rollers, the compliance was measured with crack tips greater
than 15 mm away from the loading rollers. From the com-
parison of the experimental data and the theoretical line, it is
found that the experimental data are significantly greater
than the theoretical line. Similar trend had also been reported
in 4ENF tests of laminated composites, wherein the cause of
Table 2 Mechanical properties
of the adhesivesYoung’s modulus
E (MPa)
Yield stress ry
(MPa)
Work hardening
parameter H (MPa)
Unmodified adhesive 2842.0 40.0 0 \ ep:H = 800
Modified adhesive 1985.0 26.8 0 \ ep \ 0.0154:H = 1110
0.0154 \ ep:H = 0
Fig. 2 Shape and sizes of the adhesively bonded ENF and DCB
specimens
Fig. 3 Schematic illustration of
ENF test
J Mater Sci (2008) 43:3223–3233 3225
123

the difference was expected from neglecting the shear
deformation in the specimen and deformations in the load
train in the beam theory [17]. Thus the experimental results
are represented as the following linear equation.
C ¼ C0 þ C1a ð3Þ
where C0 and C1 are the constants calculated by the least
square method, the slope of the experimental line being
similar to that from the beam theory. Substituting Eq. 3 into
the fundamental equation, we can obtain the energy release
rate as follows:
GIIC ¼P2
2b
dC
da¼ P2
2bC1 ð4Þ
Equation 4 indicates that the energy release rate is inde-
pendent of the crack length and then linearly increases with the
increase of C1. Thus, from the slope of the experimental line the
energy release rate can be evaluated. With regard to the eval-
uation of GIIC, it is pointed out that the effect of friction on GIIC
value obtained from 4ENF test is larger than that from 3ENF
test; however, it can be lowered with decreasing ratio of the
inner span length to the outer one [18, 19]. For example, results
of FEM analysis for 4ENF tests of laminated composites gave
that the friction effect obtained at the span ratio of 0.4 greater
than that obtained from 3ENF tests by a factor of about 4% [18].
In the present experiment, the span ratio is about 0.3; hence, the
effect of friction could be expected to be negligible.
The result for the DCB specimen under mode I loading
gives a relationship between the crack length, a, and cube
root of compliance, C1/3, as in Fig. 4b, which fits the
following linear equation.
C1=3 ¼ D0 þ D1a ð5Þ
Substituting Eq. 5 into the fundamental equation, we can
obtain the energy release rate as follows:
GIC ¼P2
2b
dC
da¼ 3D1P2C2=3
2bð6Þ
Equation 6 is often used for evaluating energy release
rate of adhesively bonded DCB specimens.
Load–displacement curves
Figure 5a and b shows load–displacement curves for the
ENF specimens with unmodified and rubber-modified
adhesives, in which video micrographs near the crack tips
are also given at several load levels. As Fig. 5a and b
shows, a linear relationship is maintained just before a peak
value for the unmodified adhesive, whereas load–
Fig. 4 Compliance as function
of crack length
Fig. 5 Load–displacement curves for ENF specimens with rubber-
modified and unmodified adhesives, wherein video microphotographs
of the fracture process are included
3226 J Mater Sci (2008) 43:3223–3233
123

displacement curve for the modified adhesive deviates
from linear line at about 60% of the peak value. Besides,
such a point at which the load–displacement curve deviates
from linear line is illustrated as NL point in Fig. 5, where
crack propagation occurs above the NL point [11].
For the unmodified adhesive, triangle void appears in
front of the pre-crack at the load of 60% of the NL point as
in Fig. 5a, the void expands to the upper interface, and
begins to contact with the interface at the load of 72% of
the NL point; subsequently, the interfacial crack appears at
the contact point and propagates rapidly in the vicinity of
the NL point. When the void proceeded to the upper
interface, the void periphery forms wedge shape at the
contact point. The stress singularity of the wedge tip is
weaker than that at the crack tip, which can induce the
stress blunting. This may be a reason why there is a con-
siderable increase in the load for duration from the arrival
of the void onto the upper interface to the propagation of
the interfacial crack. Thus the load reaches a steady-state
value through a rapid decrease.
For the modified adhesive, on the other hand, the void
reaches the upper interface near the NL point as in Fig. 5b,
so that crack propagates immediately after reaching the
upper interface. The inset micrographs indicate that the
void appears in front of pre-crack and propagates to the
upper interface; subsequently, the crack propagates along
the interface for both the adhesives. Such a fracture process
is schematically illustrated in Fig. 6. Chain et al. also
reported similar failure process for adhesively bonded ENF
specimen under three-point bending condition: the central
crack shifts to the upper interface (compression side),
whereby void appeared in front of the pre-crack, as shown
in Fig. 6 [12]. Such a behavior of crack propagation agrees
with that expected from contour and vector plots of the
maximum principal stress obtained by FEM analysis, as
will be discussed in the later section. For some adhesives, it
is reported that micro-cracks be observed in front of the
pre-crack under mode II loading condition [11]; however,
such micro-cracks were not observed for the present
adhesives.
R-curves
Figure 7 shows the R-curves of the ENF specimens with
rubber-modified and unmodified adhesives, wherein two
load displacement curves near the peak points for the
unmodified one are also given. As the inset figure shows,
the curves reach a steady-state values. In the 4-ENF test,
GIIC depends only on the applied load from Eq. 4. This
means that the crack propagates at a constant energy
release rate in the steady-state region. Thus, R-curve
Fig. 6 Illustration of fracture process of the ENF specimen Fig. 7 R-curves under mode II loading
J Mater Sci (2008) 43:3223–3233 3227
123
behavior does not appear for the unmodified adhesive, and
the transitional GIIC values before reaching steady state are
considered to be extrinsic toughness. The GIIC values in the
steady-state region ranges from 6.2 to 7.7 kJ/m2 as in
Fig. 7.
In contrast to the unmodified adhesive, GIIC of the
rubber-modified adhesive increases with crack growth in
the whole range of the growth, that is a typical behavior of
R-curve. Hence, in the initial stage of the crack propaga-
tion, GIIC of the modified adhesive is lower than that of the
unmodified one, but becomes greater in the range of
Da [ 25 mm.
Kim et al. reported that fracture toughness of epoxy
adhesive was decreased with the rubber modification under
mode II loading condition [13]. Their result was evaluated
for adhesively bonded compact shear (CS) specimens; thus,
it can be expected that the fracture toughness of the CS
specimens corresponds to the energy release rate of the
ENF specimen in the initial stage of crack propagation.
This implies that the energy release rate decreases in the
initial stage with the rubber modification, which agrees
with the trend of GIIC in Fig. 7 as mentioned above.
Contrary to the results, Ookubo et al. gave that the
rubber modification increased the fracture toughness
under mode II loading in different epoxy system,
whereby adhesively bonded tapered ENF specimens were
used under bending load condition [15]. Although the
crack propagated gradually for the tapered ENF specimen
in a trend similar to the present four-point bending ENF
test, they calculated the critical energy release rate based
on the peak load without taking crack growth into
consideration.
Applying to the above evaluation method based on the
peak load for the present adhesives, the critical energy
release rates obtained for the unmodified and modified
adhesives correspond to the value of GIIC in the initial and
finial stages of the crack propagation, respectively: the
critical energy release rates from the peak load for the
unmodified adhesive range from 7.5 to 9.5 kJ/m2, which is
nearly equal to GIIC for modified one (see Figs. 6 and 7).
Hence, the above two trends of fracture toughness do not
conflict with that in this adhesive system.
Figure 8 shows R-curves of DCB specimens with the
modified and unmodified adhesives under the mode I
loading. With a rubber modification a dramatic improve-
ment of fracture toughness is also observed for bulk DCB
specimens with the same epoxy resin and curing agent used
to the present adhesive [20]. In the figure, GIC is found to
be improved over ten times with the rubber modification.
This indicates that the rubber-modification effect on the
fracture toughness under mode II loading be small com-
pared to that under mode I loading.
Fracture surface observation
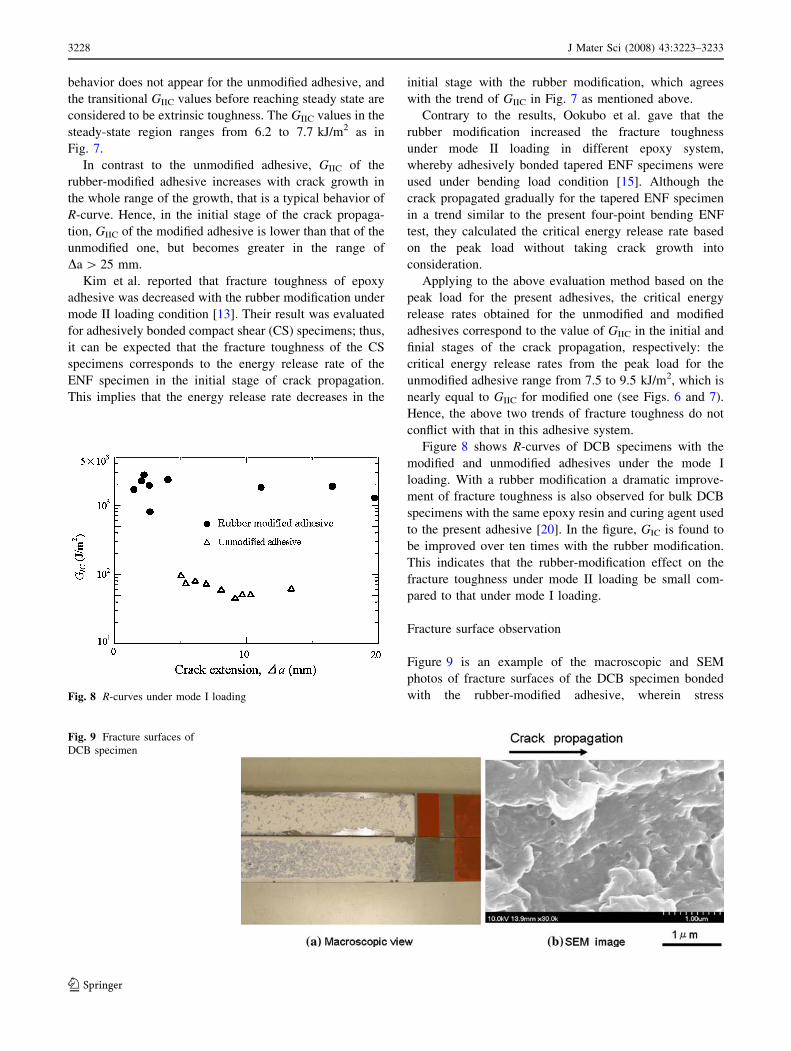
Figure 9 is an example of the macroscopic and SEM
photos of fracture surfaces of the DCB specimen bonded
with the rubber-modified adhesive, wherein stressFig. 8 R-curves under mode I loading
Fig. 9 Fracture surfaces of
DCB specimen
3228 J Mater Sci (2008) 43:3223–3233
123

whitening is also observed on the whole surface of the
DCB specimen having cohesive fracture pattern in Fig. 9a.
The stress whitening of rubber-modified epoxy resin under
mode I loading condition is, in general, considered to be a
formation of a damage zone induced from the cavitation or
debonding of rubber particles due to the expansion stress
[21]. Figure 9b indicates that numerous holes are formed
and then fracture surface is severely deformed as a typical
fracture surface of rubber-modified adhesive.
Fracture surfaces of ENF specimen bonded with the
rubber-modified adhesive are shown in Fig. 10. In contrast
to the DCB specimen, interfacial fracture is observed in the
region of mode II crack propagation as in Fig. 10a. Kim
et al. also reported interfacial fracture under mode II
loading condition for the CS specimens bonded with rub-
ber-modified epoxy adhesive mentioned above [13].
Figure 10b represents SEM observation in the cohesive
fracture area near the pre-crack, indicating that the fracture
surface is flat and there are few holes as trace of debonded
rubber particles. This implies that the debonding can be
suppressed for lack of expansion stress under mode II
loading.
Stress analysis
Both characteristics of the crack locus and R-curve are
related to the stress conditions near the crack tip. Here we
made FEM analysis for the ENF specimens in two cases:
one is before crack propagation through the crack tip
located in the middle of the adhesive layer, and the other is
for crack propagation process in the tip located at the upper
adhesive/adherent interface. The FEM program code used
in this analysis was of MSC-MARC. Figure 11 shows the
boundary conditions for the ENF specimen. This analysis
was performed under the assumption of plane strain con-
dition, incremental loads being applied to the upper loading
pins. To prevent overlap of the crack face, its contact was
constricted by using contact elements illustrated in Fig. 11,
where the coefficient of friction was considered to be zero.
In addition, the adherent was treated as an elastic material
whose Young’s modulus and Poisson’s ratio are 205.8 GPa
and 0.33, respectively. The unmodified adhesive was
treated as an elastic–plastic material having material con-
stants listed in Table 2, whereas Gurson’s model was
applied to the modified adhesive, because of proceeding in
yielding behavior due to the voids formation from rubber
particles. Details of Gurson’s model will be described later.
At first, the relation between the crack locus and stress
distributions around the crack tip was discussed. As men-
tioned previously, for both the rubber-modified and
unmodified adhesives, the void appears in front of the crack
tip and propagates in the direction of the upper interface.
Crack is, in general, liable to propagate in the perpendic-
ular direction of the maximum principal stress. Thus, the
stress was analyzed for the unmodified adhesive because its
crack propagation locus is similar to that for the modified
adhesive.
Figure 12a and b shows the vector and contour plots of
the maximum principal stress, respectively, where the
crack tip is located in the middle of the adhesive layer. As
Fig. 12a shows, the direction of the maximum stress near
crack tip indicates that there are two possibilities in the
direction of crack propagation: one is of the upper and the
Fig. 10 Fracture surfaces of
ENF specimen
J Mater Sci (2008) 43:3223–3233 3229
123

other is of the lower interfaces. Figure 12b indicates that
the maximum principal stress is concentrated at the upper
cracked surface and the area subjected to high stress
extends in the upper direction in the vicinity of the crack
tip. Hence, the crack is expected to propagate in the upper
direction that agrees with the experimental results in the
previous section.
Figure 13 shows the vector plots of the maximum
principal stress in the process of crack propagation,
wherein the crack tip locates at the upper interface. The
crack is expected to propagate through the upper adhered in
the direction of the maximum principal stress; however, the
crack could not penetrate into the adherent, so that it
propagates along the interface. Such a trend is also in
agreement with the experimental results.
Subsequently, the relation between stress distributions
and R-curve characteristics was discussed. The extent of
plastic and damage zones near the crack tip is related in
Fig. 11 Boundary conditions
for ENF specimen under mode
II loading
Fig. 12 The maximum principal stress near pre-crack tip (G = 6,548 J/m2)
Fig. 13 Vector plots of the maximum principal stress near interfacial
crack tip (G = 6,548 J/m2)
3230 J Mater Sci (2008) 43:3223–3233
123

terms of the crack initiation and propagation characteristic.
To investigate the effect of rubber modification on the
extent of the plastic and damage zones, the evolution of the
two zones was analyzed for both the adhesives. As
described above, the unmodified and modified adhesives
are treated as elastic-plastic and Gurson’s materials,
respectively. For the rubber-modified polymers, the
understanding of micro-mechanics has greatly advanced
through numerical works [22–24]; however, the criteria of
yield condition and damage evolution for the rubber-
modified polymers have not been formulated for the use of
FEM analysis.
The approximate constitutive equation proposed by
Gurson is widely available for estimating yielding behavior
of ductile materials [25, 26], that is an only method for
simulating the yield and damage zones by use of FEM
analysis in the present situation. Furthermore, Gurson’s
constitutive equations were applied to calculation of the
yield stress and shape of damage zone around the crack tip
for rubber-modified epoxy resins, where rubber particles
were considered to act as the initial voids [27–29]. In the
present study, the rubber-modified adhesive was treated as
a Gurson’s material, the following modified Gurson’s
constitutive equation being applied for the adhesive layer.
F ¼ rM
ry
� �2
þ 2q1f coshq2rkk
2ry
� �� f1� ðq1f Þ2g ¼ 0
ð7Þ
where F is the yield function, ry the yield stress of matrix,
rkk the first stress invariant, f the void-volume fraction, rM
the Mises equivalent stress, and q1 and q2 the yield surface
multipliers. In the present work, the rubber particles were
assumed as initial voids, the coalescence and nucleation of
voids being neglected, and that the matrix was plastically
incompressible. Hence, the change in the void-volume
fraction during an increment of deformation can be given
by
f�¼ ð1� f Þe�
p
kk ð8Þ
where e�p
kk is the increment of hydrostatic strain of the
plastics, and f�
is the increment of the void-volume fraction.
In application of Gurson’s model to the adhesive layer,
material constants of the bulk resin, the initial void-frac-
tion, and the surface multipliers, q1 and q2, are required,
which are given as follows: material constants of the bulk
matrix resin are the same as those of the unmodified
adhesive listed in Table 2, the initial void-fraction is 0.14,
q1 = 1.0 and q2 = 1.9. Similar to the stress analysis for the
maximum principal stress, both the plastic and damage
zones were analyzed in two cases: the crack tip locates in
the middle of the adhesive layer and at the interface.
Figure 14 shows contour plots of plastic strain, ep, and
void-fraction, f, near the crack tip located at the adhesive/
adherent interface. In Fig. 14a, b, the size of plastic zone
expands in front of the interfacial crack tip for both the
adhesives, where the size of plastic zone with the strain of
ep [ 0.12 for the modified adhesive is so large as three
times for the unmodified one. This indicates that the rubber
modification enlarges the plastic zone. Figure 14c shows
that the void-fraction increases not only in the vicinity of
the crack tip but also away from the crack tip, though being
restricted within shallow area from the interface. The
increase in the void-fraction promotes the expansion of the
plastic zone. This may be a reason why the plastic zone of
the rubber-modified adhesive is larger than that of the
unmodified one. Thus, it is expected that more energy is
dissipated with the plastic deformation through the rubber
modification. Since the total energy release rate is the same
for the each adhesive, the remaining energy used for crack
propagation decreases with the rubber modification. This
Fig. 14 Contour plots of plastic
strain and void-fraction near
interfacial crack tip
(G = 6,548 J/m2)
J Mater Sci (2008) 43:3223–3233 3231
123
agrees with the trend of R-curves in Fig. 8: in other words,
the crack resistance is increased with the rubber
modification.
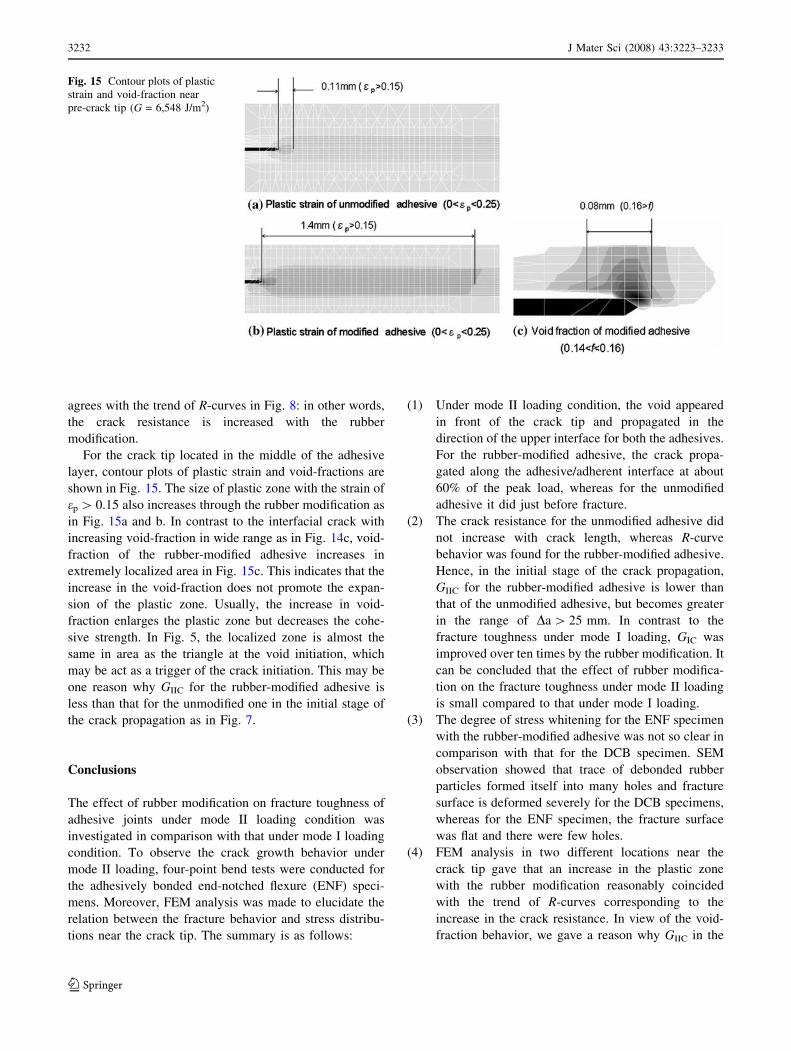
For the crack tip located in the middle of the adhesive
layer, contour plots of plastic strain and void-fractions are
shown in Fig. 15. The size of plastic zone with the strain of
ep [ 0.15 also increases through the rubber modification as
in Fig. 15a and b. In contrast to the interfacial crack with
increasing void-fraction in wide range as in Fig. 14c, void-
fraction of the rubber-modified adhesive increases in
extremely localized area in Fig. 15c. This indicates that the
increase in the void-fraction does not promote the expan-
sion of the plastic zone. Usually, the increase in void-
fraction enlarges the plastic zone but decreases the cohe-
sive strength. In Fig. 5, the localized zone is almost the
same in area as the triangle at the void initiation, which
may be act as a trigger of the crack initiation. This may be
one reason why GIIC for the rubber-modified adhesive is
less than that for the unmodified one in the initial stage of
the crack propagation as in Fig. 7.
Conclusions
The effect of rubber modification on fracture toughness of
adhesive joints under mode II loading condition was
investigated in comparison with that under mode I loading
condition. To observe the crack growth behavior under
mode II loading, four-point bend tests were conducted for
the adhesively bonded end-notched flexure (ENF) speci-
mens. Moreover, FEM analysis was made to elucidate the
relation between the fracture behavior and stress distribu-
tions near the crack tip. The summary is as follows:
(1) Under mode II loading condition, the void appeared
in front of the crack tip and propagated in the
direction of the upper interface for both the adhesives.
For the rubber-modified adhesive, the crack propa-
gated along the adhesive/adherent interface at about
60% of the peak load, whereas for the unmodified
adhesive it did just before fracture.
(2) The crack resistance for the unmodified adhesive did
not increase with crack length, whereas R-curve
behavior was found for the rubber-modified adhesive.
Hence, in the initial stage of the crack propagation,
GIIC for the rubber-modified adhesive is lower than
that of the unmodified adhesive, but becomes greater
in the range of Da [ 25 mm. In contrast to the
fracture toughness under mode I loading, GIC was
improved over ten times by the rubber modification. It
can be concluded that the effect of rubber modifica-
tion on the fracture toughness under mode II loading
is small compared to that under mode I loading.
(3) The degree of stress whitening for the ENF specimen
with the rubber-modified adhesive was not so clear in
comparison with that for the DCB specimen. SEM
observation showed that trace of debonded rubber
particles formed itself into many holes and fracture
surface is deformed severely for the DCB specimens,
whereas for the ENF specimen, the fracture surface
was flat and there were few holes.
(4) FEM analysis in two different locations near the
crack tip gave that an increase in the plastic zone
with the rubber modification reasonably coincided
with the trend of R-curves corresponding to the
increase in the crack resistance. In view of the void-
fraction behavior, we gave a reason why GIIC in the
Fig. 15 Contour plots of plastic
strain and void-fraction near
pre-crack tip (G = 6,548 J/m2)
3232 J Mater Sci (2008) 43:3223–3233
123

initial stage of the crack propagation for the rubber-
modified adhesive is less than that in the unmodified
one.
Acknowledgements The Authors would like to acknowledge Japan
Synthesis Rubber Co. for Providing XER-91.
References
1. Bascom WD, Cottington RL, Jones RL, Peyser P (1975) J Appl
Polym Sci 19:2524
2. Bascom WD, Cottington RL (1976) J Adhes 7:333
3. Rakestraw MD, Taylor NW, Dillard AD, Chang T (1995) J Adhes
55:123
4. Daghyani HR, Ye L, Mai Y-W (1995) J Adhes 53:149
5. Daghyani HR, Ye L, Mai Y-W (1996) J Mater Sci 31:2523. doi:
10.1007/BF00687277
6. Ashcroft IA, Hughes DJ, Shaw SJ (2001) Int J Adhes Adhes
21:87
7. Yee AF, Person RA (1988) In: Roulin-Moloney AC (ed) Fracto-
graphy and failure mechanism of polymers and composites.
Elesvier Applied Science Publisher, London & New York, p 219
8. Chai H (1992) Int J Frac 58:223
9. Chai H (1998) Int J Frac 37:137
10. Daghyani HR, Ye L, Mai Y-W (1996) J Adhes 56:71
11. Blackman BRK, Kinloch AJ, Paraschi M (2005) Eng Frac Mech
72:877
12. Chai H, Martin YMC (1996) J Mech Phys Solids 44:1669
13. Kim HS, Ma P (1998) Key Eng Mater 137:179
14. Kim HS, Ma P (1998) J Appl Polym Sci 69:405
15. Ookubo K, Yoshimitu H, Fujii Y (2001) Trans JSME Ser A
67:106 (in Japanese)
16. de Morais AB, de Moura MFSF (2006) Eng Frac Mech 73:2264
17. Martin RH, Davidson BD (1999) Plast Rubber Comp 28:401
18. Schuecker C, Davidson BD (2000) ASTM STP 1383:334
19. Sun X, Davidson BD (2005) Int J Frac 135:51
20. Du J, Thouless MD, Yee AF (2000) Acta Mater 48:3581
21. Person RA, Yee AF (1989) J Mater Sci 24:2571. doi:10.1007/
BF01174528
22. Guild FJ, Kinloch AJ (1995) J Mater Sci 30:1689. doi:10.1007/
BF00351597
23. Chen XH, Mai Y-W (1998) J Mater Sci 33:3529. doi:10.1023/
A:1004686708639
24. Chen XH, Mai Y-W (1999) J Mater Sci 34:2139. doi:10.1023/
A:1004576213379
25. Gurson AL (1977) J Eng Mater Tech 99:2
26. Tvergaard V (1982) J Mech Phys Solids 30:399
27. Kody RS, Lesser AJ (1999) Polym Comp 20:250
28. Ikeda T, Mano J, Ikemoto D, Lee DB, Miyazaki N (2003) Trans
Japan Soc Mech Eng 69:434 (in Japanese)
29. Imanaka M, Nakamura Y, Nishimura A, Iida T (2003) Comp Sci
Tech 63:41
J Mater Sci (2008) 43:3223–3233 3233
123