Embed Size (px)
Citation preview
A COMPARISON OP EUROPEAN HISTORY STUDENTS AT BETHANYCOLLEGE, KANSAS BASED ON VARIOUS HIGH SCHOOL SIZES
HENRY MARTIN LOUIS
B. S., Kansas State University, 1965
A MASTER'S REPORT
submitted in partial fulfillment of the
requirements for the degree
MASTER OP SCIENCE
College of Education
KANSAS STATE UNIVERSITYManhattan, Kansas
1967
Approved by:
Major Professor
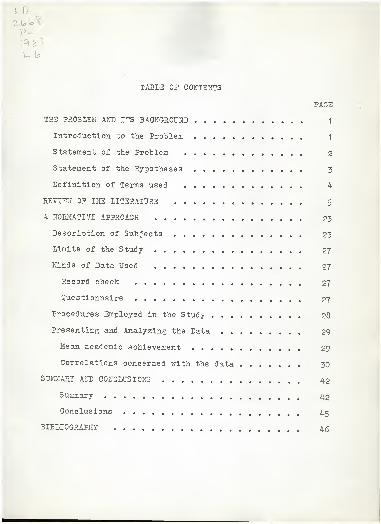
TABLE OP CONTENTS
PAGE
THE PROBLEM AND ITS BACKGROUND 1
Introduction to the Problem 1
Statement of the Problem 2
Statement of the Hypotheses 3
Definition of Terms used 4
REVIEW OP THE LITERATURE 5
A NORMATIVE APPROACH 23
Description of Subjects 23
Limits of the Study 27
'Kinds of Data Used . . . 27
Record check 27
Questionnaire 27
Procedures Employed in the Study 28
Presenting and Analyzing the Data 29
Mean academic achievement 29
Correlations concerned with the data 30
SUMMARY AND CONCLUSIONS 42
Summary 42
Conclusions 45
BIBLIOGRAPHY 45
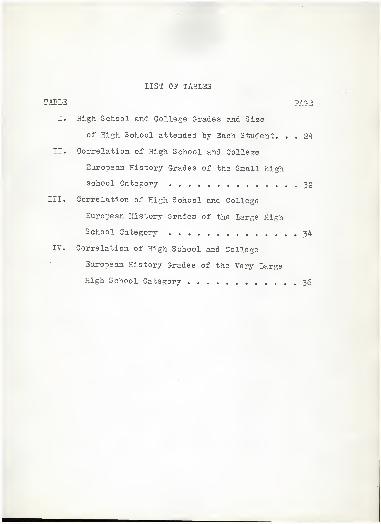
LIST OP TABLES
TABLE PAGE
I. High School and College Grades and Size
of High School attended by Each Student. . . 24
II. Correlation of High School and College
European History Grades of the Small high
school Category 32
III. Correlation of High School and College
European History Grades of the Large High
School Category 34
IV. Correlation of High School and College
European History Grades of the Very Large
High School Category 36
THE PROBLEM AND ITS BACKGROUND
Introduction to the Problem
The study of school size is invariably concerned with
the search for efficiency. Does the size of the high school
attended influence the efficiency of students in college?
There are those who write that the larger schools have
made wider ranges of experiences available to their students,
and that better teaching has been available in the larger
schools.' There are those who write that the major -problem
facing education in the United States today is the existence
of too many small schools. 2 Advances registered in all areas
of the secondary curriculum in recent years, in both new know-
ledge to be learned and in new ways of presenting the materials
to students, point to a continual study program for teachers
in secondary schools. There is the possibility that continuing
advances in any area of the curriculum are great enough to
require concentrated study in that area by teachers. Hence, it
seems that the advances would demand a specialization in one
area if a teacher were to stay abreast of these trends. The
problem of meeting this demand is compounded in the smaller
1 Carl Eisemann, "in Reorganized Districts Children doLearn More," The Nation's Schools . LIX (June, 1957), vv- 61-63.
James 3. Conant, The American High School Today (NewYork: McGraw-Hill Book Co., 1959), p. 37.
schools where the teacher. must teach In at least two, and in
many cases more than two fields of study. The problem may,
or may not, he complicated further by the shorter tenure of
teachers in the smaller districts. A number of studies
have shown that the teachers in the smaller schools, for a
variety of reasons including the number of different classes
they teach, salary differential, lack of advancement possi-
bilities, the restricted social environment, and the paucity
of professional contacts, tend to migrate to larger school
systems. One result of this movement is that teachers seldom
remain in the smaller schools long enough to learn what mate-
rials are available for them to use as they plan the educa-
tional experiences that the children in their classrooms will
have.
If one is to lenow whether the above wealoiesses in the
small high school have any effect upon the student's ability
to achieve academically in college, a study comparing academic
achievement in college with academic accomplishments in high
school organized along the lines of various high school sizes
is essential.
Statement of the Problem
The students in the European history survey courses at
Bethany College were divided into three categories according
to the size of high school they attended, (a) small high
school of 299 students or less, (b) large high school of 300
to 1299 students, (c) and very large high school of 1300 or

more students. The purposes of this study were to (1) compare
the academic achievement of each group to reveal if a parti-
cular size of high school affected the efficiency of a stu-
dent in European history at Bethany College and (2) correlate
the high school and college European history grade within each
group to reveal if a particular size of high school resulted in
one obtaining the same college grade in European history at
Bethany college as he did in European history on the high
school level.
Statement of the Hypotheses
1. There .will he a numerical difference in the grade point
averages (means) of the three categories in high school
European history.
2. There will be a numerical difference in the grade point
averages (means) of the three categories in college
European history.
3. There will be a numerical difference between the high
school and college European history grade point averages
(means) within each category.
4. There will be a numerical difference among the three
categories pertaining to hypothesis three.
5. There will be at least a low positive correlation
( +.20 to +.40) between high school and college
European history grades within each category.
6. There will be a correlational difference among the
three categories pertaining to hypothesis five.
Definition of Terms Used
Small high school . A small high school was the last
four years on the secondary level 9th, 10th, 11th, and 12th
grades, of a high school -with 299 or less students enrolled.
Large high school . A large high school was the last
four years on the secondary level 9th, 10th, 11th, and 12th
grades, of a high school with 300 to 1299 students enrolled.
Very large high school . A very large high school
was the last four years on the secondary level 9th, 10th,
11th, and 12th grades, of a high school with 1300 or more
students enrolled.
Academic Achievement . As applied in this study,
academic achievement was a measurement of scholastic suc-
cess by the use of grades obtained in the survey courses,
"Europe to 1815" and "Europe Since 1815" in comparison
to grades made in the high school European history courses.
These grades received in college and high school were
identified on a numerical base of A= 4 points; B= 3 points;
0= 2 joints; D= 1 point; and P= points.
REVIEW OP THE LITERATURE
Pittenger reported a study concerned with size of high
school and efficiency of the graduates of the different size
high schools in the College of Science, Literature and the Arts
at the University of Minnesota in 1917. He used six differing
sizes of public high schools with the following enrollment cate
gories in his study: 1-100, 101-200, 201-300, 301-500, 501-
1,000, and 1,000 and more. He divided his sample, by size of
high school, into three groups representing the upper quartile,
middle quartiles, and lower quartile in college scholarship as
measured by what is termed "grade points" today. Total grade
points earned on his rating scale were used to place a student
in a certain quartile as stated above. On this basis he
concluded
,
Graduates of the large public schools, speakingin terms of enrollment showed greater collegeefficiency, both in marks and retention, than didgraduates of the smaller public schools. ... Ingeneral, the larger the schools, the greater wasthe college efficiency. of its graduates; this seemsto have been the rule.
Thomberg did a Master's thesis concerned with college
1 3enjamin P. Pittenger, "The Efficiency of Collegestudents as Conditioned by Age at Entrance and Size of Firh^h0 ° 1
' Sixteenth Yearbook of the National Society for'
the atud y of Education, Part II (3 loom in.?ton. TYi -i r/n i <.
.
Puolic School Publishing Co., 1917), p. 109.
scholarship and size of high school at Washington State
College in 1924. The 1921 and 1922 entering freshmen classes
served as the sample for his study. Seven varying sizes of
high schools, from an enrollment of less than 50 students
to an enrollment of 1,000 and over were used. Working with
grade points, as he defined them, he found the total grade
points earned by students from the various sizes of high
schools. 3y dividing total grade points earned by all students'
of a certain size high school, he arrived at an average number
of grade points for the students in each high school size
category. He found that students from the smallest high
schools, category 1 to 50, had an average of 16.91 points
for each semester's work and concluded that they were "C"
students. The students from the largest high schools had an
average of 23.11 points for each semester's work, and Thornberg
concluded that they averaged 8 hours of "b" work each sem-
ester. The difference found in the averages by Thornberg
was further illustrated in the average number of "A" grades
in the smallest and largest schools. This was listed as an
average of 4.92 hours of "A" grade for the graduates of the
smallest schools and an average of 9.95 hours of "A" grade
for the graduates of the largest schools. These figures
were for the 1921 entering freshmen class. Respective figures
for the 1922 entering class were 1.13 hours of "A" grade
for the graduates of the smaller schools and 2.45 hours of
"A" grade for the graduates of the larger schools. As a
general conclusion, Thornberg wrote:
According to this investigation, students from largehigh schools are superior in scholarship in college tothose from smaller high schools.
Odell reported a study of 1702 graduates from Illi-
nois high schools, class of 1924, in which he compared average
college marks and size of high school attended. He established
five size categories for the high schools, 1 to 99, 100 to
299, 300 to 499, 500 to 999, and 1,000 and more. He concluded:
The apparent conclusion regarding the matter is,therefore, that on the whole there is little relation-ship between size of high school attended and collegesuccess as measured either by marks received or lengthof attendance.^
Odell did find, however, that there were slight advantages
in favor of the largest high schools, or slight disadvantages
in favor of the smallest high schools. 3
Burgraff studied the academic records of 890 students
from Idaho public high schools who entered the three institu-
tions of higher learning in Idaho in 1925. These were divided
among the three institutions of higher education and according
to size of high school from which the students had graduated.
Eurgraff found that the smaller schools sent a larger percentage
? m^u 3este r. H., Thoraberg, "Allege Scholarship and Size™ ifS .
Cm?0l> Sch001 a*d Society. XX (August, 1924),vv. 189-192.
2
"+n/ + J1
'Pred icting the Scholastic Success of
1
n jf /rntS
-;T
bureau of Educational Research, Bulleting; 5 2 Uroana: University of Illinois College of Education,
^Ibid.
of their graduates to college than did the larger schools. 1
she also reported that the size of the high school in which
a student received his training had no significance in de-
termining either scores on intelligence tests taken upon
entrance or quality of scholarship at the higher institu-
tions as measured "by grade point average achieved. 2
The first term college grade averages of 1,293
students who entered the University of Oregon in the Pall
terms of 1926, 1927, and 1928 were studied in relationship
to both size of high school graduated from and percentile
rank on the ACS Psychological tests by T. R. Humphreys in
1929. Humphreys found no relationship between percentile
ranking on the ACS tests and size of high school from which
students graduated. He did find a relationship between
size of high school and average college marks. The stu-
dents from the larger schools received the higher averages
and those from the smallest schools received the lowest
college averages. Upon closer examination Humphreys found
that the error of measurement attendant to college aver-
ages was quite large, and he concluded that any difference
Uaonerine 3urgraff, "The Relation of the Accredit-ing standards of Idaho High Schools to their Educational?o^Y
Ct ^P^ 13- 3^ Master's thesis, University of fdaho,-Ly^o J , p. 24.
2Ibid . , p. 37.
found was not significant. 1
McQuitty compared freshmen year scholarship of
students who entered the University of Florida the three
years between 1930-31 and 1932-33. If ten or more freshmen
from a high school entered the University during the time
period, McQuitty classified it as a large high school. If
fewer than ten freshmen entered during the three year period,
the school was classified as a small school. Grade point
averages of 1,831 students were compared. Of these, 1,457
were from large schools, 374 from small schools. McQuitty
found that the large school graduates achieved higher aver-
ages in all areas except languages. The grade point differ-
ences between the groups ranged from 1.32 in science courses
to .13 in social science courses. The standard error of
the difference between the averages was reported to be .12
and this was said to be quite significant. McQuitty'
s
conclusion was that, "As a group, graduates from large high
schools are scholastically superior to those from small
high schools." 2
1 T. R. Humphreys, "A Study of the Relationshipbetween Size of Oregon Secondary Schools and tbe Abilityof their Graduates Snterlng the University of Oreron"(unpublished Master's thesis, University of Oregon, 1929),P • J.XO •
i ,*JI
Y:McQuitt7» "Relative Scholarship of GraduatesAccoroing to Accreditation of High Schools," Bulletin ofthe American Association of OonfiHatP t?p^q trars7TTTl934
)
t>. Its 9. — -' ' v-^ '
'
10
In a study of 1,568 freshmen who entered the Uni-
versity of Minnesota during the 1932-33 school year, True
3. Pettingill found a significant difference in the mean
percentile rank: on the Minnesota College Aptitude Test in
favor of the group of 1,151 freshmen who graduated from
high schools in towns of less than 5,000 population. This
initial advantage was not evident when the average college
grades were compared at the end of the first quarter of
college work. The difference found in the performance of
the two groups was not significant. Pettingill' s study was
made in an attempt to determine if size of high school might
be a significant factor in the prediction of academic suc-
cess in college. On the basis of his findings, it was con-
cluded,
There appear to be no significant differences at theUniversity of Minnesota between freshmen from publichigh schools in cities of less than 5,000 Tjotndationand freshmen from Minneapolis and St. Paul" public highschools in the value of percentile ranks on" the Minne-sota College Aptitude Test, taken either separately orcombined in predicting first quarter college grades. 1
Peder compared entrance examination scores and college
grade point averages for the first and second semesters of the
freshmen who entered the State University of Iowa during the
five year period, 1929-1933, inclusive. The measures were
recorded according to the size of high school from which the
1 True 3. Pettingill, "Size of high School andPredictive Value of Class Rank and Aptitude Test ^ank,"Bulletin of the American Association of CollegiateRegistrars. IX (19337,' r>. 193.
11
students graduated. Using- the high school size categories,
1-64; 65-149; 150-349 and over, Feder found that generally
students from the larger high schools scored higher on the
Freshmen Qualifying examination, hut that subsequent achieve-
ment of graduates of the smaller high schools. Feder did
record the percentages of students in the state according
to the various sizes of high schools listed and compared
these percentages with the percentages entering the University.
He found that the two smaller categories did not contribute
their expected percentage of students to the University en-
rollment and that the upper two sizes contributed more than
their expected percentage of students. 1
Jones and Laslett made a study of 500 students at
Oregon State College which was reported in 1935. The study
included calculations with the Jones Prediction Formula for
estimating college success. The formula overpredicted in
this study and one reason offered in explanation was that
many students from the small high schools had developed weals
study habits. 2 The authors concluded, however, that "in this
•i
D. P. Feder, "Factors T,fhich Affect Achievementand Its Prediction at the College Level," Journal of theAmerican Ass ociation of Collegiate Registrar's. XV (January,i9«o;, pp. 107-118. *
2George A. Jones and H. R. Laslett, "ThePrediction of Scholastic Success in College,"Journal of Educational Research . XXIX (December, 1935),"D. 268.
12
study the size of high school from which the students came
"bears little relation to the college marks they made." 1
F. S. Sheeder, doing research with students at
TJrsinus College who graduated from high schools in the bottom
half of their graduating classes, reported that whereas
71 per cent of the lower group students from city schools
were able to do satisfactory work in college. Only 45 per
cent of the lower group students from small town or rural
schools could do satisfactory college work. Sheeder attempt-
ed to analyze why the results he obtained may have been true.
He said that some subtle factors such as cultural background
may have been the cause, but that it was more likely the
opportunities available in the larger schools such as a
better quality of teaching, better school facilities, and a
wider range of experience.
^
Alexander and Woodruff studied the 1933 entering
freshmen class at the University of New Hampshire look-
ing for determinants of college success. "With a sample of
1,600 students, they reported that on freshmen mental tests
there was "no relation between percentile rank on tests
and the size of the high school from which the students
1 Ibid., p. 271.
2?. 3. Sheeder, "College Achievement of LowerGrour) Students," Journal of Sd ucati onal Re search . XXXVI(Karch, 1938), tdt>7T97-505.
13
graduated. M1
Daniel Karris, in a review of the factors affect-
ing college grades, reported that of the studies he review-
ed, the superior college students came from large city high
schools in two studies, hut in three others this was report-
ed not to he the case. One of the three did report that
grade prediction was more accurate for students from the
larger high schools. 2In his conclusion, Harris wrote that
he felt that the essential factors in achievement, in their
order of importance were "(1) Ability (or intelligence, or
scholastic aptitude, etc.); (2) Effort (or drive, or degree
of motivation, etc.); (3) Circumstances (personal, social,
etc.). "3
Seyler studied 6,263 Illinois high school graduateswho entered the University of Illinois in 1935, 1936, 1937,and 1938. Using eight size categories of high schools, he
found that the mean freshmen grade point average for the
students from high schools with less than 100 enrollment wasthe highest. He added that although his study indicated thata better quality of student entered the University of Illinois
Colle^e°sSSess9
"a?ou?^f n?
UJ? t'
*°"™**. determinantsW), l. 483?
Journal of Higher Eduaa.t.1 or,T XI (December,
1*.
of1940), P T 4831
2
a p**h '^l?1 Harris» "Factors affecting College Gr-des-
^ibia .. p . 151.
14
from the smaller high schools, that the difference in achieve-
ment would not Justify using a separate educational guidance
program for the students which was based upon the size of
high school from which the students graduated. 1 Seyler
reported no attempt to control scholastic aptitude of these
students when he compared their achievement.
The records of 1,321 freshmen at the University
of Missouri were studied hy Mildren Winn Saupe in 1941.
She was interested in how the scholastic achievement of
students from various size high schools, who were in the
middle 60 per cent range of scores on the Ohio State Psycho-
logical Examination, and whose class rank in high school
was in the middle 60 per cent, compared. She also compared
the achievement of students in the upper quartile in this
test's distrifution in relation to the size of high school
from which the students graduated. Four hundred sixty-two
students were in the "average" group and 356 students were
in the "superior" group. 2Saupe used size of graduating
class to determine her enrollment categories. These were
rTl5f,„ ,.S * ?• Se£ler, "The Value of Rank in High SchoolGraduating Class for Predicting Freshmen Scholarship"
FaetnT. ^Mnn?f
d ''^ SaUp8' "
SiZ9 0f Hi&h Schoo1~ as &
J?Srnai Sf 2hp ?L ••
CCeS.
°f ^verase and s™rior Graduates,"
15
1 to 24; 25 to 49; 50 to 99; 100 to 199; 200 and over. She
included a special category for graduates of the large city
high schools in St. Louis, Kansas City, and St. Joseph.
When comparisons of average scholastic achievement for the
freshmen year were made on a 400-point index, it was found
that in the "average" group the mean score of the students
from the smallest enrollment category was 21 points higher
than the mean score of the students from the large city
schools. In the "superior" group, the students from the
large city schools averaged three points higher scores than
the students from the smallest schools. Neither of these
differences proved to he statistically significant. Saupe
concluded that although the students in the larger schools
seemed to have many apparent advantages, perhaps the students
in the smaller schools learned superior study habits. 1
Harl Douglas, in a study attempting the prediction
of success of students in the various schools of the Uni-
versity of Minnesota, and especially in connection with
success in the medical school, concluded that neither size
nor type of high school were closely related to success
in this school. Numbers of students involved in this study
and calculation upon which to base this conclusion are not
shown in the report. Although this study was reported in
1942, the groups of students studied were in the 1933, 1934,
1 Ibid., p. 57.
16
and 1935 entering freshmen classes of the University of
Minnesota. 1
Garrett, in a 1949 summary of the studies of factors
relating to college success, listed nine studies which dealt
with the relationship between high school size and success
in college. Of these, seven listed little, if any, relation-
ship and two found relationships in favor of high schools
with enrollments of over 100 students. 2
Bertrand, in a dissertation submitted to Cornell
University in 1950, reported on the relationship "between
size of high school attended and success of students at
the Agricultural and Mechanical College of Texas. His en-
rollment categories were, under 150; 150 to 249; 250 to
499; 500 to 999; and 1,000 and over. Ke had a varying sample
that ranged between 352 and 621, all white, male students
who entered the college with the 1946-1948 classes. Bert-
rand controlled aptitude in his calculations by comparing
the marks of students who had scored in the same quartile
on the gross score of the ACE. Within these quartile ranges,
1 Harl R. Douglas, University of Minnesotaotudi es in Pre d icting; Scholasti c Achieve ment". " ?a~t II(Minneapolis
: University of Minnesota tress, 1942).p. 15.
2Harold F. Garrett, "A Review and Interpretationof Investigations of Factors Related to the ScholasticSuccess in Colleges of Arts and Sciences and TeachersColleges, Journal_ofJExr>erimental Education, XVIII(December, 19^9} , vx>. 9~8-:L15~
17
he then compared percentages of students from each size
high school scoring in each quartile of the ACE, their mean
grade point ratios at the end of the second year in all
courses taken in English, natural science, and agriculture,
and the numbers of students who completed two years of college."
An analysis of this report leads one to the conclusion that
there is little consistent relationship "between size of
high school and college grades in the fields which 3ertrand
studied. He did find a higher percentage of students from
the smaller schools scoring in the lowest quartile on the
ACE gross score, and a much smaller percentage of students
from these schools scoring in the highest quartile. He
suggested that this might he due to the language portion
of the test. Students from the small schools in the lowest
quartile on the aptitude measure scored considerably higher
grade point averages than did students from the largest
schools, who also scored in the lowest quartile, in all
areas except English. In the highest quartile, the students
from the largest schools generally received the highest
marks .
•
Gray, in 1950, studied the relationship between size
1 J. R. Eertrand, "Relation between Enrollment ofHigh Schools from Which Students Graduated and AcademiAchievement of Agricultural Students, A. and M. ColierTexas, journal of Experimental Education, XXV (September1956), pp. 59-69.
c
e of
18
of high school attended and success in college as measured
by honor point ratio obtained by students from different
sizes of high schools. He tised as his sample 2,476 students,
1,107 males and 1,369 females, who met the following require-
ments :
A graduate of a Minnesota public high school whoentered an institution of higher learning for the firsttime in the College of Science, Literature, and theArts during one of the fall quarters of the years 1940-41 to 1946-47, inclusive, and who received at least onefinal grade. 1
His sample was divided into nine sizes of high schools
according to enrollment in grades 10, 11, and 12. These
were later reduced to three, as follows: 25 to 174; 175
to 974; 975 and over. He found that there were significant
differences in high school percentile ranks and in Co-
operative English scores among the students from the different
size high schools. This difference was at the .05 level
of confidence. Gray further treated his data by comparing
honor point ratio quartlle scores with the ACE percentile
ranis and high school percentile ranks from the various
sizes of high schools. He then made paired comparisons
between small and medium size schools, medium and larp-e
1 A. L. Gray, "The Relation of Size of HighSchool to Collegiate Success" (Unpublished DoctoralDissertation, University of Minnesota, January, 1950),P • ( •
19
size schools, and snail and large size schools. These
were made on the sexes individually. In making the compari-
sons, Gray found that of 261 collegiate honor point ratio
quartile comparisons, 49 differences were in favor of the
smaller of the pair of schools being compared.. Two of these
were significant differences. There were 205 differences
in favor of the larger of the pair of schools "being compared
and 53 of these were significant differences. Of the dif-
ferences in favor of the larger schools, only three were
for percentile rank groups in the ACS or high school rank
below the fiftieth percentile rank, while 39 were for per-
centile rank groups above the seventieth percentile. Gray
concluded that his results indicated that the more capable
students in his study from the high schools enrolling 975
or more students in grades 10, 11, and 12 earned significantly
higher honor point ratios than did the more capable students
from either medium or small schools. He emphasized that
this is especially true of those students who ranked above
the seventieth percentile on the ACE or above the seventieth
percentile in high school marks. It was true to some ex-
tent of. those students who ranked above the fiftieth per-
centile on these two variables. Gray also stated that there
was little difference between the collegiate honor point
ratios earned by graduates of high schools enrolling between
175 and 975 students and those enrolling fewer than 175
students.
1 Ibid., ^v. 74-86
20
A study of the graduates of Georgia secondary
schools for white students and their success in college in
relation to size of high school attended was reported by
Bledsoe in 1954. The sample was divided into large, medium,
and small high schools by comparing the size of graduating
classes. Thus, less than 40 graduates was a small school,
40 to 99 graduates a medium size school, and 100 and over
graduates a large school. Bledsoe was able to compute the
average college marks received "by graduates of these various
size schools, and his report was "based upon the numbers
of schools in his size categories, and not the number of
students involved. By this process, average mean marl-cs of
graduates from the larger schools were shown to be signi-
ficantly higher than the average mean marks for either the
small or medium size schools. The significance was at the
.ol level of confidence. Bledsoe also compared the schools
within the tip 27 per cent of his marking index with those
in the lower 27 percent of the index. In this manner he
found that the schools in the top 27 per cent averaged 49
students in their graduating classes while those in the
lowest 27 per cent averaged but 29 students in their graduat-
ing classes. Brom these findings, Bledsoe concluded that
in Georgia, white students from large graduating classes
did make significantly higher average marks during their
first year in college than did students from small and medium
21
size high schools. 1
In a study of seventh semester students at Central
Michigan College concerned with size of high school and
academic achievement at the college, Altman, in 1959, re-
ported the following conclusion: "Graduates of the larger
high schools did not achieve significantly higher point
averages than did the graduates of the smaller schools. "2
Altman 's sample was a limited one of 144 students. The en-
rollment categories of the schools used for comparison in
her study were, under 175 students; 175 to 374; 375 to 899;
900 and more. In the smallest category, she had only ten
students so her conclusions were "based upon a comparison
of sizes remaining. Altman did show calculations of the
college marks of the group of students from the smallest
schools. These showed that no student from the smallest
size school group was in the 2.50 to 2.99, or A-minus mark
3group. J
Collegiate scholastic achievement and its relation-
ship to high school size was studied "by Lathron at Iowa State
J. C. Bledsoe, "An Analysis of the Relationship ofSize of High School to Maries Received by Graduates in FirstYear of College," Journal of Educational Soci ology. XXVII(March, 1954), p. 4lB1
2Esther R. Altman, "Effect of Rank in Class and Sizeof High School on the Academic Achievement of Central MichiganCollege Senior Class of 1957," Journal of Educational Research,LII (April, 1959), p. 309.
L
5U?iA-» vv* 307-309.
22
College in I960. He had a sample of 1,516 nontransfer Iowa
public school graduates who entered Iowa State College in
the Pall of 1952, but to eliminate what he called "the com-
pounding effect of high school course patterns", he reduced
this sample to 180 students and three size categories when
considering scholastic achievement at the college. He than
concluded that the size of high school was almost unrelated
to college achievement.
A brief analysis of the studies reviewed would in-
dicate that early findings concerned with marlcs in college
courses obtained by graduates of various sizes of high
schools generally favored the graduates of the larger schools.
Most differences reported were not significant differences.
Later comparisons generally found no significant differences
in attained college grade point averages in relationship to
size of secondary school attended.
I. T. Lathrop, "Scholastic Achievement at IowaState College Associated with High School Size and CoursePattern," Journal of Experimental Education, XXIX (September,I960), p. W.
A NORMATIVE APPROACH
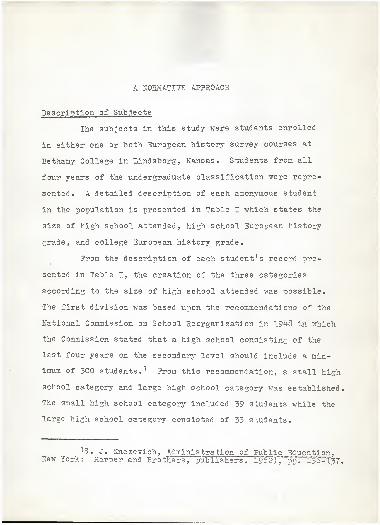
Description of Subjects
The subjects in this study were students enrolled
in either one or both European history survey courses at
Bethany College in Lindsborg, Kansas. Students from all
four years of the undergraduate classification were repre-
sented. A detailed description of each anonymous student
in the population is presented in Table I which states the
size of high school attended, high school European history
grade, and college European history grade.
Prom the description of each student's record pre-
sented in Table I, the creation of the three categories
according to the size of high school attended was possible.
The first division was based upon the recommendations of the
National Commission on School Reorganization in 1948 in which
the Commission stated that a high school consisting of the
last four years on the secondary level should include a min-
imum of 300 students. 1 From this recommendation, a small high
school category and large high school category was established.
The small high school category included 39 students while the
large high school category consisted of 33 students.
1 S. J. Kne zevich, Administration of Public Education ,
New York: Harper and Brothers, publishers, 1962 J, -qv. 136-137,
24
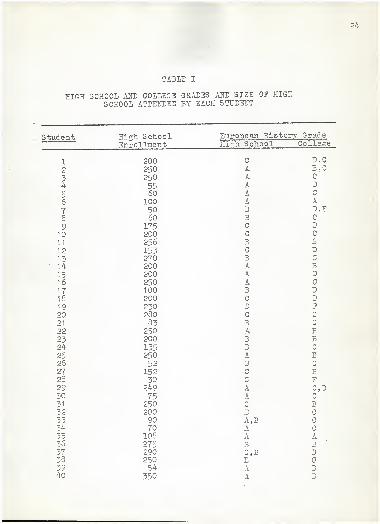
TABLB I
HIGH SCHOOL AND COLLEGE GRADES AND SIZE OF HIGHSCHOOL ATTENDED BY EACH STUDENT
Student Hip-h School European History GradeEnrollment High School College
1 200 C D,C• 2 250 A 3,0
3 250 A C
4 55 A D
5 60 A C
6 100 A A
7 50 B D,B8 60 B C
9 175 C D
10 200 C C
11 256 3 B12 153 C D13 270 B C
• 14 200 A 3
15 200 A D16 250 A C
17 100 B D18 200 C D19 230 D ?20 280 C C
21 83 B c
22 250 A B
23 200 B B24 135 B C
25 250 A B26 52 3 C
27 152 C B28 30 C P.29 249 A C,D30 75 A C
31 250 C 332 200 B C
33 90 A,B C34 70 A C35 108 A A36 275 B 337 290 C,B D38 250 B39 54 A 340 350 A 3
•.
25
•TABLE I ( continued)
Student High School European History GradeEnrollment High School College
41 1200 A B,A42 2500 C
43 2500 C D
44 2400 B C
45 600 3 346 3000 C D
47 1800 C C,D48 750 A C
49 1200 3 3
50 450 c
51 1400 3 A52 1200 A A53 2350 A A5^ 470 A B
55 650 B C
56 2700 A57 3000 0,3 C,B58 2000 3 0,359 1200 B C
60 475 C C
61 1100 C C
62 785 3 C
63 1500 c c64 1250 D C
65 1100 B C66 4000 C C,D61 600 A 368 450 3 C69 775 B 370 780 c c
71 2000 B C72 475 B 373 350 C C74 750 D75 2300 C C76 2400 A A77 650 B C
78 2000 A 379 750 A 380 2500 D D
25
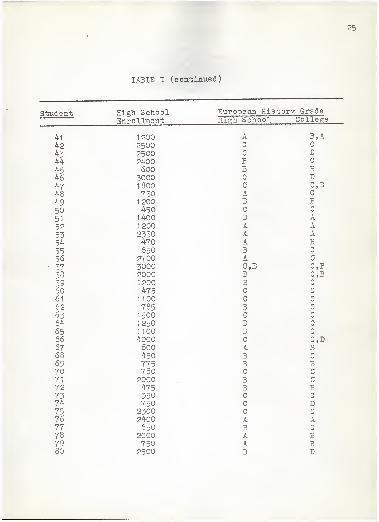
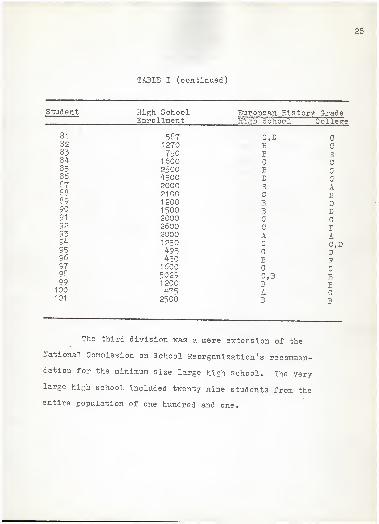
TABLE I (continued)
Student High School European History GradeEnrollment High School College
81 587 C,D C82 1270 3 C83 750 B p84 1600 C C85 2500 B c86 4500 D87 2000 3 A88 2100 389 1200 3 D90 1500 B D91 2000 C c92 2600 C P93 2000 A A94 1250 C C,D95 495 C D96 450 B P
• 97 1600 C c98 5029 C,3 399 1200 3 B100 475 A C101 2500 3 3
The third division was a mere extension of the
National Commission on School Reorganization's recommen-
dation for the minimum size large high school. The very
large high school included twenty nine students from the
entire population of one hundred and one.

27
Limits of the Study.
Various limits were imposed in the study to allow
the findings to "be more meaningful. These limits are list-
ed as follows:
1
.
Only the lower-division European history courses were
used to avoid the "bias grading which might occur in
upper-division courses.
2. Only students having taken a high school European history
course were used to avoid any disadvantages from lack"
of prior experiences occurring.
3. Only the academic school year 1965-66 was used to obtain
the college European history grade.
4. Only students without previous college European history
courses were used.
Kinds of Data Used
Record check . The high school European history grade
was collected to show the achievement each student had made
on the secondary level in the desired subject.
The college European history grade was collected to
show the academic achievement in the subject and to compare
the two standards of achievement for possible similarities.
Questionnaire. An example of the questionnaire
asking the student to state the approximate size of high
school he had graduated from, is presented in Figure 1.
28
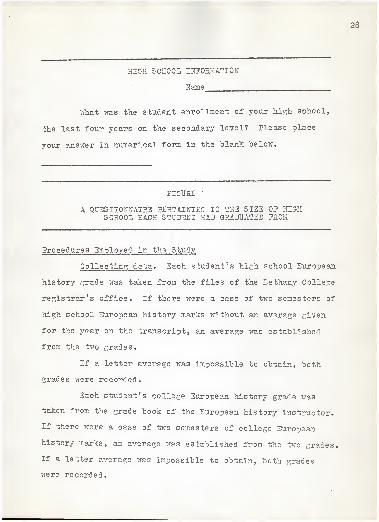
HIGH SCHOOL INFORMATION
Name
What was the student enrollment of your high school,
the last four years on the secondary level? Please place
your answer in numerical form in the "blank below.
FIGURE 1
A QUESTIONNAIRE PERTAINING TO THE SIZE OP HIGHSCHOOL EACH STUDENT HAD GRADUATED PROM
Procedures Em-ployed in the Study
Collecting data . Each student's high school European
history grade was taken from the files of the Bethany College
registrar's office. If there were a case of two semesters of
high school European history marks without an average given
for the year on the transcript, an average was established
from the two grades.
If a letter average was impossible to obtain, both
grades were recorded.
Each student's college European history grade was
taken from the grade book of the European history instructor.
If there were a case of two semesters of college European
history marks, an average was established from the two grades.
If a letter average was impossible to obtain, both grades
were recorded.
29
The questionnaire. described on page 28 was given to
each student during a regular class period in each European
history survey course after an oral explanation pertaining
to its content was made. Of the 137 questionnaires collected
from all the students in the survey courses, only 101 question-
naires were used in the study after the various limits to
the study mentioned on page 27 were met.
Presenting; and Analyzing Data
Mean academic achievement . The letter grades from
Table I on page 24 were changed to a numerical base establish-
ed from the definition of "academic achievement" on page 4.
The thirty nine students from small high schools had
a high school European history mean of 3.1 grade points while
the thirty three students from large high schools had a high
school European history mean of 2.9 grade points. The twenty
nine students from very large high schools had a high school
European history mean of 2.6 grade points. The difference
between the small high school and the very large high school
means was .5 grade points. Since there was a numerical dif-
ference in the grade point averages (means) of the three
categories in high school European history grades, hypothesis
one as stated on page three was accepted.
The small high school had a college European history
mean of 2.0 grade points while the large high school had a
college European history mean of 2.2 grade points. The
very large high school had a college European history mean
30
of 2.3 grade point. The difference between the small high
school and the very large high school means was .3 grade
points. Since there was a numerical difference in the
grade point averages (means) of the three categories in
college European history, hypothesis two was accepted.
The difference between the high school and college
European history means for the small high school was 1.1
grade points while for the large high school, it was .7
grade points. The difference between the high school and
college European history means for the very large high
school was .3 grade points. Since there was a numerical
difference between the high school and college European
history grade point averages (means) within each category,
hypothesis three was accented.
There was a .8 grade point difference between the
small high school and the very large high school pertaining
to the comparison of high school and college European history
means. Since a numerical difference of 18 grade points did
occur, hypothesis four was accepted.
Correlati ons concerned with data . The high school
European history grades in numerical form were correlated
with the college European history grades within each cate-
gory. The product moment method of correlation was employed
in the experiment. A correlation for small high schools
is presented in Table II in which high school and college
European history grades were correlated while a correlation
for large high schools is presented in Table III. High
31
school and college European history grades are correlated
for the very large high schools in Table IV.
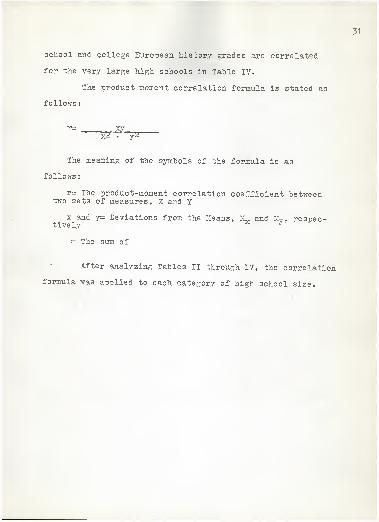
The product moment correlation formula is stated as
follows
:
r= -x2-^"x2~". fT
The meaning of the symbols of the formula is as
follows:
r= The product-moment correlation coefficient betweentwo sets of measures, X and Y
x and y= Deviations from the Means, M« and Mv , respec-tively x 7
= The sum of
After analyzing Tables II through IV, the correlation
formula was applied to each category of high school size.
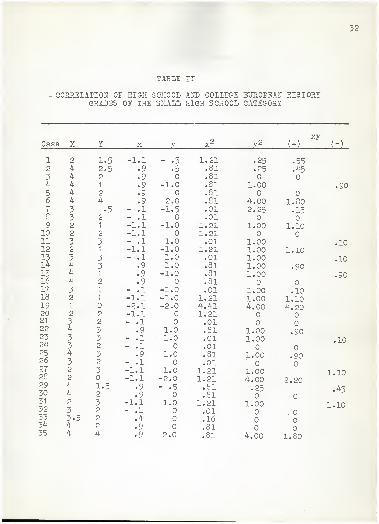
32
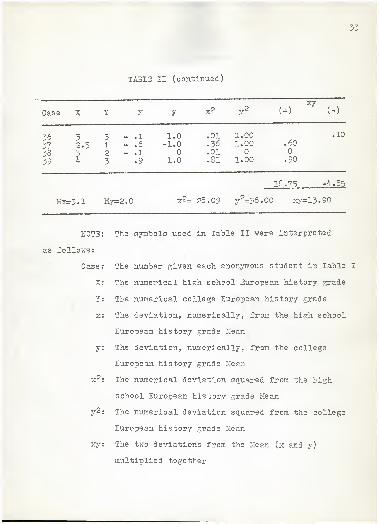
TABLE II
CORRSIATION 01 1 HIGH SCHOOL AND COLLEGE EUROPEAN HISTORYGRADES OP THE SMALL HIGH SCHOOL CATEGORY
xyCas e X Y X y X2 v2 (+) (-)
1 2 1.5 -1.1 - .5 1.21 .25 • 552 4 2.5 .9 .5 .81 .25 .453 4 2 .9 .814 4 1 .9 -1.0 .81 1.00 .905 4 2 .9 .816 4 4 .9 2.0 .81 4.00 1.807 3 .5 - .1 -1.5 .01 2.25 .158 3 2 - .1 .019 2 1 -1.1 -1.0 1.21 1.00 1.10
10 2 2 -1.1 1.2111 3 3 - .1 1.0 .01 1.00 .1012 2 1 -1.1 -1.0 1.21 1.00 1.1013 3 3 - .1 1.0 .01 1.00 .1014 4 3 .9 1.0 .81 1.00 .9015 4 1 .9 -1.0 .81 1.00 • 9016 4 2 .9 .8117 3 1 - .1 -1.0 .01 1.00 .1018 2 1 -1.1 -1.0 1.21 1.00 1.1019 1 -2.1 -2.0 4.41 4.00 4.2020 2 2 -1.1 1.2121 3 2 - .1 .0122 4 3 .9 1.0 .81 1.00 .9023 3 3 - .1 1.0 .01 1.00 .1024 3 2 - .1 .0125 4 3 .9 1.0 .81 1.00 .9026 3 2 - .1 .0127 2 3 -1.1 1.0 1.21 1.00 1.1028 2 -1.1 -2.0 1.21 4.00 2.202930
44
1-52
.9
.9- .5 .81
.81.25 .45
31 2 3 -1.1 1.0 1.21 1.00 1.1032 3 2 - .1 .01
.
33 3-5 2 .4 .1634 4 2 .9 .8135 4 4 .9 2.0 .81 4.00 1.80
33
TABLE II (continued)
Case X Y x 7 x2 72 (+)
xy(-)
36373839
32.534
3 - .11 - .6
2 - .1
3 .9
1.0-1.0
1.0
.01
.36
.01
.81
1.001.00
1.00
.60
.90
.10
Mx= 3.1 My=2.0 x2= 28.09 y2=36.
18.75
,00 xy==13.
-4.85
.90
NOTE
as follows:
: The symbc>ls used in Tabl.e II were interpre-bed
Case: The number given each anonymous student in Table I
X: The numerical high school European history grade
Y: The numerical college European history grade
x: The deviation, numerically, from the high school
European history grade Mean
y: The deviation, numerically, from the college
European history grade Mean
x2 : The numerical deviation squared from the high
school European history grade Mean
y2 : The numerical deviation squared from the college
European history grade Mean
xy: The two deviations from the Mean (x and y)
multiplied together
34
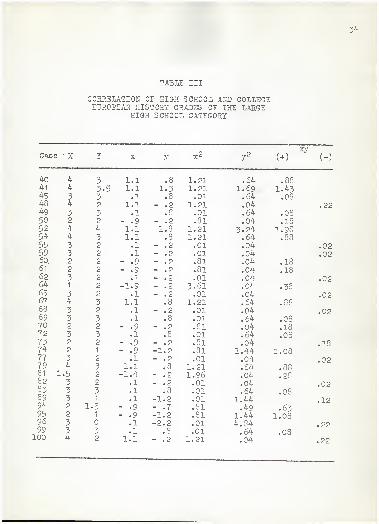
TABLE III
CORRELATION OP HIGH SCHOOL AHI i COLLEGEEUROPEAN HISTORY GRADES OP THE LARG:
HIGH SCKOOI i CATEGORY
Case X Y X y x2 J2 () (-)
40 4 3 1.1 .8 1.21 .64 .8841 4 3.5 1.1 1.3 1.21 1.69 1.4345 3 3 .1 .3 .01 .64 .0343 4 2 1.1 - .2 1.21 .04 .2249 3 3 .1 .8 .01 .64 .0850 2 2 - .9 - .2 .81 .04 .1852 4 4 1.1 1.8 1.21 3.24 1.9854 4 3 1.1 .8 1.21 .64 .8855 3 2 .1 - .2 .01 .04 .0259 3 2 .1 - .2 .01 .04 .0260 2 2 - .9 - .2 .81 .04 .1861 2 2 - .9 - .2 .81 .04 .1862 3 2 .1 - .2 .01 .04 .0264 1 2 -1.9 - .2 3.61 .04 .3865 3 2 .1 - .2 .01 .04 .0267 4 3 1.1 .8 1.21 .64 .8868 3 2 .1 - .2 .01 .04 .0269 3 3 .1 .8 .01 .64 .0870 2 2 - .9 - .2 .81 .04 .1872 3 3 .1 .8 .01 .64 .0873 2 2 - .9 - .2 .81 .04 .1874 2 1 - .9 -1.2 .81 1.44 1.0377 3 2 .1 - .2 .01 .04 .0279 4 3 1.1 .8 1.21 .64 .8881 1 .5 2 -1.4 - .2 1.96 .04 .2882 3 2 .1 - .2 .01 .04 .0283 3 3 .1 .8 .01 .64 .0889 3 1 .1 -1.2 .01 1.44 .1294 2 1.5 - .9 - .7 .81 .49 .6395 2 1 - .9 -1.2 .81 1.44 l.OS96 3 .1 -2.2 .01 4.84 .2299 3 3 .1 .8 .01 .64 .03
100 4 2 1.1 - .2 1.21 .04 .22
35
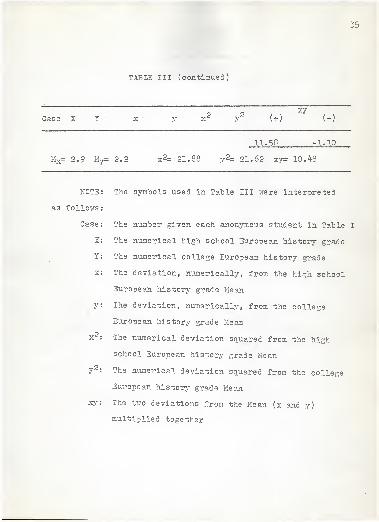
TABLE III (continued)
Case X Y x Y xd ' J ( + ) (-)
11.58 -1.10
Mx= 2.9 My= 2.2 x2= 21.88 y2= 21.62 xy= 10.48
NOTE: The symbols used in Table III were interpreted
as follows:
Case: The number given each anonymous student in Table I
X: The numerical high school European history grade
Y: The numerical college European history grade
x: The deviation, numerically, from the high school
European history grade Mean
y: The deviation, numerically, from the college
European history grade Mean
x2 : The numerical deviation squared from the high
school European history grade Mean
y2 : The numerical deviation squared from the college
European history grade Mean
xy: The two deviations from the Mean (x and y)
multiplied together
36
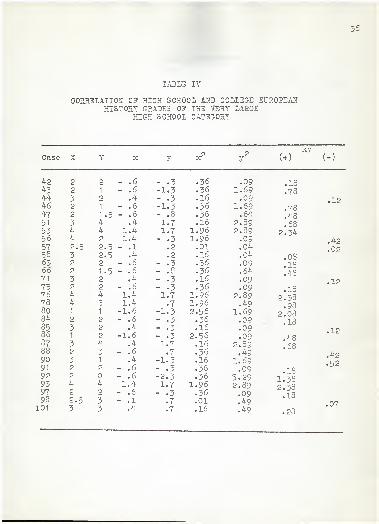
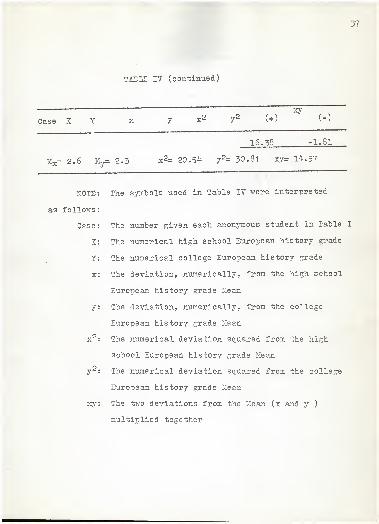
TABLE IV
CORRELATION OP HIGH SCHOOL AND COLLEGE EUROPEANjII STORY GRADES OP THE VERY LARGE
HIGH SCHOOL CATEG<DRY
Case X Y X p7 x 5'
2(+) (-)
42 2 2 - .6 - .3 .36 .09 .1843 2 1 - .6 -1.3 .36 1.69 .7844 3 2 .4 - .3 .16 .09 .1246 2 1 - .6 -1.3 .36 1.69 .7847 2 1 . 5 - .6 - .8 .36 .64 .4851 3 4 .4 1.7 .16 2.89 .6853 4 4 1.4 1.7 1.96 2.89 2.3456 4 2 1.4 - .3 1.96 .09 .4257 2.5 2. 5 - .1 .2 .01 .04 .0258 3 2. 5 .4 .2 .16 .04 .0863 2 2 - .6 - .3 .36 .09 .1866 2 1 . 5 - .6 - .8 .36 .64 .4871 3 2 .4 - .3 .16 .09 .1275 2 2 - .6 - .3 .36 .09 .1876 4 4 1.4 1.7 1.96 2.89 2.38
.9878 4 3 1.4 .7 1.96 .4980 1 1 -1.6 -1.3 2.56 1.69 2.0884 2 2 - .6 - .3 .36 .09 .IS85 3 2 .4 - .3 .16 .09 .1236 1 2 -1.6 - .3 2.56 .09 .4887 3 4 .4 1.7 .16 2.89 .6888 2 3 - .6 .7 .36 .49 .4290 3 1 .4 -1.3 .16 1.69 .5291 2 2 - .6 - .3 .36 .09 .1892 2 - .6 -2.3 .36 5.29 I.38
2.38.18
93 4 4 1.4 1.7 1.96 2.8997 2 2 - .6 - .3 .36 .0993 2.5 3 - .1 .7 .01 .49 .07
101 3 3 .4 .7 .16 .49 .28
37
TABLE 17 (continued)
xy
Case X Y x y x2 y2 ( + ) (-)
16.38 -1.31
Mx= 2.6 My= 2.3 x2= 20.54 y2= 30.81 xy= 14.57
HOTS: The symbols used in Table IV were interpreted
as follows:
Case : The number given each anonymous student in Table I
X: The numerical high school European history grade
Y: The numerical college European history grade
x: The deviation, numerically, from the high school
European history grade Mean
y: The deviation, numerically, from the college
European history grade Mean
x2 : The numerical deviation squared from the high
school European history grade Mean
y2
: The numerical deviation squared from the college
European history grade Mean
xy: The two deviations from the Mean (x and y )
multiplied together
38
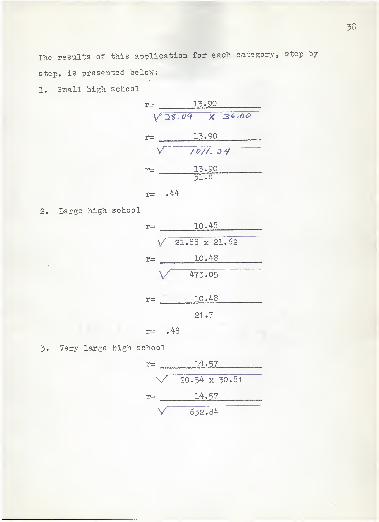
The results of this application for each category, step hy
step, is presented "below:
1. Small high school
r= 13»9Q
y/ 2S- 09 X 3^.60
r= 13.90
V /£//. 0-9
r= 13.9031.
a
r= .44
2. Large high school
r= 10.48
y* 21.88 x 21.62
r= 10.48•
V~ 473.05
r= 10.48
21.7
r= .48
3. Very large high school
r= 14.57
v~20.54 x 30.81
r= 14.57.
V 632.84
39
r= 14.57
25.1
r= .59
Since there was at least a low positive correlation
( +.20 to +.40) "between high school and college European
history grades within each category, hypothesis five was
accepted
.
There was a .15 correlational difference "between the
small high school and the very large high school. Since
a correlational difference did occur among the three cate-
gories, hypothesis six was accepted.
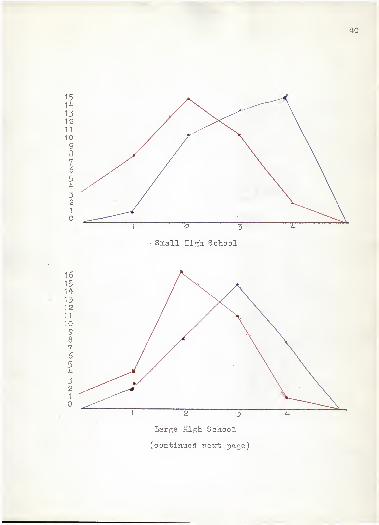
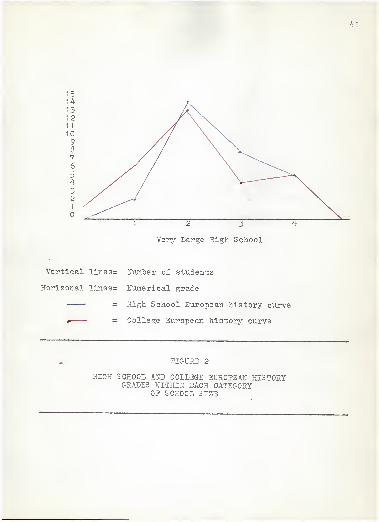
This correlational difference can he graphically seen
in Figure 2 in which the high school and college European
history grades for all three categories of school size
are plotted on separate graphs.
40
1514131211
10 s / \
98
76
4 .^ /
3 /2 /
1
r_—
1 •2 3
• Small High School
4
16
15 / ^^ A14131211
10
98
7 / / \
6
5 y' \
43 --^ */2 .^^1
^"1 2 3 4
Large High School
(continued next page)
15
12 /\\11 // W10 // \ \3 // \ \7 / / \ ^^6 / / \ ^v.5 / / \ _^-^V3 / / \o ^
41
12 3 4
Yery Large High School
Vertical lines= Number of students
Hori zonal lines= Numerical grade
— — Align ocnooi. iiiUiopean iiisuory curve
^——— — uuiiu^L jjuxupudj.1 nxo oux\y curvs
FIGURE 2
HIGH SCHOOL AND COLLEGE EUROPEAN • HISTORYGRADES WITHIN EACH CATEGORY
OP SCHOOL SIZE
-
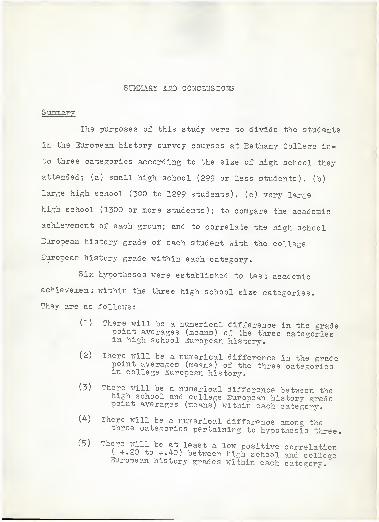
SUMMARY AND CONCLUSIONS
Summary
The purposes of this study were to divide the students
in the European history survey courses at Eethany College in-
to three categories according to the size of high school they
attended; (a) small high school (299 or less students), (b)
large high school (300 to 1299 students), (c) very large
high school (1300 or more students); to compare the academic
achievement of each group; and to correlate the high school
European history grade of each student with the college
European history grade within each category.
Six hypotheses were established to test academic
achievement within the three high school size categories.
They are as follows:
(1) There will be a numerical difference in the gradepoint averages (means) of the three categoriesin high school European history.
(2) There will be a numerical difference in the gradepoint averages (means) of the three categoriesin college European history.
(3) There will be a numerical difference between thehigh school and college European history pradepoint averages (means) within each category.
(4) There will be a numerical difference among thethree categories pertaining to hypothesis three.
(5) There will be at least a low positive correlation( +.20 to +.40) between high school and collegeEuropean history grades within each category.
43
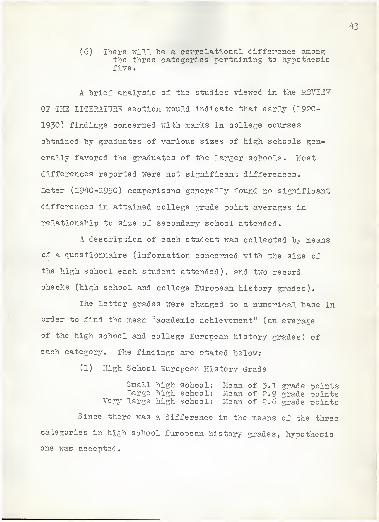
(6) There will "be a correlational difference amongthe three categories pertaining to hypothesisfive
.
A brief analysis of the studies viewed in the REVIEW
0? TEE LITERATURE section would indicate that early (1920-
1930) findings concerned with marks in college courses
obtained by graduates of various sizes of high schools gen-
erally favored the graduates of the larger schools. Most
differences reported were not significant differences.
Later (194-0-1950) comparisons generally found no significant
differences in attained college grade point averages in
relationship to size of secondary school attended.
A description of each student was collected by means
of a questionnaire (information concerned with the size of
the high school each student attended), and two record
checks (high school and college European history grades).
The letter grades were changed to a numerical base in
order to find the mean "academic achievement" (an average
of the high school and college European history grades) of
each category. The findings are stated below:
(1) High School European History Grade
Small high school: Mean of 3.1 grade pointsLarge high school: Mean of 2.9 grade Joints
Very large high school: Mean of 2.6 grade points
Since there was a difference in the means of the three
categories in high school European history grades, hypothesis
one was accepted.
44
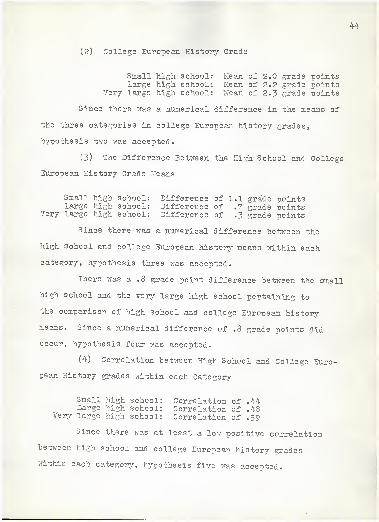
(2) College European History Grade
Small high school: Mean of 2.0 grade pointslarge high school: Mean of 2.2 grade points
Very large high school: Mean of 2.3 grade points
Since there was a numerical difference in the means of
the three categories in college European history grades,
hypothesis two was accepted.
(3) The Difference Between the High School and College
European History Grade Means
Small high school: Difference of 1.1 grade -oointslarge high school: Difference of .7 grade Joints
Very large high school: Difference of .3 grade points
Since there was a numerical difference "between the
high school and college European history means within each
category, hypothesis three was accepted.
There was a .8 grade point difference between the small
high school and the very large high school pertaining to
the comparison of high school and college European history
means. Since a numerical difference of .8 grade points did
occur, hypothesis four was accepted.
(4) Correlation between High School and College Euro-
pean History grades within each Category
Small high school: Correlation of .44Large high school: Correlation of .48
Very large high school: Correlation of .59
Since there was at least a low positive correlation
between high school and college European history grades
within each category, hypothesis five was accepted.
45
There was a .15 correlational difference between the
small high school and the very large high school. Since
a correlational difference did occur among the three cate-
gories, hypothesis six was accepted.
Conclusions
The folio-wing conclusions have been reached after
an evaluation of the findings. These conclusions pertain
only to students taking the European history survey courses
at Bethany College in 1965-1966.
(1) Students from the small high schools achieved
highest in high school Europe an history in relationship to
grades than did the students in the other two categories.
(2) Students from the small high schools achieved
lowest in college European history in relationship to grades
than did the students in the other two categories.
(3) Therefore, the small high school had the least
similarities (correlation) between high school European
history grades and college European history grades.
(4) Students from the very large high school showed
the highest similarities (correlation) between the high
school European history grade and the college European
history grade.

BIBLIOGRAPHY
Alexander, Gorman and Ruth J. Woodruff. "Determinants of col-
lege Success," Journal of Higher Education, XI (December,
1940), w 479-4¥3.
Altman, Esther R. "Effect of Rank in Class and Size of High
School on the Academic Achievement of Central Michigan
College Senior Class of 1957," Journal of Educational
Research , III (April, 1959), ?p. 3*07-309.
Bertrand, J. R. "Relation between Enrollment of High Schools
f-rom which Students Graduated and Academic Achievement of
Agricultural Students, A. and M. College of Texas," Journal
o_f Experimental Educ ation, XXV (September, 1956), t>V» 59-69.
Bledsoe, J. C. "An Analysis of the Relationship of Size of
High School to Marks Received by Graduates in First Yearof College," Journal of Educational Sociology , XXVII(March, 1954), VV' 414-418.
Eurgraff, Katherine. "The Relation of the Accrediting Standardsof Idaho High Schools to their Educational Product." Unpub-lished Master's thesis, University of Idaho, 1926.
Conant, James 3. The American High School Today . New York:McGraw-Hill Book Co., 1959.
Douglas, Harl R. University of Minnesota Studies in PredictingScholastic Achievement, Part II . Minneapolis: Universityof Minnesota Press, 1942.
Eisemann, Carl. "in Reorganized Districts Children Do LearnMore," The Nation's Schools , LIX (June, 1957), VV* 61-63
.
Peder, D. D. "Factors Which Affect Achievement and Its Predic-tion at the College Level," Journal of the Ame rican Associa-tion of Collegiate Registrars , XV (January, 19*40), vx>. 107-18,
Garrett, Harold F. "A Review and Interpretation of Investiga-tions of Factors Related to the Scholastic Success inColleges of Arts and Sciences and Teachers Colleges,"Journal of Experimental Education, XVIII (December, 1949),pp. 99-115.
Gray, A. L. "The Relation of Size of High School to CollegiateSuccess." Unpublished Doctoral Dissertation, Universityof Minnesota/ 1950.
48
Harris, Daniel. "Factors Affecting College Grades: A Reviewof the Literature 1930-37," Psychological Bulletin ,
XXXVII (March, 1940), x>?. 125-16T:
Humphreys, ?. R. "A Study of the Relationship "between theSize of Oregon Secondary Schools and the Ability of theirGraduates Entering the University of Oregon." UnpublishedMaster's thesis, University of Oregon, 1929.
Jones, George A. and H. R. Laslett. "The Prediction ofScholastic Success in College," Journal of EducationalResearch , XXIX (December, 1935), pp. 266-271.
Knezevich, S. J. Administration of Public Ed ucation . NewYork: Harper and Brothers, publishers, 196*2^
Lathrop, I. T. "Scholastic Achievement at Iowa State CollegeAssociated with High School Size and Course Pattern,"Journal of Experimental Educati on, XXIX (September, I960),
McQuitty, J. V. "Relative Scholarship of Graduates Accordingto Accreditation of High Schools," Bulletin of the AmericanAssociation of Collegiate Registrars . IX (1934). pp.ldO-3.
Odell, C. W. Predicting the Scholastic Success of CollegeStudents . Bulletin No. 52 of the Bureau of EducationalResearch, Urbana, Illinois: University of IllinoisCollege of Education, 1930.
Pettingill, True S. "Size of High School and PredictiveValue of Class Rank and Aptitude Test Rank,"Bulletin of the American Association of CollegiateRegistrars , IX (1954"), vv. 190-193.
Pittenger, Benjamin P. "The Efficiency of College Studentsas Conditioned by Age at Entrance and Size of High School,"Sixteenth Yearbook of the National Socie ty for the studyof Education, Part II . Bloomington, Illinois: publicSchool Publishing Co., 1917.
Saupe, Mildred "tfinn. "Size of High School as a Factor inCollege Success of Average and Superior Graduates,"Journal of the American Association of C o lie gi a teRe 3i strars , XVII (October, 1941 } , pp. 45-57.
Seyler, E. C. "The Value of Rank in High School GraduatingClass for Predicting Freshmen Scholarship," Journal ofthe American As sociati
o
n of Collegiate Re pis trars, XVI(January, 1941), pp. 123-133.
Sheeder, P. S. "College Achievement of Lower Group Students,"Journal of Educational Research , XXXVI (March, 1933),ppl 497-505.
Thorhberg, Lester H. "college Scholarship and Size of HighSchool," School and Society, XX (August, 1924),piD. 139-92.
49
A COMPARISON OP EUROPEAN HISTORY STUDENTS AT BETHANYCOLLEGE, KANSAS BASEL ON VARIOUS HIGH SCHOOL SIZES
by
HENRY MARTIN LOUIS
3. S., Kansas State University, 1965
AN ABSTRACT OP A MASTER'S REPORT
submitted in partial fulfillment of the
requirements for the degree
MASTER OP SCIENCE
College of Education
KANSAS STATE UNIVERSITY
Manhattan, Kansas
1967
The students in the European history survey courses
at Bethany College were divided into three categories ac-
cording to the size of high school they attended, (a) small
high school of 299 students or less, (b) large high school
of 300 to 1299 students, (c) and very large high school of
1300 or more students. It was the purpose of this study to
(1) compare the academic achievement of each group to reveal
if a particular size of high school affected the efficiency
of a student in European history at Bethany College and (2)
correlate the high school and college Buropean history grade
within each group to reveal if a particular size of high
school resulted in one obtaining the same college grade in
Buropean history at Bethany College as he did in world history
on the high school level.
The procedures followed were to (1) review the avail-
able literature; (2) administer a questionnaire to each student
pertaining to the size of high school he had attended; (3)
compile the data from the questionnaire to select the pop-
ulation of the study; and (4) collect the high school and col-
lege Buropean history grades of each student.
Six hypotheses were established to test academic sue- •
cess within the three high school size categories. They are
listed below; and the results, after testing each hypothesis,
follows.
(1) There will be a numerical difference in the grade
point averages (means) of the three categories in high school
Buropean history.
Small high school:Large high school:
Very large high school:
2
Mean of 3»1 grade pointsMean of 2.9 grade pointsMean of 2.6 grade points
Therefore, hypothesis one was accepted.
(2) There "will be a numerical difference in the grade
point averages (means) of the three categories in college Euro-
pean history.
Small high school:Large high school:'
Very large high school:
Mean of 2.0 grade pointsMean of 2.2 grade pointsMean of 2.3 grade points
Therefore, hypothesis two was accepted.
(3) There will be a numerical difference between the
high school and college European history grade point averages
(means) within each category.
Small high school:Large high school:
Very large high school:
Difference of 1.1 grade pointsDifference of .7 grade jointsDifference of .3 grade points
Therefore, hypothesis three was accepted
.
(4) There will be a numerical difference among the
three categories pertaining to hypothesis three.
Difference of .8 grade points
Therefore, hypothesis four was accepted.
(5) There will be at le ast a low positive correlation
(+ .20 to + .40) between high school and college European his-
tory grades within each category •
Small high school:Large high school:
Very large high school:
Correlation of .44Correlation of .48Correlation of .59

3(6) There will be a correlational difference among
the three categories pertaining to hypothesis five.
Correlational difference of .15
Therefore, hypothesis six was accepted.