Embed Size (px)
Citation preview
1 Comparison of effect of catalase vs MnO2 on the EA of the decomposition of H2O2.
Part 1. Design Research Question: What is the effect of an enzyme, catalase from potato, compared to catalyst, manganese (IV) oxide, on the activation energy (kJ mol-1) of the decomposition of hydrogen peroxide (H2O2) to water (H2O) and oxygen (O2) at different temperatures (K)? Introduction Catalysts are important to study because they are highly applicable in our lives. The chemical industry uses catalysts to speed reactions and maximise the number of products made. As a biology HL student, I know biological catalysts, called enzymes, are also important because they ensure that our body remains healthy. When we studied the Arrhenius equation in class, I noticed there weren’t any solid values provided in textbooks for the activation energy of reactions with and without catalysts. This led me to investigate the activation energies of catalysed reactions to get a better sense of how effective catalysts are. I chose to focus on the decomposition of H2O2 because it has both a chemical catalyst (MnO2) and an enzyme (catalase). The equation of the decomposition of H2O2 is: 2H2O2 (l) → 2H2O (l) + O2 (g). The decomposition of H2O2 is important to study due to its application to real-life. H2O2 is a harmful product of metabolism (Schwarcz, 2017). Cells in the liver use catalase to break down the substance into oxygen and water as a sort of defence mechanism (Schwarcz, 2017). H2O2 is used in the industry for bleaching and antiseptic products (“Hydrogen peroxide,” n.d.). I was interested to see which was more effective in decomposing H2O2. The aim of the experiment is to measure whether an enzyme or chemical catalyst is more effective in decomposing H2O2. Background Research
There are numerous factors that affect whether reactions can happen or not. One of these factors is the amount of energy particles have. Reactants must have a certain, minimum amount of kinetic energy to react; this energy is called activation energy (“Activation Energy,” n.d.). As this experiment will vary the temperature at which rates are calculated, the effect of temperature on reaction mechanism must be understood. As mentioned, particles need a sufficient amount of energy to react. By increasing the temperature of the system, the particles in that system will also have more kinetic energy (Lower, 2018). Therefore, it is far more likely that collisions will occur and so, products will be formed. Catalysts are substances that provide an alternative route for a reaction to take place which requires a lower activation energy without being used up (Senese, 2015). There are two types of catalysts: homogenous and heterogeneous. Homogeneous catalysts are catalysts which are in the same phase as the reactants (Nature, n.d.). Heterogeneous catalysts are the opposite—they aren’t in the same phase as the reactants. The effect of both temperature and catalysts can be seen from a Maxwell-Boltzman distribution curve. Note that in the image, Ea1 is the activation energy when a catalyst is involved in the reaction. The area under the curve gives us the number of particles that can react. In higher temperatures, more particles have enough energy to collide and react with each other. Similarly, a low activation energy allows more particles to react.
The decomposition of hydrogen peroxide is a first-order reaction with respect to H2O2 (Greenfield & Price, 1954). Therefore, the rate equation would be: rate = k[H2O2]. The Arrhenius equation shows the effect of temperature and catalysts on the rate of reaction (Clark, 2013). The Arrhenius equation tells us what the effect of temperature and the addition of a catalyst is by finding the constant k. This value can then be substituted into the rate equation to find the rate. However, this experiment will be investigating the effect of different temperatures and catalysts on the activation energy. For this purpose, the equation can be rewritten as:
. This equation is considered to be a linear equation, , in which is the x-variable,nk nAl = l − EART xy = m + c 1
T is the gradient, is the constant or y-intercept, and is the y-variable. When this is graphed, a linear− R
EA nAl nkl function is obtained. The activation energy can be found by calculating the gradient of the line plotted.

2 Alternatively, the equation can be reorganised in terms of EA. This lab will obtain the activation energy by plotting the graph and finding the gradient.
Catalysis is essentially breaking bonds between substances. Metal catalysts, such as MnO2 work by transferring their valence electrons and forming bonds with the substance being catalysed (Gould, 2014). Transition metals make especially good catalysts because they can readily donate and accept electrons. According to Jildeh et al (2018)’s experiments, the reaction mechanism of MnO2 decomposing H2O2 starts with manganese’s oxidation state changing from Mn4+ to Mn3+. Next, the manganese is reduced by H2O2 (which is oxidised) to
produce a perhydroxyl radical. After, there is a chain propagation which results in hydroxyl radicals to be produced. The hydroxyl radical reacts with a hydrogen ion to produce water. Jildeh (2018) summarised the steps using the equation diagram on the right. Manganese is a transition metal. Transition metals are good catalysts because their electrons in the d-orbital allow for substances to adsorb on the surface as weak metallic bonds are formed (“Catalytic activity of transition metals”, n.d.). As the substance is adsorbed by the surface, the concentration of the particles increases. As the concentration increases, the rate of reaction also increases as there is a higher chance of particles colliding with each other. Biological catalysts, on the other hand, are called enzymes (Gould, 2014). A specific substrate must bind to the active site of the enzyme in the proper orientation in order for products to be formed (Gould, 2014). According to the induced fit model, when the substrate binds to the active site, it changes the conformation of the site to better fit the enzyme, and is then converted into products (Allot & Mindorff, 2014). The products detach from the active site so that other substrates can bind to it. Hypothesis If two different catalysts (catalase and MnO2) are used to decompose H2O2 and their activation energies (Ea) are measured, then MnO2, the chemical catalyst, will have a lower Ea because it readily gains and loses electrons and adsorption to the surface causes the rate of reaction to be faster since the reactants become more concentrated, increasing the chance of particles colliding.
Table 1. Independent and Dependent Variables
Variable Manipulation
Independent (x): temperature
According to Morgulis, Beber and Rabkin (1926), catalase denatures at 313K (40oC). Therefore, the temperatures measured will be 298K, 303K, 308K, 313K and 318K. 318K was chosen to show how catalase no longer works as an enzyme past 313K.
Dependent (y): rate of reaction (dm3s-1)
The rate will be calculated based on how much time it takes for 10mL of water to be displaced by downward displacement of water.
Table 2. Controlled Variables
Controlled Variables
Manipulation
Concentration of H2O2 A 6% concentrated solution of H2O2 will be used for the experiment for all trials. This concentration was chosen as it is safer than higher concentrations.
3
Mass of catalyst/enzyme
The mass of catalase mixture used will be equal to the amount of MnO2 used (0.5g) for each trial to establish control.
Equipment The same trough, graduated cylinder, beaker, water bath, stopwatch and weighing scale will be used for all trials so that any uncertainties will be consistent for all trials.
Amount of H2O displaced
The stopwatch will be stopped when 10mL of water has been displaced since pre-trials showed that catalase took a very look time to displace water and so a lower volume was chosen.
Amount of H2O2 50mL of H2O2 will be used for all trials.
Lab environment The experiment will be carried out in the same laboratory at 298K.
Potato All the potatoes were bought from the same vendor on the same day.
Table 3. Materials
Item Quantity Units & Uncertainties
Hydrogen peroxide 2 Litres 6% concentration will be used.
Potatoes 3 0.5g of potato mixture will be used per trial.
Manganese (IV) oxide 15g (5g extra for backup) 0.5g of MnO2 will be used per trial.
Blender 1
Trough 1
Water Access to tap water is necessary.
Clamp 1
Graduated cylinder 3 One 100mL and two 50mL +/-0.5mL
Weighing scale 1 +/- 0.001g
Water bath 1
Delivery tube and bung 1
Stopwatch 1 +/- 0.01s
Thermometer 1
Method 1. Prepare a trough with water at room temperature. 2. Fill a graduated cylinder with water and place it upside down in the trough, attaching it to a clamp. 3. Prepare a water bath at 298K. 4. Measure 50mL of 6% H2O2 and pour it into a beaker. Place the beaker in the water bath for five minutes.
Use a thermometer to ensure the temperature is at 298K. If it isn’t, leave the H2O2 in the water bath for a longer time.
4 5. Put one end of the delivery tube into the inverted graduated cylinder. The other end should be connected
to a rubber bung which will be placed inside the beaker with the reactants. 6. Experiment with catalase
a. Skin and chop one 100g of potato and put it into a blender with 50mL of distilled water. Blend until a smooth mixture is formed.
b. Measure 0.5g of the catalase mixture. After the H2O2 is at the appropriate temperature, add catalase to the beaker with H2O2 and place the rubber bung. Start the stopwatch.
c. Stop the stopwatch after 10mL of water has been displaced. Record the time. d. Repeat steps 2-6 four more times to obtain five trials. e. Then repeat steps 2-6.d by changing the temperature of the water bath to 303K, 308K, 313K and
318K. 7. Experiment with MnO2
a. Measure 0.5g of MnO2 on the weighing scale. b. Add MnO2 to the beaker with H2O2. Start the stopwatch. c. Stop the stopwatch after 10mL of water has been displaced. Record the time. d. Repeat steps 2-7 (excluding step 6) four more times to obtain five trials. e. Then repeat steps 2-7.d (excluding step 6) by changing the temperature of the water bath to
303K, 308K, 313K and 318K. 8. Follow data processing steps to process the data and find rate of reaction and activation energies.
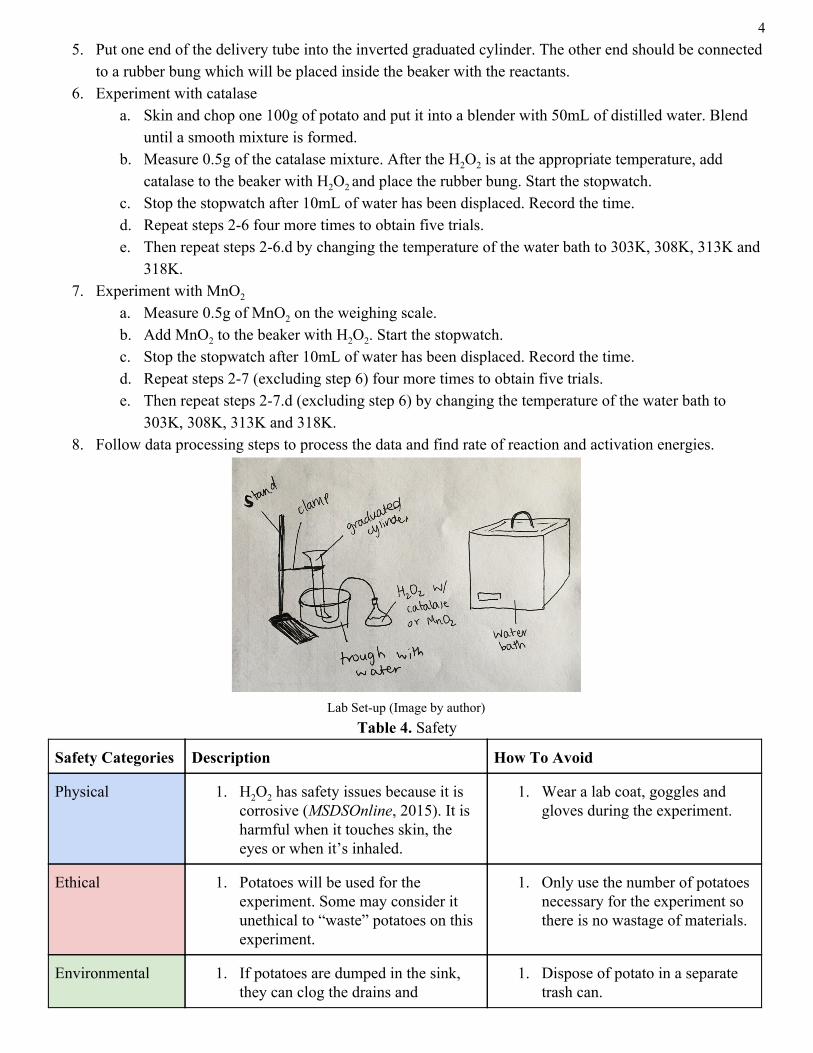
Lab Set-up (Image by author)
Table 4. Safety
Safety Categories Description How To Avoid
Physical 1. H2O2 has safety issues because it is corrosive (MSDSOnline, 2015). It is harmful when it touches skin, the eyes or when it’s inhaled.
1. Wear a lab coat, goggles and gloves during the experiment.
Ethical 1. Potatoes will be used for the experiment. Some may consider it unethical to “waste” potatoes on this experiment.
1. Only use the number of potatoes necessary for the experiment so there is no wastage of materials.
Environmental 1. If potatoes are dumped in the sink, they can clog the drains and
1. Dispose of potato in a separate trash can.
5
contaminate sewage.
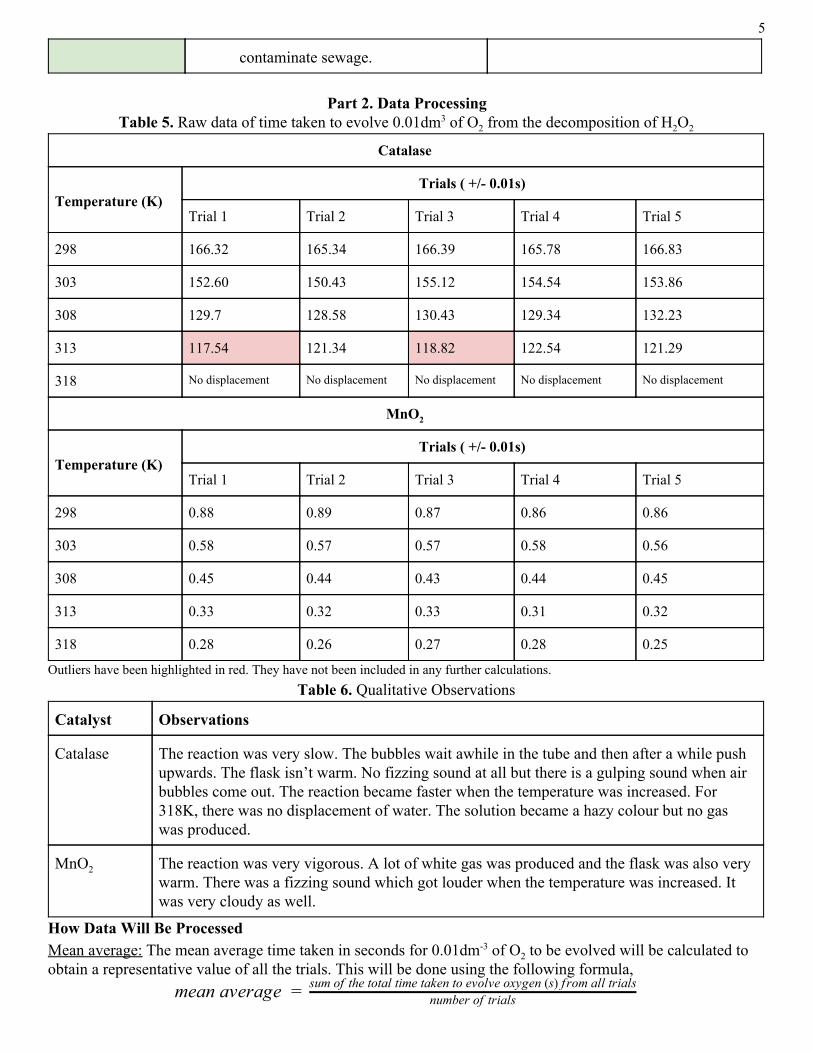
Part 2. Data Processing
Table 5. Raw data of time taken to evolve 0.01dm3 of O2 from the decomposition of H2O2
Catalase
Temperature (K)
Trials ( +/- 0.01s)
Trial 1 Trial 2 Trial 3 Trial 4 Trial 5
298 166.32 165.34 166.39 165.78 166.83
303 152.60 150.43 155.12 154.54 153.86
308 129.7 128.58 130.43 129.34 132.23
313 117.54 121.34 118.82 122.54 121.29
318 No displacement No displacement No displacement No displacement No displacement
MnO2
Temperature (K)
Trials ( +/- 0.01s)
Trial 1 Trial 2 Trial 3 Trial 4 Trial 5
298 0.88 0.89 0.87 0.86 0.86
303 0.58 0.57 0.57 0.58 0.56
308 0.45 0.44 0.43 0.44 0.45
313 0.33 0.32 0.33 0.31 0.32
318 0.28 0.26 0.27 0.28 0.25
Outliers have been highlighted in red. They have not been included in any further calculations. Table 6. Qualitative Observations
Catalyst Observations
Catalase The reaction was very slow. The bubbles wait awhile in the tube and then after a while push upwards. The flask isn’t warm. No fizzing sound at all but there is a gulping sound when air bubbles come out. The reaction became faster when the temperature was increased. For 318K, there was no displacement of water. The solution became a hazy colour but no gas was produced.
MnO2 The reaction was very vigorous. A lot of white gas was produced and the flask was also very warm. There was a fizzing sound which got louder when the temperature was increased. It was very cloudy as well.
How Data Will Be Processed Mean average: The mean average time taken in seconds for 0.01dm-3 of O2 to be evolved will be calculated to obtain a representative value of all the trials. This will be done using the following formula,
ean average m = number of trialssum of the total time taken to evolve oxygen (s) f rom all trials
6 Example calculation for catalase at 298K:
ean average 66.13 m = 5166.32+165.34+166.39+165.78+166.83 = 1
Percentage Uncertainty: The percentage uncertainty will be found to understand how valid the results of this experiment are with the equipment used. This was done by dividing the absolute certainty by the mean average value measured, all multiplied by 100. Example calculation with catalase at 298K: 00 .006%0.01s
166.13 · 1 = 0 Example calculation with % uncertainty of volume: 00 %10
0.5 · 1 = 5 Table 7. Mean average time and % uncertainty of catalase and MnO2
Catalyst/enzyme Temperature (K) Mean average time (s) Percentage Uncertainty (%)
Catalase 298 166.13 +/- .006 0
303 153.31 +/- .007 0
308 130.01 +/- 0.008
313 121.72 +/- 0.008
318 0 0
MnO2 298 0.872 +/- 1.15
303 0.572 +/- 1.75
308 0.442 +/- 2.26
313 0.320 +/- 3.13
318 0.268 +/- 3.73
It can be see that the average time for the reaction increased as the temperature was increased. For catalase in 318K, however, there was no reaction. Rate of reaction: The rate of reaction must be calculated to find the value of the rate constant k. The following formula will be used,
ate of reaction r = time (seconds)amount of oxygen evolved
Example calculation for catalase at 298K: ate of reaction .02 0 dm sr = 166.13
0.01 dm3= 6 · 1 −5 3 −1
Table 8. Calculating rates of reactions of catalase and MnO2 Temperature (K) Rate of reaction (dm3s-1) Percentage Uncertainty (%)
Catalase 298 6.02 x 10⁻⁵ +/- 5.006
303 6.52 x 10⁻⁵ +/- 5.007
305 7.70 x 10⁻⁵ +/- 5.008
313 8.22 x 10⁻⁵ +/- 5.008
318 0 0
MnO2 298 0.011 +/- 6.15

7
303 0.017 +/- 6.75%
305 0.023 +/- 7.26
313 0.031 +/- 8.13
318 0.037 +/- 8.73
The rate of reaction became faster as the temperature was increased. Standard Deviation: The standard deviation will be calculated to show the distribution of the data relative to the central tendency. The formula below will be used.
σ = √ nΣ(x−x) 2
= standard deviation, = sum, = value in data set, = mean value, n = # of data sets σ Σ x x Table 9. Example standard deviation calculations for catalase at 298K
O2 produced (x) Mean Average (x̅ ) x-x̅ = d d2 Mean of d2 = v SD = √v
166.32 166.13 0.19 0.0361 0.268 0.518
165.34 -0.79 0.6241
166.39 0.26 0.0676
165.78 -0.35 0.1225
166.83 0.70 0.4900
Table 10. Calculating standard deviations of catalase and MnO2 Catalyst Temperature (K) Standard Deviation
Catalase 298 0.518
303 1.67
308 1.24
315 1.84
318 0
MnO2 298 0.012
303 0.007
308 0.007
315 0.007
318 0.012
Note: The outliers for catalase were used to calculate standard deviation to see how widespread the data was. The standard deviations are quite small which is a strength of this lab. It shows that the data was reliable. Arrhenius equation: As stated in the exploration, the equation will be used to calculate the Ea. Tonk nal = l − Ea
RT use this equation, the value of k and then lnk must be found. To do this, the rate equation of H2O2 was used, rate = k[H2O2]. Rearranging this,
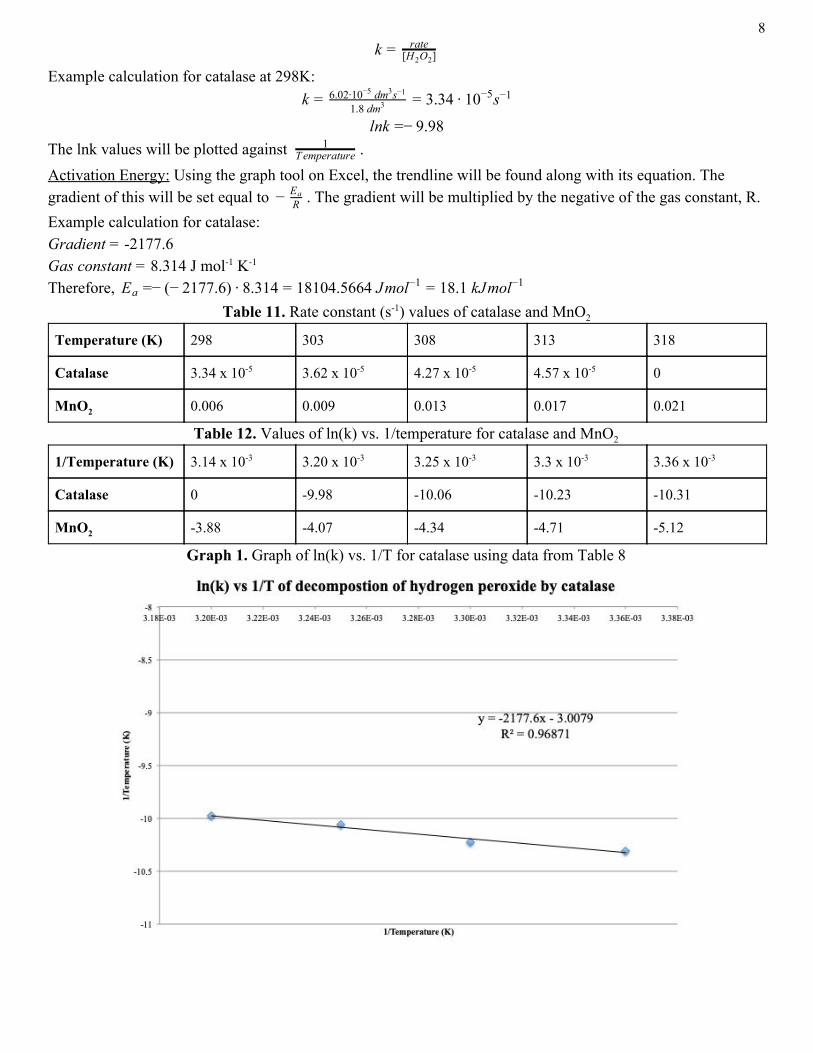
8 k = rate
[H O ]2 2
Example calculation for catalase at 298K: .34 0 sk =
1.8 dm36.02·10 dm s−5 3 −1 = 3 · 1 −5 −1
nk − .98l = 9 The lnk values will be plotted against .1
T emperature Activation Energy: Using the graph tool on Excel, the trendline will be found along with its equation. The gradient of this will be set equal to . The gradient will be multiplied by the negative of the gas constant, R.− R
Ea Example calculation for catalase: Gradient = -2177.6 Gas constant = 8.314 J mol-1 K-1 Therefore, − − 177.6) .314 8104.5664 Jmol 8.1 kJmolEa = ( 2 · 8 = 1 −1 = 1 −1
Table 11. Rate constant (s-1) values of catalase and MnO2 Temperature (K) 298 303 308 313 318
Catalase 3.34 x 10⁻⁵ 3.62 x 10⁻⁵ 4.27 x 10⁻⁵ 4.57 x 10⁻⁵ 0
MnO2 0.006 0.009 0.013 0.017 0.021
Table 12. Values of ln(k) vs. 1/temperature for catalase and MnO2 1/Temperature (K) 3.14 x 10⁻³ 3.20 x 10⁻³ 3.25 x 10⁻³ 3.3 x 10⁻³ 3.36 x 10⁻³
Catalase 0 -9.98 -10.06 -10.23 -10.31
MnO2 -3.88 -4.07 -4.34 -4.71 -5.12
Graph 1. Graph of ln(k) vs. 1/T for catalase using data from Table 8
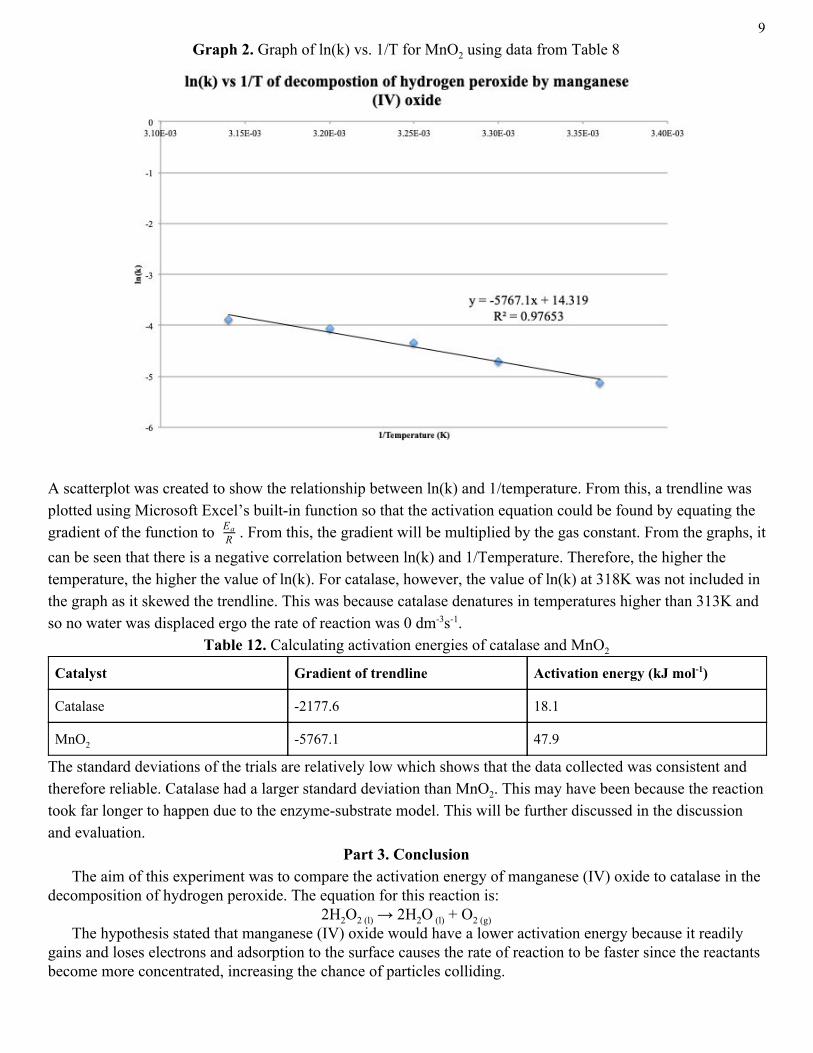
9 Graph 2. Graph of ln(k) vs. 1/T for MnO2 using data from Table 8
A scatterplot was created to show the relationship between ln(k) and 1/temperature. From this, a trendline was plotted using Microsoft Excel’s built-in function so that the activation equation could be found by equating the gradient of the function to . From this, the gradient will be multiplied by the gas constant. From the graphs, itR
Ea can be seen that there is a negative correlation between ln(k) and 1/Temperature. Therefore, the higher the temperature, the higher the value of ln(k). For catalase, however, the value of ln(k) at 318K was not included in the graph as it skewed the trendline. This was because catalase denatures in temperatures higher than 313K and so no water was displaced ergo the rate of reaction was 0 dm-3s-1.
Table 12. Calculating activation energies of catalase and MnO2
Catalyst Gradient of trendline Activation energy (kJ mol-1)
Catalase -2177.6 18.1
MnO2 -5767.1 47.9
The standard deviations of the trials are relatively low which shows that the data collected was consistent and therefore reliable. Catalase had a larger standard deviation than MnO2. This may have been because the reaction took far longer to happen due to the enzyme-substrate model. This will be further discussed in the discussion and evaluation.
Part 3. Conclusion The aim of this experiment was to compare the activation energy of manganese (IV) oxide to catalase in the
decomposition of hydrogen peroxide. The equation for this reaction is: 2H2O2 (l) → 2H2O (l) + O2 (g)
The hypothesis stated that manganese (IV) oxide would have a lower activation energy because it readily gains and loses electrons and adsorption to the surface causes the rate of reaction to be faster since the reactants become more concentrated, increasing the chance of particles colliding.
10 The activation energy calculated for catalase was 18.1 kJ mol-1. The activation energy calculated for
manganese (IV) oxide was 47.9 kJ mol-1. The difference between the two energies is quite large. As stated in the background research, the manganese (IV) oxide adsorbed hydrogen peroxide, forming bonds between the liquid. This increased the concentration of hydrogen peroxide (on the surface of MnO2) and so the rate of reaction was incredibly fast (“Catalytic activity of transition metals”, n.d.). Furthermore, manganese (IV) oxide went through a series of reactions, transferring electrons speedily, which contrasts with catalase’s induced-fit model which requires the substrate (H2O2) to fit in catalase’s active site in the proper orientation and energy.
The qualitative data (Table 6) collected also supports that MnO2 behaves more efficiently as a catalyst than catalase. When MnO2 was added to the hydrogen peroxide, the reaction was vigorous and 10 cm-3 of water was immediately displaced. A lot of gas and bubbles were produced. Catalase, on the other hand, took a far longer time to displace 10 cm-3 of water. There was not a lot of gas produced and the bubbles weren’t so frequent either.
A trend in the data is that as the temperature was increased, the rate of reaction became faster too (see Table 8). This is supported by scientific evidence. As was explained in the background research (p. 1), increasing the temperature results in the particles of the reaction gaining more kinetic energy. According to collision theory, particles must react in the proper orientation and with sufficient energy for the reaction to proceed. Since a higher temperature means more particles will have sufficient energy, there will be a higher chance of particles reacting. This trend was true for both catalase and MnO2. However, for 318K, catalase could no longer displace water. This happened because catalase denatures after 313K (Beber and Rabkin, 1926) meaning the enzyme could no longer function. On the other hand, MnO2 catalysed the decomposition of H2O2 very vigorously. This is interesting because it shows chemical catalysts aren’t restricted per se by temperature whereas enzymes are.
When ln(k) was graphed against 1/Temperature (K) (Graph 1 and Graph 2), both catalase and MnO2 had negative gradients. This shows that
It can be concluded that chemical catalysts, in the decomposition of hydrogen peroxide, are far faster than biological catalysts (i.e. enzymes) because they have a lower activation energy.
Part 4. Evaluation
Although the data shows that there is a clear difference in the activation energies of catalase and manganese (IV) oxide, there are several improvements that can be made to the lab. First, more trials are needed. In total, there were forty trials done. Although this may be sufficient for an amateur scientist in high school, more trials are necessary to increase the reliability of the experiment. A strength of the lab, however, was the low standard deviation. From Table 10, the highest standard deviation was 1.84 for the decomposition of hydrogen peroxide by catalase at 315K. This indicates a low variation, hence, the data was high in precision.
Second, the highest percentage error was calculated to be 8.13% for the rate of reaction of MnO2 at 315K. The lowest percentage error was 5.006% for catalase. These percentage errors are quite high which show that the apparatus used was not the most precise or accurate for the experiment. To improve this, the set-up could be changed in that more precise equipment can be used. An example is using a burette instead of a graduated cylinder for measuring amounts of H2O2. Below are further errors that, if remedied, would improve the experiment.
Table 13. Sources of Errors Source of error Type of error Significance Improvement
MnO2 in its solid form was used whereas catalase in liquid form was used.
Systematic High: Surface area is one of the factors that affect the rate of reaction. Substances in powder form will have a larger surface area for reactions to take place which may have been why the MnO2 reaction was so much faster than catalase’s reaction. This would affect the accuracy of the results.
For a school experiment, catalase in powder form was too expensive to buy which was why catalase from potato had to be used. However, if this lab were to be replicated by professionals, obtaining catalase in powder form
11
would be feasible. Therefore, a better comparison could have been made between catalase and MnO2.
There was a short time gap (~1 second) after the catalase/MnO2 had been added to the flask and the stopwatch started.
Systematic Low: The reaction may have begun before the timer started. This would affect the values obtained for the time of the reaction. However, since all trials were done with this time lag, the error is of low significance.
Rather than attempting to start the stopwatch immediately after dropping the catalyst into the hydrogen peroxide, the stopwatch could be started before. Then after, say, five seconds, the catalyst can be placed into the flask to obtain more accurate results.
The measurements for the gas displacement may not have been precise.
Systematic Moderate: The precision would have been dependent on the equipment used. The uncertainties of the equipment were rather large which would have affected the results.
Using more precise equipment such as a burette would result in better data.
Gas may have escaped from the equipment.
Random High: If gas was able to escape from the equipment, the results would not be accurate.
Using a gas probe may result in better data because the probe will be attached to the flask so there is less chance of gas escaping.
Mass of catalyst/enzyme wasn’t controlled because a potato mixture was used for catalase and the amount of catalase is unknown.
Systematic High: This would cause the experiment to not sufficiently compare catalase to MnO2 because the potato mixture may not have had a high concentration of catalase. It also causes for the amount of catalase and MnO2 to not be a controlled variable.
The use of catalase in its extracted, powder form would make the experiment more reliable. A limitation of this is that catalase is quite expensive.
After washing the equipment after every trial, there was still some water left in the equipment such as the beakers and graduated cylinders.
Systematic Low: This may have affected the rate of reaction of decomposition of H2O2 by the catalase and MnO2 causing the results obtained to not be accurate.
The equipment could be left to dry for a few minutes before starting the next trial. Alternatively, paper towels or a cloth can be used to dry the inside of beakers and flasks before starting the next trial.
Next testable question: What surface area of MnO2 results in the lowest activation energy in the decomposition of hydrogen peroxide? One of the limitations of this lab was MnO2 was in powder form whereas catalase was a liquid. It would be interesting to determine which surface area would have the lowest activation energy. The decomposition of H2O2 has many uses in the industry. For instance, it is used in bleaching, developing mouthwash products and in
12 developing paper and textile products (Pędziwiatr et al, 2018). Therefore, it would be useful to learn one aspect of the optimum condition for the reaction.
Part 5. Additional Thoughts Since no water was displaced after 313K by catalase, it made me curious about how vital temperature is for
the function of enzyme. Namely, I considered a situation: if a person is sick with high fever with a temperature of above 313K, how would that affect enzyme activity and the overall health of the patient? Catalase is important as it breaks down hydrogen peroxide in the liver (Schwarcz, 2017) and it has an optimum temperature of 310K (Beber and Rabkin, 1926). Ergo, the high fever may cause the patient’s enzymes to denature. This could make it difficult for the patient to recover.
References Activation Energy. (n.d.). Retrieved October 21, 2018, from
http://chemed.chem.purdue.edu/genchem/topicreview/bp/ch22/activate.html Allott, A., & Mindorff, D. (2014). Biology course companion. Oxford, United Kingdom: Oxford University Press. Catalytic Activity of Transition Metals. (n.d.). Retrieved December 1, 2018, from
http://www.4college.co.uk/a/ss/catalyst.php Clark, J. (2013). reqnab1 [Image]. Retrieved from https://www.chemguide.co.uk/physical/basicrates/reqnab1.gif Clark, J. (2013, October). Rate constants and the Arrhenius equation. Retrieved October 25, 2018, from
https://www.chemguide.co.uk/physical/basicrates/arrhenius.html Gould, S. E. (2014, January 12). Speeding up reactions: biological vs. chemical catalysts. Retrieved November 3, 2018,
from https://blogs.scientificamerican.com/lab-rat/speeding-up-reactions-biological-vs-chemical-catalysts/ Greenfield, R. E., & Price, V. E. (1954). Liver catalase: a manometric determination of catalase activity. Journal of
Biological Chemistry, 355-361. Retrieved from http://www.jbc.org/content/209/1/355.full.pdf Homogeneous catalysis. (n.d.). Retrieved October 21, 2018, from Nature website:
https://www.nature.com/subjects/homogeneous-catalysis Hydrogen peroxide. (n.d.). Retrieved December 9, 2018, from National Center for Biotechnology Information website:
https://pubchem.ncbi.nlm.nih.gov/compound/hydrogen_peroxide#section=Information-Sources Hydrogen peroxide health & safety tips. (2015, June 17). Retrieved November 6, 2018, from
https://www.msdsonline.com/2015/06/17/hydrogen-peroxide-health-safety-tips/ Jildeh, Z. B. (2018). Reaction mechanism [Image; JPEG]. Jildeh, Z. B., Oberländer, J., Kirchner, P., Wagner, P. H., & Schöning, M. J. (2018). Thermocatalytic behavior of
manganese (IV) oxide as nanoporous material on the dissociation of a gas mixture containing hydrogen peroxide. Nanomaterials. Retrieved from https://www.ncbi.nlm.nih.gov/pmc/articles/PMC5923592/
Lower, S. (2018, March 20). Activation energy, Arrhenius equation. Retrieved October 24, 2018, from http://www.chem1.com/acad/webtext/dynamics/dynamics-3.html
Lower, S. (2018, March 20). bolzmann_Ea [Image]. Retrieved from http://www.chem1.com/acad/webtext/dynamics/mech-images/bolzmann_Ea.png
Morgulis, S., Beber, M., & Rabkin, I. (1926). Studies on the effect of temperature on the catalase reaction. Journal of Biological Chemistry, 521-533.
Pędziwiatr, P., Mikołajczyk, F., Zawadzki, D., Mikołajczyk, K., & Bedka, A. (2018). Decomposition of hydrogen peroxide—kinetics and review of chosen catalysts. Lodz University of Technology, 26(45), 45-52. Retrieved from http://www.proakademia.eu/gfx/baza_wiedzy/461/nr_26_45-52_2_3.pdf
Schwarcz, J. (2017, January 18). Hydrogen peroxide: the body's best defence system. Retrieved October 24, 2018, from https://www.mcgill.ca/oss/article/general-science-you-asked/hydrogen-peroxide-bodys-best-defence-system
Senese, F. (2015, August 17). What are some examples of reactions that involve catalysts? Retrieved October 21, 2018, from http://antoine.frostburg.edu/chem/senese/101/reactions/faq/examples-of-catalysts.shtml
Su, C., & Li, M. (n.d.). Catalase kinetics.