Embed Size (px)
Citation preview
RESEARCH ARTICLE
Comparison of different modifications on QuEChERS samplepreparation method for PAHs determination in black, green,red and white tea
Anna Sadowska-Rociek & Magdalena Surma &
Ewa Cieślik
Received: 28 May 2013 /Accepted: 16 July 2013 /Published online: 31 July 2013# The Author(s) 2013. This article is published with open access at Springerlink.com
Abstract The aim of this work was the evaluation ofQuEChERS extraction method for polycyclic aromatic hydro-carbon (PAH) determination in various types of tea. In theexperiment, different kinds of extraction solvents, sorbentsand a final method of sample preparation were compared.The final extracts were analysed by gas chromatography-selected ion monitoring-mass spectrometry. The results sug-gest that acetonitrile extraction, clean up with SAX and finalliquid–liquid extraction was the best combination giving themost purified extracts and acceptable compound recoveriesfor different types of teas. In the study of real samples,compounds belonging to light PAHs were mostly detected,and heavy polycyclic aromatic hydrocarbons, includingbenzo[a]pyrene, were not identified in any of samples.
Keywords GC-MS . Extraction . PAHs . Tea . QuEChERS .
SPE sorbents
Introduction
Tea, because of its aroma, flavour and potential health-promoting properties, is one of the most known and consumedbeverage in the world. Each type of tea has its own character-istics including a different taste, health benefits and evendifferent levels of caffeine. White tea is the purest and leastprocessed of all teas; green and red teas contain healthyantioxidants; black tea is fully fermented, and it has a high
level of caffeine. Despite the taste and healthy properties oftea, some of chemical contaminants present in it may pose ahealth threat to tea drinkers. Tea leaves, due to their largesurface area, are particularly vulnerable to the deposition ofharmful chemicals from polluted air. Among them, polycyclicaromatic hydrocarbons (PAHs) are one of the most dangerous.The presence of PAHs in tea leaves is also caused by fresh leaftreatment process—drying or roasting during which wood, oilor coal are used for burning (Lin et al. 2005). Among PAHs,15 of these compounds were recognised as clearly mutagenicand carcinogenic by the Scientific Committee on Food, andbenzo[a]pyrene and dibenzo[a,h]anthracene were reported tobe the most carcinogenic (Scientific Committee on Food2002). However, the European Food Safety Authority con-cluded that benzo[a]pyrene is not a suitable marker for theoccurrence of PAHs in food and that a system of four or eightspecific substances would be the most suitable markers ofPAH in food (Commission Regulation (EU) No 836/2011).As a consequence, Commission Regulation No 835/2011amended Regulation (EC) No 1881/2006 in order to set max-imum levels for the sum of four polycyclic aromatic hydro-carbons (benzo[a]pyrene, benzo[a]anthracene, benzo[b]fluo-ranthene and chrysene).
Analysis of PAHs in tea encounters certain difficultiesbecause tea contains a lot of co-extractives such as caffeine,polyphenols, sugars, organic acids and pigments, especiallyhigh levels of chlorophyll. The content of these substancesstrongly depends on type of tea, and black tea is considered tobe the most difficult matrix due to high content of interferingsubstances. Moreover, non-volatile matrix components mightbe deposited in the gas chromatography (GC) inlet and in theGC column giving rise to the formation of new active sites,which results in GC signal diminishment (Cajka et al. 2012).For this reason, it is necessary to utilise an effective method ofextraction and clean-up procedures of tea samples. As yet,
Responsible editor: Ester Heath
A. Sadowska-Rociek (*) :M. Surma : E. CieślikMalopolska Centre of Food Monitoring, Faculty of FoodTechnology, University of Agriculture in Krakow, Balicka 122,30-149 Krakow, Polande-mail: [email protected]
Environ Sci Pollut Res (2014) 21:1326–1338DOI 10.1007/s11356-013-2022-1
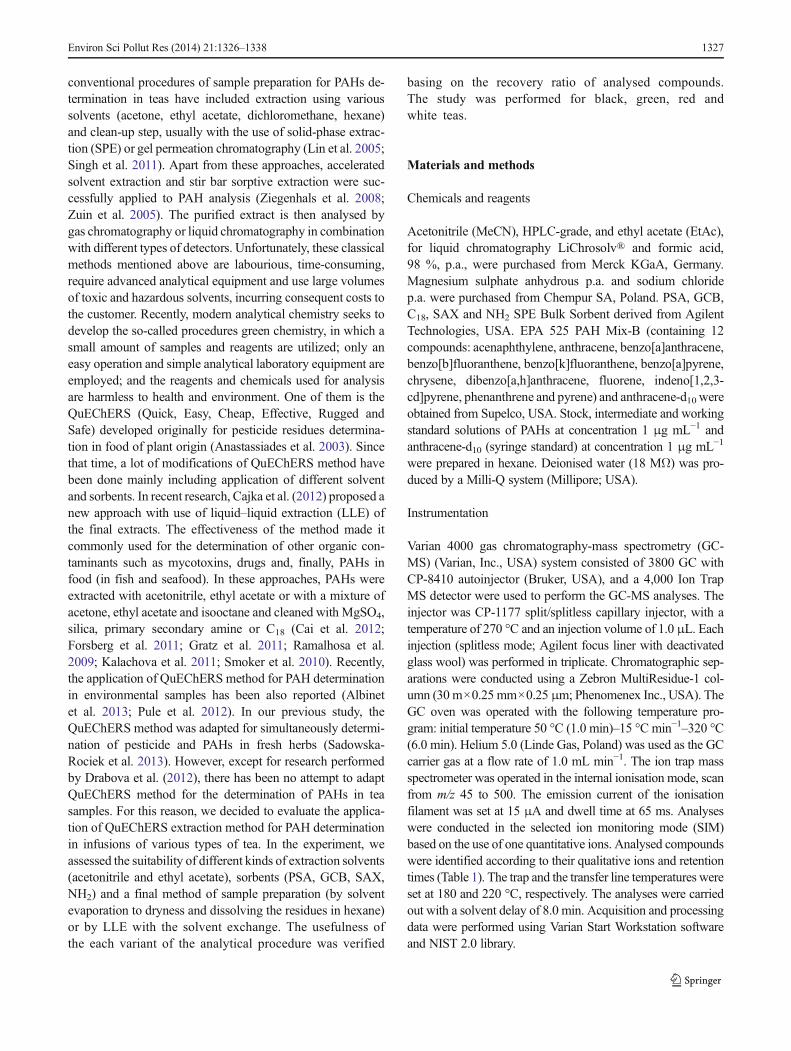
conventional procedures of sample preparation for PAHs de-termination in teas have included extraction using varioussolvents (acetone, ethyl acetate, dichloromethane, hexane)and clean-up step, usually with the use of solid-phase extrac-tion (SPE) or gel permeation chromatography (Lin et al. 2005;Singh et al. 2011). Apart from these approaches, acceleratedsolvent extraction and stir bar sorptive extraction were suc-cessfully applied to PAH analysis (Ziegenhals et al. 2008;Zuin et al. 2005). The purified extract is then analysed bygas chromatography or liquid chromatography in combinationwith different types of detectors. Unfortunately, these classicalmethods mentioned above are labourious, time-consuming,require advanced analytical equipment and use large volumesof toxic and hazardous solvents, incurring consequent costs tothe customer. Recently, modern analytical chemistry seeks todevelop the so-called procedures green chemistry, in which asmall amount of samples and reagents are utilized; only aneasy operation and simple analytical laboratory equipment areemployed; and the reagents and chemicals used for analysisare harmless to health and environment. One of them is theQuEChERS (Quick, Easy, Cheap, Effective, Rugged andSafe) developed originally for pesticide residues determina-tion in food of plant origin (Anastassiades et al. 2003). Sincethat time, a lot of modifications of QuEChERS method havebeen done mainly including application of different solventand sorbents. In recent research, Cajka et al. (2012) proposed anew approach with use of liquid–liquid extraction (LLE) ofthe final extracts. The effectiveness of the method made itcommonly used for the determination of other organic con-taminants such as mycotoxins, drugs and, finally, PAHs infood (in fish and seafood). In these approaches, PAHs wereextracted with acetonitrile, ethyl acetate or with a mixture ofacetone, ethyl acetate and isooctane and cleaned with MgSO4,silica, primary secondary amine or C18 (Cai et al. 2012;Forsberg et al. 2011; Gratz et al. 2011; Ramalhosa et al.2009; Kalachova et al. 2011; Smoker et al. 2010). Recently,the application of QuEChERS method for PAH determinationin environmental samples has been also reported (Albinetet al. 2013; Pule et al. 2012). In our previous study, theQuEChERS method was adapted for simultaneously determi-nation of pesticide and PAHs in fresh herbs (Sadowska-Rociek et al. 2013). However, except for research performedby Drabova et al. (2012), there has been no attempt to adaptQuEChERS method for the determination of PAHs in teasamples. For this reason, we decided to evaluate the applica-tion of QuEChERS extraction method for PAH determinationin infusions of various types of tea. In the experiment, weassessed the suitability of different kinds of extraction solvents(acetonitrile and ethyl acetate), sorbents (PSA, GCB, SAX,NH2) and a final method of sample preparation (by solventevaporation to dryness and dissolving the residues in hexane)or by LLE with the solvent exchange. The usefulness ofthe each variant of the analytical procedure was verified
basing on the recovery ratio of analysed compounds.The study was performed for black, green, red andwhite teas.
Materials and methods
Chemicals and reagents
Acetonitrile (MeCN), HPLC-grade, and ethyl acetate (EtAc),for liquid chromatography LiChrosolv® and formic acid,98 %, p.a., were purchased from Merck KGaA, Germany.Magnesium sulphate anhydrous p.a. and sodium chloridep.a. were purchased from Chempur SA, Poland. PSA, GCB,C18, SAX and NH2 SPE Bulk Sorbent derived from AgilentTechnologies, USA. EPA 525 PAH Mix-B (containing 12compounds: acenaphthylene, anthracene, benzo[a]anthracene,benzo[b]fluoranthene, benzo[k]fluoranthene, benzo[a]pyrene,chrysene, dibenzo[a,h]anthracene, fluorene, indeno[1,2,3-cd]pyrene, phenanthrene and pyrene) and anthracene-d10 wereobtained from Supelco, USA. Stock, intermediate and workingstandard solutions of PAHs at concentration 1 μg mL−1 andanthracene-d10 (syringe standard) at concentration 1 μg mL−1
were prepared in hexane. Deionised water (18 MΩ) was pro-duced by a Milli-Q system (Millipore; USA).
Instrumentation
Varian 4000 gas chromatography-mass spectrometry (GC-MS) (Varian, Inc., USA) system consisted of 3800 GC withCP-8410 autoinjector (Bruker, USA), and a 4,000 Ion TrapMS detector were used to perform the GC-MS analyses. Theinjector was CP-1177 split/splitless capillary injector, with atemperature of 270 °C and an injection volume of 1.0 μL. Eachinjection (splitless mode; Agilent focus liner with deactivatedglass wool) was performed in triplicate. Chromatographic sep-arations were conducted using a Zebron MultiResidue-1 col-umn (30 m×0.25 mm×0.25 μm; Phenomenex Inc., USA). TheGC oven was operated with the following temperature pro-gram: initial temperature 50 °C (1.0 min)–15 °C min−1–320 °C(6.0 min). Helium 5.0 (Linde Gas, Poland) was used as the GCcarrier gas at a flow rate of 1.0 mL min−1. The ion trap massspectrometer was operated in the internal ionisation mode, scanfrom m/z 45 to 500. The emission current of the ionisationfilament was set at 15 μA and dwell time at 65 ms. Analyseswere conducted in the selected ion monitoring mode (SIM)based on the use of one quantitative ions. Analysed compoundswere identified according to their qualitative ions and retentiontimes (Table 1). The trap and the transfer line temperatures wereset at 180 and 220 °C, respectively. The analyses were carriedout with a solvent delay of 8.0 min. Acquisition and processingdata were performed using Varian Start Workstation softwareand NIST 2.0 library.
Environ Sci Pollut Res (2014) 21:1326–1338 1327
T25 digital ultra-turrax disperser (IKA, Germany), MS1Minishaker (IKA, Germany) and MPW 350 R Centrifuge(MPW Med. Instruments, Poland) were used during samplepreparation. AccublockTM (Labnet, USA) with nitrogen 5.0(Linde Gas, Poland) was used to evaporate the solvent andconcentrate the extracts.
Sample preparation
The whole experiment was accomplished for black tea, and thebest variant of the method was then also tested separately forsamples of black, green, red andwhite teas. The tea sampleswereused for preparation of blank and fortified samples and werepurchased from the local market. As yet, tea and related food
matriceswith certified concentrations of PAHs are not commonlyavailable. Thus, the usefulness of the method was verified on thebasis of the recovery ratio of analysed compounds (analysis ofspiked samples). Recovery studies involved three samples of teabeing fortified with the standard solution. The extraction process
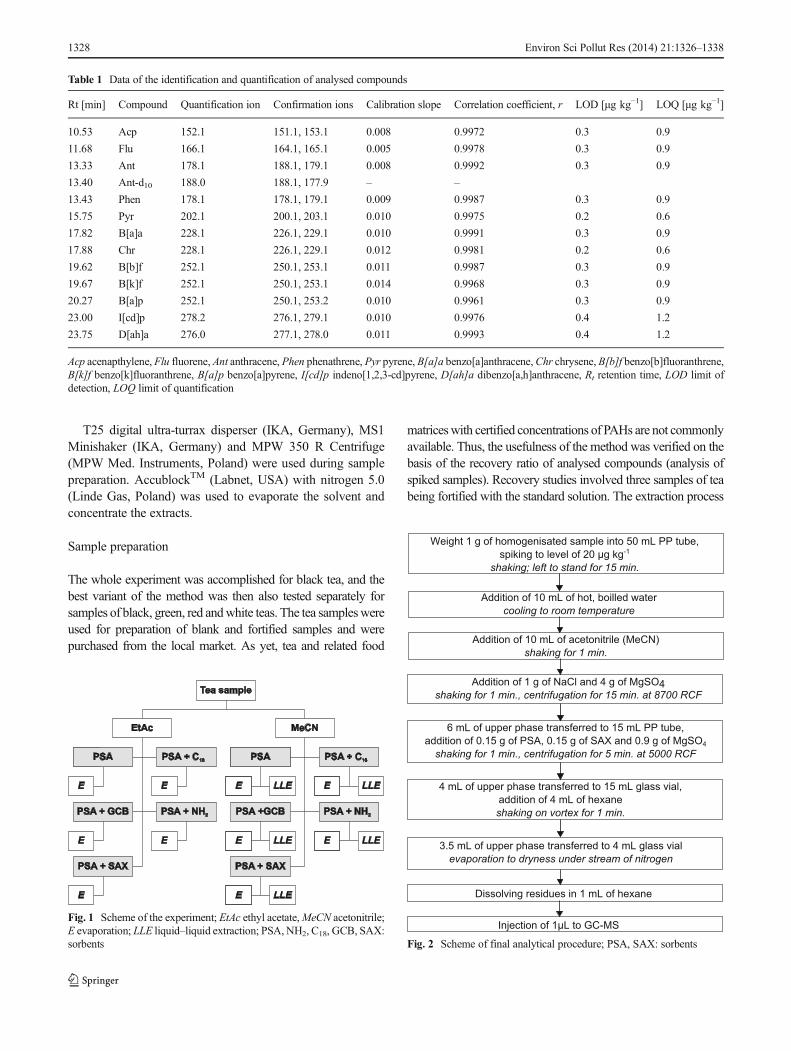
Fig. 1 Scheme of the experiment; EtAc ethyl acetate,MeCN acetonitrile;E evaporation; LLE liquid–liquid extraction; PSA, NH2, C18, GCB, SAX:sorbents Fig. 2 Scheme of final analytical procedure; PSA, SAX: sorbents
Table 1 Data of the identification and quantification of analysed compounds
Rt [min] Compound Quantification ion Confirmation ions Calibration slope Correlation coefficient, r LOD [μg kg−1] LOQ [μg kg−1]
10.53 Acp 152.1 151.1, 153.1 0.008 0.9972 0.3 0.9
11.68 Flu 166.1 164.1, 165.1 0.005 0.9978 0.3 0.9
13.33 Ant 178.1 188.1, 179.1 0.008 0.9992 0.3 0.9
13.40 Ant-d10 188.0 188.1, 177.9 – –
13.43 Phen 178.1 178.1, 179.1 0.009 0.9987 0.3 0.9
15.75 Pyr 202.1 200.1, 203.1 0.010 0.9975 0.2 0.6
17.82 B[a]a 228.1 226.1, 229.1 0.010 0.9991 0.3 0.9
17.88 Chr 228.1 226.1, 229.1 0.012 0.9981 0.2 0.6
19.62 B[b]f 252.1 250.1, 253.1 0.011 0.9987 0.3 0.9
19.67 B[k]f 252.1 250.1, 253.1 0.014 0.9968 0.3 0.9
20.27 B[a]p 252.1 250.1, 253.2 0.010 0.9961 0.3 0.9
23.00 I[cd]p 278.2 276.1, 279.1 0.010 0.9976 0.4 1.2
23.75 D[ah]a 276.0 277.1, 278.0 0.011 0.9993 0.4 1.2
Acp acenapthylene, Flu fluorene, Ant anthracene, Phen phenathrene, Pyr pyrene, B[a]a benzo[a]anthracene,Chr chrysene, B[b]f benzo[b]fluoranthrene,B[k]f benzo[k]fluoranthrene, B[a]p benzo[a]pyrene, I[cd]p indeno[1,2,3-cd]pyrene, D[ah]a dibenzo[a,h]anthracene, Rt retention time, LOD limit ofdetection, LOQ limit of quantification
1328 Environ Sci Pollut Res (2014) 21:1326–1338
was conducted as follows: A representative portion of each teawas cut, macerated and homogenized in a blender. One gram oftea was weighted into a 50-mL centrifuge tube, spiked withmixture of standards to the level of 20 μg kg−1, mixedand left to stand for 15 min at room temperature prior toextraction. Then, 10 mL of hot, boiled water was added tothe sample. Addition of water to the tea sample is a crucialstep, because firstly, it imitates the real tea infusion; secondly,it helps improve the extraction yield (Cajka et al. 2012;Drabova et al. 2012). After cooling to a room temperature,fifteen different procedures were applied to further prepara-tion of the tea extracts (Fig. 1).
Ten millilitres of acetonitrile or ethyl acetate was added,and the mixture was shaken vigorously for 1 min. Next, 1 gNaCl and 4 g MgSO4 were added, with the tube being shakenimmediately after addition of the salt. Then each sample wasshaken vigorously for 1 min and centrifuged for 15 min at8,700 RCF. Six millilitres of the supernatant was transferredinto a PP 15-mL tube containing an appropriate amount oftested sorbent (according to the scheme at Fig. 1) and 0.9 gMgSO4. The tube was shaken for 2 min and centrifuged for5 min at 5,000 RCF. A 4-mL amount from the extract was
transferred into a screw cup vial, and then 100 μL of theanthracene-d10 solution was added. The extract was: (1) evap-orated under a stream of N2 at a temperature of 40 °C todryness, and residues were dissolved in 1 mL of hexane(evaporation, E), or (2) a 4 mL of hexane was added; themixture was thoroughly shaken in a vortex for 1 min, and3.5 mL of upper hexane layer was transferred into a screw cupvial (LLE). The extracts were evaporated under a stream of N2
as previously described. The extracts were then analysed byGC-MS. The schema of the analytical procedure is shown inFig. 2. Blank samples and reagent blanks were preparedsimilarly but were not fortified.
Standards preparation
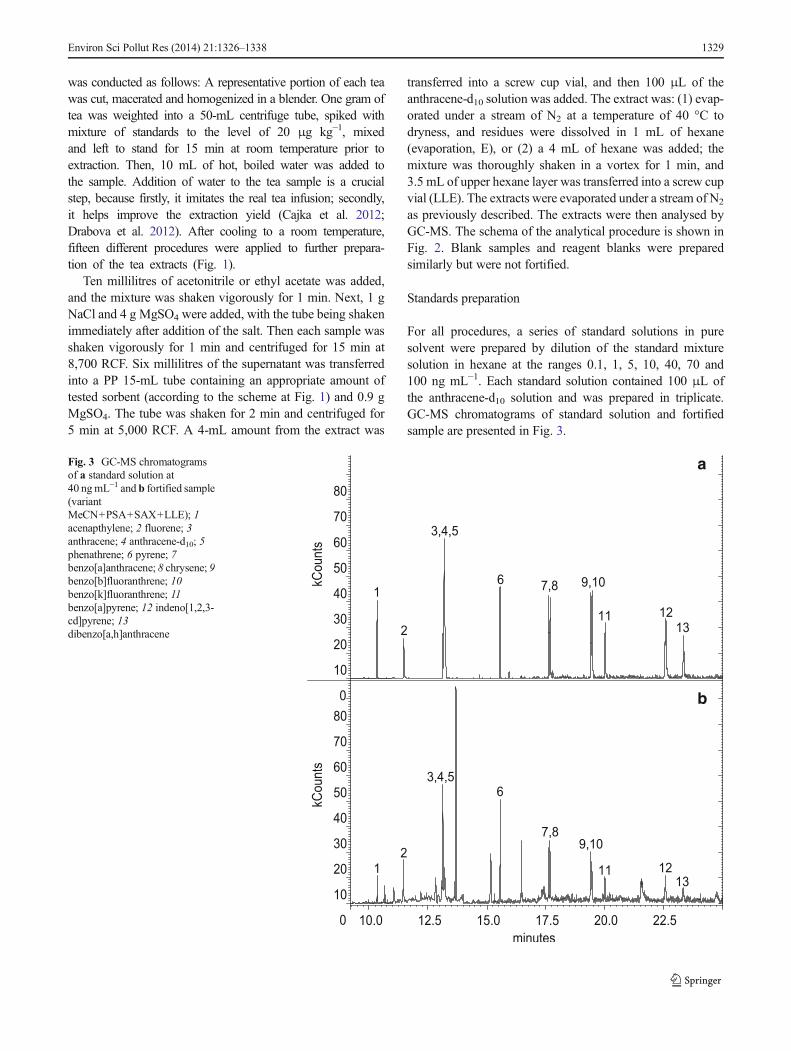
For all procedures, a series of standard solutions in puresolvent were prepared by dilution of the standard mixturesolution in hexane at the ranges 0.1, 1, 5, 10, 40, 70 and100 ng mL−1. Each standard solution contained 100 μL ofthe anthracene-d10 solution and was prepared in triplicate.GC-MS chromatograms of standard solution and fortifiedsample are presented in Fig. 3.
a
b
Fig. 3 GC-MS chromatogramsof a standard solution at40 ngmL−1 and b fortified sample(variantMeCN+PSA+SAX+LLE); 1acenapthylene; 2 fluorene; 3anthracene; 4 anthracene-d10; 5phenathrene; 6 pyrene; 7benzo[a]anthracene; 8 chrysene; 9benzo[b]fluoranthrene; 10benzo[k]fluoranthrene; 11benzo[a]pyrene; 12 indeno[1,2,3-cd]pyrene; 13dibenzo[a,h]anthracene
Environ Sci Pollut Res (2014) 21:1326–1338 1329
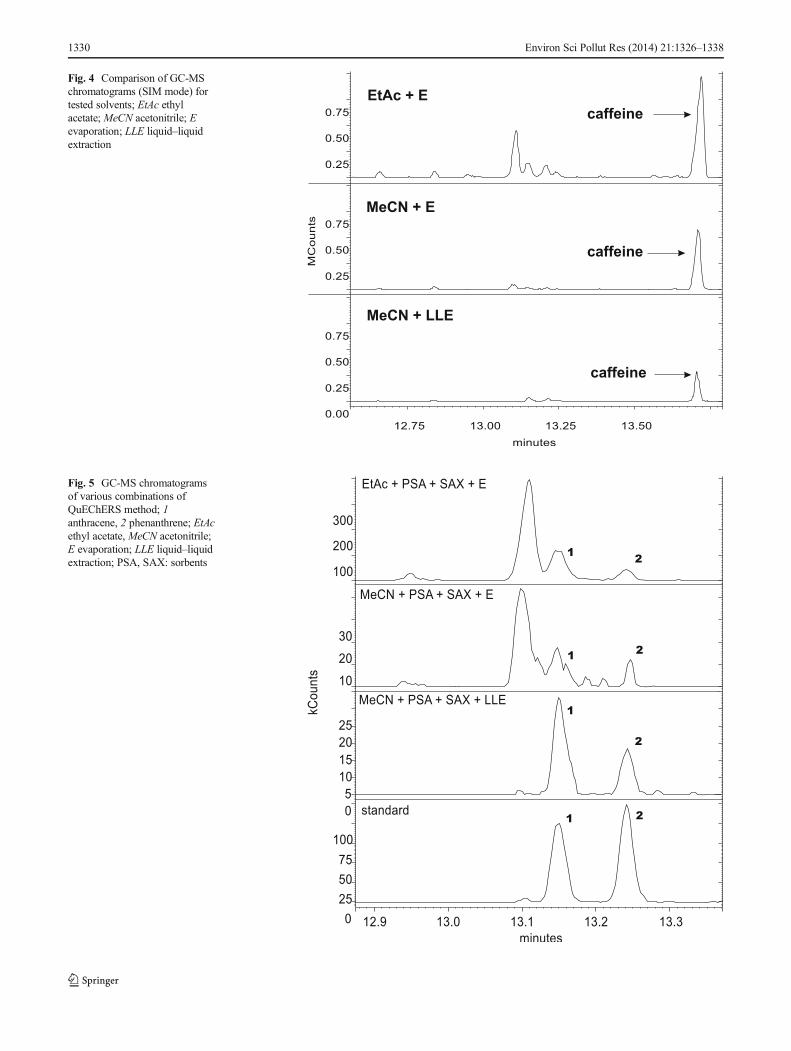
Fig. 5 GC-MS chromatogramsof various combinations ofQuEChERS method; 1anthracene, 2 phenanthrene; EtAcethyl acetate, MeCN acetonitrile;E evaporation; LLE liquid–liquidextraction; PSA, SAX: sorbents
Fig. 4 Comparison of GC-MSchromatograms (SIM mode) fortested solvents; EtAc ethylacetate; MeCN acetonitrile; Eevaporation; LLE liquid–liquidextraction
1330 Environ Sci Pollut Res (2014) 21:1326–1338
Results and discussion
Calibration curves were constructed by plotting integratedpeak areas, divided by the area of anthracene-d10, againstconcentrations of compounds. Peak areas have been reducedby the area of the peaks of compounds derived from blank(hexane). Therefore, calibration curves were calculated with-out y-intercept, which the high value could significantly affectthe calculation of the results making them inaccurate. Limit ofdetection (LOD) and limit of quantification (LOQ) were esti-mated based on the signal of the background noise measuredfrom the chromatograms of standard at the lowest calibrationlevel. The limit of detection was calculated as three timeshigher than the level of noise, and the limit of quantificationwere equal to ten times of the noise level. Table 1 summarizesthe obtained results. In all cases, the correlation coefficientwas higher than 0.99, and LOQs for almost all analysed PAHswere below 0.9 μg kg−1, with the exception for the heaviestcompounds: indeno[1,2,3-c,d]pyrene and dibenzo[a,h]an-thracene (1.2 μg kg−1).
Determination of organic compounds in differenttypes of tea involves specific problems with extraction,
clean-up and analysis by GC-MS due to the complexityof the tea matrix (presence of phenolic compounds andcaffeine) that can interfere with the analytes resulting inenhance or suppression of chromatographic peaks andambiguity of identification.
Phenolic compounds make up 25–35 % of the dry mattercontent of young, fresh tea leaves. They are responsible for thecolour of tea. Flavanol compounds are 80 % of the phenols,while the remainder is proanthocyanidins, phenolic acids,flavonols and flavones. During fermentation, the flavanolsare oxidised enzymatically to compounds that are responsiblefor the colour and flavour of black tea. The reddish-yellowcolour of black tea extract is largely due to theaflavins andthearubigins. The greenish or yellowish colour of green tearesults from the presence of flavonols and flavones. Tea leavescontain also pigments, chlorophyll and carotenoids. Chloro-phyll is degraded during tea processing to chlorophyllides andpheophorbides that are brownish in colour. Fourteen caroten-oids (i.e. xanthophylls, neoxanthin, violaxanthin and β-carotene) have been identified in tea leaves. However, theircontent decreases during the processing of black tea (Belitzet al. 2009).
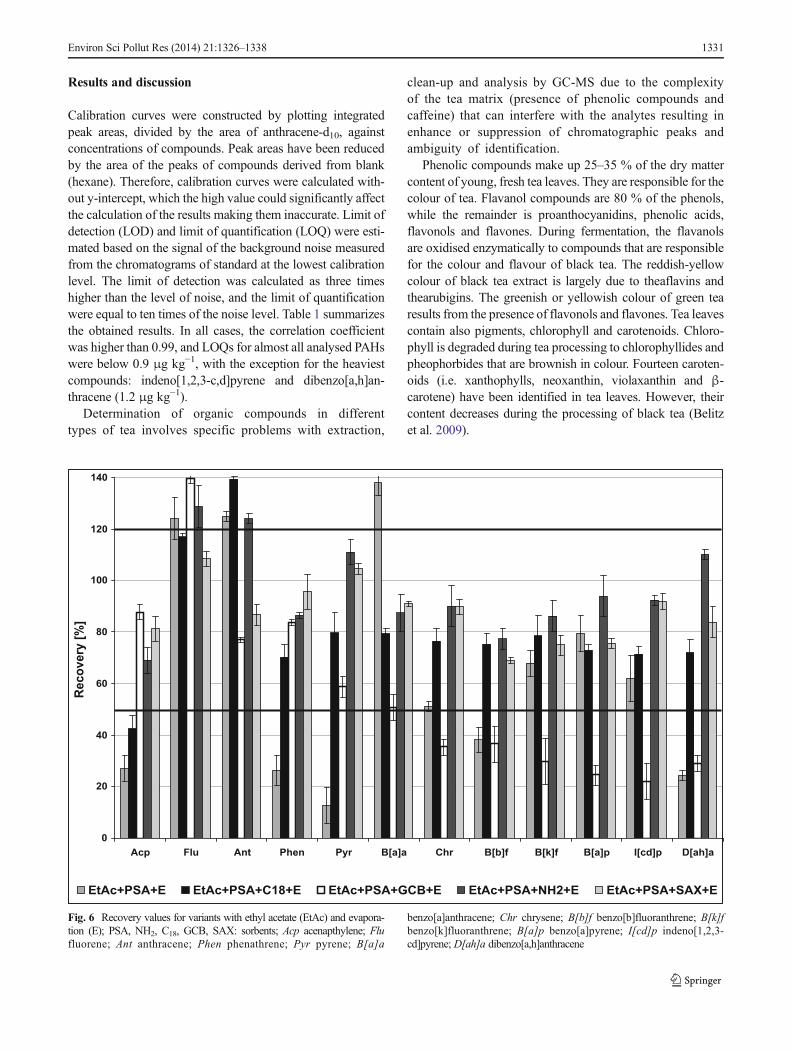
Fig. 6 Recovery values for variants with ethyl acetate (EtAc) and evapora-tion (E); PSA, NH2, C18, GCB, SAX: sorbents; Acp acenapthylene; Flufluorene; Ant anthracene; Phen phenathrene; Pyr pyrene; B[a]a
benzo[a]anthracene; Chr chrysene; B[b]f benzo[b]fluoranthrene; B[k]fbenzo[k]fluoranthrene; B[a]p benzo[a]pyrene; I[cd]p indeno[1,2,3-cd]pyrene; D[ah]a dibenzo[a,h]anthracene
Environ Sci Pollut Res (2014) 21:1326–1338 1331
Therefore, we decided to evaluate different modificationsof QuEChERS method, and we tested their capabilities ofsimultaneous good analyte extraction from a sample and theleast possible extraction of undesirable interfering compo-nents, such as phenolic compounds responsible for tea colourand caffeine. Acetonitrile was the first solvent, used typicallyin QuEChERS method for pesticide extraction, and ethylacetate was the second tested solvent, chosen for the fact thatit is often applied for the extraction of PAHs. Additionally, aninvestigation was also made to find out if the use of certainsorbents would improve the purification step. Primary sec-ondary amine (PSA) removes sugars, fatty and other acids;graphitized carbon black (GCB) is used for removal of pig-ments, such as chlorophyll. C18 is the most hydrophobic,because of its extreme retentive nature for non-polar com-pounds, such as fat. NH2 sorbent, a weaker anion exchanger,extracts strong acids that have one or more negative charges.SAX is a strong anion exchange sorbent ideally suited for theextraction of compounds such as carboxylic acids (AgilentTechnologies 2013).
Finally, we compared yield of evaporation and liquid–liquid exchange step. The choice of the most suitable solvent,
sorbent and final preparation of the extract was based on aquantitative (PAH recovery ratio values) and a qualitativeapproach (sample colour, its transparency and the content ofimpurities) and the quality of the chromatograms obtained.
Appearance of the extracts
The experiment showed that the cleanest extracts wereobtained after MeCN extraction and clean-up with GCB,SAX or NH2. The efficiency in removal colour by GCB canbe explained by its properties associated with the pigmentsremoving from the samples. On the other hand, it was sup-posed that the use of SAX or NH2 enabled to eliminate somephenolic compounds, taking into account the properties ofthese sorbents (extraction of certain acids).
In case of extraction with ethyl acetate, the tea extractswere more dark-coloured and contaminated than after the useof acetonitrile. As can be seen from Fig. 4, use of ethyl acetate,in contrast to acetonitrile, also resulted in the extraction ofintereferents such as caffeine, from the sample. The peak ofcaffeine was usually higher in samples extracted with ethylacetate comparing with samples extracted with acetonitrile,
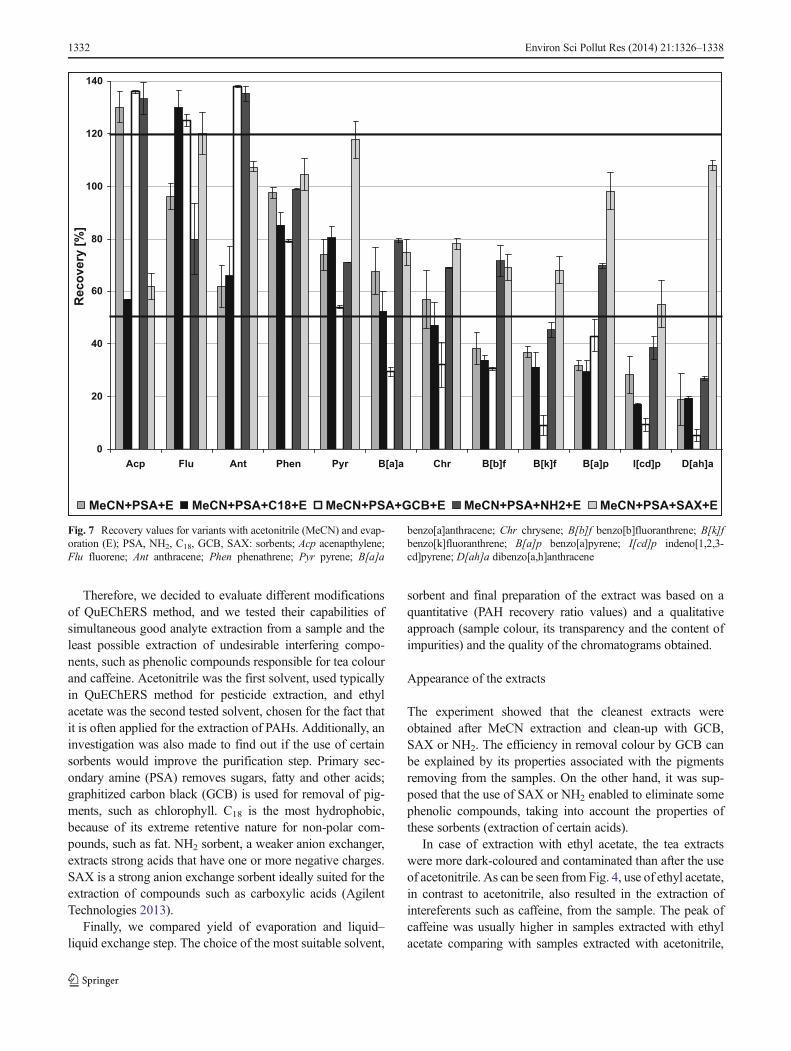
Fig. 7 Recovery values for variants with acetonitrile (MeCN) and evap-oration (E); PSA, NH2, C18, GCB, SAX: sorbents; Acp acenapthylene;Flu fluorene; Ant anthracene; Phen phenathrene; Pyr pyrene; B[a]a
benzo[a]anthracene; Chr chrysene; B[b]f benzo[b]fluoranthrene; B[k]fbenzo[k]fluoranthrene; B[a]p benzo[a]pyrene; I[cd]p indeno[1,2,3-cd]pyrene; D[ah]a dibenzo[a,h]anthracene
1332 Environ Sci Pollut Res (2014) 21:1326–1338
regardless of type of sorbent used. Caffeine was partiallyremoved from the sample where acetonitrile was used forthe extraction.
However, a substantial improvement of extract puri-fication was achieved using liquid–liquid extraction(exchange acetonitrile to hexane). This phenomenon,clarified by Cajka et al. (2012), is based on a worsesolubility of usually polar matrix co-extractives in non-polar hexane than in more polar acetonitrile. On theother hand, the application of final evaporation of theextracts to dryness and then dissolving the residues inhexane resulted in incomplete separation of some peaksand signal enhance. This situation was noticed, e.g. foranthracene (Fig. 5).
Recovery studies
Recovery studies were conducted after fortification to thelevels of 20 μg kg−1. The percent recoveries were calculatedby substracting values in an unspiked blank sample fromvalues in the spiked sample. The received values of therecovery varied and strongly depended on type of the
extraction solvent and compound formula, and finally, theywere also influenced by the matrix components.
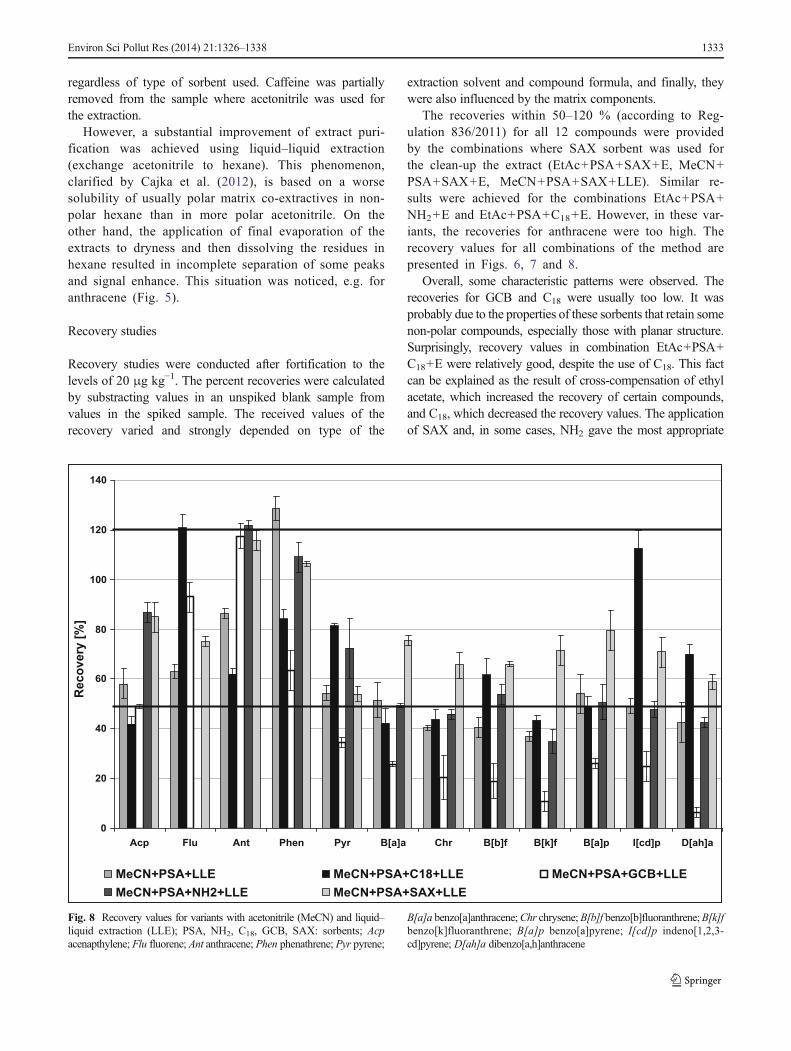
The recoveries within 50–120 % (according to Reg-ulation 836/2011) for all 12 compounds were providedby the combinations where SAX sorbent was used forthe clean-up the extract (EtAc+PSA+SAX+E, MeCN+PSA+SAX+E, MeCN+PSA+SAX+LLE). Similar re-sults were achieved for the combinations EtAc+PSA+NH2+E and EtAc+PSA+C18+E. However, in these var-iants, the recoveries for anthracene were too high. Therecovery values for all combinations of the method arepresented in Figs. 6, 7 and 8.
Overall, some characteristic patterns were observed. Therecoveries for GCB and C18 were usually too low. It wasprobably due to the properties of these sorbents that retain somenon-polar compounds, especially those with planar structure.Surprisingly, recovery values in combination EtAc+PSA+C18+E were relatively good, despite the use of C18. This factcan be explained as the result of cross-compensation of ethylacetate, which increased the recovery of certain compounds,and C18, which decreased the recovery values. The applicationof SAX and, in some cases, NH2 gave the most appropriate
Fig. 8 Recovery values for variants with acetonitrile (MeCN) and liquid–liquid extraction (LLE); PSA, NH2, C18, GCB, SAX: sorbents; Acpacenapthylene; Flu fluorene; Ant anthracene; Phen phenathrene; Pyr pyrene;
B[a]a benzo[a]anthracene;Chr chrysene;B[b]f benzo[b]fluoranthrene;B[k]fbenzo[k]fluoranthrene; B[a]p benzo[a]pyrene; I[cd]p indeno[1,2,3-cd]pyrene; D[ah]a dibenzo[a,h]anthracene
Environ Sci Pollut Res (2014) 21:1326–1338 1333
values of the recovery, while the application of only PSAsorbent resulted in diversified values of recoveries.
Considering the recoveries for each compound, some inter-esting observations can be made. For almost all combinations ofthe tested methods, the recoveries of fluorene and anthracenewere significantly too high. For these compounds, the chromato-graphic signal and thus its mean recovery values were severaltimes higher than expected. The results can be explained by thepresence of co-extractive components from the matrix, havingthe same qualifier ions as analytes and interacting with them.
RSD values
The repeatability of recovery values, expressed as the relativestandard deviation (RSD) of the spiked sample concentrations,was lower than 20% for almost all samples, only in some casesexceeding this level. Although the differences between RSDvalues for each combination of the method were discovered,there was no explicit relation between these values.
Selection of the best variant of the method
Considering: (1) the appearance of extracts and the content ofinteracting matrix co-extractive components and (2) the
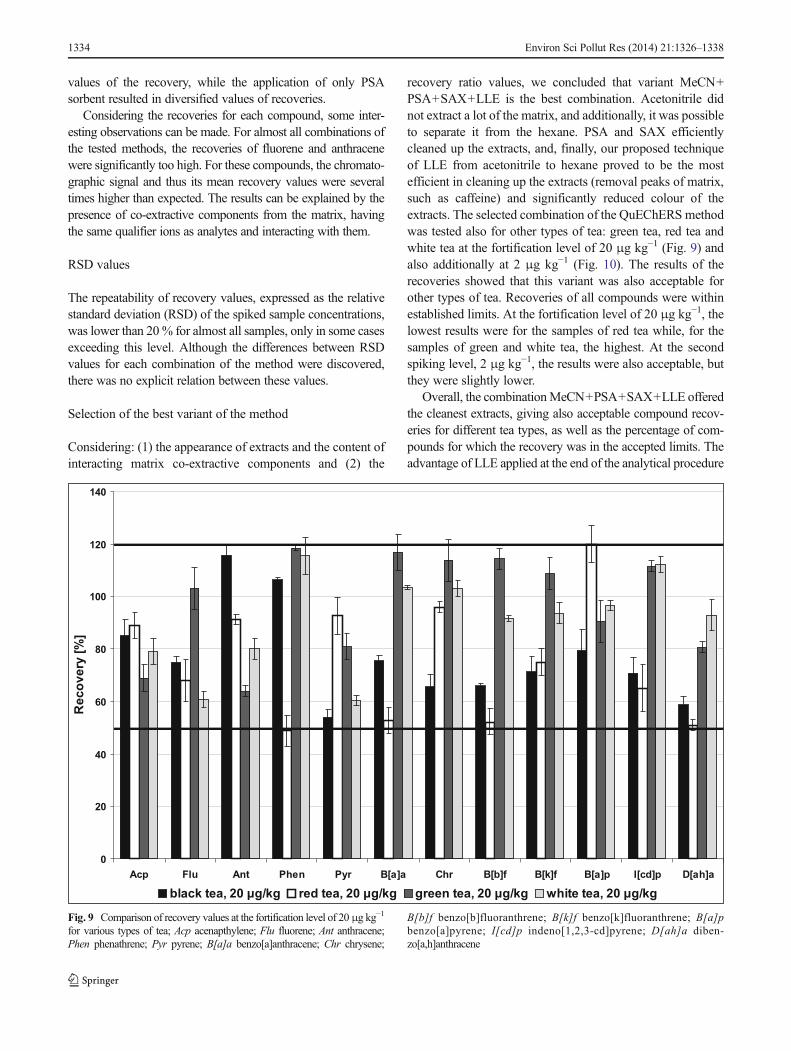
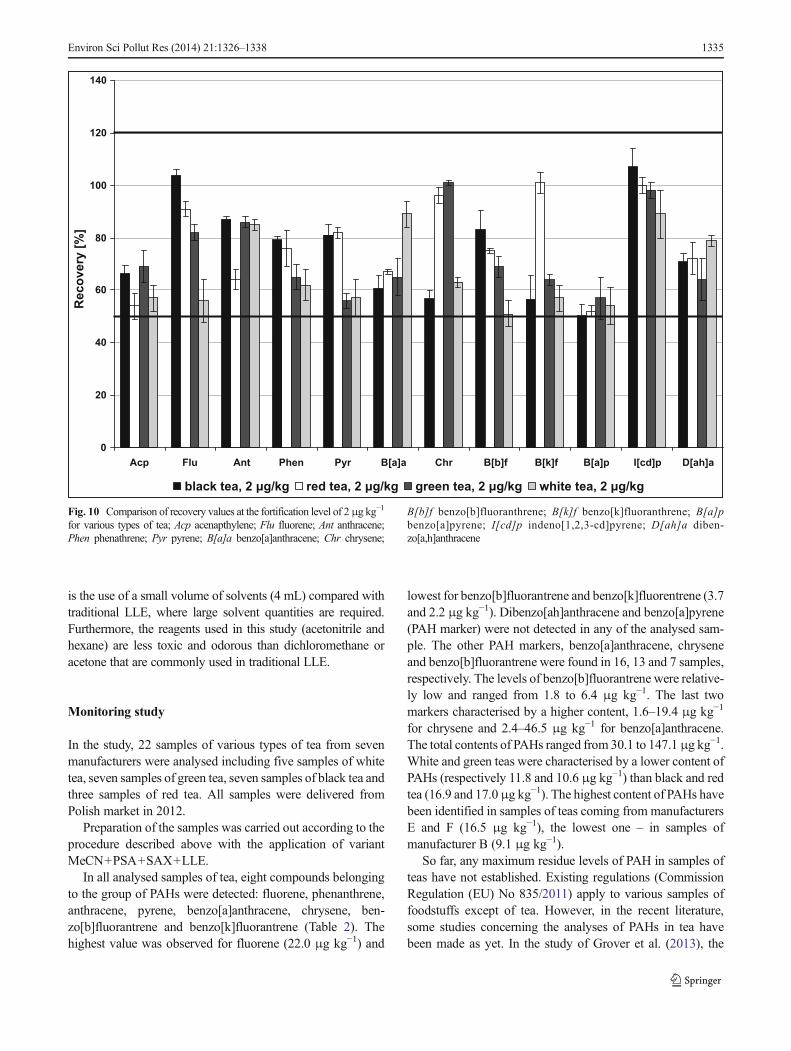
recovery ratio values, we concluded that variant MeCN+PSA+SAX+LLE is the best combination. Acetonitrile didnot extract a lot of the matrix, and additionally, it was possibleto separate it from the hexane. PSA and SAX efficientlycleaned up the extracts, and, finally, our proposed techniqueof LLE from acetonitrile to hexane proved to be the mostefficient in cleaning up the extracts (removal peaks of matrix,such as caffeine) and significantly reduced colour of theextracts. The selected combination of the QuEChERS methodwas tested also for other types of tea: green tea, red tea andwhite tea at the fortification level of 20 μg kg−1 (Fig. 9) andalso additionally at 2 μg kg−1 (Fig. 10). The results of therecoveries showed that this variant was also acceptable forother types of tea. Recoveries of all compounds were withinestablished limits. At the fortification level of 20 μg kg−1, thelowest results were for the samples of red tea while, for thesamples of green and white tea, the highest. At the secondspiking level, 2 μg kg−1, the results were also acceptable, butthey were slightly lower.
Overall, the combinationMeCN+PSA+SAX+LLE offeredthe cleanest extracts, giving also acceptable compound recov-eries for different tea types, as well as the percentage of com-pounds for which the recovery was in the accepted limits. Theadvantage of LLE applied at the end of the analytical procedure
Fig. 9 Comparison of recovery values at the fortification level of 20μg kg−1
for various types of tea; Acp acenapthylene; Flu fluorene; Ant anthracene;Phen phenathrene; Pyr pyrene; B[a]a benzo[a]anthracene; Chr chrysene;
B[b]f benzo[b]fluoranthrene; B[k]f benzo[k]fluoranthrene; B[a]pbenzo[a]pyrene; I[cd]p indeno[1,2,3-cd]pyrene; D[ah]a diben-zo[a,h]anthracene
1334 Environ Sci Pollut Res (2014) 21:1326–1338
is the use of a small volume of solvents (4 mL) compared withtraditional LLE, where large solvent quantities are required.Furthermore, the reagents used in this study (acetonitrile andhexane) are less toxic and odorous than dichloromethane oracetone that are commonly used in traditional LLE.
Monitoring study
In the study, 22 samples of various types of tea from sevenmanufacturers were analysed including five samples of whitetea, seven samples of green tea, seven samples of black tea andthree samples of red tea. All samples were delivered fromPolish market in 2012.
Preparation of the samples was carried out according to theprocedure described above with the application of variantMeCN+PSA+SAX+LLE.
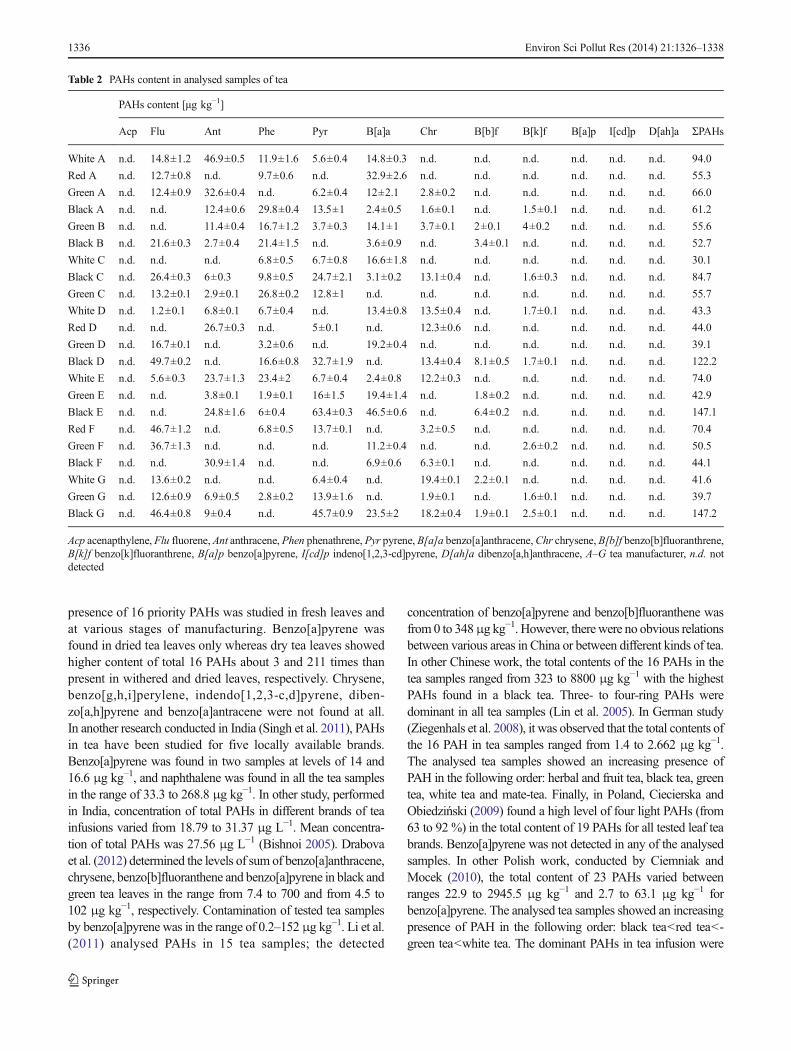
In all analysed samples of tea, eight compounds belongingto the group of PAHs were detected: fluorene, phenanthrene,anthracene, pyrene, benzo[a]anthracene, chrysene, ben-zo[b]fluorantrene and benzo[k]fluorantrene (Table 2). Thehighest value was observed for fluorene (22.0 μg kg−1) and
lowest for benzo[b]fluorantrene and benzo[k]fluorentrene (3.7and 2.2 μg kg−1). Dibenzo[ah]anthracene and benzo[a]pyrene(PAH marker) were not detected in any of the analysed sam-ple. The other PAH markers, benzo[a]anthracene, chryseneand benzo[b]fluorantrene were found in 16, 13 and 7 samples,respectively. The levels of benzo[b]fluorantrene were relative-ly low and ranged from 1.8 to 6.4 μg kg−1. The last twomarkers characterised by a higher content, 1.6–19.4 μg kg−1
for chrysene and 2.4–46.5 μg kg−1 for benzo[a]anthracene.The total contents of PAHs ranged from 30.1 to 147.1μg kg−1.White and green teas were characterised by a lower content ofPAHs (respectively 11.8 and 10.6 μg kg−1) than black and redtea (16.9 and 17.0μg kg−1). The highest content of PAHs havebeen identified in samples of teas coming from manufacturersE and F (16.5 μg kg−1), the lowest one – in samples ofmanufacturer B (9.1 μg kg−1).
So far, any maximum residue levels of PAH in samples ofteas have not established. Existing regulations (CommissionRegulation (EU) No 835/2011) apply to various samples offoodstuffs except of tea. However, in the recent literature,some studies concerning the analyses of PAHs in tea havebeen made as yet. In the study of Grover et al. (2013), the
Fig. 10 Comparison of recovery values at the fortification level of 2μg kg−1
for various types of tea; Acp acenapthylene; Flu fluorene; Ant anthracene;Phen phenathrene; Pyr pyrene; B[a]a benzo[a]anthracene; Chr chrysene;
B[b]f benzo[b]fluoranthrene; B[k]f benzo[k]fluoranthrene; B[a]pbenzo[a]pyrene; I[cd]p indeno[1,2,3-cd]pyrene; D[ah]a diben-zo[a,h]anthracene
Environ Sci Pollut Res (2014) 21:1326–1338 1335
presence of 16 priority PAHs was studied in fresh leaves andat various stages of manufacturing. Benzo[a]pyrene wasfound in dried tea leaves only whereas dry tea leaves showedhigher content of total 16 PAHs about 3 and 211 times thanpresent in withered and dried leaves, respectively. Chrysene,benzo[g,h,i]perylene, indendo[1,2,3-c,d]pyrene, diben-zo[a,h]pyrene and benzo[a]antracene were not found at all.In another research conducted in India (Singh et al. 2011), PAHsin tea have been studied for five locally available brands.Benzo[a]pyrene was found in two samples at levels of 14 and16.6 μg kg−1, and naphthalene was found in all the tea samplesin the range of 33.3 to 268.8 μg kg−1. In other study, performedin India, concentration of total PAHs in different brands of teainfusions varied from 18.79 to 31.37 μg L−1. Mean concentra-tion of total PAHs was 27.56 μg L−1 (Bishnoi 2005). Drabovaet al. (2012) determined the levels of sum of benzo[a]anthracene,chrysene, benzo[b]fluoranthene and benzo[a]pyrene in black andgreen tea leaves in the range from 7.4 to 700 and from 4.5 to102 μg kg−1, respectively. Contamination of tested tea samplesby benzo[a]pyrene was in the range of 0.2–152 μg kg−1. Li et al.(2011) analysed PAHs in 15 tea samples; the detected
concentration of benzo[a]pyrene and benzo[b]fluoranthene wasfrom 0 to 348μg kg−1. However, therewere no obvious relationsbetween various areas in China or between different kinds of tea.In other Chinese work, the total contents of the 16 PAHs in thetea samples ranged from 323 to 8800 μg kg−1 with the highestPAHs found in a black tea. Three- to four-ring PAHs weredominant in all tea samples (Lin et al. 2005). In German study(Ziegenhals et al. 2008), it was observed that the total contents ofthe 16 PAH in tea samples ranged from 1.4 to 2.662 μg kg−1.The analysed tea samples showed an increasing presence ofPAH in the following order: herbal and fruit tea, black tea, greentea, white tea and mate-tea. Finally, in Poland, Ciecierska andObiedziński (2009) found a high level of four light PAHs (from63 to 92 %) in the total content of 19 PAHs for all tested leaf teabrands. Benzo[a]pyrene was not detected in any of the analysedsamples. In other Polish work, conducted by Ciemniak andMocek (2010), the total content of 23 PAHs varied betweenranges 22.9 to 2945.5 μg kg−1 and 2.7 to 63.1 μg kg−1 forbenzo[a]pyrene. The analysed tea samples showed an increasingpresence of PAH in the following order: black tea<red tea<-green tea<white tea. The dominant PAHs in tea infusion were
Table 2 PAHs content in analysed samples of tea
PAHs content [μg kg−1]
Acp Flu Ant Phe Pyr B[a]a Chr B[b]f B[k]f B[a]p I[cd]p D[ah]a ΣPAHs
White A n.d. 14.8±1.2 46.9±0.5 11.9±1.6 5.6±0.4 14.8±0.3 n.d. n.d. n.d. n.d. n.d. n.d. 94.0
Red A n.d. 12.7±0.8 n.d. 9.7±0.6 n.d. 32.9±2.6 n.d. n.d. n.d. n.d. n.d. n.d. 55.3
Green A n.d. 12.4±0.9 32.6±0.4 n.d. 6.2±0.4 12±2.1 2.8±0.2 n.d. n.d. n.d. n.d. n.d. 66.0
Black A n.d. n.d. 12.4±0.6 29.8±0.4 13.5±1 2.4±0.5 1.6±0.1 n.d. 1.5±0.1 n.d. n.d. n.d. 61.2
Green B n.d. n.d. 11.4±0.4 16.7±1.2 3.7±0.3 14.1±1 3.7±0.1 2±0.1 4±0.2 n.d. n.d. n.d. 55.6
Black B n.d. 21.6±0.3 2.7±0.4 21.4±1.5 n.d. 3.6±0.9 n.d. 3.4±0.1 n.d. n.d. n.d. n.d. 52.7
White C n.d. n.d. n.d. 6.8±0.5 6.7±0.8 16.6±1.8 n.d. n.d. n.d. n.d. n.d. n.d. 30.1
Black C n.d. 26.4±0.3 6±0.3 9.8±0.5 24.7±2.1 3.1±0.2 13.1±0.4 n.d. 1.6±0.3 n.d. n.d. n.d. 84.7
Green C n.d. 13.2±0.1 2.9±0.1 26.8±0.2 12.8±1 n.d. n.d. n.d. n.d. n.d. n.d. n.d. 55.7
White D n.d. 1.2±0.1 6.8±0.1 6.7±0.4 n.d. 13.4±0.8 13.5±0.4 n.d. 1.7±0.1 n.d. n.d. n.d. 43.3
Red D n.d. n.d. 26.7±0.3 n.d. 5±0.1 n.d. 12.3±0.6 n.d. n.d. n.d. n.d. n.d. 44.0
Green D n.d. 16.7±0.1 n.d. 3.2±0.6 n.d. 19.2±0.4 n.d. n.d. n.d. n.d. n.d. n.d. 39.1
Black D n.d. 49.7±0.2 n.d. 16.6±0.8 32.7±1.9 n.d. 13.4±0.4 8.1±0.5 1.7±0.1 n.d. n.d. n.d. 122.2
White E n.d. 5.6±0.3 23.7±1.3 23.4±2 6.7±0.4 2.4±0.8 12.2±0.3 n.d. n.d. n.d. n.d. n.d. 74.0
Green E n.d. n.d. 3.8±0.1 1.9±0.1 16±1.5 19.4±1.4 n.d. 1.8±0.2 n.d. n.d. n.d. n.d. 42.9
Black E n.d. n.d. 24.8±1.6 6±0.4 63.4±0.3 46.5±0.6 n.d. 6.4±0.2 n.d. n.d. n.d. n.d. 147.1
Red F n.d. 46.7±1.2 n.d. 6.8±0.5 13.7±0.1 n.d. 3.2±0.5 n.d. n.d. n.d. n.d. n.d. 70.4
Green F n.d. 36.7±1.3 n.d. n.d. n.d. 11.2±0.4 n.d. n.d. 2.6±0.2 n.d. n.d. n.d. 50.5
Black F n.d. n.d. 30.9±1.4 n.d. n.d. 6.9±0.6 6.3±0.1 n.d. n.d. n.d. n.d. n.d. 44.1
White G n.d. 13.6±0.2 n.d. n.d. 6.4±0.4 n.d. 19.4±0.1 2.2±0.1 n.d. n.d. n.d. n.d. 41.6
Green G n.d. 12.6±0.9 6.9±0.5 2.8±0.2 13.9±1.6 n.d. 1.9±0.1 n.d. 1.6±0.1 n.d. n.d. n.d. 39.7
Black G n.d. 46.4±0.8 9±0.4 n.d. 45.7±0.9 23.5±2 18.2±0.4 1.9±0.1 2.5±0.1 n.d. n.d. n.d. 147.2
Acp acenapthylene, Flu fluorene, Ant anthracene, Phen phenathrene, Pyr pyrene, B[a]a benzo[a]anthracene,Chr chrysene, B[b]f benzo[b]fluoranthrene,B[k]f benzo[k]fluoranthrene, B[a]p benzo[a]pyrene, I[cd]p indeno[1,2,3-cd]pyrene, D[ah]a dibenzo[a,h]anthracene, A–G tea manufacturer, n.d. notdetected
1336 Environ Sci Pollut Res (2014) 21:1326–1338
two-, three- and four-ring PAHs, while the most toxic com-pounds were found at trace amounts. The concentrations oftotal 23 PAHs and benzo[a]pyrene in tea infusions rangedfrom 332.5 to 2245.9 ng L−1 and 0.35 to 18.7 ng L−1,respectively.
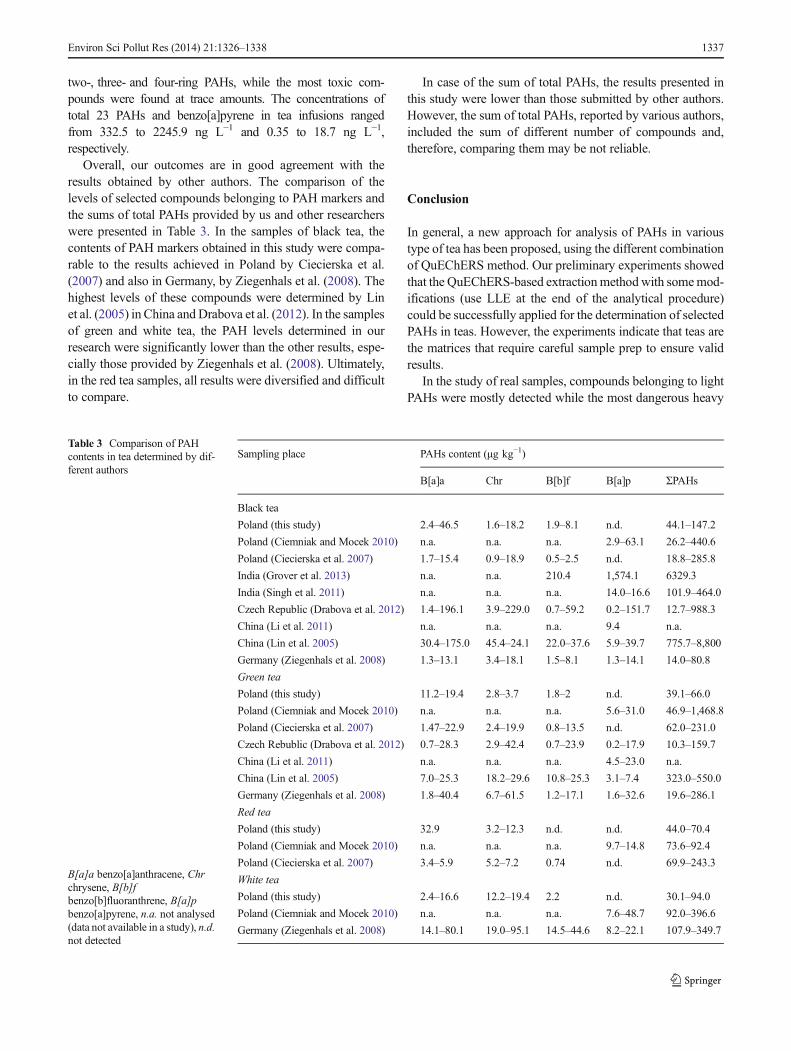
Overall, our outcomes are in good agreement with theresults obtained by other authors. The comparison of thelevels of selected compounds belonging to PAH markers andthe sums of total PAHs provided by us and other researcherswere presented in Table 3. In the samples of black tea, thecontents of PAH markers obtained in this study were compa-rable to the results achieved in Poland by Ciecierska et al.(2007) and also in Germany, by Ziegenhals et al. (2008). Thehighest levels of these compounds were determined by Linet al. (2005) in China andDrabova et al. (2012). In the samplesof green and white tea, the PAH levels determined in ourresearch were significantly lower than the other results, espe-cially those provided by Ziegenhals et al. (2008). Ultimately,in the red tea samples, all results were diversified and difficultto compare.
In case of the sum of total PAHs, the results presented inthis study were lower than those submitted by other authors.However, the sum of total PAHs, reported by various authors,included the sum of different number of compounds and,therefore, comparing them may be not reliable.
Conclusion
In general, a new approach for analysis of PAHs in varioustype of tea has been proposed, using the different combinationof QuEChERS method. Our preliminary experiments showedthat the QuEChERS-based extractionmethodwith somemod-ifications (use LLE at the end of the analytical procedure)could be successfully applied for the determination of selectedPAHs in teas. However, the experiments indicate that teas arethe matrices that require careful sample prep to ensure validresults.
In the study of real samples, compounds belonging to lightPAHs were mostly detected while the most dangerous heavy
Table 3 Comparison of PAHcontents in tea determined by dif-ferent authors
B[a]a benzo[a]anthracene, Chrchrysene, B[b]fbenzo[b]fluoranthrene, B[a]pbenzo[a]pyrene, n.a. not analysed(data not available in a study), n.d.not detected
Sampling place PAHs content (μg kg−1)
B[a]a Chr B[b]f B[a]p ΣPAHs
Black tea
Poland (this study) 2.4–46.5 1.6–18.2 1.9–8.1 n.d. 44.1–147.2
Poland (Ciemniak and Mocek 2010) n.a. n.a. n.a. 2.9–63.1 26.2–440.6
Poland (Ciecierska et al. 2007) 1.7–15.4 0.9–18.9 0.5–2.5 n.d. 18.8–285.8
India (Grover et al. 2013) n.a. n.a. 210.4 1,574.1 6329.3
India (Singh et al. 2011) n.a. n.a. n.a. 14.0–16.6 101.9–464.0
Czech Republic (Drabova et al. 2012) 1.4–196.1 3.9–229.0 0.7–59.2 0.2–151.7 12.7–988.3
China (Li et al. 2011) n.a. n.a. n.a. 9.4 n.a.
China (Lin et al. 2005) 30.4–175.0 45.4–24.1 22.0–37.6 5.9–39.7 775.7–8,800
Germany (Ziegenhals et al. 2008) 1.3–13.1 3.4–18.1 1.5–8.1 1.3–14.1 14.0–80.8
Green tea
Poland (this study) 11.2–19.4 2.8–3.7 1.8–2 n.d. 39.1–66.0
Poland (Ciemniak and Mocek 2010) n.a. n.a. n.a. 5.6–31.0 46.9–1,468.8
Poland (Ciecierska et al. 2007) 1.47–22.9 2.4–19.9 0.8–13.5 n.d. 62.0–231.0
Czech Rebublic (Drabova et al. 2012) 0.7–28.3 2.9–42.4 0.7–23.9 0.2–17.9 10.3–159.7
China (Li et al. 2011) n.a. n.a. n.a. 4.5–23.0 n.a.
China (Lin et al. 2005) 7.0–25.3 18.2–29.6 10.8–25.3 3.1–7.4 323.0–550.0
Germany (Ziegenhals et al. 2008) 1.8–40.4 6.7–61.5 1.2–17.1 1.6–32.6 19.6–286.1
Red tea
Poland (this study) 32.9 3.2–12.3 n.d. n.d. 44.0–70.4
Poland (Ciemniak and Mocek 2010) n.a. n.a. n.a. 9.7–14.8 73.6–92.4
Poland (Ciecierska et al. 2007) 3.4–5.9 5.2–7.2 0.74 n.d. 69.9–243.3
White tea
Poland (this study) 2.4–16.6 12.2–19.4 2.2 n.d. 30.1–94.0
Poland (Ciemniak and Mocek 2010) n.a. n.a. n.a. 7.6–48.7 92.0–396.6
Germany (Ziegenhals et al. 2008) 14.1–80.1 19.0–95.1 14.5–44.6 8.2–22.1 107.9–349.7
Environ Sci Pollut Res (2014) 21:1326–1338 1337
polycyclic aromatic hydrocarbons, including benzo[a]pyrene,were not identified in any of samples.
Open Access This article is distributed under the terms of the CreativeCommons Attribution License which permits any use, distribution, andreproduction in any medium, provided the original author(s) and thesource are credited.
References
Agilent Technologies (2013) Agilent Products for Solid Phase ExtractionBrochure. www.chem.agilent.com. Accessed 23 May 2013
Albinet A, Tomaz S, Lestremau F (2013) A really quick easy cheapeffective rugged and safe (QuEChERS) extraction procedure forthe analysis of particle-bound PAHs in ambient air and emissionsamples. Sci Total Environ 450–451:31–38
Anastassiades M, Lehotay SJ, Stajnbaher D, Schenck FJ (2003) Fast andeasy multiresidue method employing acetonitrile extraction/partitioning and dispersive solid-phase extraction for the determina-tion of pesticide residues in produce. J AOAC Int 86:412–431
Belitz HD, Grosch W, Schieberle P (2009) Coffee, tea, cocoa. In: Foodchemistry. Springer, Berlin, pp 938–970
Bishnoi NR, Mehta U, Umashanker Sain U, Pandit GG (2005) Quanti-fication of polycyclic aromatic hydrocarbons in tea and coffeesamples of Mumbai city (India) by high performance liquid chro-matography. Environ Monit Assess 107:399–406
Cai S-S, Stevens J, Syage JA (2012) Ultra high performance liquidchromatography-atmospheric pressure photoionization-mass spec-trometry for high-sensitivity analysis of US Environmental Protec-tion Agency sixteen priority pollutant polynuclear aromatic hydro-carbons in oysters. J Chromatogr A 1227:138–144
Cajka T, Sandy C, Bachanova V, Drabova L, Kalachova K, Pulkrabova J,Hajslova J (2012) Streamlining sample preparation and gas chro-matography–tandem mass spectrometry analysis of multiple pesti-cide residues in tea. Anal Chim Acta 743:51–60
Ciecierska M, Obiedzinski M, Albin M (2007) Teas’ contamination bypolycyclic aromatic hydrocarbons. Food Sci Technol Quality5(54):267–273 (in Polish)
Ciecierska M, Obiedzinski M (2009) Determination of polycyclic aro-matic hydrocarbons content in leaf teas by GC-MS method. BromatChem Toksykol 2:182–188 (in Polish)
Ciemniak A,Mocek K (2010) Polycyclic aromatic hydrocarbons in tea andtea infusions. AnnNational Institute of Hygiene 3:243–248 (in Polish)
Commission Regulation (EU) (2011) No 835/2011 of 19 August 2011amending Regulation (EC) No 1881/2006 as regards maximumlevels for polycyclic aromatic hydrocarbons in foodstuffs
Commission Regulation (EU) (2011) No 836/2011 of 19 August 2011amending Regulation (EC) No 333/2007 laying down the methodsof sampling and analysis for the official control of the levels of lead,cadmium, mercury, inorganic tin, 3-MCPD and benzo(a)pyrene infoodstuffs
Drabova L, Pulkrabova J, Kalachova K, Tomaniova M, Kocourek V,Hajslova J (2012) Rapid determination of polycyclic aromatic
hydrocarbons (PAHs) in tea using two-dimensional gas chromatogra-phy coupled with time of flight mass spectrometry. Talanta 100:207–216
Forsberg ND, Wilson GR, Anderson KA (2011) Determination of parentand substituted polycyclic aromatic hydrocarbons in high-fat salmonusing a modified QuEChERS extraction, dispersive SPE and GC-MS. J Agric Food Chem 59:8108–8116
Gratz SR, Ciolino LA, Mohrhaus AS, Gamble BM, Gracie JM, JacksonDS, Roetting JP, McCauley HA, Heitkemper DT, Fricke FL, KrolWJ, Arsenault TL, White JC, Flottmeyer MM, Johnson YS (2011)Screening and determination of polycyclic aromatic hydrocarbons inseafoods using QuEChERS-based extraction and high-performanceliquid chromatography with fluorescence detection. J AOAC Int94:1601–1616
Grover IS, Singh S, Pal B (2013) Priority PAHs in orthodox black teaduring manufacturing process. Environ Monit Assess 185:6291–6294
Kalachova K, Pulkrabova J, Drabova L, Cajka T, Kocourek V, Hajslova J(2011) Simplified and rapid determination of polychlorinated biphe-nyls, polybrominated diphenyl ethers, and polycyclic aromatic hy-drocarbons in fish and shrimps integrated into a single method. AnalChim Acta 707:84–91
X-Ya L, Na L, H-Db L, L-Ra L, Z-Xa Z, Y-Zb J, Y-Qa L (2011) A novelsynchronous fluorescence spectroscopic approach for the rapid de-termination of three polycyclic aromatic hydrocarbons in tea withsimple microwave-assisted pretreatment of sample. J Agric FoodChem 11:5899–5905
Lin D, Tu Y, Lizhong Zhu L (2005) Concentrations and health risk ofpolycyclic aromatic hydrocarbons in tea. Food Chem Toxicol43:41–48
Pule BO, Mmualefe LC, Torto N (2012) Analysis of polycyclic aromatichydrocarbons in soil with Agilent bond elut HPLC-FLD. Agilentapplication note 5990–5452 EN
Ramalhosa JM, Paíga P, Morais S, Delerue-Matos C, Oliveira MBPP(2009) Analysis of polycyclic aromatic hydrocarbons in fish: eval-uation of a quick, easy, cheap, effective, rugged, and safe extractionmethod. J Sep Sci 32:3529–3538
Sadowska-Rociek A, Surma M, Cieślik E (2013) Application ofQuEChERS method for simultaneous determination of pesticideresidues and PAHs in fresh herbs. Bull Environ Contam Toxicol4:508–513
Scientific Committee on Food (2002) Opinion of the Scientific Commit-tee on Food on the risks to human health of polycyclic aromatichydrocarbons in food. http://europa.eu.int/comm/food/fs/sc/scf/index_en.html. Accessed 23 May 2013
Singh S, Vashishth A, Vishal (2011) PAHs in some brands of tea. EnvironMonit Assess 177:35–38
Smoker M, Tran K, Smith RE (2010) Determination of polycyclic aro-matic hydrocarbons (PAHs) in shrimp. J Agric Food Chem58:12101–12104
Ziegenhals K, Jira W, Speer K (2008) Polycyclic aromatic hydro-carbons (PAH) in various types of tea. Eur Food Res Technol228:83–91
Zuin VG,Montero L, Bauer C, Popp P (2005) Stir bar sorptive extractionand high-performance liquid chromatography–fluorescence detec-tion for the determination of polycyclic aromatic hydrocarbons inmate teas. J Chromatogr A 1091:2–10
1338 Environ Sci Pollut Res (2014) 21:1326–1338


![QuEChERS Methodology: AOAC Method · 2 Multiresidue QuEChERS Procedure The procedures below are based on AOAC Official 2007.01 Method [4]. For complete information, refer to the original](https://img.pdfslide.us/doc/110x75/5c4609ab93f3c323b1793fd1/quechers-methodology-aoac-method-2-multiresidue-quechers-procedure-the-procedures.jpg)