Embed Size (px)
Citation preview

234
COMPARISON OF COFFEE SPECIES BY SENSORY PANEL AND ELECTRONIC NOSE
Vladimir Vietoris*1, Peter Zajác
2, Jozef Čapla
2, Andrea Mendelová
1, Kamila Križanová
2, Lucia Benešová
2
Address(es): Vladimir Vietoris, PhD., 1Slovak University of Agriculture, Faculty of Biotechnology and Food Science, Department of Storage and Procesing Plant Products, Trieda Andreja Hlinku 2, 94976 Nitra, Slovakia. 2Slovak University of Agriculture, Faculty of Biotechnology and Food Science, Department of Food Hygiene and Safety, Trieda Andreja Hlinku 2, 94976, Nitra,
Slovakia.
*Corresponding author: [email protected]
ABSTRACT
Keywords: Sensory analysis, temporal dominance of sensations, volatile compounds, coffee origin
INTRODUCTION
Name of a coffee is derived from the Latin designations of plant species Coffea.
It is of plant group Rubiaceae, which includes over 6000 species. An overwhelming majority of them are tropical shrubs and trees (Thorn, 2000).
Coffee was classifiable between encouraging seasonings that contain
physiologically active substances, e.g., alkaloids, which encourage human organism (Krajčová, 2007). In the dry treatment, the fruits are first freed of
impurities by the operation of the wash in large tanks. Subsequently, the berries
extended into the concrete or stone floors and the mats and at regular intervals are mixed to prevent fermentation (Selmar, Bytof, Knopp, 2008). According to
Augustin (2003) during wet processing of coffee, pericarp is removed using
peeling machine and pericarp is torn off or crushed. Light weight, dried and unripe seeds are separated from matured and heavy seeds by water . In the
fermentation tanks proceeds with matured seed process is called fermentation.
Semi-wet method of processing coffee is popular mainly in Brazil. Fruits were cut from the upper shell in a water bath, but the fermentation of sugars and
separation of the pulp is already being dry and the sunny conditions (Tucek,
2009). On comparing varietal flavor attributes of coffee, it is possible to use various analytical methods. Mayer et al. (1999) analyzed the coffee aroma
profiles of different origin and indicated that not only the global area where
coffee is grown affects its flavor, but also different coffee plants, and conditions such as soil or climate in the period when the coffee grown affecting the coffee
aroma profile. Very common procedure for evaluation of coffee is application of
sensory analysis. Sensory analysis means food assessment by human senses, including downstream processing results of the human central nervous system
(Valentová, Panovská, Pokorný, 1999). TDS (temporal dominance of
sensations) method is a technique that allows the temporal sequence of the dominant sensory sensations during tasting samples. Currently, this method is
becoming the subject of increasingly greater interest in the sensory analysis
(Pineau et al., 2012). Instead TI (Time Intensity) method consists in measuring the intensity of perception of the character in a specified time (Meillon et al.,
2009). TDS method is suitable for the analysis of various kinds of foods and
allows evaluation of multiple sensory attributes such as flavor, aroma, and consistency. But it requires a certain knowledge needed to define the adequate
list of characters on this relatively unusual method of evaluating the product. The
conditions for this method are slightly different from standard sensory
methodology. Evaluator is focusing on taste attribute domination and marks it by
clicking on the list of the attributes (Pineau et al., 2009). Lenfant et al. (2009)
reported that using the TDS method is possible for each food item assembled
perceived chronological sequence of processes that run orally at its mechanical processing. Taste and odor attribute is complex so it is very effective to measure
volatile compounds of coffee by reference instrumental method. Electronic nose
contains about 5-100 chemical sensors (depend on construction), which can be exchanged manually, because determine the substance which we determine using
an electric nose. Electronic nose can not only detect odors and flavor, but also to
identify them. Detectors comprise 32 chips and more sensors (Stetter, Penrose,
Yao, 2003). The electronic nose consists of a multisensor array, information unit
for processing, such as artificial neural networks (ANN) with digital software
algorithms for pattern recognition and a database (Wilson, Baietto, 2009). It is constructed so as to be able to recognize, analyze and identify the volatile
compounds even in very small concentrations. Technology is based on absorption
and desorption of volatile compounds, as demonstrated by specific changes in electrical resistance measured according to each one of the sensors in contact
with different fragrances and odor (Stetter, Penrose, Yao, 2003). Instrument is
very sensitive to capture small concentrations of chemical compounds even food additives (Khodaeva et al., 2013).
MATERIAL AND METHODS
Sample preparation
During analysis seven varieties of coffee (Brazil Cerrado Dulce NY 2 17/18,
Honduras SHG Marcal Maresol, India Plantation A Bababudan, Cuba Serrano
Superior Lavado, India Washed Robusta Parchment Peaberry, Honduras SHG Ocotepeque - Aposento Alto, Ethiopia Yirga Washed), provided by ORO Café
Zvolen, Slovakia, were used. The samples were prepared directly before analysis
in the preparation room of sensory laboratory using an electric espresso machine (Rancilio, Italy) and the mill (Rancilio, Italy). Samples were freshly served for
each assessor in the ratio of 7 g of coffee per 100 ml of water 1 minute after
preparation. Samples of coffee were served in randomized and balanced order. Between servings of samples pure non-carbonated water was provided to
assessors to neutralize taste.
The objective of a comparative study was to investigate the relationship between the sensory assessment of the varietal coffee samples
and their aromatic profile measured using an electronic nose. Sensory analysis plays a very important role in the evaluation of food
especially in the evaluation of plant products (coffee included). Sensory assessor's role is to assess the taste, smell, texture and visual
attributes of the product. Equally useful in the objective evaluation of foods and their flavor profile appears to be an electronic nose. The
study showed that there is a difference in a flavored coffee varietal profile. This study was performed using techniques TDS for 15
seconds by naïve panel. Most of the coffee samples appeared bitter with sour aftertaste. Flavors of coffee are also often linked with its
taste. The aim of measuring the electronic nose was thus instrumental to detect similarities between the seventh varietal coffees. The
results showed that the similarity between human measurement panel and substantiating the electronic nose. Data were reduced using
PCA techniques and most of the samples correspond to the same position at both assays.
ARTICLE INFO
Received 6. 7. 2015
Revised 2. 9. 2015
Accepted 20. 9. 2015
Published 1. 12. 2015
Regular article
doi: 10.15414/jmbfs.20115/16.5.3.234-237
J Microbiol Biotech Food Sci / Vietoris et al. 2015/16 : 5 (3) 234-237
235
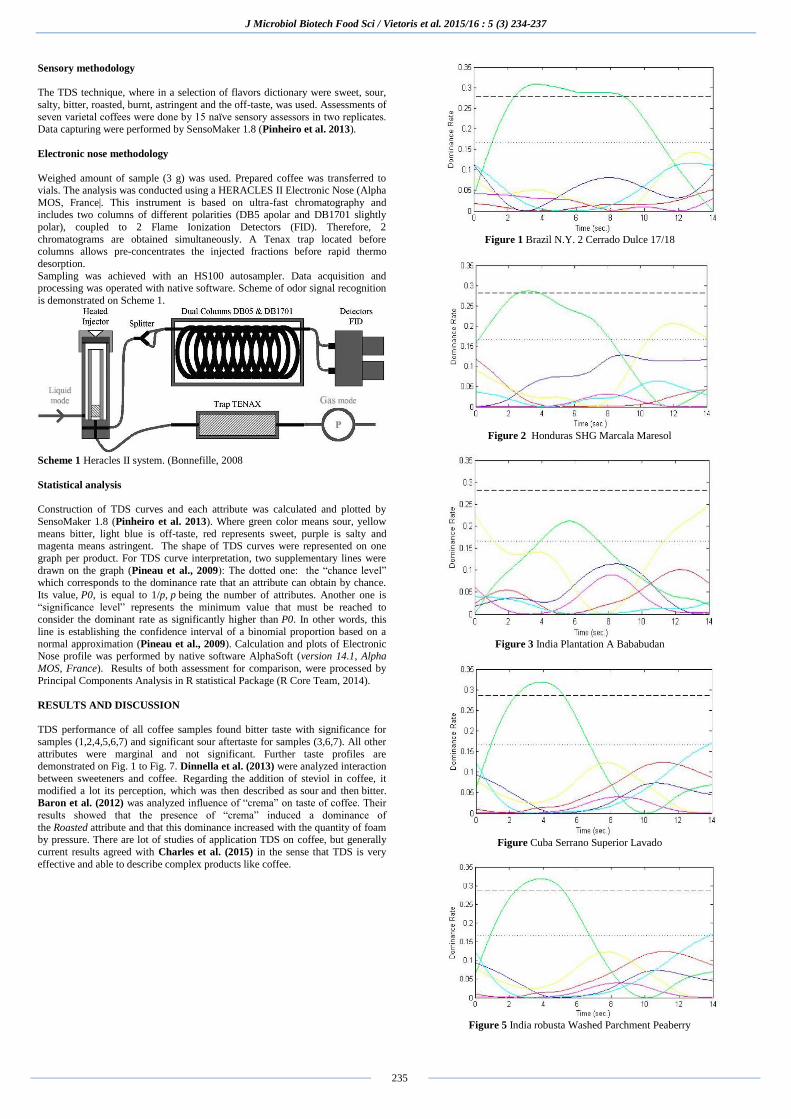
Sensory methodology
The TDS technique, where in a selection of flavors dictionary were sweet, sour,
salty, bitter, roasted, burnt, astringent and the off-taste, was used. Assessments of
seven varietal coffees were done by 15 naïve sensory assessors in two replicates.
Data capturing were performed by SensoMaker 1.8 (Pinheiro et al. 2013).
Electronic nose methodology
Weighed amount of sample (3 g) was used. Prepared coffee was transferred to vials. The analysis was conducted using a HERACLES II Electronic Nose (Alpha
MOS, France|. This instrument is based on ultra-fast chromatography and includes two columns of different polarities (DB5 apolar and DB1701 slightly
polar), coupled to 2 Flame Ionization Detectors (FID). Therefore, 2
chromatograms are obtained simultaneously. A Tenax trap located before columns allows pre-concentrates the injected fractions before rapid thermo
desorption.
Sampling was achieved with an HS100 autosampler. Data acquisition and processing was operated with native software. Scheme of odor signal recognition
is demonstrated on Scheme 1.
Scheme 1 Heracles II system. (Bonnefille, 2008
Statistical analysis
Construction of TDS curves and each attribute was calculated and plotted by
SensoMaker 1.8 (Pinheiro et al. 2013). Where green color means sour, yellow
means bitter, light blue is off-taste, red represents sweet, purple is salty and magenta means astringent. The shape of TDS curves were represented on one
graph per product. For TDS curve interpretation, two supplementary lines were
drawn on the graph (Pineau et al., 2009): The dotted one: the “chance level” which corresponds to the dominance rate that an attribute can obtain by chance.
Its value, P0, is equal to 1/p, p being the number of attributes. Another one is
“significance level” represents the minimum value that must be reached to
consider the dominant rate as significantly higher than P0. In other words, this
line is establishing the confidence interval of a binomial proportion based on a
normal approximation (Pineau et al., 2009). Calculation and plots of Electronic Nose profile was performed by native software AlphaSoft (version 14.1, Alpha
MOS, France). Results of both assessment for comparison, were processed by
Principal Components Analysis in R statistical Package (R Core Team, 2014).
RESULTS AND DISCUSSION
TDS performance of all coffee samples found bitter taste with significance for
samples (1,2,4,5,6,7) and significant sour aftertaste for samples (3,6,7). All other
attributes were marginal and not significant. Further taste profiles are demonstrated on Fig. 1 to Fig. 7. Dinnella et al. (2013) were analyzed interaction
between sweeteners and coffee. Regarding the addition of steviol in coffee, it
modified a lot its perception, which was then described as sour and then bitter. Baron et al. (2012) was analyzed influence of “crema” on taste of coffee. Their
results showed that the presence of “crema” induced a dominance of
the Roasted attribute and that this dominance increased with the quantity of foam by pressure. There are lot of studies of application TDS on coffee, but generally
current results agreed with Charles et al. (2015) in the sense that TDS is very
effective and able to describe complex products like coffee.
Figure 1 Brazil N.Y. 2 Cerrado Dulce 17/18
Figure 2 Honduras SHG Marcala Maresol
Figure 3 India Plantation A Bababudan
Figure Cuba Serrano Superior Lavado
Figure 5 India robusta Washed Parchment Peaberry

J Microbiol Biotech Food Sci / Vietoris et al. 2015/16 : 5 (3) 234-237
236
Figure 6 Honduras SHG Ocotepeque – Aposento Alto
Figure 7 Ethiopia Washed Yirga
Coffee has commercial and economic importance and human factor is still
essential during coffee processing. But, it is very difficult to discriminate the
quality of adulterated coffee using human sensory panels and gas measurement
system (Kottawa-Arachchi et al., 2012). Electronic noses have been designed to
quantify the discrimination of aromas and have also been fine-tuned by altering
the sensor materials (Wang et al., 2012) and data classification systems (Shi et
al., 2012), which are employed in the electronic nose.
Some examples of analyzed odor profiles by electronic nose are shown on fig.8
to fig.10. Dataset of each coffee sample measured by electronic nose were sorted by discrimination power then revised and similarities of samples were processed
by PCA. Position of the samples is shown on fig. 12.
Figure 8 Brazil N.Y. 2 Cerrado Dulce 17/18
Figure 9 India robusta Washed Parchment Peaberry
Figure 10 Honduras SHG Ocotepeque
Samples positions
For overall similarity projection, the technique of PCA was used. Both maps
showed similarities among the samples. The resulting graph (Fig. 11) confirmed similarity in following pairs of coffee. Coffee sample no. 2 (Honduras SHG
Marcal Maresol) ) with coffee sample no. 4 (Cuba Serrano Superior Lavado)
coffee sample no. 5 (India robusta Washed Parchment Peaberry) with coffee sample no. 6 (SHG Honduras Ocotepeque - Aposento Alto). Rest of sample
group (coffee, no. 1 (NY2 Brazil Cerrado Dulce 17/18) and no. 7 (Ethiopia
washed Yirga), coffee no. 3 (India Plantation Bababudan)) performed slightly different. Results of electronic nose are shown on fig. 12 and confirming pair of
samples analyzed by sensory panel.

J Microbiol Biotech Food Sci / Vietoris et al. 2015/16 : 5 (3) 234-237
237
Figure 11 PCA position of all samples by sensory analysis
Figure 12 PCA position of all samples by electronic nose
CONCLUSION
Performance of all coffee varieties perception was bitter and sour aftertaste on
different levels. TDS technique is possible to recognize difference in time sequence easily and it is helpful technique for analysis complex food like coffee.
Electronic nose measurements shown similar position of all samples after
reduction of data and plotting to 2-dimensional space of PCA map. Instrumental measurements supported by human panel should be promising way to analyze
interaction between chemical compounds and taste perception of food in time.
Acknowledgments: The work was supported by ITMS 26220220180 project -
Building of Agrobiotech Research Centre.
REFERENCES
AUGUSTIN, J. (2003). Povídání o kávě. Fontána, Olomouc.
BARRON, D., PINEAU, N., MATTHEY-DORET, W., ALI, S., SUDRE, J.,
GERMAIN, J. C., ... & FOLMER, B. (2012). Impact of crema on the aroma release and the in-mouth sensory perception of espresso coffee. Food &
function, 3(9), 923-930. http://dx.doi.org/10.1039/c2fo30046j
BONNEFILLE, M. (2008). Finding Analytical Solutions in the Laboratory Using an Electronic Nose. American laboratory, 40(4).
CHARLES, M., ROMANO, A., YENER, S., BARNABÀ, M., NAVARINI, L.,
MÄRK, T. D., ... & GASPERI, F. (2015). Understanding flavour perception of espresso coffee by the combination of a dynamic sensory method and in-vivo
nosespace analysis.Food Research International, 69, 9-20.,
http://dx.doi.org/10.1016/j.foodres.2014.11.036
DINNELLA, C., MASI, C., NAES, T., & MONTELEONE, E. (2013). A new
approach in TDS data analysis: A case study on sweetened coffee. Food quality
and preference, 30(1), 33-46. http://dx.doi.org/10.1016/j.foodqual.2013.04.006
KRAJČOVÁ, J. Zbožíznalství. Praha: VŠH, 2007. 258 s. ISBN 978-80-86578-
68-2.
KHODJAEVA, U., BOJNANSKA, T., VIETORIS, V., SYTAR, O., & SINGH, R. (2013). About food additives as important part of Functional Food. J. of
Microbial. Biotech and Food Sci, 9, 2227-2237.
KOTTAWA-ARACHCHI, J. D., GUNASEKARE, M. T. K., RANATUNGA, M.
A. B., JAYASINGHE, L., & KARUNAGODA, R. P. (2011). Analysis of
selected biochemical constituents in black tea (Camellia sinensis) for predicting
the quality of tea germplasm in Sri Lanka. Tropical Agricultural Research, 23(1), 30-41.http://dx.doi.org/10.4038/tar.v23i1.4629
KRIŽANOVÁ, K. (2015). Komparatívna Štúdia Rozdielnosti Odrodových Káv
Meraných Rôznymi Analytickými Technikami : diplomová práca. Nitra : SPU. 62 s.
LENFANT, F., LORET, C., PINEAU, N., HARTMANN, C., & MARTIN, N. (2009). Perception of oral food breakdown. The concept of sensory
trajectory. Appetite,52(3), 659-667.
http://dx.doi.org/10.1016/j.appet.2009.03.003
MAYER, F., CZERNY, M., & GROSCH, W. (1999). Influence of provenance
and roast degree on the composition of potent odorants in Arabica
coffees. European Food Research and Technology, 209(3-4), 242-250.
http://dx.doi.org/10.1007/s002170050487 MARHOLD, K., SUDA, J. (2008). Štatistické spracovanie mnohorozmerných dát
v taxonómii (Fenetické metódy). Bratislava : Faunima. 140 s. ISBN 978-80-969629-2-1.
MEILLON, S., URBANO, C., & SCHLICH, P. (2009). Contribution of the
Temporal Dominance of Sensations (TDS) method to the sensory description of subtle differences in partially dealcoholized red wines. Food Quality and
Preference,20(7), 490-499. http://dx.doi.org/10.1016/j.foodqual.2009.04.006
PINEAU, N., SCHLICH, P., CORDELLE, S., MATHONNIÈRE, C., ISSANCHOU, S., IMBERT, A., ... & KÖSTER, E. (2009). Temporal Dominance
of Sensations: Construction of the TDS curves and comparison with time–
intensity. Food Quality and Preference, 20(6), 450-455.
http://dx.doi.org/10.1016/j.foodqual.2009.04.005 PINEAU, N., DE BOUILLÉ, A. G., LEPAGE, M., LENFANT, F., SCHLICH,
P., MARTIN, N., & RYTZ, A. (2012). Temporal Dominance of Sensations: What is a good attribute list?. Food quality and preference, 26(2), 159-165.
http://dx.doi.org/10.1016/j.foodqual.2012.04.004 PINHEIRO, A. C. M., NUNES, C. A., & VIETORIS, V. (2013). SensoMaker: a tool for sensorial characterization of food products. Ciência e
Agrotecnologia, 37(3), 199-201. http://dx.doi.org/10.1590/S1413-
70542013000300001 TEAM, R. C. (2014). R: A language and environment for statistical computing. R
Foundation for Statistical Computing, Vienna, Austria, 2012.
SELMAR, D., BYTOF, G., & KNOPP, S. E. (2008). The storage of green coffee (Coffea arabica): decrease of viability and changes of potential aroma
precursors. Annals of botany, 101(1), 31-38.
http://dx.doi.org/10.1093/aob/mcm277
Shi, B., Zhao, L., Zhi, R., & Xi, X. (2013). Optimization of electronic nose
sensor array by genetic algorithms in Xihu-Longjing Tea quality
analysis.Mathematical and Computer Modelling, 58(3), 752-758.
http://dx.doi.org/10.1016/j.mcm.2012.12.029 STETTER, J. R., PENROSE, W. R., & YAO, S. (2003). Sensors, chemical
sensors, electrochemical sensors, and ECS. Journal of The Electrochemical Society,150(2), S11-S16. http://dx.doi.org/10.1149/1.1539051
THORN, J. (2000). Káva: příručka pro labužníky. Fortuna Print.
TUČEK, J. (2009). Vliv zpracování na chuť kávy. Beverge&Gastro, (7-8), s54 POKORNÝ, J., VALENTOVÁ, H., & PANOVSKÁ, Z. Sensorická analýza
potravin. 1. vyd. Praha: Vysoká škola chemicko-technologická v Praze, 1999. 95
s. ISBN 80-7080-329-0. WANG, G., HE, X., ZHOU, F., LI, Z., FANG, B., ZHANG, X., & WANG, L.
(2012). Application of gold nanoparticles/TiO 2 modified electrode for the
electrooxidative determination of catechol in tea samples. Food chemistry,135(2), 446-451 http://dx.doi.org/10.1016/j.foodchem.2012.04.139