Embed Size (px)
Citation preview

Comparison of CO2 to R-134a in Calibrating
Nephelometers by Adam Petrusky
12/7/2006
(c) 2002 Puget Sound Clean Air Agency 11
Working together for clean airWorking together for clean air
Comparison of CO2
to R-134a in
Calibrating
Nephelometers
Comparison of CO2
to R-134a in
Calibrating
Nephelometers
Puget Sound Clean Air Agency
Adam Petrusky
Puget Sound Clean Air Agency
Adam Petrusky

Comparison of CO2 to R-134a in Calibrating
Nephelometers by Adam Petrusky
12/7/2006
(c) 2002 Puget Sound Clean Air Agency 2
OverviewOverview
�PSCAA operates 18 Nephelometers
� 16 Radiance Research
� 2 Ecotech
�Washington Department of Ecology requires the use of R-134a for calibrations
�To mitigate the fiscal and environmental impacts of our nephelometer network we investigated the significance of switching to CO2.
�PSCAA operates 18 Nephelometers
� 16 Radiance Research
� 2 Ecotech
�Washington Department of Ecology requires the use of R-134a for calibrations
�To mitigate the fiscal and environmental impacts of our nephelometer network we investigated the significance of switching to CO2.

Comparison of CO2 to R-134a in Calibrating
Nephelometers by Adam Petrusky
12/7/2006
(c) 2002 Puget Sound Clean Air Agency 3
Why CO2Why CO2
�CO2 is an attractive alternative because:
�Global Warming Potential1 (GWP) for R-134a is 1300 times stronger than CO2
�R-134a is 7 times more expensive than CO2
�R-134a costs $182 per Neph per year
�CO2 costs $27 per Neph per year
�Savings of $155 per site with only $128 in hardware costs to switch to CO2
�PSCAA total network savings of $2480 per year
1Intergovernmental Panel on Climate Change Third Assessment Report (IPCC TAR), 2001, Direct GWPs, 6.12.2.
GWPs are an index for estimating relative global warming contribution due to
atmospheric emissions of 1kg of a particular greenhouse gas compared to 1kg of
CO2

Comparison of CO2 to R-134a in Calibrating
Nephelometers by Adam Petrusky
12/7/2006
(c) 2002 Puget Sound Clean Air Agency 4
Operating and Calibrating PrinciplesOperating and Calibrating Principles
�Measures particulate using a light beam and detector
� Light scattering is measured as back scattering (bscat)
�Bscat directly correlates to PM2.5
� Zero with particle free ambient air
�Span using a gas with a higher scattering coefficient than air
�Different gasses have different bscat values
�R-134a has a mid span value of 8.39x10⁻⁵ m-1 and CO2
is much lower at 2.13x10⁻⁵ m-1
A Nephelometer measures particulate by employing a light beam and a light
detector. As gas enters the sample chamber it scatters light. The light scattering
coefficient is measured as back scattering and directly correlates to PM2.5
without a size selective inlet.
The nephelometer is zeroed by filling the chamber with particle free air so
that the readings are proportional to light scattering by particles. The
span gas, which has a higher scattering coefficient than air, is used to
adjust the span so that the bscat data are directly correlated to
engineering units of ug/m3.
Span gasses are chosen based on their density. A higher density equates to a
higher bscat value.

Comparison of CO2 to R-134a in Calibrating
Nephelometers by Adam Petrusky
12/7/2006
(c) 2002 Puget Sound Clean Air Agency 5
Our ObjectiveOur Objective
�Can CO2 work as well as R-134a?
� If CO2 gives same results as R-134a, then success!
�DoE requires action at 5% out of spec and data invalidation at 7%
�Can CO2 work as well as R-134a?
� If CO2 gives same results as R-134a, then success!
�DoE requires action at 5% out of spec and data invalidation at 7%

Comparison of CO2 to R-134a in Calibrating
Nephelometers by Adam Petrusky
12/7/2006
(c) 2002 Puget Sound Clean Air Agency 6
The Method DesignThe Method Design
� Lab tests were performed on a Radiance Research Nephelometer
� The nephelometer was tested at 5 different Set Spans over at least 24 hour periods for over a month.
� The properly calibrated neph: R-134a gives a value of 8.39 e-5. CO2 gives 2.13 e-5.
� The high action level (5%) neph
� The low action level (5%) neph
� The out of spec high (7%) neph
� The out of spec low (7%) neph
� At each Set Span, the span of CO2 and R134a were both monitored and recorded
� The zero was also measured every day of the test
� At least 30 data points at each Set Span were recorded
In order to determine if there was a linear relationship

Comparison of CO2 to R-134a in Calibrating
Nephelometers by Adam Petrusky
12/7/2006
(c) 2002 Puget Sound Clean Air Agency 7
Measures of PerformanceMeasures of Performance
� CO2 to predicts, with accuracy, the same decision points as the R-134a calibration gas
� Minimize false positives and negatives
� The properly calibrated neph, the out of spec high (7%) neph and the out of spec low (7%) neph have low tolerance for errors
�Error rate less than 5%
� The high action level (5%) neph and the low action level (5%) neph are in a calibration state that is borderline without an obvious answer
false positives concluding that a recalibration would be necessary with CO2 that R-
134a does not predict

Comparison of CO2 to R-134a in Calibrating
Nephelometers by Adam Petrusky
12/7/2006
(c) 2002 Puget Sound Clean Air Agency 8
R134a Spans at 5 Set SpansR134a Spans at 5 Set Spans
R134a Spans (n = 30) at 5 Set Spans (05/12/06 - 06/27/06)
7.45
7.65
7.85
8.05
8.25
8.45
8.65
8.85
9.05
9.25
9.45
7.45 7.65 7.85 8.05 8.25 8.45 8.65 8.85 9.05 9.25 9.45
Theoretical Span (10-5 m
-1)
Actual Span (10-5 m-1)
5% from Theoretical Span of 8.39 x 10⁻⁵ m
-1
7% from Theoretical Span of 8.39 x 10⁻⁵ m
-1
7% High
5% High
5% Low
7% Low
Correctly Calibrated

Comparison of CO2 to R-134a in Calibrating
Nephelometers by Adam Petrusky
12/7/2006
(c) 2002 Puget Sound Clean Air Agency 9
CO2 Spans at 5 Set SpansCO2 Spans at 5 Set Spans
CO2 Spans (n = 30) at 5 Set Spans (05/12/06 - 06/27/06)
1.85
1.90
1.95
2.00
2.05
2.10
2.15
2.20
2.25
2.30
2.35
2.40
1.85 1.90 1.95 2.00 2.05 2.10 2.15 2.20 2.25 2.30 2.35 2.40 2.45
Theoretical Span (10-5 m-1)
Actual Span (10-5 m-1)
5% from Theoretical Span of 2.13 x 10⁻⁵ m
-1
7% from Theoretical Span of 2.13 x 10⁻⁵ m
-1
7% High
5% High
5% Low
7% Low
Correctly Calibrated
Comparison of CO2 to R-134a in Calibrating
Nephelometers by Adam Petrusky
12/7/2006
(c) 2002 Puget Sound Clean Air Agency 10
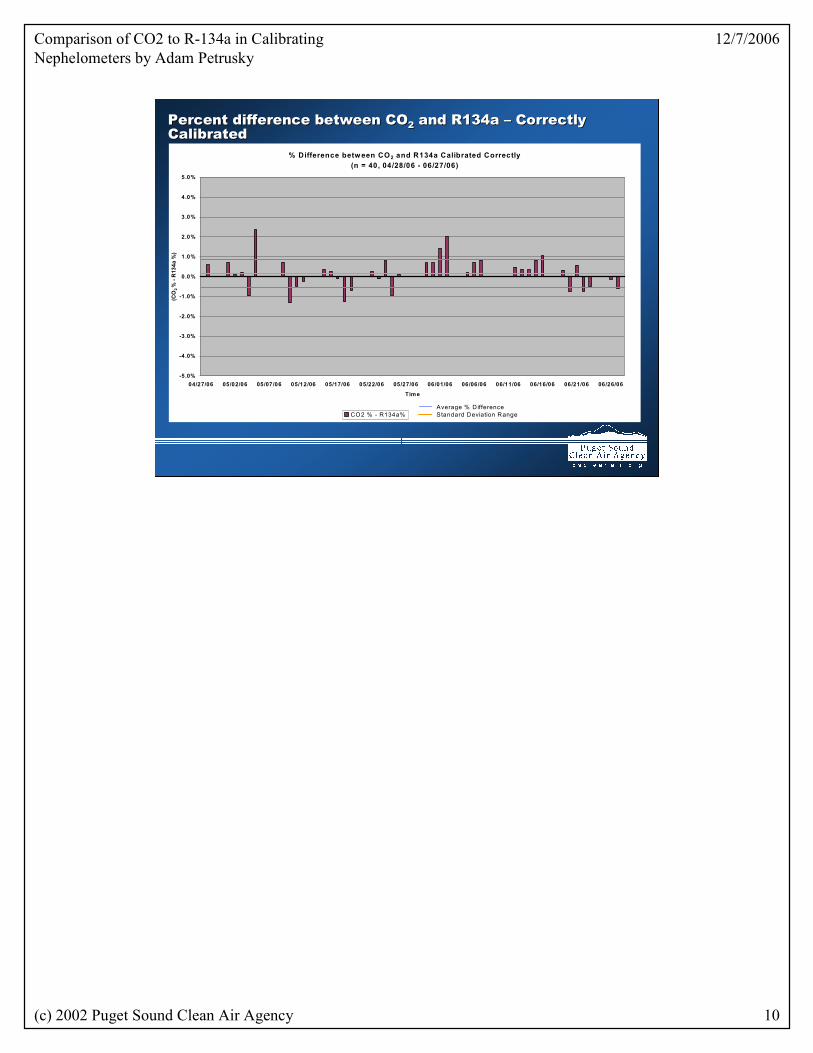
Percent difference between CO2 and R134a – Correctly CalibratedPercent difference between CO2 and R134a – Correctly Calibrated
% Difference between CO 2 and R134a Calibrated Correctly
(n = 40, 04/28/06 - 06/27/06)
-5.0%
-4.0%
-3.0%
-2.0%
-1.0%
0.0%
1.0%
2.0%
3.0%
4.0%
5.0%
04/27/06 05/02/06 05/07/06 05/12/06 05/17/06 05/22/06 05/27/06 06/01/06 06/06/06 06/11/06 06/16/06 06/21/06 06/26/06
Time
(CO2 % - R134a %)
CO2 % - R134a%
Average % D ifference
Standard Deviation Range

Comparison of CO2 to R-134a in Calibrating
Nephelometers by Adam Petrusky
12/7/2006
(c) 2002 Puget Sound Clean Air Agency 11
Percent difference between CO2 and R134a – Calibrated near High Failing LevelPercent difference between CO2 and R134a – Calibrated near High Failing Level
(CO 2% - R134a%) w ith an Artificially High Calibration near 7% of the Theoretical Span (Failure Level)
(n = 30, 05/12/06 - 06/27/06)
-5.0%
-4.0%
-3.0%
-2.0%
-1.0%
0.0%
1.0%
2.0%
3.0%
4.0%
5.0%
05/11/06 05/16/06 05/21/06 05/26/06 05/31/06 06/05/06 06/10/06 06/15/06 06/20/06 06/25/06
Time
(CO2 % - R134a %)
CO2 % - R134a%
Average % D ifference
Standard Deviation Range

Comparison of CO2 to R-134a in Calibrating
Nephelometers by Adam Petrusky
12/7/2006
(c) 2002 Puget Sound Clean Air Agency 12
Percent difference between CO2 and R134a – Calibrated near Low Failing LevelPercent difference between CO2 and R134a – Calibrated near Low Failing Level
(CO2% - R134a%) w ith an Artificially Low Calibration near 7% of the Theoretical Span (Failure Level)
(n = 30, 05/12/06 - 06/27/06)
-5.0%
-4.0%
-3.0%
-2.0%
-1.0%
0.0%
1.0%
2.0%
3.0%
4.0%
5.0%
05/11/06 05/16/06 05/21/06 05/26/06 05/31/06 06/05/06 06/10/06 06/15/06 06/20/06 06/25/06
Time
(CO2 % - R134a %)
CO2 % - R134a%
Average % Difference
Standard Deviation Range

Comparison of CO2 to R-134a in Calibrating
Nephelometers by Adam Petrusky
12/7/2006
(c) 2002 Puget Sound Clean Air Agency 13
Percent difference between CO2 and R134a – Calibrated near High Action LevelPercent difference between CO2 and R134a – Calibrated near High Action Level
(CO2% - R134a%) w ith an Artificially High Calibration near 5% of the Theoretical Span (Action Level)
(n = 30, 05/12/06 - 06/27/06)
-5.0%
-4.0%
-3.0%
-2.0%
-1.0%
0.0%
1.0%
2.0%
3.0%
4.0%
5.0%
05/11/06 05/16/06 05/21/06 05/26/06 05/31/06 06/05/06 06/10/06 06/15/06 06/20/06 06/25/06
Time
(CO2 % - R134a %)
CO2 % - R134a%
Average % Difference
Standard Devia tion Range

Comparison of CO2 to R-134a in Calibrating
Nephelometers by Adam Petrusky
12/7/2006
(c) 2002 Puget Sound Clean Air Agency 14
Percent difference between CO2 and R134a – Calibrated near Low Action LevelPercent difference between CO2 and R134a – Calibrated near Low Action Level
(CO2% - R134a%) w ith an Artificially Low Calibration near 5% of the Theoretical Span (Action Level)
(n = 30, 05/12/06 - 06/27/06)
-5.0%
-4.0%
-3.0%
-2.0%
-1.0%
0.0%
1.0%
2.0%
3.0%
4.0%
5.0%
05/11/06 05/16/06 05/21/06 05/26/06 05/31/06 06/05/06 06/10/06 06/15/06 06/20/06 06/25/06
T ime
(CO2 % - R134a %)
CO2 % - R134a%
Average % D ifference
Standard Deviation Range
Comparison of CO2 to R-134a in Calibrating
Nephelometers by Adam Petrusky
12/7/2006
(c) 2002 Puget Sound Clean Air Agency 15
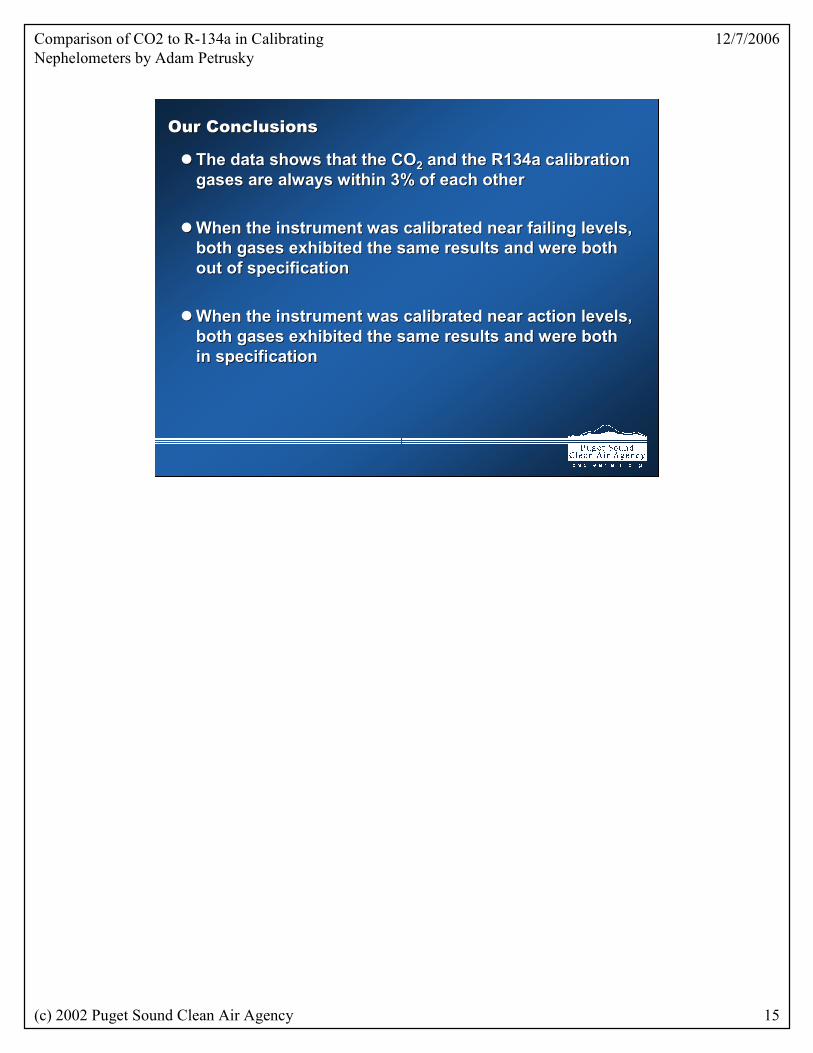
Our ConclusionsOur Conclusions
� The data shows that the CO2 and the R134a calibration gases are always within 3% of each other
�When the instrument was calibrated near failing levels, both gases exhibited the same results and were both out of specification
�When the instrument was calibrated near action levels, both gases exhibited the same results and were both in specification

Comparison of CO2 to R-134a in Calibrating
Nephelometers by Adam Petrusky
12/7/2006
(c) 2002 Puget Sound Clean Air Agency 16
Yet to Be DoneYet to Be Done
�Wood smoke vs. industrial emissions
� 2 nephs at a wood smoke site and 2 at a industrial site
�Are there variances in the high range in winter months?
�Wood smoke vs. industrial emissions
� 2 nephs at a wood smoke site and 2 at a industrial site
�Are there variances in the high range in winter months?

Comparison of CO2 to R-134a in Calibrating
Nephelometers by Adam Petrusky
12/7/2006
(c) 2002 Puget Sound Clean Air Agency 17
Lynnwood Collocated NephelometersLynnwood Collocated Nephelometers
Preliminary Field Results
Pre – Heating Season