Embed Size (px)
Citation preview
University of Northern Colorado University of Northern Colorado
Scholarship & Creative Works @ Digital UNC Scholarship & Creative Works @ Digital UNC
Capstones & Scholarly Projects Student Research
5-2019
Comparison of Automated Hearing Testing Approaches for Comparison of Automated Hearing Testing Approaches for
Outpatients Receiving Ototoxic Chemotherapy Outpatients Receiving Ototoxic Chemotherapy
Ashley Stumpf
Follow this and additional works at: https://digscholarship.unco.edu/capstones
Recommended Citation Recommended Citation Stumpf, Ashley, "Comparison of Automated Hearing Testing Approaches for Outpatients Receiving Ototoxic Chemotherapy" (2019). Capstones & Scholarly Projects. 50. https://digscholarship.unco.edu/capstones/50
This Text is brought to you for free and open access by the Student Research at Scholarship & Creative Works @ Digital UNC. It has been accepted for inclusion in Capstones & Scholarly Projects by an authorized administrator of Scholarship & Creative Works @ Digital UNC. For more information, please contact [email protected].

© 2019
ASHLEY STUMPF
ALL RIGHTS RESERVED
UNIVERSITY OF NORTHERN COLORADO
Greeley, Colorado
The Graduate School
COMPARISON OF AUTOMATED HEARING TESTING
APPROACHES FOR OUTPATIENTS RECEIVING
OTOTOXIC CHEMOTHERAPY
A Capstone Research Project Submitted in Partial Fulfillment
of the Requirements for the Degree of
Doctor of Audiology
Ashley Stumpf
College of Natural and Health Sciences
School of Audiology & Speech-Language Sciences
Audiology
May 2019
This Capstone Project by: Ashley Stumpf Entitled: Comparison of Automated Hearing Testing Approaches for Outpatients Receiving Ototoxic Chemotherapy has been approved as meeting the requirement for the Degree of Doctor of Audiology in the College of Natural and Health Sciences in the Department of Audiology and Speech-Language Sciences, Program of Audiology Accepted by the Capstone Research Committee
______________________________________________________ Deanna K. Meinke, Ph.D., Research Advisor
______________________________________________________ Jennifer E. Weber, Au.D., Committee Member
______________________________________________________ Kathryn Bright, Ph.D., Committee Member
Accepted by the Graduate School
__________________________________________________________ Linda L. Black, Ed.D.
Associate Provost and Dean Graduate School and International Admissions
Research and Sponsored Programs
iii
ABSTRACT
Stumpf, Ashley. Comparison of Automated Hearing Testing Approaches for Outpatients
Receiving Ototoxic Chemotherapy. Unpublished Doctor of Audiology Capstone
Research Project, University of Northern Colorado, 2019.
Detection of the highest audible frequency of hearing is used to monitor patients
undergoing chemotherapy for ototoxic effects of pharmaceuticals. The current study
evaluated the feasibility of utilizing Creare’s (2016) wireless attenuated hearing test
system (WAHTS) in two outpatient cancer treatment centers to administer automated
hearing tests for the identification of the highest audible frequency. Twenty cancer
patients being treated with carboplatin and cisplatin were recruited for hearing testing and
eight untrained nurses were recruited to operate the WAHTS. Ambient noise
measurements were taken in each treatment center before and after hearing testing and
supported the validity of threshold measurements. Listener participants completed two
automated hearing tests: conventional high-frequency audiometry typically used to
identify the sensitive region for ototoxicity (SRO) and a newly proposed fixed-level
frequency test (FLFT; Fausti et al., 1999; Rieke et al., 2017). The highest audible
frequency (HAF) identified by each test method was compared using a 2-tailed Wilcoxon
signed ranks test. The HAF identified by each hearing test method (automated high
frequency audiometry [AHFA] vs. FLFT) was not significantly different from each other.
The FLFT was completed much faster (24.78 minutes for the AHFA versus 2.4 minutes
for the FLFT). Administering the FLFT during outpatient cancer treatment therapy
iv
appeared to be a promising test method to potentially overcome current barriers in
ototoxicity monitoring. Future research should implement the WAHTS (Creare, 2016)
technology in a more diverse assortment of chemotherapy treatment centers with a larger
population of participants. Use of the FLFT and AHFA would need to be evaluated as
part of a clinical research study that would implement a full ototoxicity monitoring
program.
v
ACKNOWLEDGMENTS
I wish to express my sincere gratitude to my research advisors for their
continuous support throughout the process of my research. With their help, I have grown
as a scholar and have a newfound respect for research and its importance in all
professions.
This project would not have been possible without the help from the research staff
at the outpatient cancer centers. Their involvement in the completion of data collection
was vital. I have the deepest appreciation for all the work they put in on my project and
so many others in order to advance science.
I would also like to sincerely thank my family for their unending support
throughout my educational pursuits. Without their extra encouragement to go outside my
comfort zone, I would not have been able to take on such an in-depth project.
vi
TABLE OF CONTENTS
CHAPTER I. STATEMENT OF THE PROBLEM ...................................................... 1
CHAPTER II. REVIEW OF THE LITERATURE........................................................ 5
Introduction ........................................................................................................ 5
Auditory System Overview................................................................................ 6
Ototoxicity ......................................................................................................... 9
Chemotherapeutics ........................................................................................... 11
Position Statements on Ototoxicity .................................................................. 16
Ototoxicity Monitoring .................................................................................... 17
Challenges in Ototoxicity ................................................................................ 19
Hearing Testing ................................................................................................ 21
Recent Advances in Ototoxicity Monitoring ................................................... 30
The Value of Ototoxic Monitoring .................................................................. 33
Rationale for Study .......................................................................................... 36
CHAPTER III. METHODS ......................................................................................... 37
Participants ....................................................................................................... 37
Instrumentation ................................................................................................ 38
Data Analysis ................................................................................................... 41
CHAPTER IV. RESULTS ........................................................................................... 43
Test Environments ........................................................................................... 43
Participants ....................................................................................................... 45
Ambient Noise Levels...................................................................................... 47
Outcomes for Highest Audible Frequency ...................................................... 54
Survey Outcomes ............................................................................................. 63
Summary of Outcomes .................................................................................... 67
CHAPTER V. DISCUSSION ...................................................................................... 69
Ambient Noise ................................................................................................. 69
Technology Implementation ............................................................................ 71
Chemotherapy Patient Factors ......................................................................... 72
Implementing Fixed-Level Frequency Test and Automated High
Frequency Audiometry in Ototoxicity Monitoring .............................. 74
Potential to Increase Patient Access to Ototoxicity Monitoring ...................... 76
Strengths and Limitations ................................................................................ 77
vii
Future Research ............................................................................................... 78
Conclusions ...................................................................................................... 79
REFERENCES ............................................................................................................ 80
APPENDIX A. INSTITUTIONAL REVIEW BOARD APPROVAL ........................ 94
APPENDIX B. WIRELESS HEADSET SYSTEM SURVEY FOR OPERATORS .... 97
APPENDIX C. WIRELESS HEADSET SYSTEM SURVEY FOR LISTENERS ... 101
APPENDIX D. RECIPROCAL AGREEMENT ....................................................... 105
viii
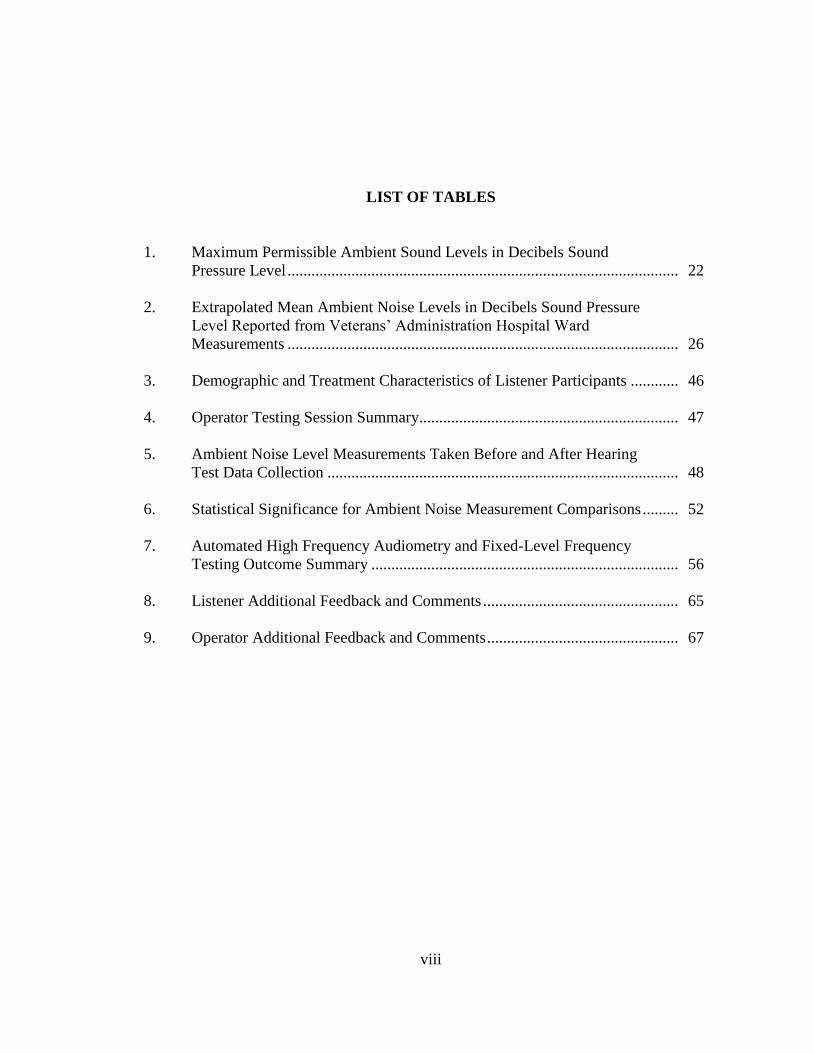
LIST OF TABLES
1. Maximum Permissible Ambient Sound Levels in Decibels Sound
Pressure Level .................................................................................................. 22
2. Extrapolated Mean Ambient Noise Levels in Decibels Sound Pressure
Level Reported from Veterans’ Administration Hospital Ward
Measurements .................................................................................................. 26
3. Demographic and Treatment Characteristics of Listener Participants ............ 46
4. Operator Testing Session Summary................................................................. 47
5. Ambient Noise Level Measurements Taken Before and After Hearing
Test Data Collection ........................................................................................ 48
6. Statistical Significance for Ambient Noise Measurement Comparisons ......... 52
7. Automated High Frequency Audiometry and Fixed-Level Frequency
Testing Outcome Summary ............................................................................. 56
8. Listener Additional Feedback and Comments ................................................. 65
9. Operator Additional Feedback and Comments ................................................ 67
ix
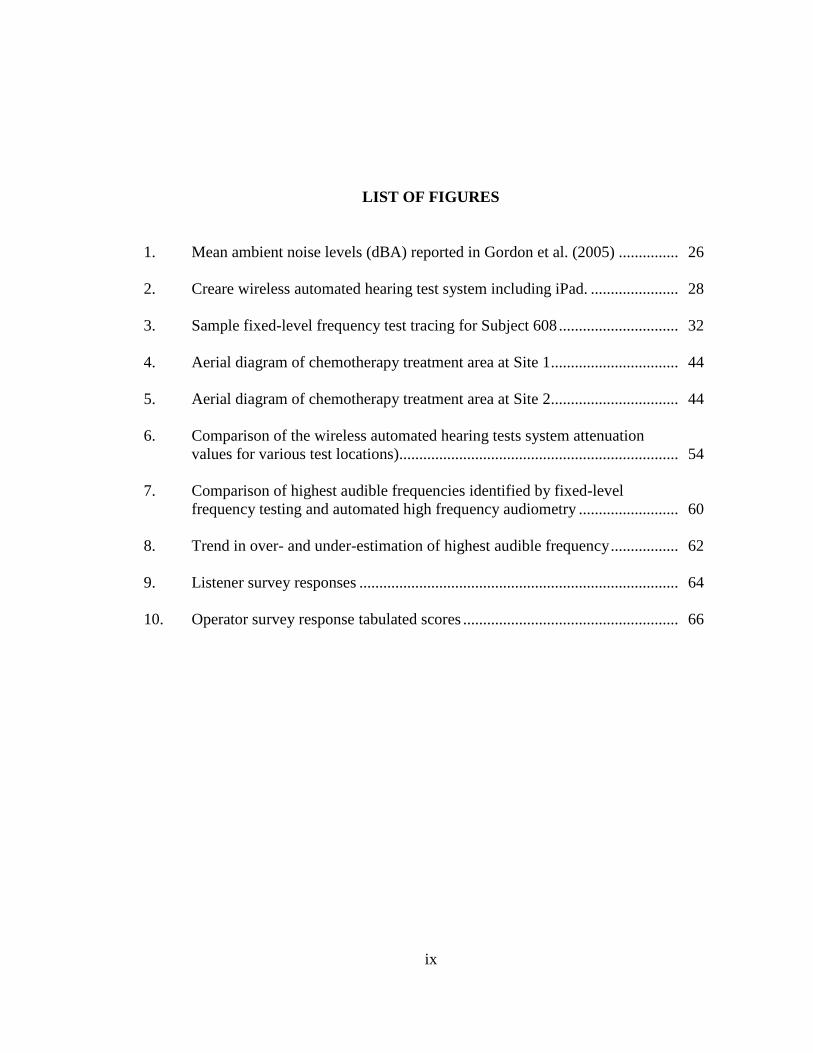
LIST OF FIGURES
1. Mean ambient noise levels (dBA) reported in Gordon et al. (2005) ............... 26
2. Creare wireless automated hearing test system including iPad. ...................... 28
3. Sample fixed-level frequency test tracing for Subject 608 .............................. 32
4. Aerial diagram of chemotherapy treatment area at Site 1 ................................ 44
5. Aerial diagram of chemotherapy treatment area at Site 2 ................................ 44
6. Comparison of the wireless automated hearing tests system attenuation
values for various test locations)...................................................................... 54
7. Comparison of highest audible frequencies identified by fixed-level
frequency testing and automated high frequency audiometry ......................... 60
8. Trend in over- and under-estimation of highest audible frequency ................. 62
9. Listener survey responses ................................................................................ 64
10. Operator survey response tabulated scores ...................................................... 66
x
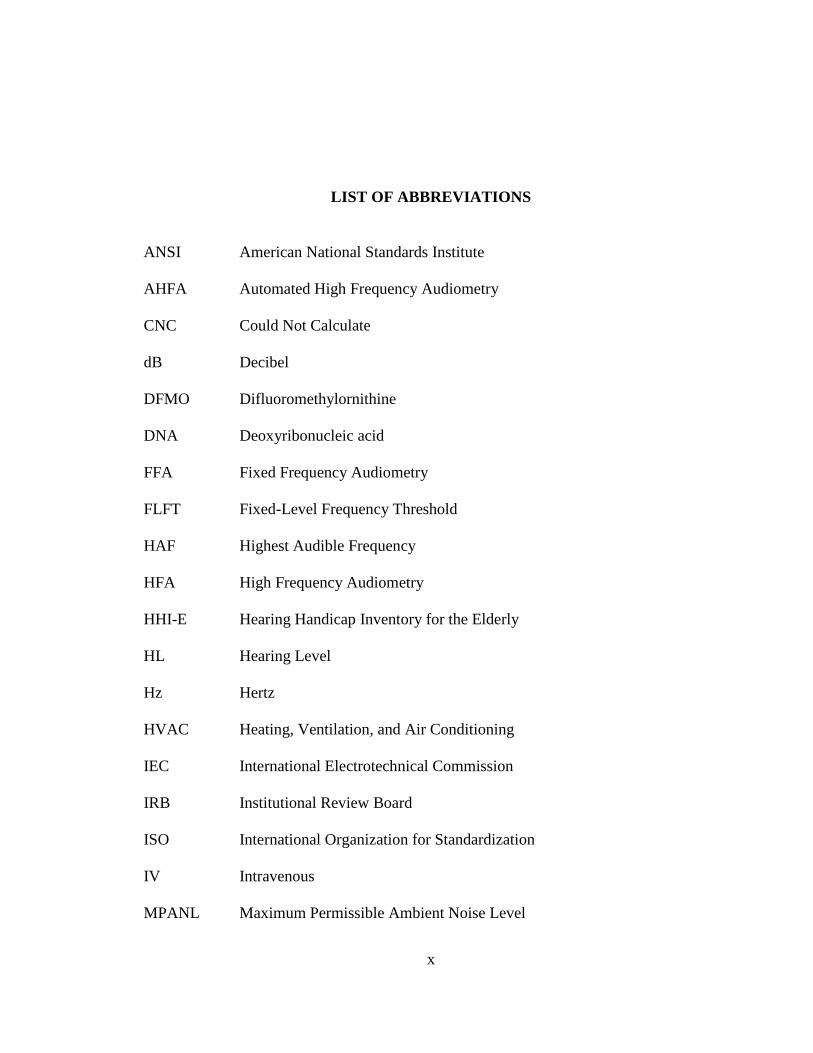
LIST OF ABBREVIATIONS
ANSI American National Standards Institute
AHFA Automated High Frequency Audiometry
CNC Could Not Calculate
dB Decibel
DFMO Difluoromethylornithine
DNA Deoxyribonucleic acid
FFA Fixed Frequency Audiometry
FLFT Fixed-Level Frequency Threshold
HAF Highest Audible Frequency
HFA High Frequency Audiometry
HHI-E Hearing Handicap Inventory for the Elderly
HL Hearing Level
Hz Hertz
HVAC Heating, Ventilation, and Air Conditioning
IEC International Electrotechnical Commission
IRB Institutional Review Board
ISO International Organization for Standardization
IV Intravenous
MPANL Maximum Permissible Ambient Noise Level
xi
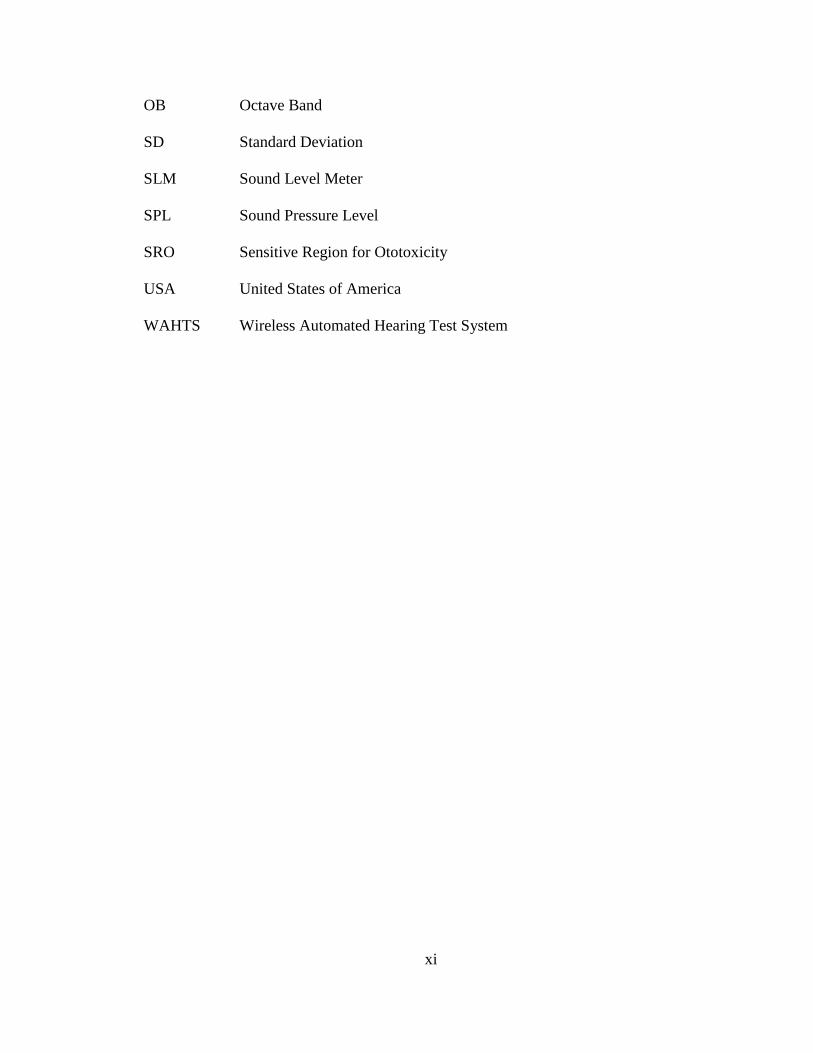
OB Octave Band
SD Standard Deviation
SLM Sound Level Meter
SPL Sound Pressure Level
SRO Sensitive Region for Ototoxicity
USA United States of America
WAHTS Wireless Automated Hearing Test System
1
CHAPTER I
STATEMENT OF THE PROBLEM
Ototoxic hearing loss can occur when drugs or chemicals negatively interact with
the structures in the auditory system, primarily in the cochlea. This interaction causes
damage that presents itself in the form of a hearing loss. Certain pharmaceuticals have
been documented to cause hearing loss. Commonly prescribed ototoxic pharmaceuticals
are aminoglycosides and platinum-based chemotherapeutics (Hawkins, 1976; Neuwelt et
al., 1998). Ototoxic hearing loss is a hearing loss that is potentially preventable with
early detection and intervention.
A high frequency hearing loss is most commonly associated with ototoxic
exposure, although not necessarily limited to that frequency alone. With increased
dosage and exposure, hearing loss is more likely to become more severe and affect lower
frequency hearing abilities (Kopelman, Budnick, Sessions, Kramer, & Wong, 1988).
When hearing loss begins to impact frequencies responsible for coding speech sounds,
patients report social isolation, depression, and a reduced quality of life (Arlinger, 2003).
Hearing loss has also been linked to cognitive decline in the elderly population (Lin et al.,
2013). Prevention or rehabilitation of hearing loss due to ototoxicity is becoming a
greater concern with the increased numbers of cancer survivors attributed to advances in
medicine.
2
The American Academy of Audiology (2009) recommended patients exposed to
ototoxic pharmaceuticals be monitored for ototoxicity. By monitoring for ototoxicity,
more severe hearing loss might be prevented by modification of treatment regimens
implemented by the physician. If changes in treatment cannot be made, the patient might
be referred for audiological intervention during the early stages of hearing loss. Several
approaches are accepted as effective ways of monitoring hearing changes but no matter
the method, early detection is key in preventing a more severe hearing loss.
One approach accepted by the American Academy of Audiology (2009) relies
upon high frequency audiometry. This testing evaluates hearing thresholds at the
frequency region most commonly affected by ototoxicity over time. When hearing
sensitivity decreases and meets certain criteria, an ototoxic shift in hearing is
documented. At this time, the physician can make an adjustment to treatment if
indicated. To reduce audiometric testing time, Fausti et al. (1999) determined a sensitive
region for ototoxicity (SRO) worthy of focus. The SRO approach monitors the highest
frequency where a patient can hear at 100 dB SPL and the six adjacent frequencies as
opposed to finding hearing thresholds at all frequencies from 250-20,000 Hz. This
shortens the test time and makes the monitoring potentially more cost efficient and
efficient. To calculate the SRO, baseline testing is obtained at all available test
frequencies. Moving forward, only the SRO is monitored.
Monitoring ceases to occur in many patients even though the implementation is
well documented along with the negative effects of hearing loss. The National
Comprehensive Cancer Network’s (2003) guidelines, which are commonly followed by
oncologists, do not suggest ototoxic monitoring, implying that many patients are not
3
receiving any audiologic treatment/management while receiving known ototoxic
pharmaceuticals. Possible reasons for why patients are not receiving audiologic services
are related to patient and physician factors. Patients are managing multiple appointments
and potentially have reduced physical well-being due to the severity of the disease.
Adding audiologic evaluations, which might add to the scheduling, transportation, and
cost burdens, might not be a healthcare priority for the patient. Physicians might be
unaware of the importance of preventing hearing loss and preserving their patient’s
communication abilities. Therefore, patients are either not being referred for audiologic
services or patients might be unable/unwilling to follow-up in a timely manner.
The purpose of the current study was to determine whether newly developed
wireless automated hearing test system (WAHTS; Creare Inc., 2016) would make it
possible for patients undergoing platinum-based cancer treatments to have their hearing
status evaluated at the time of their chemotherapeutic treatment session. The study also
aimed to compare two audiometric testing procedures in terms of outcomes and time
savings. The first method was based upon the SRO approach implemented with Békésy
(1947) method-of-adjustment threshold testing. The second, newer method uses a
Békésy-like approach to quickly determine the highest audible frequency by sweeping
pure-tones at 80 dB SPL; it is termed the fixed-level frequency test (FLFT).
Implementation of this new technology and test protocols might potentially eliminate the
need for patients to make multiple audiological appointments and coordinate schedules.
It might also reduce the test time for patients who are easily fatigued due to disease and
treatment demands. If the research protocol was successful, it might be possible for more
4
patients to receive audiologic monitoring and prevention or rehabilitation of hearing loss
due to ototoxicity.
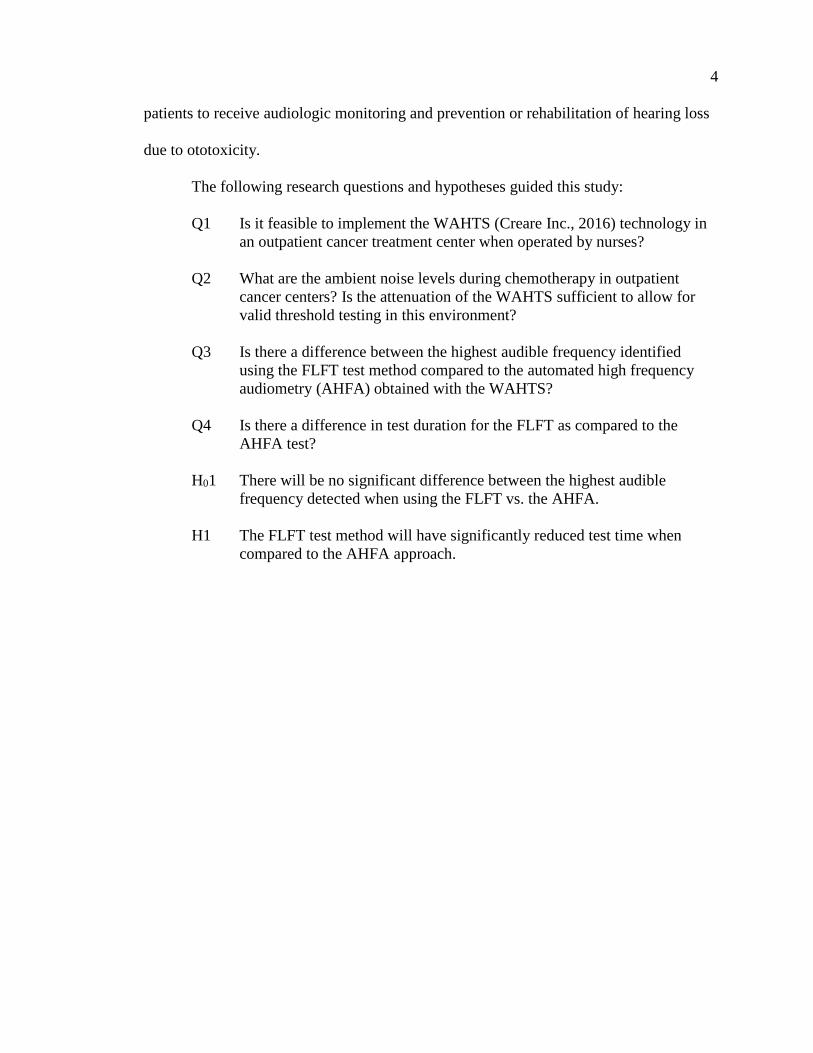
The following research questions and hypotheses guided this study:
Q1 Is it feasible to implement the WAHTS (Creare Inc., 2016) technology in
an outpatient cancer treatment center when operated by nurses?
Q2 What are the ambient noise levels during chemotherapy in outpatient
cancer centers? Is the attenuation of the WAHTS sufficient to allow for
valid threshold testing in this environment?
Q3 Is there a difference between the highest audible frequency identified
using the FLFT test method compared to the automated high frequency
audiometry (AHFA) obtained with the WAHTS?
Q4 Is there a difference in test duration for the FLFT as compared to the
AHFA test?
H01 There will be no significant difference between the highest audible
frequency detected when using the FLFT vs. the AHFA.
H1 The FLFT test method will have significantly reduced test time when
compared to the AHFA approach.
5
CHAPTER II
REVIEW OF THE LITERATURE
Introduction
Individuals diagnosed with cancer are often treated with chemotherapeutic drugs
to save or prolong their lives. When receiving these drugs, the body undergoes
physiologic changes that are not isolated to the area affected by cancer. The inner ear is
an area commonly affected by these drugs and the pharmaceuticals are classified as
ototoxic. When inner ear structures are damaged due to the drug, hearing loss might
occur, commonly in the high frequencies.
Hearing loss has been documented to cause social isolation, depression, and
reduce the quality of life of the person directly affected and also negatively impacts
communication partners (Arlinger, 2003). Hearing loss is also linked to cognitive decline
in the elderly population (Lin et al., 2013). Individuals receiving chemotherapeutics are
at an increased risk of hearing loss. Therefore, it is important to provide an early
detection and monitoring system to identify and track the progression of hearing loss.
Once a hearing loss is detected, physicians might have options to adjust the
administration or type of chemotherapy to help prevent further hearing loss. It is often a
delicate balance between the treatment needed for the life-threatening illness and the
ototoxic dosage. The American Speech-Language-Hearing Association (ASHA; 1994)
and the American Academy of Audiology (2009) provided position statements on
6
ototoxic monitoring. There are different modes of delivery of the monitoring programs.
The following literature review explains the physiologic effects of chemotherapeutics on
the ear, ototoxic monitoring using high frequency audiometry, and challenges present
when implementing an ototoxic monitoring program.
Auditory System Overview
Normal Anatomy/Physiology
The auditory system is comprised of the outer ear, middle ear, inner ear, auditory
nerve, auditory brainstem, and auditory cortex. The outer ear collects acoustic energy,
which is transferred to the tympanic membrane. The tympanic membrane separates the
outer ear from the middle ear. Vibration of the tympanic membrane forces the ossicles in
the middle ear to vibrate. In this process, acoustical energy is transformed into
mechanical energy. The most medial ossicle, the stapes, pushes on the round window of
the cochlea in response to vibration. The cochlea is located in the inner ear. Pressure on
the oval window causes movement of the fluid in the cochlea. This fluid is produced by a
structure in the cochlea called the stria vascularis. This fluid movement causes the
basilar membrane to be set into motion. On top of the basilar membrane are the sensory
cells of the cochlea, which is located in the organ of Corti. These sensory cells are the
inner and outer hair cells--one row of inner hair cells and three rows of outer hair cells.
Located on top of the hair cells are stereocilia. The outer hair cell’s main function is to
amplify sound, whereas the inner hair cell’s function is to transmit the amplified signal
electrochemically to the auditory nerve. The basilar membrane is tonotopically
organized. The basal end of the cochlea codes high frequency information whereas the
apex of the basilar membrane codes for low frequency information. When the basilar
7
membrane is set into motion, the stereocilia shear causes an influx of calcium and
potassium into the hair cell. This influx of calcium and potassium allows for a
neurotransmitter to be released into the synaptic junction, thus causing a signal to be sent
along the auditory nerve and brainstem. The signal makes its way to the auditory cortex
where the brain can interpret it.
Hearing Loss
To have normal hearing, all of the structures in the auditory pathway need to be
functioning properly. Normal hearing ranges from -10 dB HL to 20 dB hearing level
(HL) for adults in the conventional audiometric frequency range of 250-8000 Hz. When
hearing is within this range, the human cochlea has the ability to hear frequencies in
human speech. This allows for successful verbal communication. When hearing
thresholds are poorer than 20 dB HL, hearing at a distance, hearing soft sounds, or
understanding speech in the presence of background noise becomes difficult. The more
severe the hearing loss, the greater the spoken communication difficulties.
In the higher frequencies, thresholds are considered abnormal if they fall outside
the -10-20 dB HL range as well. Frank (1990) conducted a study with the main objective
of determining high-frequency (8,000-16,000 Hz) thresholds (reference equivalent
threshold sound pressure levels [RETSPLs]). The second objective was to evaluate intra-
subject threshold variability at these frequencies. Threshold testing was completed on
100 individuals with normal hearing between 250 and 8,000Hz with an equal number of
males and females. Sennheiser HDA 200 circumaural earphones were used. High
frequency thresholds were subject to a three-factor analysis of variance. The factors were
test ear, test session, and gender. No significance was shown for any factor. The median
8
thresholds for each test session were similar across all frequencies. As frequency
increased, so did threshold. Median threshold at 8,000 Hz was 18.2 dB sound pressure
level (SPL); whereas at 16,000 Hz, the median threshold was 57.7 dB SPL. Standard
deviation also increased from 6.6 dB SPL at 8,000 Hz to 17.5 dB SPL at 16,000 Hz. An
analysis of variance (ANOVA) in R showed no significant difference in terms of the
repeatability of high frequency thresholds. Frank concluded that even though there was
high intersubject variability for high frequency thresholds, RETSPLs could be used to set
the output of the audiometers to 0 dB HL. It was also important to note that between test
sessions, there was minimal variation in threshold, signifying the successful application
for serial monitoring of the high frequency thresholds (Frank, 1990). At frequencies
above 8,000 Hz, age affects thresholds (Osterhammel, 1977). However, high frequencies
in older adults can be used to obtain serial audiograms and monitor for changes even if
thresholds are outside of the normal reference levels compared to young adults. These
outcomes are important since high-frequency audiometry might be useful to detect and
monitor damage to the auditory system.
Damage or malfunction in different areas of the auditory system accounts for
different types of hearing loss. If a problem exists in the outer or middle ear, acoustic
energy might not be able to reach the sensory cells in the cochlea. A hearing loss present
due to outer or middle ear dysfunction is considered a conductive hearing loss. In this
case, the sensory cells of the auditory system are functioning properly but sound is
reduced upon reaching the cochlea. When damage occurs in the inner ear, it results in a
sensory hearing loss. This type of hearing loss is usually rehabilitated with hearing aids
or cochlear implants and cannot be medically corrected in most cases. If there is a
9
problem in the outer or middle ear and the inner ear, this is termed a mixed hearing loss.
If the outer, middle, and inner ear are functioning normally, there could be a problem in
the transmission of sound past the cochlea in the auditory nerve, brainstem, central
auditory pathway, or cortex, causing a hearing loss termed “neural” hearing loss or
“central” hearing loss. Many factors could contribute to hearing loss including genetics,
age, infection, and systematic disease. Exposure to ototoxins such as noise, chemicals,
and pharmaceuticals could also cause hearing loss.
Ototoxicity
Ototoxicity is a common side effect of some medications. These pharmaceuticals
cause damage in the cochlea, which results in a hearing loss. For some medications,
damage initially occurs in the basal end of the cochlea, causing hearing threshold shifts in
the high frequency range. However, damage is not limited to that cochlear location.
Over time, auditory damage can progress toward the apical region of the cochlea, causing
impairment of hearing in the mid-frequencies. Ototoxic effects are not confined to the
cochlea. In some cases, ototoxicity can affect the vestibular system. For the purposes of
this manuscript, vestibulotoxicity is not discussed in detail.
Multiple sources of ototoxic exposures can affect the cochlea, vestibular system,
or both. Due to life threatening conditions, patients must sometimes receive treatment
through ototoxic sources. Different classes of drugs and chemicals cause different
symptoms from the ototoxicity. A common source of ototoxicity is from
chemotherapeutic drug exposure (chemotherapeutics). This class of drugs is discussed in
length in a later section. Aminoglycosides are another well-documented class of
medications known to be ototoxic. Aminoglycosides were first found effective in
10
treating tuberculosis (Schatz & Waksman, 1944). Due to low cost, aminoglycosides are
the most common antibiotic used around the world (Schacht, 2007). Aminoglycosides
primarily affect outer hair cells, starting at the base of the cochlea and progressing to the
apex with continued administration (Hawkins, 1976).
Loop diuretics have also been shown to have ototoxic effects; these drugs include
ethacrynic acid, furosemide, bumetanide, and torsemide (Rybak, 2007). Several loop
diuretic studies conducted on rodents have shown ototoxic effects that were generally
reversible (Green & Mirkin, 1981; Klinke & Mertens, 1988; Rybak, 1993).
Commonly prescribed pharmaceutical agents can also be a source of ototoxicity
including aspirin, anti-inflammatory drugs, quinine, and macrolides. This class of drugs
can cause a high frequency hearing loss along with tinnitus. However, following
cessation of the drug, the symptoms usually cease and no structural damage is done to the
cochlea (Lonsbury-Martin, Martin, & Pettis, 2007).
Chemical exposure can also cause ototoxic effects and make the hearing organ
more susceptible to noise-induced hearing loss (Pouyatos & Pettis, 2007). Carbon
monoxide, cyanide, lead, mercury, manganese, ethyl benzene, xylene, trichloroethylene,
and acrylonitrile are considered ototoxic chemicals. Chemical solvents such as styrene
and toluene are also ototoxic chemicals (Pouyatos & Pettis, 2007). This manuscript
focused on chemotherapeutics in terms of early detection of hearing loss and intervention
to prevent hearing loss.
11
Chemotherapeutics
Overview of Cancer Treatment
Cancer is often treated using chemotherapeutics. In many patients diagnosed with
cancer, the ototoxicity of the drug they are receiving is of minor concern in the context of
life-threatening health issues. In many cases, the only choice of treatment is an ototoxic
drug. Different dosages and types of chemotherapeutics are used to treat different
cancers and different cancer stages. However, not all chemotherapy drugs are known to
cause hearing loss.
The purpose of chemotherapeutic drug therapy is to prevent cancer cells from
proliferating, invading, and metastasizing (Rybak, Huang, & Campbell, 2007).
Chemotherapeutics are classified based on their effect on the phases in the cell cycle
(Skeel, 1999). Phase-specific drugs are chemotherapeutics that are active against cells in
a specific phase of the cell cycle including drugs that inhibit deoxyribonucleic acid
synthesis. There are also cell cycle-specific drugs that are only active when the cell is in
cycle but are independent of the cell cycle’s phase. The last classification is cell-cycle
non-specific drugs. In this classification, the drugs are effective whether the cells are in
cycle or not. Many chemotherapeutics are not bound to one classification; rather,
multiple mechanisms are involved, causing multiple intracellular sites to be implicated
(Rybak et al., 2007).
Chemotherapeutic Agents and
Associated Hearing Loss
Cisplatin. Cisplatin is a type of chemotherapy drug that was introduced in the
1970s. Some of the cancers commonly treated with cisplatin include germ cell, ovarian,
endometrial, cervical, urothelial, head and neck, lung, and brain cancers (Boulikas &
12
Vougiouka, 2004; Sturgeon, 2004). Cisplatin is systemically toxic (Hartmann & Lipp,
2003), meaning its effects are not isolated to one area. This leads to a potential for
ototoxicity. In fact, cisplatin is the most ototoxic platinum compound and the most
ototoxic drug in clinical use (Hartmann & Lipp, 2003).
Incidence of cisplatin ototoxicity varied within the research literature. The range
for ototoxicity from cisplatin is 40% to 60% (Bokemeyer et al., 1998; de Jongh et al.,
2003; Li, Womer, & Silber, 2004). Different factors influence the risk for ototoxicity
including dose regimen, administration, and location of cancer (Blakley, Gupta, Myers, &
Schwan, 1994; Kopelman et al., 1988; Vermorken, Kapteijn, Hart, & Pinedo, 1983).
Kopelman and colleagues (1988) monitored patients with advanced cancers
receiving a high dosage of cisplatin (150 to 225 mg) by bolus administration. A common
dose is 50 mg (Rybak et al., 2007). After one of two doses, all patients who previously
had normal hearing failed to respond at 9,000 Hz and above (Kopelman et al., 1988),
indicating the higher dosage of cisplatin dramatically increased the incidence of
ototoxicity in these patients.
Laurell and Jungnelius (1990) found the risk of ototoxicity was greater based on
the amount of a single dose and not the cumulative dose. Conversely, other researchers
found the best predictor of ototoxic risk was more related to cumulative dose (Bokemeyer
et al., 1998; Klis et al., 2002; Li et al., 2004). Li et al. (2004) reported that when the
cumulative dose reached 400 mg/m2, the risk of ototoxicity increased dramatically.
Laurell and Jungnelius also found pre-existing hearing loss did not have an effect on
ototoxic risk. However, advanced age did increase the risk for ototoxicity with cisplatin.
13
Blakley et al. (1994) found the incidence of ototoxicity due to cisplatin increased
when patients had decreased levels of red blood cells, hemoglobin, and serum albumin as
a result of poor overall health. Ototoxic risk was shown to be increased in guinea pigs
when animals were exposed to high levels of noise 30 minutes prior to cisplatin (Laurell,
1992).
Hearing loss due to cisplatin ototoxicity initially occurs in frequencies higher than
those traditionally tested in pure tone audiometry (250 Hz-8,000 Hz). Kopelman and
colleagues (1988) discovered the first signs of hearing loss occurred at 9,000 Hz and
above. After administration of a second high dose cisplatin (150-225 mg), hearing loss
progressed into the lower frequencies (2,000 to 8,000 Hz). However, the hearing loss did
plateau at a moderate level hearing loss of 40 to 60 dB HL. All participants also reported
tinnitus (Kopelman et al., 1988).
Laurell and Jungnelius (1990) monitored 54 patients receiving high dosages of
cisplatin (100-120 mg). Eighty-one percent of patients had at least 15 dB elevations in
air conduction thresholds at one threshold and 10 dB shifts at three or more frequencies.
Forty-one percent of these patients had deterioration of hearing in the speech frequencies
(Laurell & Jungnelius, 1990). Hearing loss associated with cisplatin ototoxicity is
usually symmetric, bilateral, and permanent, especially when the hearing loss is in the
profound range (Kopelman et al., 1988; Vermorken, Mangioni, & Van Oosterom, 1983).
The hearing loss might also be progressive or sudden (Blakley & Myers, 1993).
Structural changes have also been noted in the cochlea due to cisplatin therapy.
Marco-Algarra, Basterra, and Marco (1985) observed in guinea pigs that the outer hair
cells in the cochlea were more susceptible to damage compared to the inner hair cells.
14
Estrem, Babin, Ryu, and Moore (1981) also found that damage to the supporting and
pillar cells occurred in guinea pig cochleas following cisplatin treatment. Strauss et al.
(1983) noted degeneration of spiral ganglion cells as well as cochlear neurons after
examining the temporal bones of a patient with documented hearing loss who had frontal
lobe astrocytoma and was treated with cisplatin.
Carboplatin. Carboplatin is another platinum compound commonly used to treat
small cell lung, ovarian, head, and neck cancers (Bauer, Westhofen, & Kehrl, 1992;
Gatzemeier et al., 1991; Gordon et al., 2002). The greatest benefit of carboplatin over
cisplatin is the overall lower neurotoxic effects (Cavaletti et al., 1997).
Forty-four percent of pediatric patients receiving carboplatin along with
hematopoietic stem cell transplantation expressed hearing loss (Punnett et al., 2004).
Neuwelt and colleagues (1998) found 79% of patients had hearing loss due to ototoxicity
when they were treated with carboplatin in combination with mannitol. Contrarily, in the
same study, Neuwelt and colleagues observed very little hearing loss when patients were
treated with sodium thiosulfate following carboplatin treatment.
By using animal subjects, morphological changes in the cochlea were visible.
Saito et al. (1989) found carboplatin-induced hearing loss caused damage to the outer hair
cells; however, the inner hair cells remained undamaged in guinea pigs. Wake, Takeno,
Ibrahim, Harrison, and Mount (1993) found that in a chinchilla, the inner hair cells were
preferentially damaged. Therefore, pathophysiological differences across animal species
might exist.
15
Vinka alkaloids. Vinka alkaloids make up a group of products: vinblastine,
vincristine, and vinorelbine. Vinblastine and vincristine are natural products derived
from the periwinkle plant (Rybak et al., 2007).
Vinblastine blocks mitosis while also altering amino acid metabolism (Rybak et
al., 2007). Vinblastine is a cell cycle-specific drug for the M phase. Vinblastine is used
to treat breast carcinoma, choriocarcinoma, testicular germ cell carcinomas, bladder
carcinoma, non-small cell lung carcinoma, carcinomas of the kidney, Hodgkin’s and non-
Hodgkin’s lymphomas, Kaposi’s sarcoma, Letterer-Wiew disease, mycosis fungoides,
metastatic malignant melanoma, and germ cell ovarian tumors (Rybak et al., 2007).
In rabbits, vinblastine was reported to destroy hair cells without having an effect
on nerve fibers or spiral ganglion (Serafi & Hashash, 1982). There has been only one
human case where ototoxicity was reported with vinblastine (Moss, Hickman, &
Harrison, 1999). The patient was also receiving doxorubicin, bleomycin, and
dacarbazine. After each session, the patient reported tinnitus, which lasted 7-10 days. A
mild high-frequency hearing loss occurred in the patient but speech frequencies were not
affected (Moss et al., 1999)
Vincristine is similar to vinblastine. Vincristine treats various types of cancer.
However, contrary to vinblastine, vincristine was shown to destroy sensory cells, spiral
ganglion neurons, and their fibers in rabbits (Serafy & Hashash 1982). Some cases
reported hearing loss after receiving vincristine therapy. Mahajan, Ikeda, Myers, and
Baldini (1981) reported a case where a woman experienced two separate cases of
temporary bilateral, severe (60 dB HL), sudden sensorineural hearing loss across all
16
conventional test frequencies following vincristine treatment. After two months, hearing
was restored in both cases following treatment with prednisone and cytosine arabinoside.
Vinorelbine is also a vinca alkaloid derived from vinblastine. Non-small cell lung
carcinoma and breast carcinoma are cancers vinorelbine has been used to treat. Hearing
loss was not a common side effect of vinorelbine (Rybak et al., 2007).
Difluoromethylornithine. Difluoromethylornithine (DFMO) is derived from the
amino acid ornithine and is used for prevention and treatment of cancers and parasitic
diseases (Rybak et al., 2007). Meyskens and Gerner (1999) reported DFMO caused not
only cochlear ototoxicity but the vestibular system could also be affected. Creaven,
Pendyala, and Petrelli (1993) as well as Horn, Schechter, and Marton (1987) found
DFMO caused high frequency hearing loss but symptoms were reversible in most cases.
However, Croghan, Aickin, and Meyskens (1991) reported hearing loss following DFMO
therapy at 500, 1,000, 2,000, 4,000, and 8,000 Hz, while Meyskens, Kingsley, Glattke
Loescher, and Booth (1986) reported a flat configuration hearing loss (all conventional
test frequencies). Patients undergoing DFMO treatment might present with atypical
audiograms typically associated with ototoxicity. Tinnitus was also a reported symptom
(Creaven et al., 1993).
Position Statements on Ototoxicity
The American Speech-Language-Hearing Association (1994) released a position
statement titled Audiologic Management of Individuals Receiving Cochleotoxic Drug
Therapy. According to this statement, testing higher frequencies above the conventional
limit of 8,000 Hz allowed for earlier detection of ototoxic frequency shift. It was
recommended that patients be counseled on the potential ototoxic effects before
17
treatment, baseline testing be completed before drug administration, and follow-up
monitoring sessions be completed as soon as possible following treatment. Testing of
fewer frequencies on patients who were too ill to complete an entire test was acceptable.
The American Academy of Audiology (2009) released a position statement on
ototoxic monitoring. In this statement, the following two main goals of a program were
stated:
1. Early detection of changes to hearing status presumably attributed to a
drug/treatment regime so that changes in the drug regimen may be considered,
and 2. Audiologic intervention when handicapping hearing impairment has
occurred). (p. 3)
This type of program potentially provided prevention of hearing loss in
frequencies essential to communication. When a hearing loss affected frequencies where
speech sounds occurred, the correct intervention could be made so communication
abilities remained successful. This intervention included counseling on communication
strategies, amplification, and assistive listening devices.
Ototoxicity Monitoring
The American Academy of Audiology (2009) recognized conventional and high
frequency audiometry (HFA) as a successful approach to ototoxic monitoring. Other
methods discussed as successful approaches were conventional audiometry and
otoacoustic emissions. With each approach to ototoxicity monitoring, a baseline
assessment needed to be obtained for comparison to follow-up evaluations. Ideally, the
baseline assessment included not only air-conducted, pure tone thresholds but also
tympanometry and word recognition testing.
18
Fautsi et al. (1984) demonstrated the success of HFA in a study of 77 males
receiving ototoxic medication. Hearing threshold shifts were detected sooner using HFA
when compared to conventional audiometry. In HFA, a Hughson-Westlake (Hughson &
Westlake, 1944) method is used in non-conventional audiometry test frequencies of
9,000-20,000 Hz (Carhart & Jerger, 1959). High frequency testing is a concern in non-
sound treated environments due to the increased interference of ambient noise. However,
Gordon, Phillips, Helt, Konrad-Martin, and Fausti (2005) demonstrated HFA was reliable
in a hospital ward.
Fausti et al. (1999) identified a sensitive region in the cochlea (SRO), which was
essential to establish HFA monitoring. The SRO was unique to each patient. The
researchers discovered five thresholds specific for each participant’s hearing capabilities
that were most sensitive to changes in hearing due to ototoxicity. In this method, the
highest audible frequency where patient’s thresholds were ≤ 100 dB SPL was labeled as
the reference frequency. The only frequencies that needed to be tested to have a 94%
detection rate were the reference frequency and the next four frequencies below it in
1/6th-octave steps. With this method, there was a 94% detection rate when monitoring
cisplatin-induced ototoxicity. Obtaining conventional and high frequency thresholds was
reported to take 20 to 25 minutes, whereas using the SRO method only took six to eight
minutes. By only using these five high frequency thresholds, time of testing was cut to
less than one-third of the time used when conducting full-frequency testing. This
protocol could alleviate some of the time demands and cost barriers that prevented the
acceptance of ototoxic monitoring programs (Fausti et al., 1999). To increase reliability
19
and sensitivity, Fausti et al. (2003) proposed using the same reference frequency as used
in the previous study along with the six lower, adjacent frequencies in 1/6th-octave steps.
According to the American Academy of Audiology (2009), one of the main
benefits of HFA in an ototoxic monitoring program is use of accepted criteria for an
ototoxic shift in hearing loss. The American Academy of Audiology referenced ASHA’s
(1994) criteria for detecting an ototoxic shift when using HFA. The American Speech-
Language-Hearing Association identified the criteria for a confirmed ototoxic shift in
hearing sensitivity including a 10 dB shift in hearing sensitivity in two or more adjacent
frequencies, a 20 dB shift at any one frequency, and a consecutive failure to respond at
three adjacent frequencies where a response was present at baseline testing (this was
included for HFA where thresholds might be approaching the limits of the equipment).
After a shift is initially detected, it must be proven repeatable.
Challenges in Ototoxicity
Not all cancer centers have ototoxic monitoring programs in place and
audiologists frequently encounter challenges when attempting to implement an ototoxic
monitoring program. Current National Comprehensive Cancer Network (2003)
guidelines, which are followed by oncologists, do not include any form of ototoxic
monitoring, suggesting many patients are not receiving any monitoring or management
(Dille, McMillan, Helt, Konrad-Martin, & Jacobs, 2015). Reasons for this did not appear
to be addressed formally in the literature. It appeared patient and physician factors made
ototoxic monitoring programming challenging to implement.
Patients receiving ototoxic treatments are undergoing those treatments because
they have been diagnosed with a life-threatening disease, which negatively impacts their
20
physical well-being. Cancer can be an overwhelming diagnosis and patients are often
busy with multiple medical appointments required for ongoing treatment of the primary
disorder and side effects of the chemotherapy treatment. Requiring audiology
appointments at a different clinical site might add to the scheduling, transportation, and
cost burdens; a hearing evaluation might not be a top healthcare priority for the patient.
Physicians might not see hearing monitoring as a healthcare priority or be familiar
with the importance of auditory rehabilitation strategies and timelines. Consequently,
patients are not always informed of the potential for a hearing loss, not given the
opportunity to have their hearing monitored, and indirectly are denied the potential
benefits of early identification and intervention. To have a successful program, the
physician needs to believe in the importance of hearing health care and integrate hearing
health care. Another potential problem with the implementation of an ototoxic monitoring
program is coordinating with primary care physicians. The success of an ototoxic
program relies on referrals from the primary care physician. A baseline test needs to be
obtained before the patient’s first treatment. The audiologist and the physician need to
have a good relationship in order to make appropriate decisions with regard to the patient.
Currently, ototoxic monitoring programs are yet to be mandated even though
there is a wealth of information regarding their importance. Financing these programs
could also create a barrier for program implementation. Ototoxic monitoring requires
patient enrollment, patient and professional appointment time, and proper equipment to
complete the specialized audiologic testing. Recruiting physicians and finding funding
for these services might be a challenge. In cases of established ototoxic monitoring
21
programs, it appeared the medical, pharmacy and audiology staff worked together
(usually within a hospital) to establish ototoxic monitoring protocols.
Hearing Testing
Ambient Noise
To obtain a hearing threshold, a person has to respond to the softest level of sound
he/she can perceive 50% of the time. To accomplish this, the ambient noise (background
noise) in the test environment must not interfere with or mask the test signal to obtain
accurate results. When ambient noise masks the test signal, elevated thresholds are
recorded.
The International Organization for Standardization (ISO; 2019) developed a series
of standards in order to ensure that reliable hearing thresholds are obtained. In ISO’s
(2009) ISO 8252: Acoustics: Audiometric test methods, Part 1, maximum permissible
ambient sound pressure levels were provided. The American National Standards
Institute’s (ANSI; 2013) ANSI S3.1-R2013 also specified the maximum permissible
ambient sound levels for audiometric testing using supra-aural earphones, insert phones,
and bone conductors. It was recommended when measuring these levels that a type 1
sound level meter with octave bands be used. The maximum permissible ambient noise
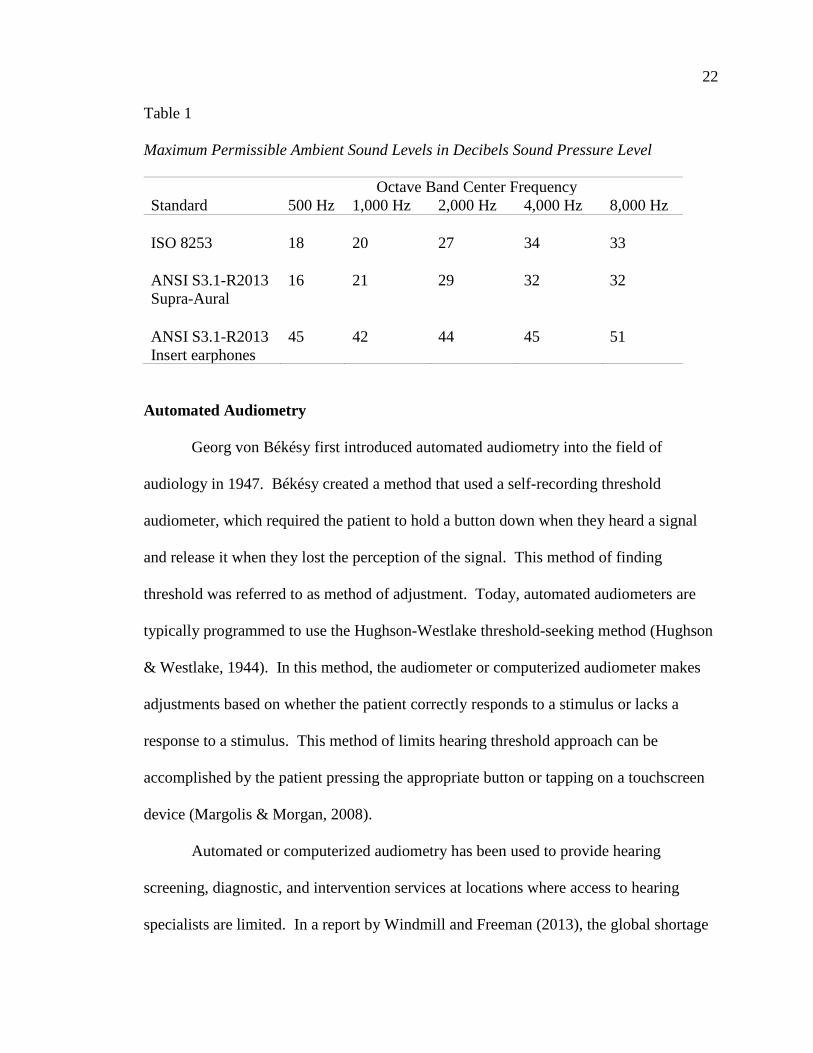
levels (MPANLs) for each organization are illustrated in Table 1. Maximum permissible
levels of ambient noise were not included above 8,000 Hz due to the lack of information
of attenuation of ear phones at frequencies above 8,000 Hz and the effects of upward
spread of masking on these frequencies (ANSI, 2013). No ambient noise levels for inter-
octave frequencies were published in the literature.
22
Table 1
Maximum Permissible Ambient Sound Levels in Decibels Sound Pressure Level
Octave Band Center Frequency
Standard 500 Hz 1,000 Hz 2,000 Hz 4,000 Hz 8,000 Hz
ISO 8253
18
20
27
34
33
ANSI S3.1-R2013
Supra-Aural
16 21 29 32 32
ANSI S3.1-R2013
Insert earphones
45 42 44 45 51
Automated Audiometry
Georg von Békésy first introduced automated audiometry into the field of
audiology in 1947. Békésy created a method that used a self-recording threshold
audiometer, which required the patient to hold a button down when they heard a signal
and release it when they lost the perception of the signal. This method of finding
threshold was referred to as method of adjustment. Today, automated audiometers are
typically programmed to use the Hughson-Westlake threshold-seeking method (Hughson
& Westlake, 1944). In this method, the audiometer or computerized audiometer makes
adjustments based on whether the patient correctly responds to a stimulus or lacks a
response to a stimulus. This method of limits hearing threshold approach can be
accomplished by the patient pressing the appropriate button or tapping on a touchscreen
device (Margolis & Morgan, 2008).
Automated or computerized audiometry has been used to provide hearing
screening, diagnostic, and intervention services at locations where access to hearing
specialists are limited. In a report by Windmill and Freeman (2013), the global shortage
23
of audiological services was emphasized with shortages not only occurring in low and
middle-income countries. The computer-based approach allows for many people to
receive services who typically would not. One healthcare provider could oversee more
people when automated audiometry is utilized. Automated audiometry has typically been
used to aid in mass industrial hearing screenings and in research (Margolis & Morgan,
2008).
The validity of automated audiometry was assessed by Mahomed, Swanepoel,
Eikelboom, and Soer (2013) in a systematic review and meta-analysis. Twenty-nine
reports comparing automated audiometry to manual audiometry were analyzed to
determine the validity of automated audiometry. The researchers concluded no
significant differences were seen in test-retest reliability between manual audiometry and
automated audiometry. Test-retest variability for automated audiometry was also within
normal limits compared to the manual audiometry’s test-retest variability. Researchers
did note limited data were available on difficult-to-test populations such as children and
individuals who are mentally handicapped; many studies only tested people with normal
hearing.
Brennan-Jones, Eikelboom, Swanepoel, Friedland, and Atlas (2016) tested 42
participants using manual and automated audiometry. The aim of this study was to
eliminate bias and include participants with a range of hearing thresholds. Participants
were tested manually in a sound isolated room and then with the KUDU wave automated
audiometry system in a non-sound-isolated environment. Participants in this study
presented diverse clinical conditions including sensorineural hearing loss, tinnitus,
conductive hearing loss, otosclerosis, otitis media, acoustic neuromas, Ménière's disease,
24
benign paroxysmal positional vertigo, perforated tympanic membrane, Eustachian tube
dysfunction, ototoxic hearing loss, skull base fracture, and unilateral hearing loss. The
researchers found the difference in threshold between the two situations was low with
86.5% of four frequency averages within 10 dB and 94.8% within 15 dB.
Hearing Testing Outside a
Sound Booth.
Audiometric testing is completed in a sound isolated room in order to obtain valid
thresholds in normal hearing individuals. The sound booth helps to control for ambient
noise levels. However, new technology has recently allowed for audiometric testing
outside of a sound-isolated room. Williams (2010) found it was possible to conduct
hearing testing in environments where ambient noise levels were not adequate by testing
with the use of noise-excluding headsets. However, an audiometer that is used with the
headset needs to be calibrated to the noise-excluding headset and proper placement of the
headset is important.
Gordon et al. (2005) conducted a study to evaluate whether extended high
frequency monitoring could be accomplished outside of a sound isolated room when
using insert earphones. Hearing thresholds obtained in a double walled sound booth
using Koss circum-aural earphones were compared to thresholds obtained at bedside in a
hospital ward. The thresholds from the sound booth were used to identify the SRO (the
highest frequency where a threshold was ≥100 dB SPL and the six adjacent lower
frequencies in 1/6th-octave steps). This SRO was used for comparisons of thresholds
obtained outside of the sound booth. Hearing testing was then repeated outside of the
sound booth at the test frequencies in the SRO and at 2,000 Hz due to the increased risk
of interfering ambient noise at that level. A second test session was then completed two
25
hours to three days after completion of the first test session. During the second session,
the order of testing was reversed--hearing testing was first completed outside of the
sound booth and then followed by testing in the sound booth at the SRO and 2,000 Hz.
Researchers found no significant differences in high frequency thresholds obtained in the
booth and in the ward. Researchers noted the results indicated good test-retest reliability
when obtaining serial audiograms in the same setting with the same transducer.
However, if setting and transducer were changed, results needed to be interpreted with
caution. During each test outside of the sound booth, ambient noise levels were recorded
using the A-weighted filter in the octave band range of 125-16,000 Hz. The mean
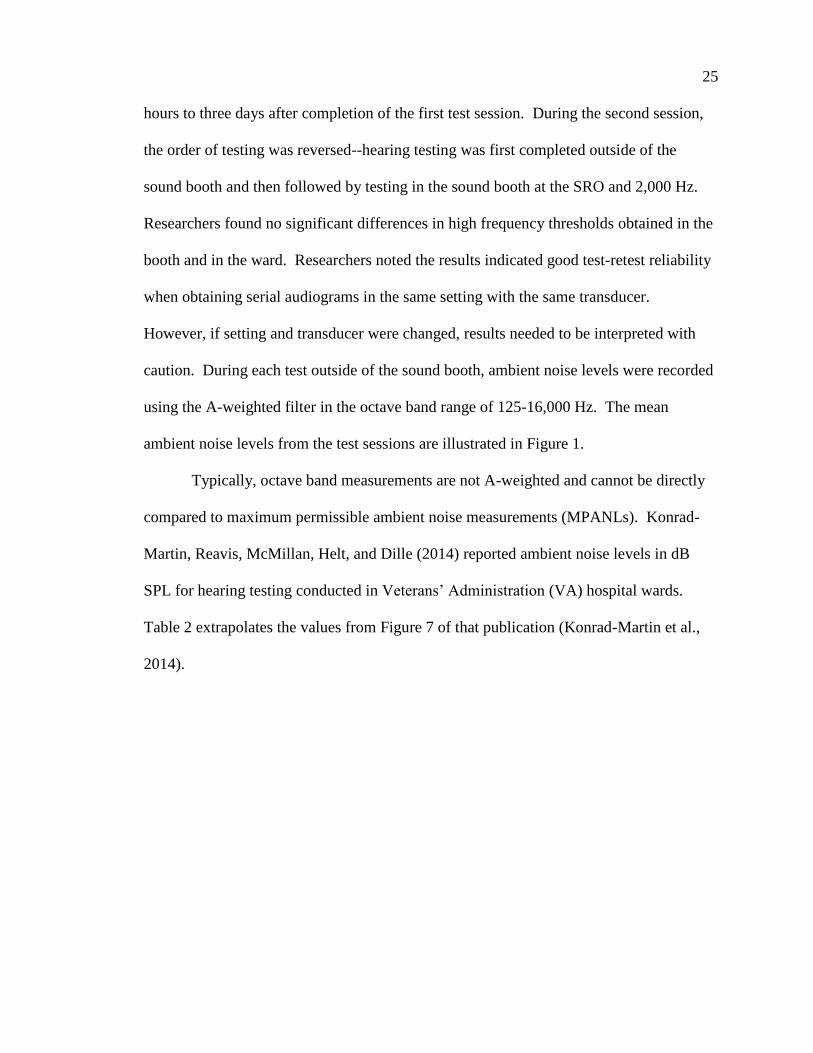
ambient noise levels from the test sessions are illustrated in Figure 1.
Typically, octave band measurements are not A-weighted and cannot be directly
compared to maximum permissible ambient noise measurements (MPANLs). Konrad-
Martin, Reavis, McMillan, Helt, and Dille (2014) reported ambient noise levels in dB
SPL for hearing testing conducted in Veterans’ Administration (VA) hospital wards.
Table 2 extrapolates the values from Figure 7 of that publication (Konrad-Martin et al.,
2014).
26
Figure 1. Mean ambient noise levels (dBA) reported in Gordon et al. (2005). Graphic
provided courtesy of Jane Gordon (personal correspondence).
Table 2
Extrapolated Mean Ambient Noise Levels in Decibels Sound Pressure Level Reported
from Veterans’ Administration Hospital Ward Measurements
Ambient Noise Levels
125 250 500 750 1,000 1,500 2,000 3,250
Frequency Band (Hz) 46 43 40.0 36 34 34 36 29
Ambient Noise Levels
4,000 5,000 6,350 8,000 10,000 12,500 16,000
Frequency Band (Hz) 29 28 26 25 27 28 28
Note. Extrapolated from Konrad-Martin et al. (2014), Figure 7. Original data values are
archived and unavailable (personal communication).
125 250 500 1000 2000 3150 4000 5000 6350 8000 10000 12500 16000
0
5
10
15
20
25
30
35
40
Hz
Session #1
Session #2
27
Creare Wireless Automated
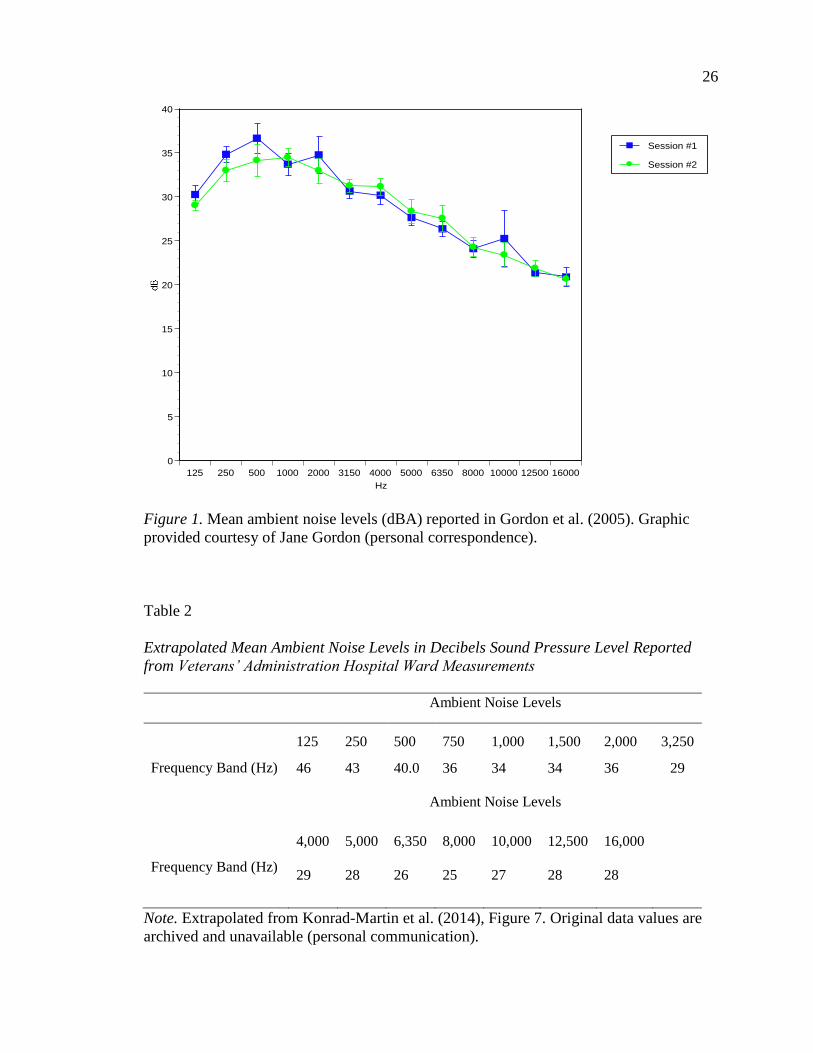
Hearing test system. Engineers at Creare Inc. (2016) recently developed a
wireless automated hearing test system (WAHTS; see Figure 2). This system was
developed to permit audiometric threshold testing in atypical settings outside of a
conventional sound booth (Meinke, Norris, Flynn, & Clavier, 2017). This system was
developed to
(1) maximize passive attenuation, while keeping the headset comfortable enough
to wear for the duration of a typical hearing exam, (2) leverage mobile
technologies and eliminate cables, and (3) meet ANSI S3.6 and IEC 60645-1
standards for audiometers. (Meinke et al., 2017, Instrumentation)
The system includes a supra-aural headset that is operated in congruence with a tablet.
The ear cups on the headset are lined with polyurethane foam. The right ear cup contains
a wireless audiometer circuit and the left ear cup contains a rechargeable lithium ion
battery. A speaker is mounted in a plastic faceplate covered in fabric. This allows for the
stimulus to be presented. Overall, the headset is relatively large, stiff, and somewhat
heavy in order to provide passive attenuation. The headband in the system uses
frictionless fit to enable quick placement of the WAHTS. The frictionless fit also allows
the WAHTS to hold its position on the listener’s ears. The WAHTS supports a 4.0+
Bluetooth Low Energy interface. This allows the device to be connected to a
computerized tablet, which initiates the automated threshold test and receives the results
through an application called TabSINT. This application allows for customized tests and
questionnaires to be administered on an array of mobile devices.
28
Figure 2. Creare wireless automated hearing test system including iPad.
Meinke et al. (2017) conducted a study to characterize the Creare (2016) WAHTS
performance in an occupational setting when administered by untrained personnel. A
within-subject repeated measures design study was completed to compare air-conducted
threshold testing (500 to 8,000 Hz) obtained by untrained operators using the WAHTS in
worksite conference rooms to test results obtained using computerized CCA-200
audiometers in a mobile trailer sound booth by a trained tester. Twenty workers were
tested twice with the WAHTS in the conference room and once with the CCA-200 in the
mobile trailer. Mean thresholds obtained with the WAHTS were equivalent to mean
thresholds obtained from the mobile trailer at 1,000, 2,000, and 3,000 Hz. Thresholds
were within 5 dB at 500, 4,000, 6,000, and 8,000 Hz. Test-retest reliability results
showed the Creare wireless headset system was equivalent to or better than previously
reported ranges obtained by traditional equipment. The ambient noise levels recorded in
the rooms outside of the sound booth did not meet the ANSI (2013) standard for
maximum permissible ambient noise for audiometric testing. However, test-retest
29
average differences at frequencies up to 8,000 Hz were less than 1 dB and 1.1 dB at 8,000
Hz. It was important to note this was better than what was obtained in a sound booth
with insert or TDH-39 supra-aural earphones (Swanepoel, Mngemane, Molemong,
Mkwanazi, & Tutshini, 2010).
Meinke et al. (2017) also found the Creare (2016) wireless headset provided
attenuation to low frequency ambient noise equivalent to a “mini” single-walled sound
booth. These results suggested the WAHTS is a useful device for obtaining valid
thresholds in diverse test locations without the use of a sound isolated test room and
hearing thresholds could be obtained by an untrained operator.
At the completion of the audiometric testing (Meinke et al., 2017), the WAHTS
(Creare Inc., 2016) operator and the listener both took a survey on the tablets in order for
the researchers to gain subjective data on the overall experience and usability of the
device. The operator survey included 18 statements that required a 7-point Likert-type
scale response (1 = Strongly Disagree, 2 = Disagree, 3 =Somewhat Disagree, 4 = Neither
Agree or Disagree, 5 =Somewhat Agree, 6 = Agree, and 7=Strongly Agree). One open-
ended question was also included for additional comments related to the WAHTS.
Listeners responded to eight statements on the same Likert-type scale listed for the
operators. Listeners also had the chance to provide additional opinions on the WAHTS.
Overall, operators who were unfamiliar with the technology felt the device was easy to
use, intuitive, did not require practice to operate it, and they said they would use this
device if they had access to it. Similarly, listeners also had an overall positive response to
the device. Listeners felt subjectively that the testing with the WAHTS was just as
accurate as the test in the trailer with the sound treated booths. However, some listeners
30
commented they needed eyeglasses to view the tablet and one listener said he/she could
not close his/her eyes during testing, which resulted with him/her being visually
distracted. Some listeners felt the test took longer with the WAHTS than in the mobile
trailer, which was most likely due to the multiple tests on each ear being conducted to
assess the reliability of the WAHTS (Meinke et al., 2017).
Recent Advances in Ototoxicity Monitoring
Rieke et al. (2017) proposed a new method for evaluating ototoxicity--a Békésy
(1947)-style fixed-level frequency-threshold (FLFT). This approach allows the listener
to vary frequency at a fixed presentation level rather than having the listener vary the
sound level. By quickly sweeping through the frequencies at 80 dB SPL, the highest
audible frequency is quickly determined. Rieke and colleagues compared the FLFT to a
modified SRO (limited output at 80 dB SPL), which was the commonly accepted method
used to monitor ototoxicity. Participants in the study had to have normal hearing in the
conventional frequency range. All patients were between the ages of 23 and 35 years.
Each subject attended at least four different sessions. During the first session, all subjects
were trained on the Békésy tracking procedure. Hearing thresholds were obtained at 0.5,
1, 2, 3, 4, 6, 8, 9, 10, 11.2, 12.5, 14, 16, 18, and 20,000 Hz. The stimulus was a pulsed
pure tone that would start at 40 dB SPL and decrease in 4 dB step sizes. Subjects would
hold a response button until they no longer heard the tone. The tone intensity would then
increase again. After the second reversal, the step size decreased to 2 dB. The Békésy-
style fixed frequency audiometry (FFA) was then used to find the threshold at each
frequency. The SRO FFA frequencies were calculated by determining the uppermost
frequency at which the subject had a valid threshold and the six adjacent lower
31
frequencies in 1/6th-octave steps. The upper SPL limit was not set in advance for this
study in order to determine the highest frequency in the SRO. Any threshold within the
allowable limits of the hardware was accepted (up to 111 dB SPL). In all subsequent test
sessions, thresholds were only obtained in the individualized SRO using FFA. The FLFT
was also obtained at each session.
The FLFT method was adapted from Békésy’s (1947) method of adjustment
threshold testing. Contrary to Békésy’s original method, the FLFT stayed at the same
intensity level and switched frequencies. Listeners pressed a button when they could hear
the frequency and released it when they could no longer detect the frequency. The
frequency level then decreased to lower frequencies until listeners pressed the button,
again signaling they could detect a sound again. The highest audible frequency was then
labeled as the average over a certain amount of reversals. In the current study, the
average of the last six reversals was averaged with the first two being excluded. Stimulus
presentations started at 80 dB SPL at 8,000 Hz with pulsed tones extending up to 20,000
Hz. The initial frequency step-size was 1/6th-octave steps. At the first reversal, the
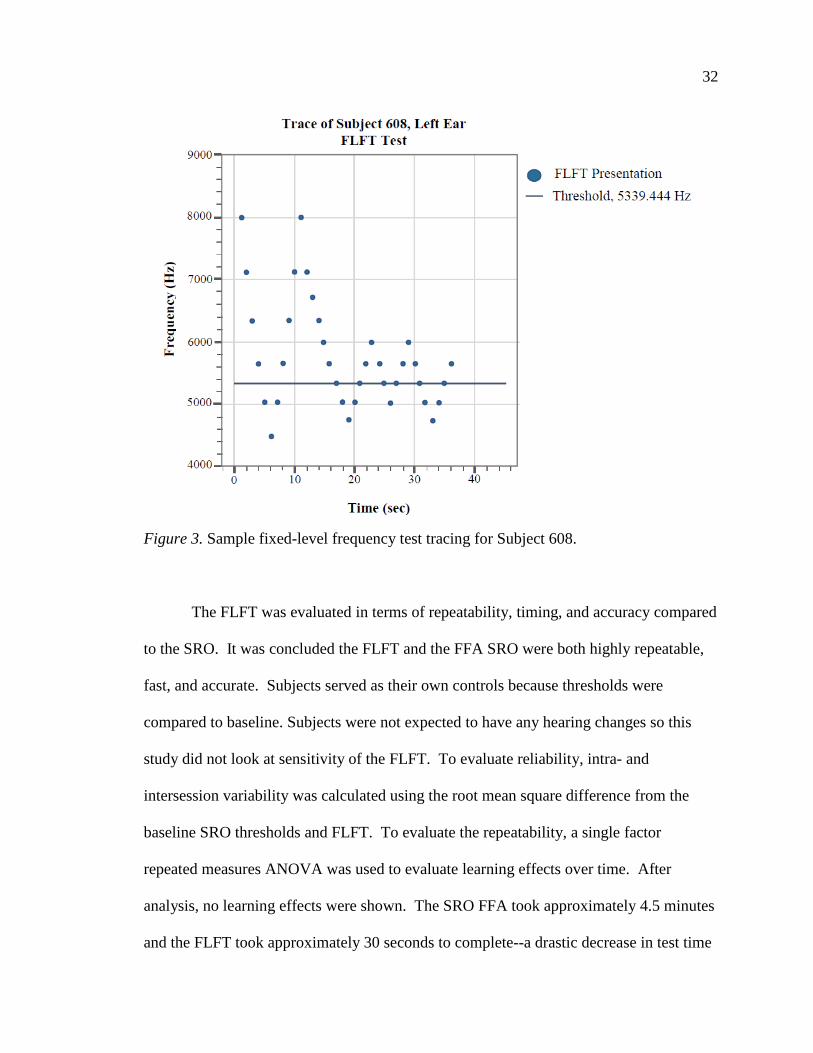
frequency step-size changed to 1/12th-octave steps. Figure 3 is the trace of an FLFT test
obtained during the present study.
32
Figure 3. Sample fixed-level frequency test tracing for Subject 608.
The FLFT was evaluated in terms of repeatability, timing, and accuracy compared
to the SRO. It was concluded the FLFT and the FFA SRO were both highly repeatable,
fast, and accurate. Subjects served as their own controls because thresholds were
compared to baseline. Subjects were not expected to have any hearing changes so this
study did not look at sensitivity of the FLFT. To evaluate reliability, intra- and
intersession variability was calculated using the root mean square difference from the
baseline SRO thresholds and FLFT. To evaluate the repeatability, a single factor
repeated measures ANOVA was used to evaluate learning effects over time. After
analysis, no learning effects were shown. The SRO FFA took approximately 4.5 minutes
and the FLFT took approximately 30 seconds to complete--a drastic decrease in test time
33
when compared to conventional audiometry (a reduction of 98%). The FLFT directly
translated to the SRO, suggesting the FLFT could be used to evaluate ototoxicity in
patients. Due to the suprathreshold testing, an additional benefit to the FLFT was the
practicality of testing outside of a sound isolated room. These advances might afford an
opportunity to overcome the challenges that currently limit the implementation of
ototoxicity monitoring programs and create an opportunity for more cancer patients to
reap the benefits of early detection and intervention for ototoxicity.
The Value of Ototoxic Monitoring
Due to advances in science, survival rates have improved for people diagnosed
with cancer. More people are living in remission, which has led to an increased number
of people who are living with the long-term side effects of the treatment they received.
In many cases, the hearing loss acquired due to ototoxicity of various forms of cancer
treatment lasted past the final treatment. It was important to understand what effect
living with an acquired hearing loss could have on a person in remission. In general,
hearing loss could have negative effects on people beyond the sensory deficit.
Uncorrected hearing loss could potentially lead to reduced quality of life and social
activity along with increased isolation and depression (Arlinger, 2003). Lin et al. (2013)
found hearing loss accelerated cognitive decline and incidence of cognitive impairment in
elderly adults.
Chia et al. (2007) assessed quality of life in relation to hearing loss. Participants
were given the Short Form Health Survey (SF-36; Ware, Kosinski, & Keller, 1994),
which is a quality of life assessment that has eight subscales that represent dimensions of
health and well-being: physical functioning, role limitations due to physical problems,
34
bodily pain, general health perceptions, vitality, social functioning, role limitations due to
emotional problems, and mental health. Participants received a hearing assessment,
which included an interview about perceived hearing loss, and air and bone conduction
threshold testing at traditional test frequencies. Factor analysis, Australian normalized
scores, Mantel-Henzsel chi-square statistic with 1 degree of freedom, t-tests, and F-
statistic were used to analyze the data in this study. Participants with bilateral hearing
loss scored lower on the SF-36 in comparison to participants with unilateral hearing loss.
People with mild bilateral hearing loss scored lower on the SF-36 than those with normal
hearing (Chia et al., 2007).
Similar findings in older adults were reported by Dalton et al. (2002) who
conducted a study comparing quality of life to hearing loss. Dalton et al. used the
Hearing Handicap Inventory for the Elderly-Screening (Ventry & Weinstein, 1982) along
with additional hearing related communication difficulty questions to assess quality of
life. People with hearing loss had decreased scores in every domain of the Hearing
Handicap Inventory for the Elderly-Screening version. Severity of hearing loss was
directly related to self-reported communication difficulties as well as lower scores on
both the Mental Component Summary score and the Physical Component Summary score
of the SF-36 (Dalton et al., 2002).
People who have a close relationship with a person with a hearing loss might also
be negatively affected. In a study conducted by the National Council on Aging in the
United States (Seniors Research Group, 1999), the researchers compared people with
longstanding hearing loss who wore hearing aids and those who did not in relation to
quality of life. The researchers also gave the participants’ significant others a
35
questionnaire to assess the significant other’s well-being. People with untreated hearing
loss reported feeling sad or depressed more often as well as worried and paranoid.
People with untreated hearing loss also took part in less social activity and had more
emotional turmoil. This also corresponded with the spouse’s response. When comparing
the results of the people who wore amplification, their significant others often reported
even more benefit than the person with the hearing loss in terms of the relationship at
home, confidence, and other relationships (Seniors Research Group, 1999).
Gruney et al. (2007) evaluated quality of life in relation to hearing loss caused by
drug treatment in children who had neuroblastoma. One objective of Gruney et al. was to
assess hearing loss and parent-reported psychosocial difficulties for the child after
treatment. The Pediatric Quality of Life Inventory 4.0 (Varni, 2019) was used to assess
quality of life in the children. Neuroblastoma survivors with hearing loss had a mean
score of 10-points lower on the Pediatric Quality of Life Inventory 4.0. Researchers
concluded neuroblastoma survivors with hearing loss had an elevated risk for
psychosocial difficulties (Gruney et al., 2007)
When hearing loss is rehabilitated through amplification, there are potential
improvements to quality of life. Chia et al. (2007) found people who habitually wore
hearing aids had better physical functioning on average. In a meta-analysis, Chisolm et
al. (2007) analyzed 16 studies where the researchers looked at quality of life in relation to
hearing loss rehabilitation with hearing aids. Research included in this study had
information on non-acoustic benefits from amplification such as emotional well-being,
stress levels, relationships, loneliness, and self-efficacy (Chisolm et al., 2007). Chisolm
et al. also concluded that hearing aids decreased negative psychosocial, social, and
36
emotional effects in people with hearing loss. The authors also reported hearing loss
could be a “potentially devastating chronic health condition if left unmanaged” (Chisolm
et al., 2007, p. 169).
Properly informing patients about the possibility of hearing loss as a side effect of
the drug they are being exposed to could potentially reduce the negative impacts hearing
loss has on quality of life if they are identified and treated early. If patients are made
aware of the possibility of side effects, they would potentially realize the hearing loss
earlier by having their hearing status evaluated and be able to seek rehabilitation, thus
retaining a better quality of life. If the patient is receiving audiological services, a shift in
hearing might be noticed before the negative effects of a hearing loss are noticed by the
patient. When this occurs, the physician might be contacted and a different drug regimen
might be suggested to reduce the drug’s impact on the auditory system.
Rationale for Study
Hospital-based cancer care centers in northern Colorado administer
chemotherapeutics to patients that have the potential to be ototoxic. These hospitals do
not currently have an ototoxic monitoring program due to the lack of audiological test
facilities and personnel. The hospital-based cancer treatment setting presents a unique
opportunity to implement novel hearing testing technology and test protocols that might
provide earlier identification of hearing loss or reinforce the need for audiological
rehabilitation in cancer patients. This study evaluated the use of the WAHTS (Creare,
2016) to test the hearing of patients when operated by nursing staff at two hospital-based
cancer treatment centers in northern Colorado.
37
CHAPTER III
METHODS
This study was designed to evaluate the use of Creare Inc.’s (2016) wireless
automated hearing test system (WAHTS) in two cancer treatment centers when operated
by untrained nursing staff. In addition, the study compared the hearing test outcomes for
the fixed-level frequency test (FFLT) and automated high frequency audiometry (AHFA)
in terms of the identification of the highest audible frequency (HAF).
Participants
Participants in this study consisted of listeners who were undergoing cancer
treatment and untrained nurse operators who administered the hearing testing. Listeners
and operators were recruited from two outpatient cancer treatment centers. The study
exclusion criterion included the following: formally trained in audiometry. The research
was conducted under the University of Northern Colorado’s Institutional Review Board’s
(IRB) protocol (see Appendix A for approval).
Listeners
Study inclusion criteria included the following:
• Be an adult over the age of 18 years
• Be receiving chemotherapy with either carboplatin or cisplatin
• Understand, speak, and read English
• Have sufficient vision to view the tablet computer
38
• Have sufficient dexterity to be able to tap on the on-screen box displayed on
the tablet computer.
Study exclusion criteria included the following:
• Have a cochlear implant
• Have any medical condition of the ear that prevents use of the wireless
headset such as a draining ear
• Have any head injuries, surgical incisions or wounds
• Are too febrile to participate in the hearing testing per nursing judgment.
Operators
Study inclusion criteria included the following:
• Be employed as hospital/cancer center nursing staff
• Understand, speak, and read English
• Have sufficient vision to view the tablet computer
• Have sufficient dexterity to be able to follow on-screen instructions to
operate the computer tablet and place the wireless earphones on the listener.
Instrumentation
Creare Wireless Automated Hearing
Test System
Creare Inc.’s (2016) wireless automated hearing test system (WAHTS) was used
to obtain hearing sensitivity information. The WAHTS was used to obtain the AHFA
and the FLFT. Both audiological tests determined the highest audible frequency a person
could hear. To measure hearing responses for AHFA, the WAHTS used an algorithm
based on a modified version of the Hughson-Westlake procedure (Carhart & Jerger,
39
1959). The WAHTS also used an algorithm to perform a Békésy-like (Békésy, 1947)
FLFT technique.
Order of administration of the AHFA and the FLFT was counter-balanced along
with the starting test ear. For AHFA, thresholds were identified at each test frequency
(1,000, 2,000, 3,000, 4,000, 6,000, 8,000, 9,000, 10,000, 11,200, 12,500, 14,000, 16,000,
18,000, 20,000). The HAF was selected based on the highest audible frequency for
which a person had a measurable threshold. Thresholds could be as high as the output of
the WAHTS at each frequency.
For the FLFT testing, a tone was presented at 80 dB SPL at 8,000 Hz. The
frequency of the tone gradually increased in 1/6th-octaves until the patient could no
longer detect the tone. The frequency then decreased until the patient detected the tone.
After the first reversal, the step size was 1/12th-octave. The highest audible frequency was
calculated based on the average of the last six reversals, ignoring the first two reversals.
This was the same FLFT method used by Rieke et al. (2017).
Tablet
The WAHTS (Creare Inc., 2016) system supported a Bluetooth low energy (4.0+)
interface, which allowed it to be connected to a tablet. The tablet initiated the testing
using an application (app) developed by Creare Inc. (2016) called TabSINT (v1.7.4). The
TabSINT allowed the researcher to administer customized tests and questionnaires. This
app allowed the WAHTS to be connected to the tablet (Shapiro & Galloza, 2016).
Subject identifiers were inputted into the app. After data import was complete, the
researcher was instructed to give the tablet to the hearing test operator. The operator was
instructed to place the WAHTS on the listener’s head and hand the iPad to the listener.
40
The app screen then displayed a large touchscreen box the listener touched to respond to
the stimulus for each test.
Sound Level Meter
A Quest Type 2 SLM, Model 2700 (serial # HU2040042; Pine Environmental,
2019a) with an OB-300 octave band analyzer (serial # HW3050014; Multimedia, n.d.)
was used to obtain pre- and post-test ambient noise measurements. Prior to each pre-test
measurement, the SLM was calibrated using a Quest Model QC-10/QC-20 Acoustic
Calibrator (serial # QIE010076; Lesman Instrument Co., 2019) to assure the SLM was in
accordance with ANSI’s (1983) specifications for sound level meters.
Survey Instrument
Operators and listeners each completed a survey created in Qualtrics. A 7-point
Likert-type response was used in both the operator and listener survey: (1 = Strongly
Disagree, 2 = Disagree, 3 = Somewhat Disagree, 4 =Neither Agree or Disagree, 5 =
Somewhat Agree, 6 = Agree, 7 = Strongly Agree). The operator survey consisted of 17
statements previously used in WAHTS studies related to operator characteristics and
settings (see Appendix B). The listener survey included 12 statements previously used in
WAHTS studies as well as the inclusion of new statements specific to this population’s
characteristics. An additional open-ended question for comments related to usability and
the experience with the WAHTS was also included at the conclusion of both operator and
listener surveys. Operator and listener surveys were completed on a Google Nexus 7
Tablet (Asus, Taiwan). Results were uploaded to a password-protected webserver.
41
Experimental Procedures
Following proper calibration of equipment and informed consent, pre-test ambient
noise was measured using a Quest Type 2 SLM, Model 2900 (serial # HU2040042; Pine
Environmental, 2019b). Ambient noise measurements were obtained at 31.5, 63, 125,
250, 500, 1,000, 2,000, 4,000, 8,000, and 16,000 Hz. Measurements took place within a
two-foot circumference of the listener’s head. Measurements were completed before and
after the audiometric testing.
After the completion of data entry of alpha-numerical subject numbers and
demographic details (age and gender), the tablet was handed to the nurse operator. The
operator followed on-screen directions to prep the listener and place the WAHTS (Creare
Inc., 2016) on the listener’s head and handed the tablet to the listener. The listener was
instructed by the researcher and by reading text on the tablet regarding the steps to
complete the AHFA and FLFT hearing tests in each ear. Each test was timed through the
TabSint (Creare Inc., 2016) app. Post-test ambient noise levels were measured and data
entered in the same method as pre-test ambient noise levels. At the completion of the
testing, the operator and listener took the usability survey.
Data Analysis
To determine if the WAHTS (Creare Inc., 2016) could feasibly be implemented
into outpatient cancer centers, user/operator surveys were descriptively analyzed (see
Appendices B and C). Mean pre- and post-test ambient noise levels were analyzed and
compared for the two test sites. Attenuation of the WAHTS in relation to the average
ambient noise level was compared at each frequency band. Listener/operator surveys and
ambient noise levels were imported from the database into Excel. All data were analyzed
42
in Excel. A Wilcoxon (1945) signed ranks test was used to evaluate differences between
the highest audible frequency identified by the FLFT and the AHFA. A Student’s t-test
was used to evaluate the testing time differences between the AHFA and the FLFT
audiological tests.
.
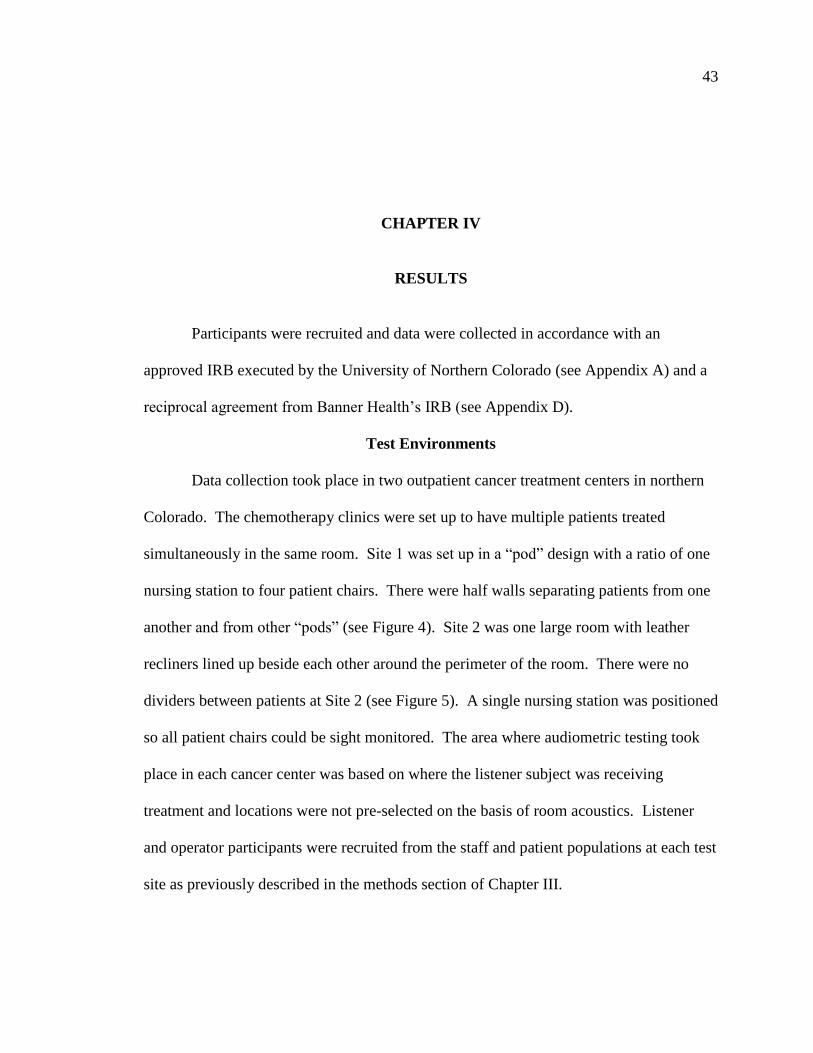
43
CHAPTER IV
RESULTS
Participants were recruited and data were collected in accordance with an
approved IRB executed by the University of Northern Colorado (see Appendix A) and a
reciprocal agreement from Banner Health’s IRB (see Appendix D).
Test Environments
Data collection took place in two outpatient cancer treatment centers in northern
Colorado. The chemotherapy clinics were set up to have multiple patients treated
simultaneously in the same room. Site 1 was set up in a “pod” design with a ratio of one
nursing station to four patient chairs. There were half walls separating patients from one
another and from other “pods” (see Figure 4). Site 2 was one large room with leather
recliners lined up beside each other around the perimeter of the room. There were no
dividers between patients at Site 2 (see Figure 5). A single nursing station was positioned
so all patient chairs could be sight monitored. The area where audiometric testing took
place in each cancer center was based on where the listener subject was receiving
treatment and locations were not pre-selected on the basis of room acoustics. Listener
and operator participants were recruited from the staff and patient populations at each test
site as previously described in the methods section of Chapter III.
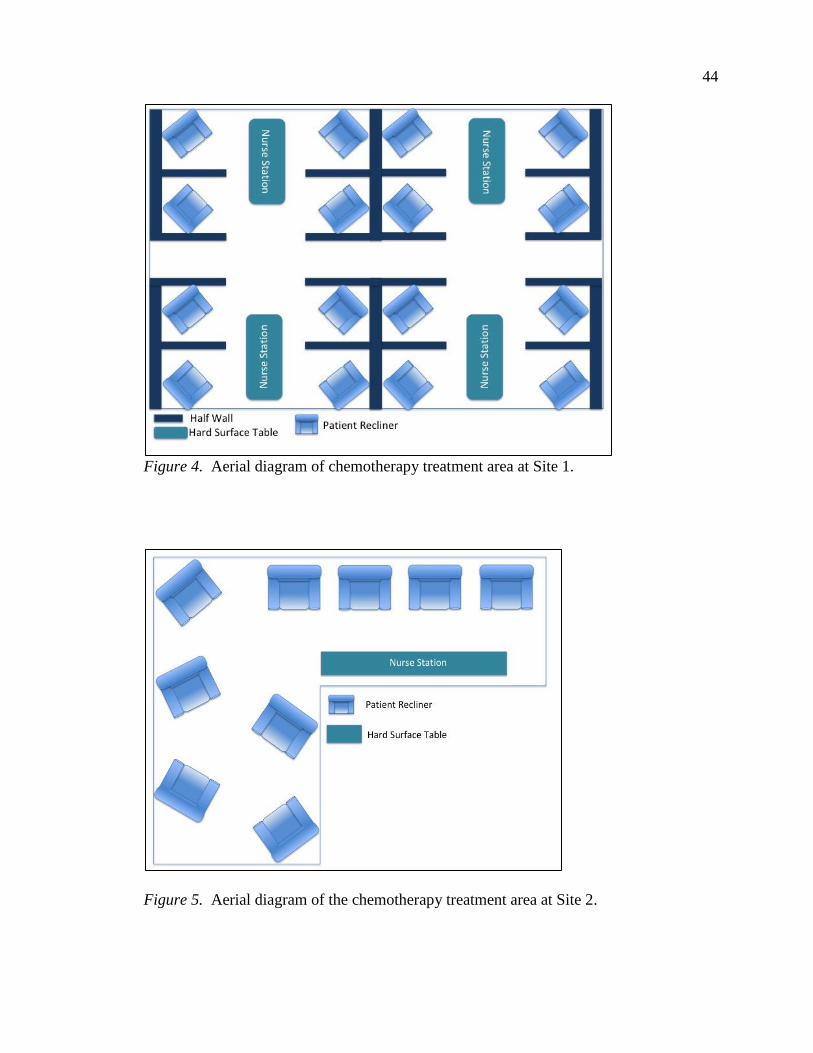
44
Figure 4. Aerial diagram of chemotherapy treatment area at Site 1.
Figure 5. Aerial diagram of the chemotherapy treatment area at Site 2.
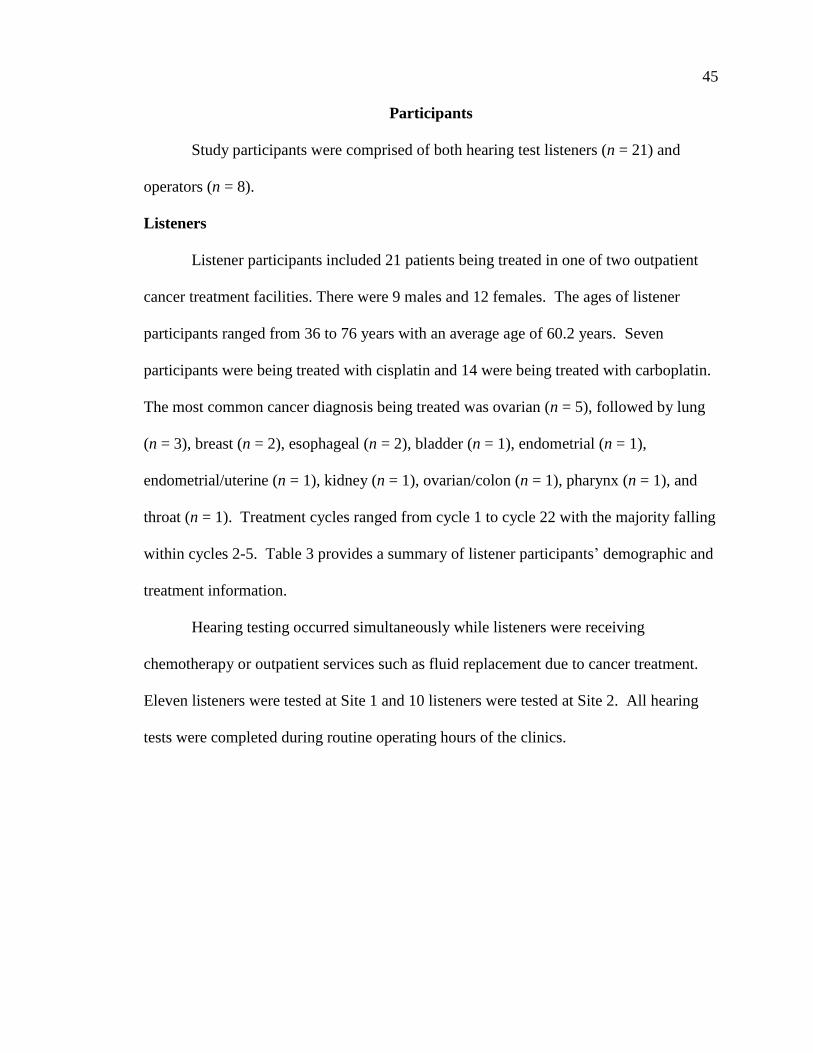
45
Participants
Study participants were comprised of both hearing test listeners (n = 21) and
operators (n = 8).
Listeners
Listener participants included 21 patients being treated in one of two outpatient
cancer treatment facilities. There were 9 males and 12 females. The ages of listener
participants ranged from 36 to 76 years with an average age of 60.2 years. Seven
participants were being treated with cisplatin and 14 were being treated with carboplatin.
The most common cancer diagnosis being treated was ovarian (n = 5), followed by lung
(n = 3), breast (n = 2), esophageal (n = 2), bladder (n = 1), endometrial (n = 1),
endometrial/uterine (n = 1), kidney (n = 1), ovarian/colon (n = 1), pharynx (n = 1), and
throat (n = 1). Treatment cycles ranged from cycle 1 to cycle 22 with the majority falling
within cycles 2-5. Table 3 provides a summary of listener participants’ demographic and
treatment information.
Hearing testing occurred simultaneously while listeners were receiving
chemotherapy or outpatient services such as fluid replacement due to cancer treatment.
Eleven listeners were tested at Site 1 and 10 listeners were tested at Site 2. All hearing
tests were completed during routine operating hours of the clinics.
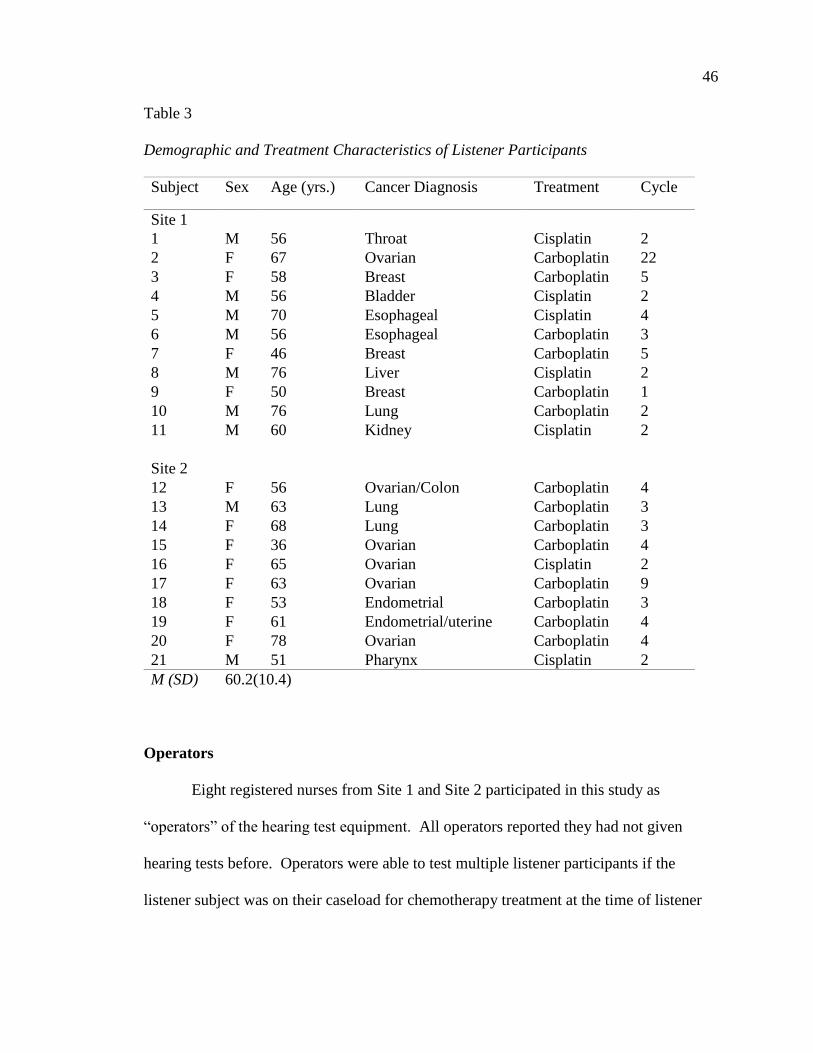
46
Table 3
Demographic and Treatment Characteristics of Listener Participants
Subject Sex Age (yrs.) Cancer Diagnosis Treatment Cycle
Site 1
1 M 56 Throat Cisplatin 2
2 F 67 Ovarian Carboplatin 22
3 F 58 Breast Carboplatin 5
4 M 56 Bladder Cisplatin 2
5 M 70 Esophageal Cisplatin 4
6 M 56 Esophageal Carboplatin 3
7 F 46 Breast Carboplatin 5
8 M 76 Liver Cisplatin 2
9 F 50 Breast Carboplatin 1
10 M 76 Lung Carboplatin 2
11 M 60 Kidney Cisplatin 2
Site 2
12 F 56 Ovarian/Colon Carboplatin 4
13 M 63 Lung Carboplatin 3
14 F 68 Lung Carboplatin 3
15 F 36 Ovarian Carboplatin 4
16 F 65 Ovarian Cisplatin 2
17 F 63 Ovarian Carboplatin 9
18 F 53 Endometrial Carboplatin 3
19 F 61 Endometrial/uterine Carboplatin 4
20 F 78 Ovarian Carboplatin 4
21 M 51 Pharynx Cisplatin 2
M (SD) 60.2(10.4)
Operators
Eight registered nurses from Site 1 and Site 2 participated in this study as
“operators” of the hearing test equipment. All operators reported they had not given
hearing tests before. Operators were able to test multiple listener participants if the
listener subject was on their caseload for chemotherapy treatment at the time of listener
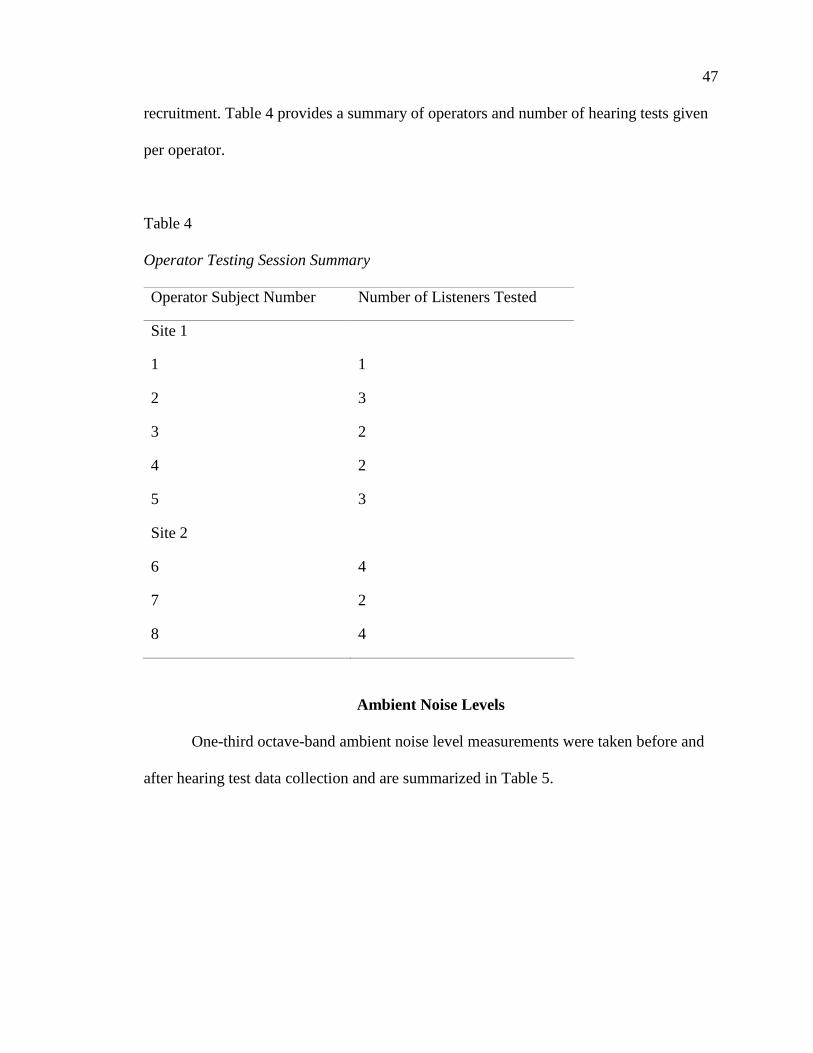
47
recruitment. Table 4 provides a summary of operators and number of hearing tests given
per operator.
Table 4
Operator Testing Session Summary
Operator Subject Number Number of Listeners Tested
Site 1
1 1
2 3
3 2
4 2
5 3
Site 2
6 4
7 2
8 4
Ambient Noise Levels
One-third octave-band ambient noise level measurements were taken before and
after hearing test data collection and are summarized in Table 5.
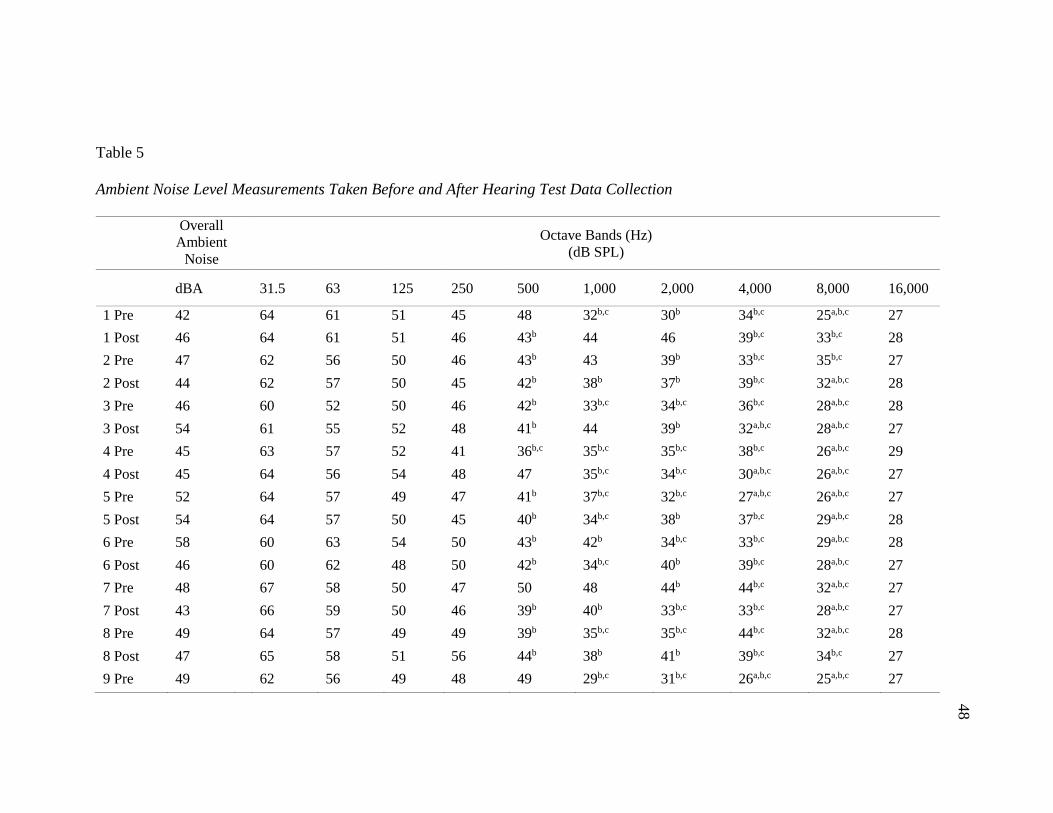
48
Table 5
Ambient Noise Level Measurements Taken Before and After Hearing Test Data Collection
Overall
Ambient
Noise
Octave Bands (Hz)
(dB SPL)
dBA
31.5 63 125 250 500 1,000 2,000 4,000 8,000 16,000
1 Pre 42 64 61 51 45 48 32b,c 30b 34b,c 25a,b,c 27
1 Post 46 64 61 51 46 43b 44 46 39b,c 33b,c 28
2 Pre 47 62 56 50 46 43b 43 39b 33b,c 35b,c 27
2 Post 44 62 57 50 45 42b 38b 37b 39b,c 32a,b,c 28
3 Pre 46 60 52 50 46 42b 33b,c 34b,c 36b,c 28a,b,c 28
3 Post 54 61 55 52 48 41b 44 39b 32a,b,c 28a,b,c 27
4 Pre 45 63 57 52 41 36b,c 35b,c 35b,c 38b,c 26a,b,c 29
4 Post 45 64 56 54 48 47 35b,c 34b,c 30a,b,c 26a,b,c 27
5 Pre 52 64 57 49 47 41b 37b,c 32b,c 27a,b,c 26a,b,c 27
5 Post 54 64 57 50 45 40b 34b,c 38b 37b,c 29a,b,c 28
6 Pre 58 60 63 54 50 43b 42b 34b,c 33b,c 29a,b,c 28
6 Post 46 60 62 48 50 42b 34b,c 40b 39b,c 28a,b,c 27
7 Pre 48 67 58 50 47 50 48 44b 44b,c 32a,b,c 27
7 Post 43 66 59 50 46 39b 40b 33b,c 33b,c 28a,b,c 27
8 Pre 49 64 57 49 49 39b 35b,c 35b,c 44b,c 32a,b,c 28
8 Post 47 65 58 51 56 44b 38b 41b 39b,c 34b,c 27
9 Pre 49 62 56 49 48 49 29b,c 31b,c 26a,b,c 25a,b,c 27
48
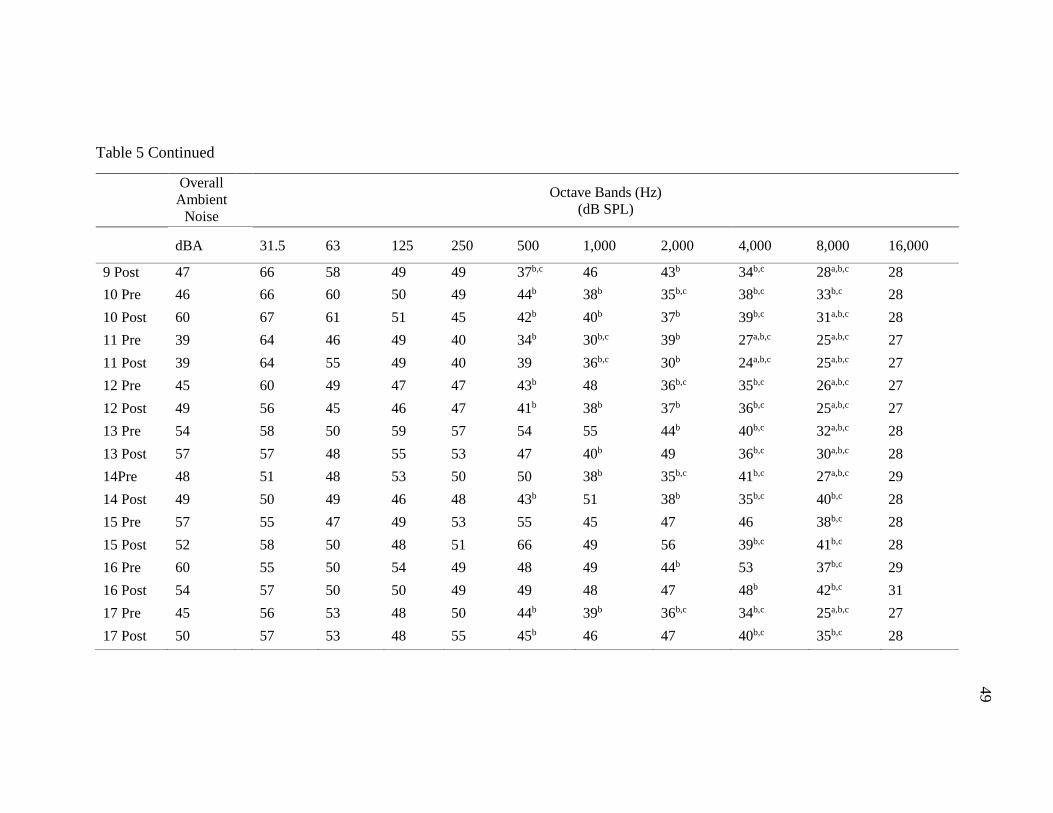
49
Table 5 Continued
Overall
Ambient
Noise
Octave Bands (Hz)
(dB SPL)
dBA
31.5 63 125 250 500 1,000 2,000 4,000 8,000 16,000
9 Post 47 66 58 49 49 37b,c 46 43b 34b,c 28a,b,c 28
10 Pre 46 66 60 50 49 44b 38b 35b,c 38b,c 33b,c 28
10 Post 60 67 61 51 45 42b 40b 37b 39b,c 31a,b,c 28
11 Pre 39 64 46 49 40 34b 30b,c 39b 27a,b,c 25a,b,c 27
11 Post 39 64 55 49 40 39 36b,c 30b 24a,b,c 25a,b,c 27
12 Pre 45 60 49 47 47 43b 48 36b,c 35b,c 26a,b,c 27
12 Post 49 56 45 46 47 41b 38b 37b 36b,c 25a,b,c 27
13 Pre 54 58 50 59 57 54 55 44b 40b,c 32a,b,c 28
13 Post 57 57 48 55 53 47 40b 49 36b,c 30a,b,c 28
14Pre 48 51 48 53 50 50 38b 35b,c 41b,c 27a,b,c 29
14 Post 49 50 49 46 48 43b 51 38b 35b,c 40b,c 28
15 Pre 57 55 47 49 53 55 45 47 46 38b,c 28
15 Post 52 58 50 48 51 66 49 56 39b,c 41b,c 28
16 Pre 60 55 50 54 49 48 49 44b 53 37b,c 29
16 Post 54 57 50 50 49 49 48 47 48b 42b,c 31
17 Pre 45 56 53 48 50 44b 39b 36b,c 34b,c 25a,b,c 27
17 Post 50 57 53 48 55 45b 46 47 40b,c 35b,c 28
49
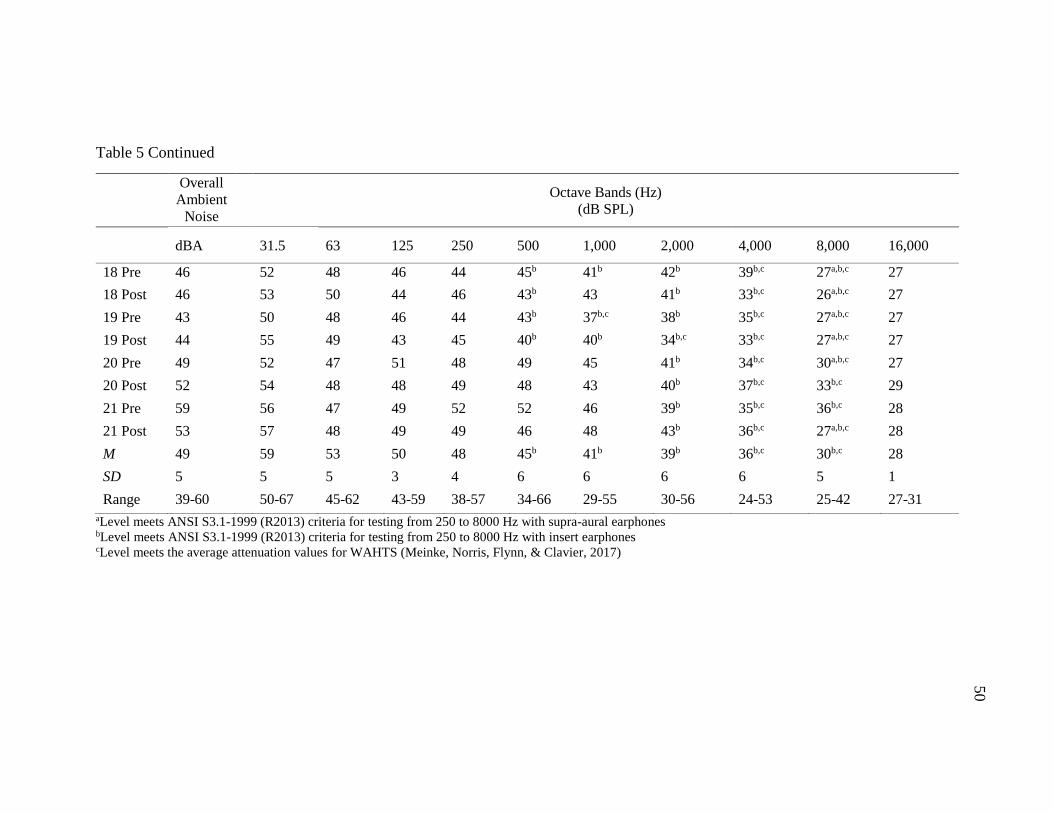
50
Table 5 Continued
Overall
Ambient
Noise
Octave Bands (Hz)
(dB SPL)
dBA
31.5 63 125 250 500 1,000 2,000 4,000 8,000 16,000
18 Pre 46 52 48 46 44 45b 41b 42b 39b,c 27a,b,c 27
18 Post 46 53 50 44 46 43b 43 41b 33b,c 26a,b,c 27
19 Pre 43 50 48 46 44 43b 37b,c 38b 35b,c 27a,b,c 27
19 Post 44 55 49 43 45 40b 40b 34b,c 33b,c 27a,b,c 27
20 Pre 49 52 47 51 48 49 45 41b 34b,c 30a,b,c 27
20 Post 52 54 48 48 49 48 43 40b 37b,c 33b,c 29
21 Pre 59 56 47 49 52 52 46 39b 35b,c 36b,c 28
21 Post 53 57 48 49 49 46 48 43b 36b,c 27a,b,c 28
M 49 59 53 50 48 45b 41b 39b 36b,c 30b,c 28
SD 5 5 5 3 4 6 6 6 6 5 1
Range 39-60 50-67 45-62 43-59 38-57 34-66 29-55 30-56 24-53 25-42 27-31
aLevel meets ANSI S3.1-1999 (R2013) criteria for testing from 250 to 8000 Hz with supra-aural earphones bLevel meets ANSI S3.1-1999 (R2013) criteria for testing from 250 to 8000 Hz with insert earphones cLevel meets the average attenuation values for WAHTS (Meinke, Norris, Flynn, & Clavier, 2017)
50
51
A Student’s t-test (paired, two-tailed) was utilized to compare pre- and post-
ambient noise measurements at each octave band. Using an alpha value of p = .05, there
were significant differences between ambient noise levels at 63 Hz at Site 1 and 125 Hz
at Site 2. All other pre- and post-ambient noise levels were not significantly different.
Because hearing test frequencies in this study were 1,000 to 20,000, the significantly
different ambient noise levels at 63 and 125 Hz were not critical to analysis or practical in
terms of determining the validity of hearing thresholds. Therefore, pre- and post-test
noise level measurements between the two sites were averaged together and mean values
were used to compare the two test locations using a two-tailed unpaired Student’s t-test
with an alpha value of p = .05. There was a significant difference in the overall dBA
value and for the octave-bands of 125, 8,000, and 16,000 Hz. Table 6 provides all p-
values for ambient noise measurement comparisons.
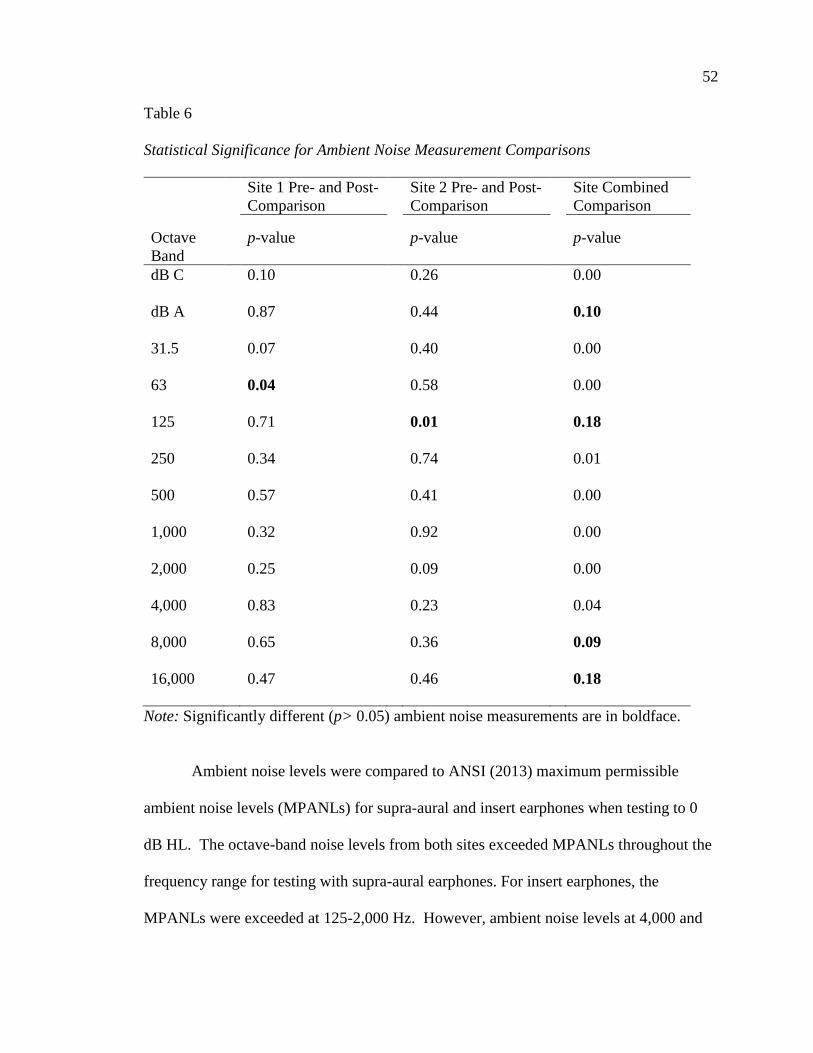
52
Table 6
Statistical Significance for Ambient Noise Measurement Comparisons
Site 1 Pre- and Post-
Comparison
Site 2 Pre- and Post-
Comparison
Site Combined
Comparison
Octave
Band
p-value
p-value
p-value
dB C 0.10 0.26 0.00
dB A 0.87 0.44 0.10
31.5 0.07 0.40 0.00
63 0.04 0.58 0.00
125 0.71 0.01 0.18
250 0.34 0.74 0.01
500 0.57 0.41 0.00
1,000 0.32 0.92 0.00
2,000 0.25 0.09 0.00
4,000 0.83 0.23 0.04
8,000 0.65 0.36 0.09
16,000 0.47 0.46 0.18
Note: Significantly different (p> 0.05) ambient noise measurements are in boldface.
Ambient noise levels were compared to ANSI (2013) maximum permissible
ambient noise levels (MPANLs) for supra-aural and insert earphones when testing to 0
dB HL. The octave-band noise levels from both sites exceeded MPANLs throughout the
frequency range for testing with supra-aural earphones. For insert earphones, the
MPANLs were exceeded at 125-2,000 Hz. However, ambient noise levels at 4,000 and
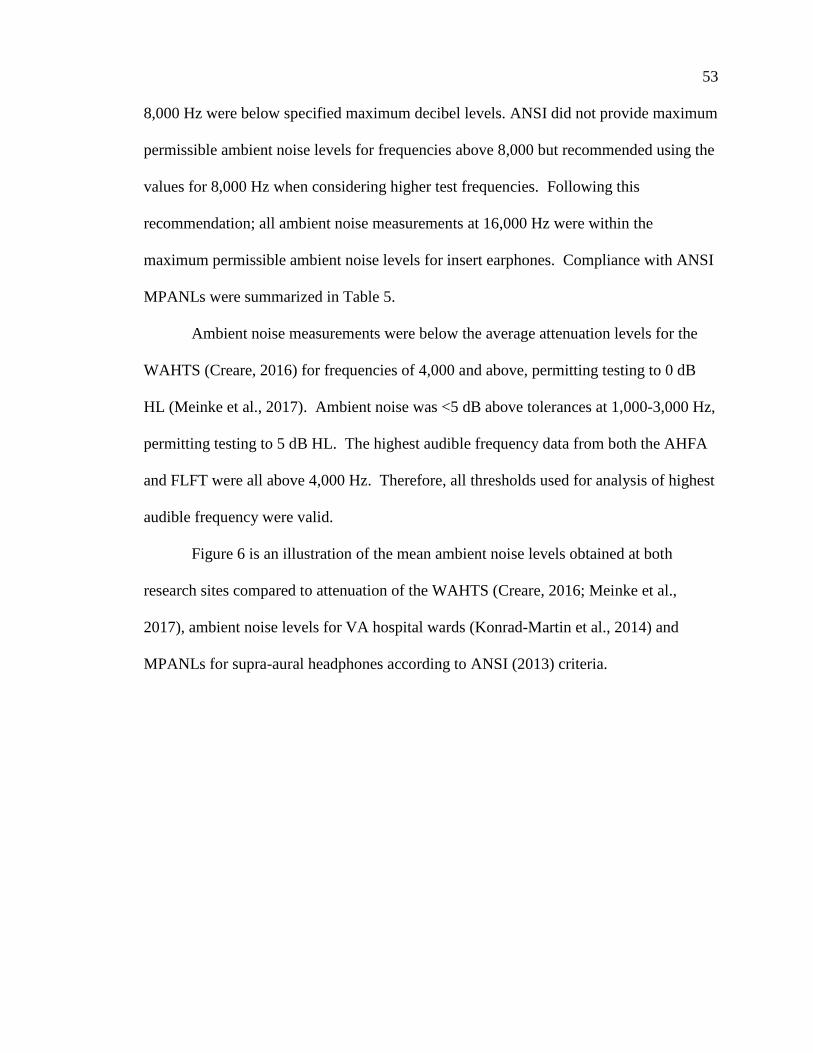
53
8,000 Hz were below specified maximum decibel levels. ANSI did not provide maximum
permissible ambient noise levels for frequencies above 8,000 but recommended using the
values for 8,000 Hz when considering higher test frequencies. Following this
recommendation; all ambient noise measurements at 16,000 Hz were within the
maximum permissible ambient noise levels for insert earphones. Compliance with ANSI
MPANLs were summarized in Table 5.
Ambient noise measurements were below the average attenuation levels for the
WAHTS (Creare, 2016) for frequencies of 4,000 and above, permitting testing to 0 dB
HL (Meinke et al., 2017). Ambient noise was <5 dB above tolerances at 1,000-3,000 Hz,
permitting testing to 5 dB HL. The highest audible frequency data from both the AHFA
and FLFT were all above 4,000 Hz. Therefore, all thresholds used for analysis of highest
audible frequency were valid.
Figure 6 is an illustration of the mean ambient noise levels obtained at both
research sites compared to attenuation of the WAHTS (Creare, 2016; Meinke et al.,
2017), ambient noise levels for VA hospital wards (Konrad-Martin et al., 2014) and
MPANLs for supra-aural headphones according to ANSI (2013) criteria.
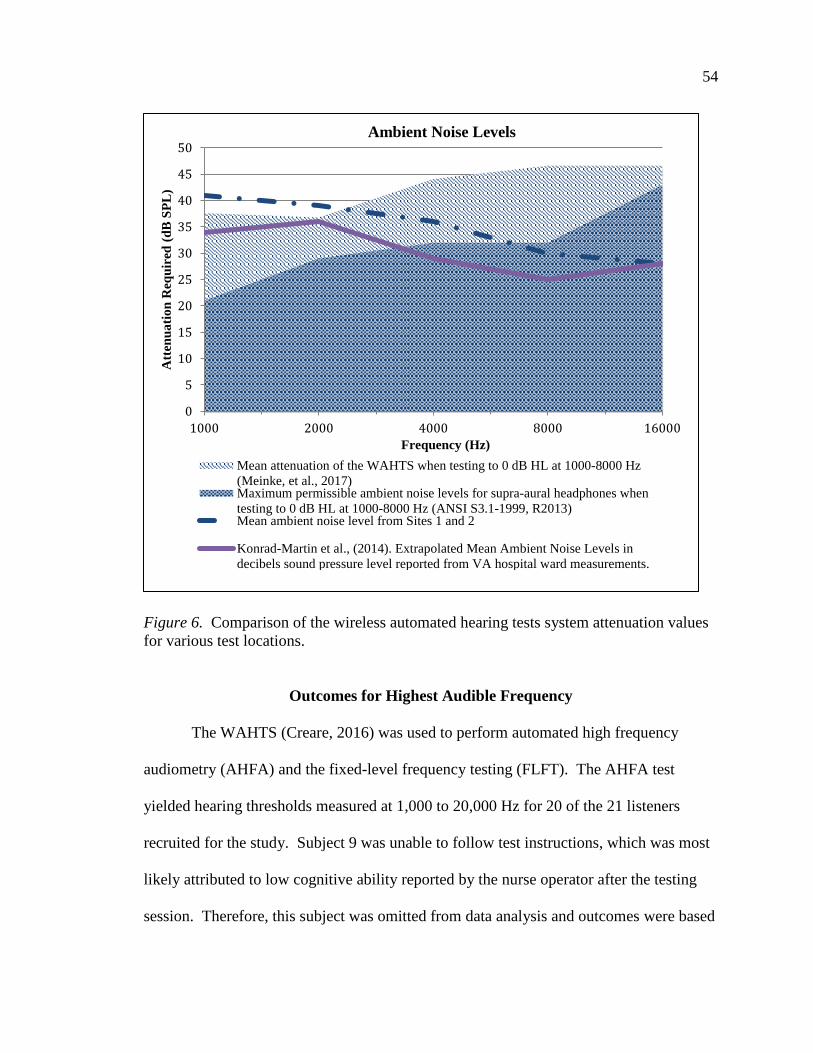
54
Figure 6. Comparison of the wireless automated hearing tests system attenuation values
for various test locations.
Outcomes for Highest Audible Frequency
The WAHTS (Creare, 2016) was used to perform automated high frequency
audiometry (AHFA) and the fixed-level frequency testing (FLFT). The AHFA test
yielded hearing thresholds measured at 1,000 to 20,000 Hz for 20 of the 21 listeners
recruited for the study. Subject 9 was unable to follow test instructions, which was most
likely attributed to low cognitive ability reported by the nurse operator after the testing
session. Therefore, this subject was omitted from data analysis and outcomes were based
0
5
10
15
20
25
30
35
40
45
50
1000 2000 4000 8000 16000
Att
enu
ati
on
Req
uir
ed (
dB
SP
L)
Frequency (Hz)
Ambient Noise Levels
Mean attenuation of the WAHTS when testing to 0 dB HL at 1000-8000 Hz
(Meinke, et al., 2017)Maximum permissible ambient noise levels for supra-aural headphones when
testing to 0 dB HL at 1000-8000 Hz (ANSI S3.1-1999, R2013)Mean ambient noise level from Sites 1 and 2
Konrad-Martin et al., (2014). Extrapolated Mean Ambient Noise Levels in
decibels sound pressure level reported from VA hospital ward measurements.
55
upon 20 listeners. The highest audible frequency (HAF) used in analysis was the highest
test frequency at which a valid hearing threshold could be measured using the two
audiological test methods (AHFA and FLFT). The highest audible hearing threshold
obtained with AHFA was converted from dB HL to dB SPL for data analysis and test
comparisons. The FLFT measurement yielded a single frequency value, representing the
highest audible frequency reported in Hz. This frequency value was used for data
analysis. All thresholds for the highest audible frequency measured with FLFT were at
80 dB SPL. Table 7 includes summary data for both the AHFA and FLFT outcomes.
Highest audible frequency differences were reported as AHFA minus FLFT.
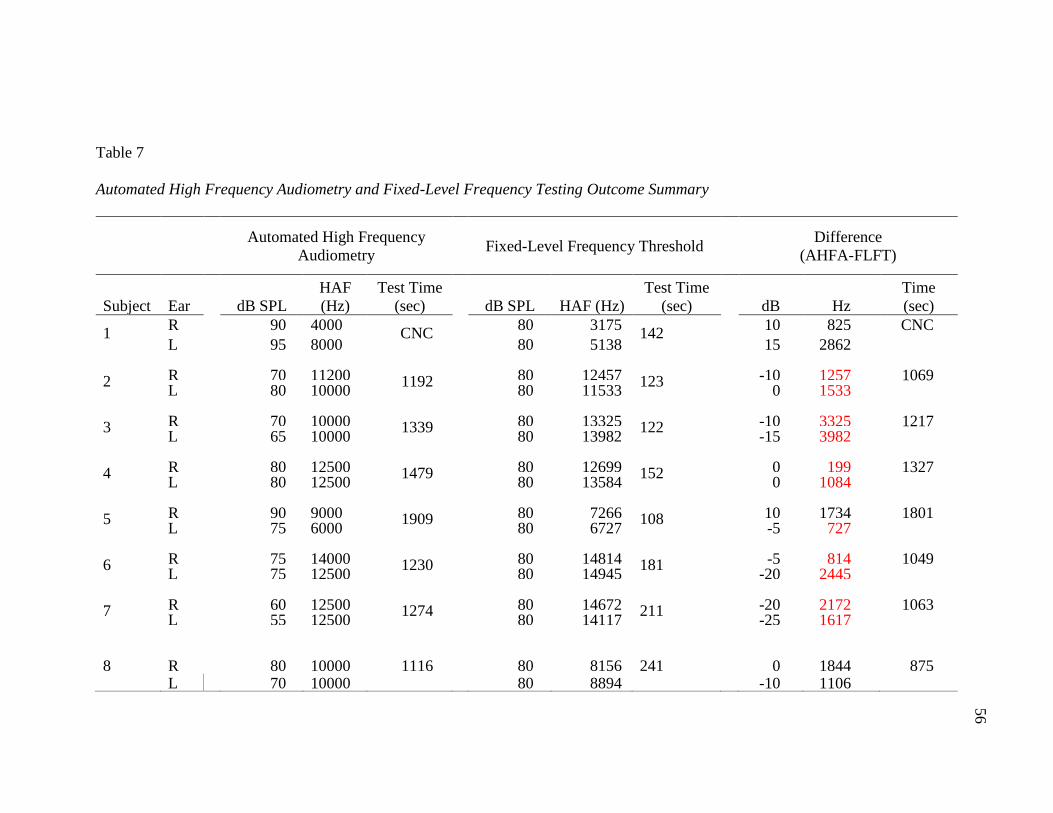
56
Table 7
Automated High Frequency Audiometry and Fixed-Level Frequency Testing Outcome Summary
Automated High Frequency
Audiometry
Fixed-Level Frequency Threshold
Difference
(AHFA-FLFT)
Subject Ear
dB SPL
HAF
(Hz)
Test Time
(sec)
dB SPL HAF (Hz)
Test Time
(sec)
dB Hz
Time
(sec)
1 R 90 4000 CNC
80 3175 142
10 825 CNC
L 95 8000 80 5138 15 2862
2 R 70 11200 1192 80 12457 123 -10 1257 1069 L 80 10000 80 11533 0 1533
3 R 70 10000 1339 80 13325 122 -10 3325 1217 L 65 10000 80 13982 -15 3982
4 R 80 12500 1479 80 12699 152 0 199 1327 L 80 12500 80 13584 0 1084
5 R 90 9000 1909 80 7266 108 10 1734 1801 L 75 6000 80 6727 -5 727
6 R 75 14000 1230 80 14814 181 -5 814 1049 L 75 12500 80 14945 -20 2445
7 R 60 12500 1274 80 14672 211 -20 2172 1063 L 55 12500 80 14117 -25 1617
8 R 80 10000 1116 80 8156 241 0 1844 875 L 70 10000 80 8894 -10 1106
56
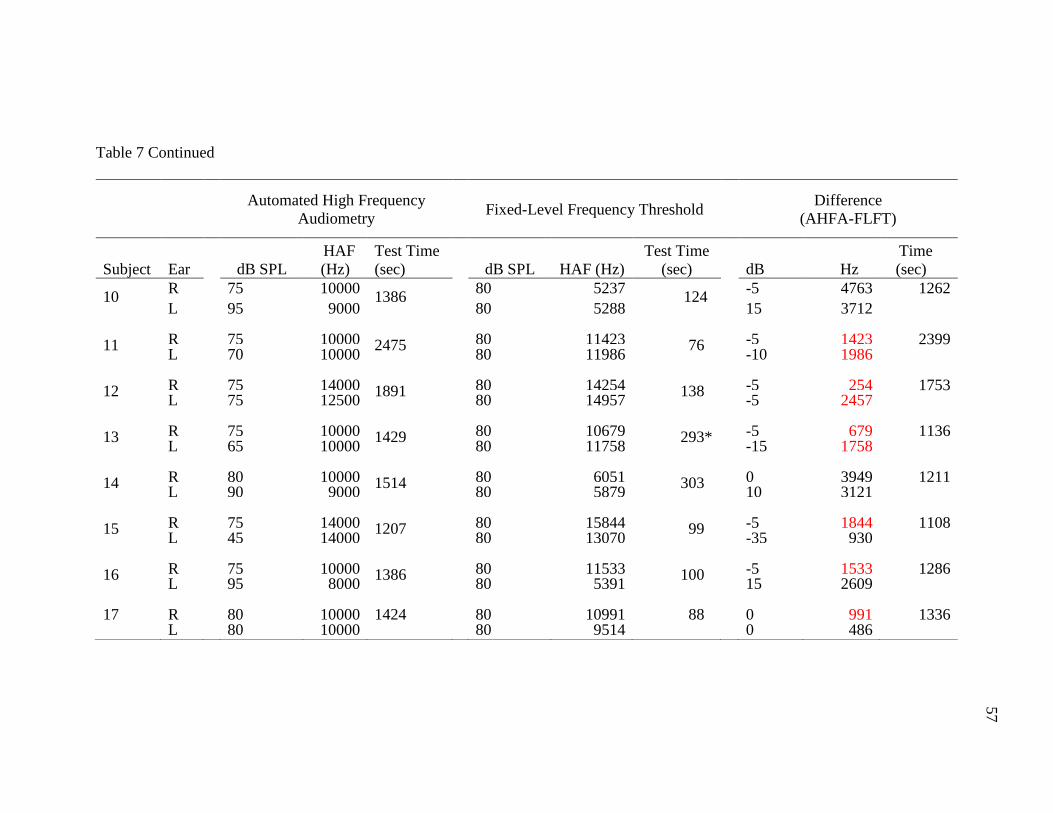
57
Table 7 Continued
Automated High Frequency
Audiometry
Fixed-Level Frequency Threshold
Difference
(AHFA-FLFT)
Subject Ear
dB SPL
HAF
(Hz)
Test Time
(sec)
dB SPL HAF (Hz)
Test Time
(sec)
dB Hz
Time
(sec)
10 R 75 10000
1386 80 5237
124 -5 4763 1262
L 95 9000 80 5288 15 3712
11 R 75 10000 2475 80 11423 76 -5 1423 2399 L 70 10000 80 11986 -10 1986
12 R 75 14000 1891 80 14254 138 -5 254 1753 L 75 12500 80 14957 -5 2457
13 R 75 10000 1429 80 10679 293* -5 679 1136 L 65 10000 80 11758 -15 1758
14 R 80 10000 1514 80 6051 303 0 3949 1211 L 90 9000 80 5879 10 3121
15 R 75 14000 1207 80 15844 99 -5 1844 1108 L 45 14000 80 13070 -35 930
16 R 75 10000 1386 80 11533 100 -5 1533 1286 L 95 8000 80 5391 15 2609
17 R 80 10000 1424 80 10991 88 0 991 1336 L 80 10000 80 9514 0 486
57
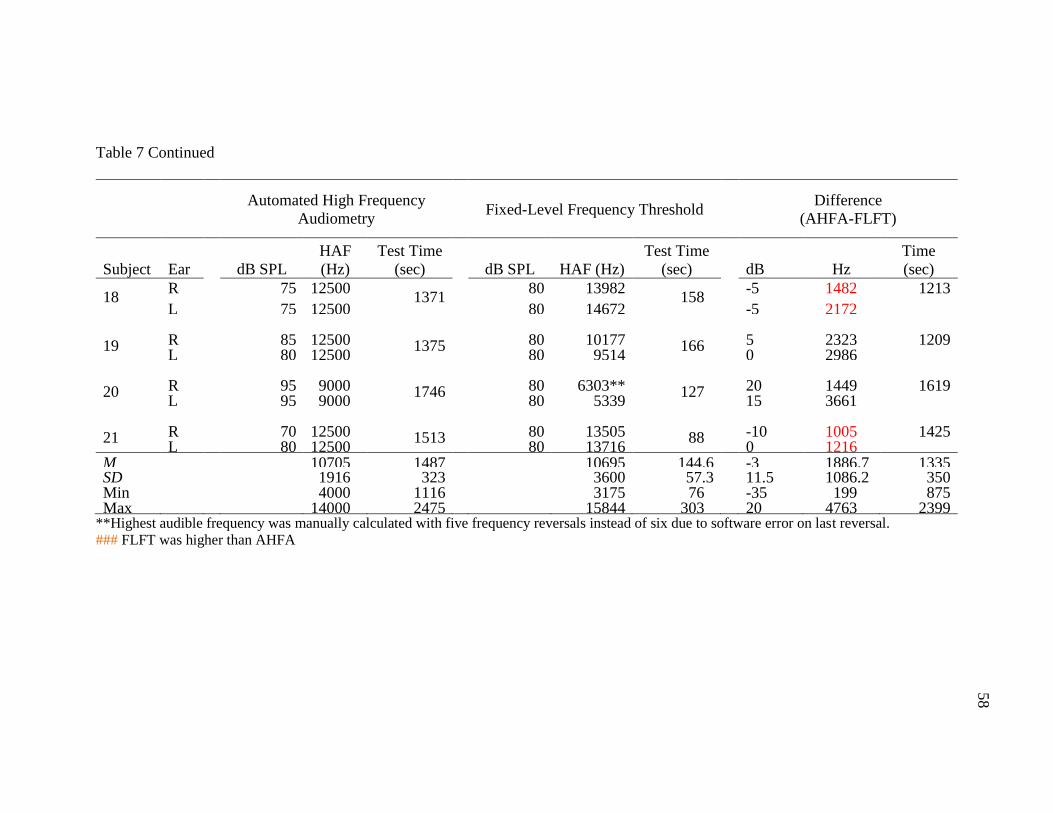
58
Table 7 Continued
Automated High Frequency
Audiometry
Fixed-Level Frequency Threshold
Difference
(AHFA-FLFT)
Subject Ear
dB SPL
HAF
(Hz)
Test Time
(sec)
dB SPL HAF (Hz)
Test Time
(sec)
dB Hz
Time
(sec)
18 R 75 12500
1371 80 13982
158 -5 1482 1213
L 75 12500 80 14672 -5 2172
19 R 85 12500 1375 80 10177 166 5 2323 1209 L 80 12500 80 9514 0 2986
20 R 95 9000 1746 80 6303** 127 20 1449 1619 L 95 9000 80 5339 15 3661
21 R 70 12500 1513 80 13505 88 -10 1005 1425 L 80 12500 80 13716 0 1216
M
10705 1487
10695 144.6 -3 1886.7 1335 SD
1916 323
3600 57.3 11.5 1086.2 350
Min
4000 1116
3175 76 -35 199 875 Max
14000 2475
15844 303 20 4763 2399
**Highest audible frequency was manually calculated with five frequency reversals instead of six due to software error on last reversal.
### FLFT was higher than AHFA
58
59
Highest Audible Frequency
Comparison
The range of frequency differences between the AHFA and FLFT was 199-4,763
Hz. The mean difference in the highest audible frequency identified by each hearing test
was 1,886.7 Hz with neither the AHFA nor FLFT consistently identifying the highest
audible frequency higher or lower than the other. Figure 7 provides a graphic illustration
of the highest audible frequency identified by both test methods for each subject.
A 2-tailed Wilcoxon signed ranks test was completed to compare the highest
audible frequency identified by AHFA and FLFT automated test procedures. There was
no significant difference between the two test methods (p = 0.995). Therefore, the highest
audible frequency elicited from the FLFT and AHFA is not statistically nor significantly
different. A Wilcoxon signed-ranks test was also utilized to further analyze ear
differences in highest audible frequency. In right ears, the difference in highest audible
frequency was not statistically nor significantly different (p = 0.926). The previous
statement was also true for left ears (p = 0.911).
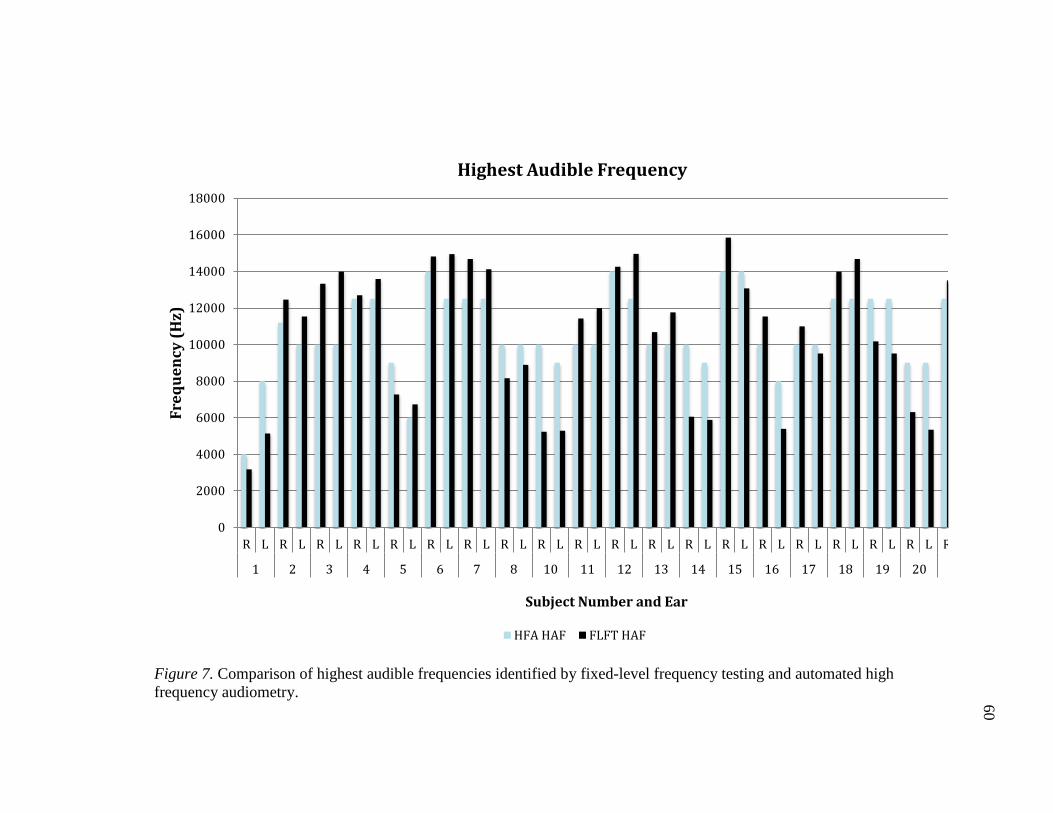
60
0
2000
4000
6000
8000
10000
12000
14000
16000
18000
R L R L R L R L R L R L R L R L R L R L R L R L R L R L R L R L R L R L R L R
1 2 3 4 5 6 7 8 10 11 12 13 14 15 16 17 18 19 20 21
Fre
qu
en
cy (
Hz)
Subject Number and Ear
Highest Audible Frequency
HFA HAF FLFT HAF
Figure 7. Comparison of highest audible frequencies identified by fixed-level frequency testing and automated high
frequency audiometry.
60
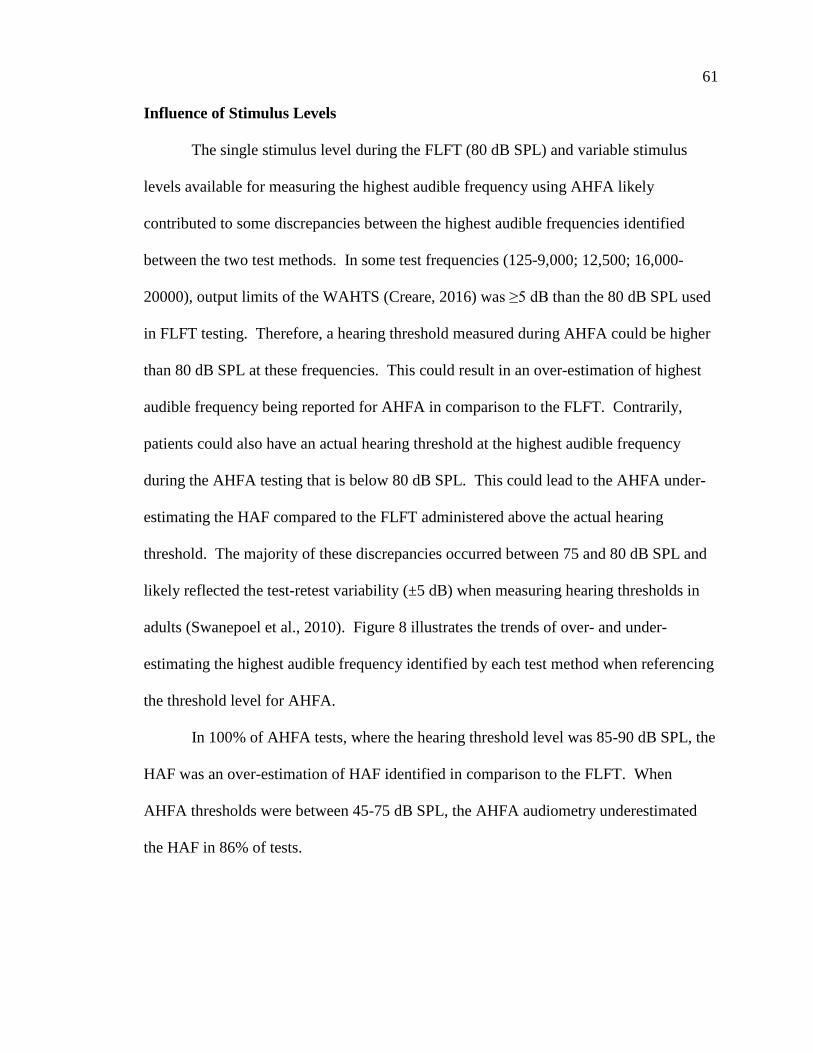
61
Influence of Stimulus Levels
The single stimulus level during the FLFT (80 dB SPL) and variable stimulus
levels available for measuring the highest audible frequency using AHFA likely
contributed to some discrepancies between the highest audible frequencies identified
between the two test methods. In some test frequencies (125-9,000; 12,500; 16,000-
20000), output limits of the WAHTS (Creare, 2016) was ≥5 dB than the 80 dB SPL used
in FLFT testing. Therefore, a hearing threshold measured during AHFA could be higher
than 80 dB SPL at these frequencies. This could result in an over-estimation of highest
audible frequency being reported for AHFA in comparison to the FLFT. Contrarily,
patients could also have an actual hearing threshold at the highest audible frequency
during the AHFA testing that is below 80 dB SPL. This could lead to the AHFA under-
estimating the HAF compared to the FLFT administered above the actual hearing
threshold. The majority of these discrepancies occurred between 75 and 80 dB SPL and
likely reflected the test-retest variability (±5 dB) when measuring hearing thresholds in
adults (Swanepoel et al., 2010). Figure 8 illustrates the trends of over- and under-
estimating the highest audible frequency identified by each test method when referencing
the threshold level for AHFA.
In 100% of AHFA tests, where the hearing threshold level was 85-90 dB SPL, the
HAF was an over-estimation of HAF identified in comparison to the FLFT. When
AHFA thresholds were between 45-75 dB SPL, the AHFA audiometry underestimated
the HAF in 86% of tests.
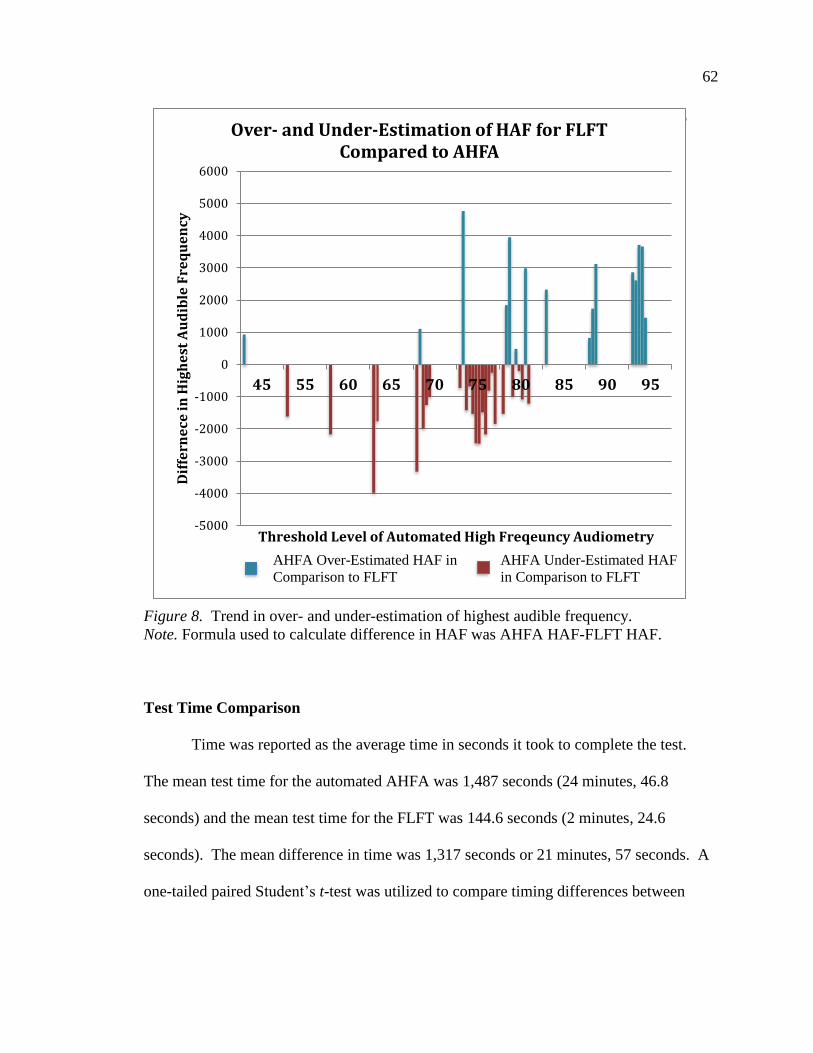
62
Figure 8. Trend in over- and under-estimation of highest audible frequency.
Note. Formula used to calculate difference in HAF was AHFA HAF-FLFT HAF.
Test Time Comparison
Time was reported as the average time in seconds it took to complete the test.
The mean test time for the automated AHFA was 1,487 seconds (24 minutes, 46.8
seconds) and the mean test time for the FLFT was 144.6 seconds (2 minutes, 24.6
seconds). The mean difference in time was 1,317 seconds or 21 minutes, 57 seconds. A
one-tailed paired Student’s t-test was utilized to compare timing differences between
At 9000 Hz and below, the EHFA identified a higher HAF in comparison to
the
-5000
-4000
-3000
-2000
-1000
0
1000
2000
3000
4000
5000
6000
45 55 60 65 70 75 80 85 90 95
Dif
fern
ece
in
Hig
he
st A
ud
ible
Fre
qu
en
cy
Threshold Level of Automated High Freqeuncy Audiometry
Over- and Under-Estimation of HAF for FLFT Compared to AHFA
AHFA Over-Estimated HAF in
Comparison to FLFT
AHFA Under-Estimated HAF
in Comparison to FLFT
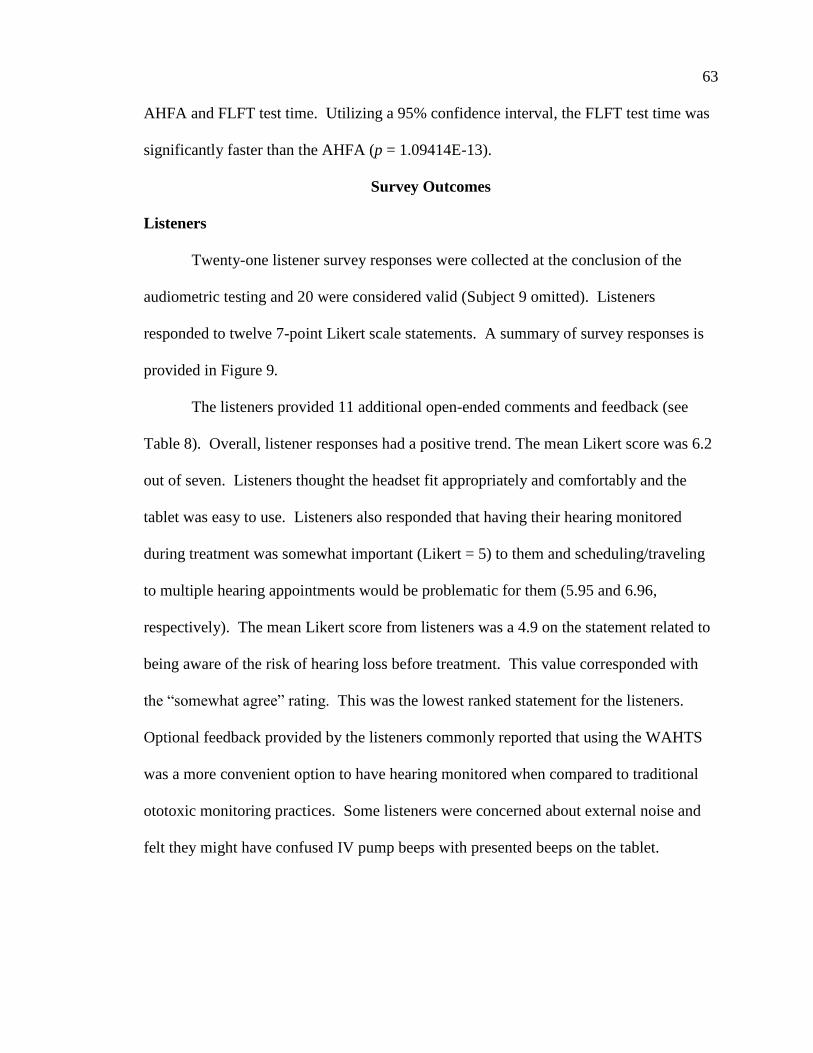
63
AHFA and FLFT test time. Utilizing a 95% confidence interval, the FLFT test time was
significantly faster than the AHFA (p = 1.09414E-13).
Survey Outcomes
Listeners
Twenty-one listener survey responses were collected at the conclusion of the
audiometric testing and 20 were considered valid (Subject 9 omitted). Listeners
responded to twelve 7-point Likert scale statements. A summary of survey responses is
provided in Figure 9.
The listeners provided 11 additional open-ended comments and feedback (see
Table 8). Overall, listener responses had a positive trend. The mean Likert score was 6.2
out of seven. Listeners thought the headset fit appropriately and comfortably and the
tablet was easy to use. Listeners also responded that having their hearing monitored
during treatment was somewhat important (Likert = 5) to them and scheduling/traveling
to multiple hearing appointments would be problematic for them (5.95 and 6.96,
respectively). The mean Likert score from listeners was a 4.9 on the statement related to
being aware of the risk of hearing loss before treatment. This value corresponded with
the “somewhat agree” rating. This was the lowest ranked statement for the listeners.
Optional feedback provided by the listeners commonly reported that using the WAHTS
was a more convenient option to have hearing monitored when compared to traditional
ototoxic monitoring practices. Some listeners were concerned about external noise and
felt they might have confused IV pump beeps with presented beeps on the tablet.
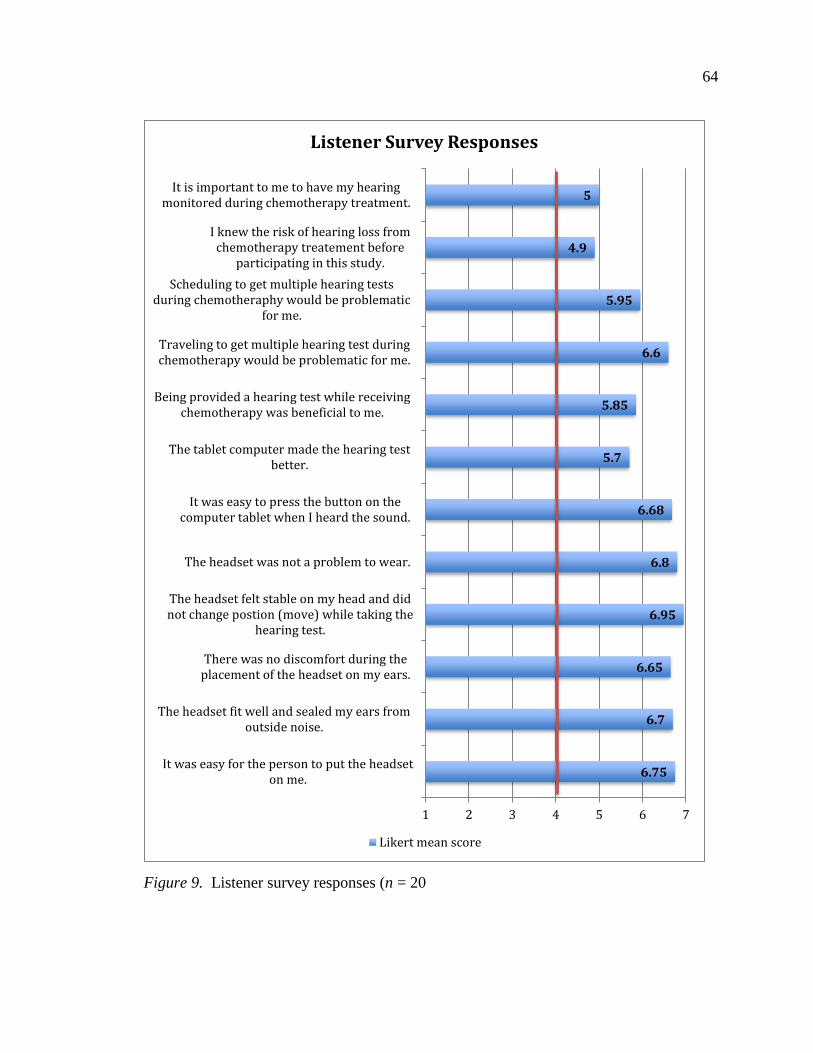
64
Figure 9. Listener survey responses (n = 20
6.75
6.7
6.65
6.95
6.8
6.68
5.7
5.85
6.6
5.95
4.9
5
1 2 3 4 5 6 7
It was easy for the person to put the headseton me.
The headset fit well and sealed my ears fromoutside noise.
There was no discomfort during theplacement of the headset on my ears.
The headset felt stable on my head and didnot change postion (move) while taking the
hearing test.
The headset was not a problem to wear.
It was easy to press the button on thecomputer tablet when I heard the sound.
The tablet computer made the hearing testbetter.
Being provided a hearing test while receivingchemotherapy was beneficial to me.
Traveling to get multiple hearing test duringchemotherapy would be problematic for me.
Scheduling to get multiple hearing testsduring chemotheraphy would be problematic
for me.
I knew the risk of hearing loss fromchemotherapy treatement before
participating in this study.
It is important to me to have my hearingmonitored during chemotherapy treatment.
Listener Survey Responses
Likert mean score
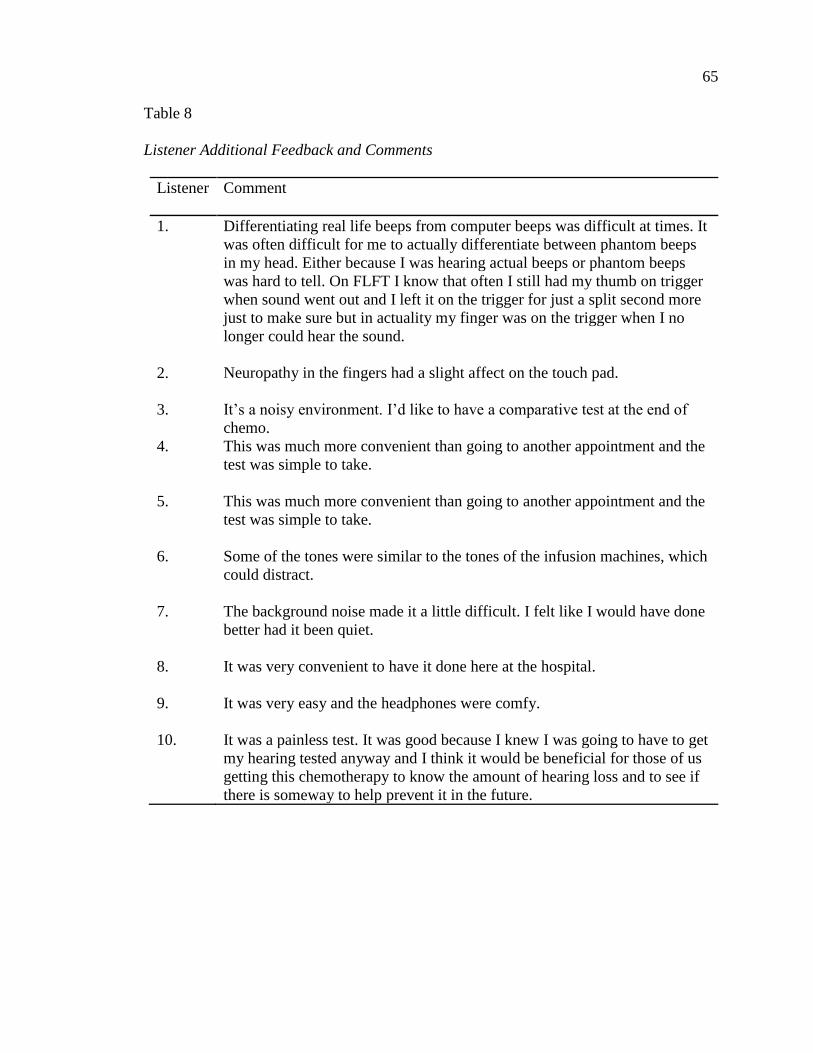
65
Table 8
Listener Additional Feedback and Comments
Listener Comment
1. Differentiating real life beeps from computer beeps was difficult at times. It
was often difficult for me to actually differentiate between phantom beeps
in my head. Either because I was hearing actual beeps or phantom beeps
was hard to tell. On FLFT I know that often I still had my thumb on trigger
when sound went out and I left it on the trigger for just a split second more
just to make sure but in actuality my finger was on the trigger when I no
longer could hear the sound.
2. Neuropathy in the fingers had a slight affect on the touch pad.
3. It’s a noisy environment. I’d like to have a comparative test at the end of
chemo.
4. This was much more convenient than going to another appointment and the
test was simple to take.
5. This was much more convenient than going to another appointment and the
test was simple to take.
6. Some of the tones were similar to the tones of the infusion machines, which
could distract.
7. The background noise made it a little difficult. I felt like I would have done
better had it been quiet.
8. It was very convenient to have it done here at the hospital.
9. It was very easy and the headphones were comfy.
10. It was a painless test. It was good because I knew I was going to have to get
my hearing tested anyway and I think it would be beneficial for those of us
getting this chemotherapy to know the amount of hearing loss and to see if
there is someway to help prevent it in the future.
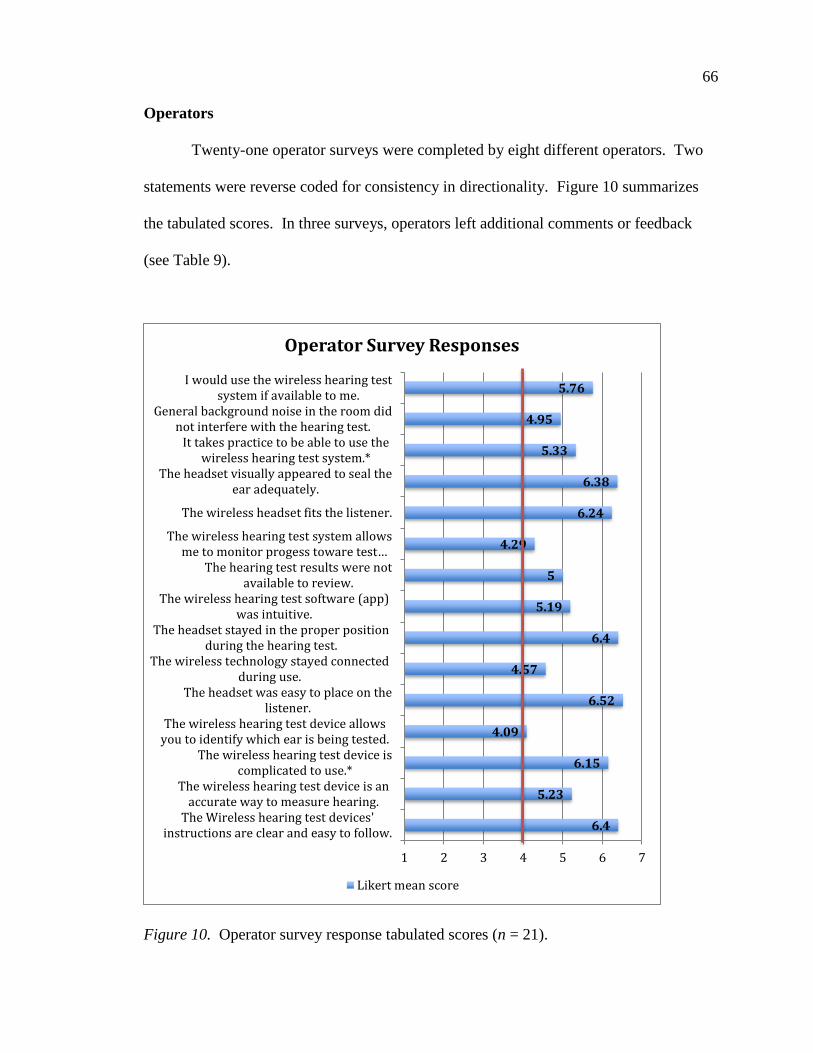
66
Operators
Twenty-one operator surveys were completed by eight different operators. Two
statements were reverse coded for consistency in directionality. Figure 10 summarizes
the tabulated scores. In three surveys, operators left additional comments or feedback
(see Table 9).
Figure 10. Operator survey response tabulated scores (n = 21).
6.4
5.23
6.15
4.09
6.52
4.57
6.4
5.19
5
4.29
6.24
6.38
5.33
4.95
5.76
1 2 3 4 5 6 7
The Wireless hearing test devices'instructions are clear and easy to follow.
The wireless hearing test device is anaccurate way to measure hearing.
The wireless hearing test device iscomplicated to use.*
The wireless hearing test device allowsyou to identify which ear is being tested.
The headset was easy to place on thelistener.
The wireless technology stayed connectedduring use.
The headset stayed in the proper positionduring the hearing test.
The wireless hearing test software (app)was intuitive.
The hearing test results were notavailable to review.
The wireless hearing test system allowsme to monitor progess toware test…
The wireless headset fits the listener.
The headset visually appeared to seal theear adequately.
It takes practice to be able to use thewireless hearing test system.*
General background noise in the room didnot interfere with the hearing test.
I would use the wireless hearing testsystem if available to me.
Operator Survey Responses
Likert mean score
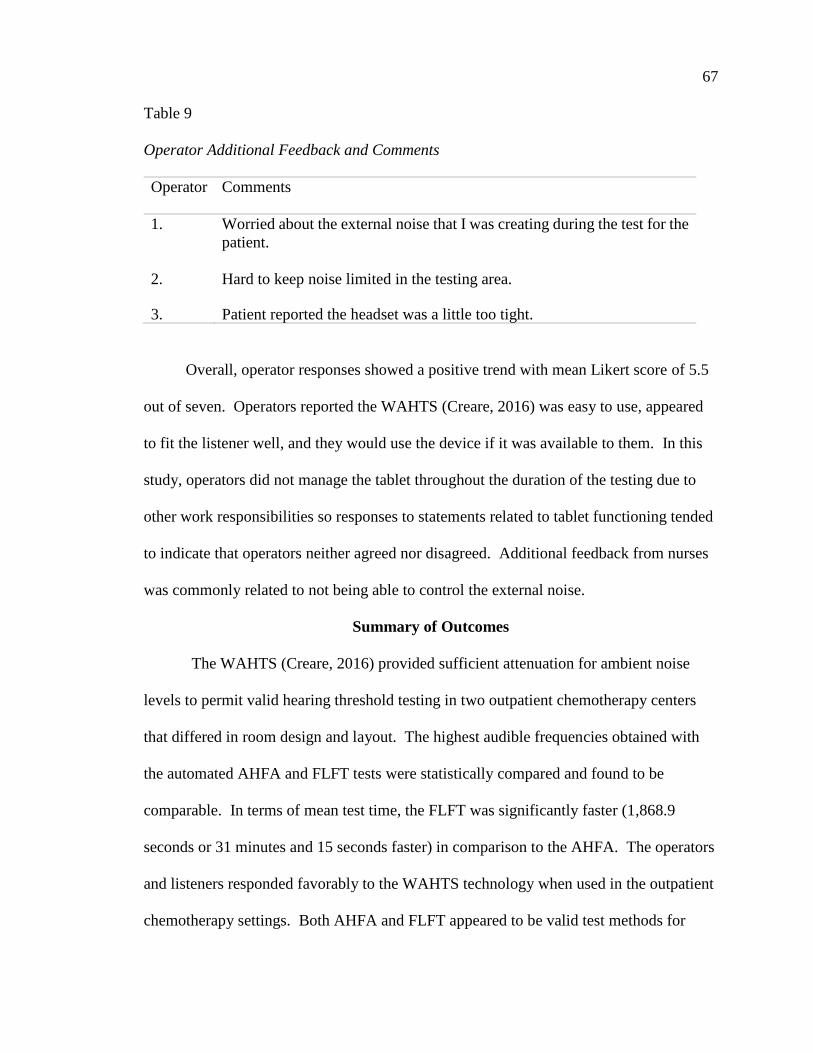
67
Table 9
Operator Additional Feedback and Comments
Operator Comments
1. Worried about the external noise that I was creating during the test for the
patient.
2. Hard to keep noise limited in the testing area.
3. Patient reported the headset was a little too tight.
Overall, operator responses showed a positive trend with mean Likert score of 5.5
out of seven. Operators reported the WAHTS (Creare, 2016) was easy to use, appeared
to fit the listener well, and they would use the device if it was available to them. In this
study, operators did not manage the tablet throughout the duration of the testing due to
other work responsibilities so responses to statements related to tablet functioning tended
to indicate that operators neither agreed nor disagreed. Additional feedback from nurses
was commonly related to not being able to control the external noise.
Summary of Outcomes
The WAHTS (Creare, 2016) provided sufficient attenuation for ambient noise
levels to permit valid hearing threshold testing in two outpatient chemotherapy centers
that differed in room design and layout. The highest audible frequencies obtained with
the automated AHFA and FLFT tests were statistically compared and found to be
comparable. In terms of mean test time, the FLFT was significantly faster (1,868.9
seconds or 31 minutes and 15 seconds faster) in comparison to the AHFA. The operators
and listeners responded favorably to the WAHTS technology when used in the outpatient
chemotherapy settings. Both AHFA and FLFT appeared to be valid test methods for
68
identifying the highest audible frequency by nursing staff for patients being treated in
outpatient cancer treatment centers. The FLFT might be preferable as a screening
protocol due to the significantly faster test administration.
69
CHAPTER V
DISCUSSION
Ambient Noise
Ambient noise was measured at two outpatient cancer treatment centers with
different floor plans. Site 1 was in ‘pod’ design where half walls surrounded the patient
and Site 2 had an open layout with chairs lined up beside each other. Sources of ambient
noise were other patients talking nearby, nurses working in surrounding spaces, and IV
pump alarms. No heating, ventilation, and air conditioning systems were audible by the
researcher but might have contributed to differences in low frequency ambient noise (63-
and 125 Hz).
Due to the level of ambient noise in the treatment centers, hearing thresholds
could not be measured accurately to 0 dB HL across all test frequencies (250-20,000)
with all transducers (insert earphones, supra-aural headphones, WAHTS; ANSI, 2013;
Meinke et al., 2017). Ambient noise has a greater effect on lower test frequencies.
However, lower frequencies were not as critical for testing patients exposed to ototoxic
chemotherapeutics. This was due to the initial onset of the hearing loss typically
beginning in the higher frequencies (Kopelman et al., 1988; Punnett et al., 2004).
Therefore, in the limited sample of two out-patient centers, the attenuation of the
WAHTS (Creare, 2016) allowed for accurate testing of thresholds down to 0 dB HL at
4,000 Hz and above. Thresholds were obtained at 5 dB HL for the test frequencies of
70
250-3,000 when using the WAHTS. This was still sufficient for identifying an ototoxic
threshold shift of 15 dB at a single frequency or 10 dB at adjacent frequencies as
specified by ASHA (1994), especially since changes in threshold typically influence the
higher test frequencies and older adults seldom have thresholds at 0 dB HL at all test
frequencies.
Testing could potentially be completed in exam rooms before chemotherapy
treatment, especially if using the short-duration FLFT approach. This would be of
benefit to patients who have tinnitus or who are too distracted in the treatment
environment and prefer a quieter listening environment. Ambient noise levels in the
exam rooms were not measured but were presumed to be lower in level due to isolation
from other noise sources (patients, nursing staff, and medical equipment). Patients were
often seen in exam rooms prior to being moved to the treatment area so it would be
feasible to have them take the hearing test at that time. However, it would be important
to have ambient noise measured before selecting which rooms would be best for
audiological testing to take place and reconcile those levels with the WAHTS (Creare,
2016) attenuation values.
Extrapolated mean ambient noise levels from research at a VA hospital ward
(Konrad-Martin et al., 2014) were lower in all frequencies in comparison to ambient
noise levels from Site 1 and 2 in the current research. Attenuation of the WAHTS
(Creare, 2016) would allow for testing to 0 dB HL at 1,000-16,000 Hz in the VA hospital
ward. Potential causes of the lower mean ambient noise levels in the VA hospital ward
were the testing being conducted in a room secluded from other patients and their
families as well as nurses working on nearby patients. However, specific test
71
environment information was not included in the methodology of the Konrad-Martin et
al. (2014) study.
One common concern voiced in the listener survey was interference between the
IV pump monitors’ alarm tones with test stimuli presentations. After becoming aware of
this concern, the alert tones on the IV pumps were measured with a sound level meter.
Thirty-second averages were sampled using dBA. Ten measurements (five by each ear)
were taken in the approximate location of where the patient’s ears would be during
chemotherapy treatment. The measurements were recorded as the “near ear” and the “far
ear” with regard to physical placement of the IV equipment. The maximum sound level
for each sample was averaged to calculate the sound pressure level for the IV pump
alarm. This approach allowed for a more accurate representation of the alarm level
because the breaks in between the alarm beeps would artificially reduce the average
sound level of the alarm. The average maximum sound level for the ear closest to the IV
pump was 78.4 dBA and 77.0 dBA for the “far” ear. Intermittent beeps of 77.0-78.4 dBA
could have potentially artificially elevated thresholds and interfered with listener
attention. A trained operator or listener could pause the WAHTS (Creare, 2016) pending
silencing the alarm. Another potential solution to relieve this problem, which is currently
being investigated by Creare (2016), would be to implement a sound level meter built
into the headset that continually sampled ambient noise and automated software that
temporarily paused testing when MPANLS were exceeded.
Technology Implementation
Implementing the technology into the outpatient cancer centers presented certain
challenges due to the characteristics of the environment as well as characteristics of the
72
test populations. At both test locations, the tablet and headset dropped Bluetooth
connection on multiple occasions and, occasionally, multiple times during a test session.
Throughout testing, the tablet had to be reconnected to the headset at least one time for
14 of the 20 participants and had to be reconnected five times for one participant. Due to
this technological difficulty, the researcher had to remain close to the subject during
testing to be ready to troubleshoot connection issues. Recently, Creare (2016)
determined the dropped Bluetooth issue was a hardware bug for the Nexus tablet
computer model used in this study and has been resolved with newer hardware releases
by Nexus.
Chemotherapy Patient Factors
Written instructions were on the tablet for the listener subjects to follow.
However, they often had to put on eyeglasses to be able to read the small print.
Ramsdale and Charman (1989) reported the static response of the eye begins to decline at
age 45; thus, the incidence of presbyopia increases after age 45 and the need of reading
glasses increases. The mean age of participants in the current capstone was 60 years so
consequently, it was common for participants to require reading glasses to read the
written instructions on the tablet. This led to the headset having to be placed on
participants’ heads multiple times throughout testing. Testing would have been more
seamless if recorded test instructions were built into the device in addition to the written
instructions.
No patient was too ill to complete testing. Overall, patients had a very positive
response to the testing based on survey responses. Patients who were being administered
carboplatin were also commonly receiving taxol. Benadryl could be effective in
73
counteracting the negative physical reactions from taxol (Carretta, Eisenhauer, &
Rozencweig, 1997). Depending on site protocol, patients either received Benadryl
through an IV or took it orally at the time of treatment. Patients and nurses often reported
they would be unable to continue testing when the Benadryl began to take effect because
of extreme drowsiness and being unable to stay awake for the testing. On one occasion, a
nurse had to delay the start of Benadryl administration so the participant could finish the
hearing testing. This situation would further justify the use of the FLFT method in terms
of speed of testing.
Peripheral neuropathy is another side effect of taxol. Carretta et al. (1997)
reported 80 of 151 patients being treated with taxol experienced neuropathy. Peripheral
neuropathy is also a side effect from cisplatin and carboplatin (Go & Adjei, 1999).
Peripheral neuropathy could become an issue if patients were unable to feel if they were
touching the tablet screen due to decreased tactile perception. A physical button might be
more appropriate in allowing biofeedback for patients with peripheral neuropathy
symptoms in their fingers. One subject in the current study verbally reported taxol-
induced peripheral neuropathy made it difficult to monitor how lightly or strongly to tap
the screen when the sound was heard. This subject completed the study without problem
in spite of their concern.
Listener usability and comfort survey responses were in agreement with responses
from Meinke et al. (2017). This was an indication that patients undergoing cancer
treatments did not have increased difficulty completing the hearing testing in comparison
to people taking the hearing test in an occupational setting.
74
Implementing Fixed-Level Frequency Test and
Automated High Frequency Audiometry in
Ototoxicity Monitoring
A Wilcoxon signed ranks analysis demonstrated no statistical difference between
the highest audible frequency measured by the AHFA and FLFT. This result was in
agreement with findings from Rieke and colleagues (2017) who tested the method on
normal hearing younger adults. Just as the highest audible frequency identified by FLFT
directly translated to the SRO fixed frequency audiometry (FFA) in Rieke et al.’s
research, there was no statistical difference between highest audible frequency identified
by the AHFA and FLFT in the current study. This study further extended the
applicability of the FLFT administered with the WAHTS (Creare, 2016) outside of a
sound-booth and demonstrated the practicality of administering the exam in two
chemotherapy treatment centers.
Ototoxicity monitoring relies upon the establishment of a sensitive region of
ototoxicity as defined on a baseline audiogram and monitored throughout chemotherapy
treatment. Typically, the highest audible frequency at 100 dB HL and six lower
frequencies are targeted for audiometric monitoring (Fausti et al., 1999). The sensitivity
and specificity of the FLFT for identifying a change in hearing status due to ototoxicity is
unknown at this time. The mean difference between the highest audible frequencies
(HAF) identified between the AHFA (SRO approach) and the FLFT test methods was
1,886.7 Hz, and the standard deviation was 1,086.2 Hz. The clinical implication of an
approximately 2,000 Hz error is most critical for the lower/speech frequencies when
communication starts to be negatively impacted by chemotherapeutics. If the FLFT
under-estimated the highest audible frequency, which was used to define the SRO for
75
ototoxicity monitoring, the earliest shift in hearing status would potentially be missed or
delayed in time. If the FLFT over-estimated the highest audible frequency, it would fail
to detect ototoxic effects occurring at lower frequencies. It might be worthwhile to
consider a higher output level (test level) for the FLFT that is more consistent with
current audiometer output levels. This would likely eliminate errors caused by the lower
output limit of 80 dB HL implemented in the current version of the FLFT.
The FLFT was found to be much faster than the AHFA. The mean time it took
for the FLFT to be completed was 144.6 seconds (2 minutes, 24.6 seconds). This was
slower than the reported FLFT test time of ~30 seconds by Rieke et al. (2017). This was
possibly due to the testing taking place in a more distracting test environment, which
might require more time to obtain six reversals on the Bekesy (1947) tracking. The
current study also evaluated the FLFT on subjects without normal hearing and receiving
medication treatment, which might have influenced their level of alertness. Nonetheless,
the decreased test time in comparison to the AHFA has an advantage for patients and
examiners. Patients would spend less time testing so they would not need to schedule
extra time for appointments or worry about the length of testing being challenging due to
increased fatigue from side effects of the chemotherapy. Examiners would spend less
time administering the testing so more patients could be seen with no need for additional
equipment or personnel to operate equipment. In the current version, the FLFT might be
well-suited as a quick ototoxicity screener, which might then be followed up with more
extensive threshold testing in a controlled test environment if a shift in the highest
audible frequency was detected.
76
Potential to Increase Patient Access to
Ototoxicity Monitoring
Operator Training
Nurse operators who have had no specialized training in hearing testing could
administer testing. However, if nurses would be the only ones there to administer the
testing, they would need more training on troubleshooting the device with regard to
connection drops. A mechanism would also have to be developed to transfer the test
results to the audiologist for review, interpretation, and follow-up. Training could be
completed in one session held by the hearing healthcare professional who organized the
program. Nurses would be given an overview of the device and training on the software.
Survey responses obtained by nurses included concerns about outside noise in the
cancer centers interfering with the hearing test. In order to have nurses’ concerns be
addressed, data would need to be presented to the nurses showing ambient noise levels
were acceptable to produce valid hearing thresholds. Nurse operator survey responses
were also similar to operator survey responses from research in occupational hearing
testing (Meinke et al., 2017). Both groups of operators felt the device fit the listener’s
ears well and would use it if available to them. Therefore, the WAHTS (Creare, 2016)
would likely be accepted in other treatment centers.
Benefits of Ototoxicity Monitoring
with the Wireless Automated
Hearing Test System
Utilizing the WAHTS (Creare, 2016) to implement the FLFT has the potential to
overcome barriers currently preventing the implementation of ototoxicity monitoring
programs in the classic manner as reported by Konrad-Martin et al. (2017). Because the
WAHTS could be utilized in an outpatient treatment center, the hassle of scheduling
77
multiple appointments for the patient would be eliminated. Consequentially, it would
also require less time commitment. Operators would not need to be trained in hearing
testing so current staff could administer the testing with just one hearing healthcare
provider reviewing the testing at an on-site or off-site location. Nurses were used in the
current study to administer the hearing testing but because operating the device did not
require formal training, less highly paid support staff might be able to administer the
testing. The implementation of the WAHTS to administer the FLFT and/or the AHFA
was feasible for both test sites. No barriers were identified during the research study and
both nurses and patients were supportive of its use. Either the AHFA or the FLFT
approach was feasible to implement using the WAHTS. The advantage of the AHFA
was the more detailed threshold data obtained with the testing and more information
regarding ototoxic changes. The disadvantage was the substantially longer test time. As
mentioned previously, the FLFT might be a useful screening tool to implement for
ototoxicity monitoring. To get an ototoxicity monitoring program functioning with the
WAHTS in these settings, operating staff would need to complete a training session on
the device and a plan would need to be developed with oncologists with regard to test
choice, test protocol, and report/communication preferences with the audiologist.
Strengths and Limitations
Testing was only completed in two outpatient cancer treatment centers. However,
the test environments were designed very differently from each other, which might
permit generalization to a large number of outpatient chemotherapy centers. The current
study had a relatively small number of participants and was slightly lower in number to
the Rieke et al. (2017) study (n = 29). Recruiting patients was difficult because patients
78
were not receiving hearing results due to the experimental nature of the technology and
test protocol. Future studies that could actually implement an ototoxicity monitoring
program and inform the patients of their hearing status would likely gain greater
participation.
Ambient noise measurements were not done continuously throughout testing so
they might not have captured when ambient noise levels were above the attenuation of
the WAHTS (Creare, 2016) at specific test frequencies. Meinke et al. (2017)
recommended further research to implement and evaluate accuracy of in-ear microphones
continuously measuring ambient noise levels and pausing testing when levels were too
high to produce valid thresholds. Additionally, the highest audible frequency using
AHFA and FLFT was not compared to a gold-standard hearing test in a sound booth,
which would have been ideal but impractical for this capstone research project.
Future Research
Future research should implement the WAHTS (Creare, 2016) technology in a
more diverse assortment of chemotherapy treatment centers with a larger population of
participants. Use of the FLFT and AHFA would need to be evaluated as part of a clinical
research study that would implement a full ototoxicity monitoring program. Future
studies should also investigate whether the test needed to be nurse administered, support
staff administered, or if the patient could self- administer the exam. In this model, only
one audiology professional would be required to supervise the program and
review/interpret the test results. Additionally, the audiologist would also be trained in
troubleshooting the device and be on call for technology issues, similar to the way
newborn hearing screening programs are implemented in hospital nurseries.
79
Conclusions
The WAHTS (Creare, 2016) provided sufficient attenuation of ambient noise and
enabled valid hearing threshold measurements to 5 dB HL for 250-20,000 Hz in two
outpatient chemotherapy treatment settings in northern Colorado. There was no
statistical difference in the highest audible frequency measured by the AHFA and FLFT
test methods. The FLFT required substantially shorter test times on average (24.78
minutes versus 2.4 minutes). Both the FLFT and AHFA administered via the WAHTS
would be useful means of performing ototoxicity monitoring for patients receiving
cisplatin and carboplatin treatments onsite in outpatient cancer treatment centers by
untrained nursing staff.
80
REFERENCES
American Academy of Audiology. (2009). Position statement and clinical practice
guidelines: Ototoxic monitoring. Retrieved from http://audiology-web.s3.
amazonaws.com/migrated/OtoMonGuidelines.pdf_539974c40999c1.58842217.pd
f
American Speech-Language-Hearing Association. (1994). Guidelines for the audiologic
management of individuals receiving cochleotoxic drug therapy. American
Speech-Language-Hearing Association, 36 (Suppl 12), 11-19.
American National Standards Institute. (1983). Specifications for sound level meters.
New York: Author.
American National Standards Institute. (2013). Maximum permissible ambient noise
levels. New York: Author.
Arlinger, S. (2003). Negative consequences of uncorrected hearing loss- A review.
International Journal of Audiology, 42(2), 17-20.
doi:10.3109/14992020309074639
Bauer, F. P., Westhofen, M., & Kehrl, W. (1992). The ototoxicity of the cytostatic drug
carboplatin in patients with head-neck tumors. Laryngo-rhino-otologie, 71(8),
412-415. Retrieved from http://europepmc.org/abstract/med/1388466
Békésy, G. V. (1947). A new audiometer. Acta Oto-Laryngologica, 35(5-6), 411-422.
doi:10.3109/00016484709123756
81
Blakley, B. W., Gupta, A. K., Myers, S. F., & Schwan, S. (1994). Risk factors for
ototoxicity due to cisplatin. Archives of Otolaryngology–Head & Neck Surgery,
120(5), 541-546. doi:10.1001/archotol.1994.01880290051009
Blakley, B. W., & Myers, S. F. (1993). Patterns of hearing loss resulting from cis-
platinum therapy. Otolaryngology--Head and Neck Surgery, 109(3), 385-391.
doi:10.1177/019459989310900302
Bokemeyer, C., Berger, C. C., Hartmann, J. T., Kollmannsberger, C., Schmoll, H. J.,
Kuczyk, M. A., & Kanz, L. (1998). Analysis of risk factors for cisplatin-induced
ototoxicity inpatients with testicular cancer. British Journal of Cancer, 77(8),
1355-1362. doi:10.1038/bjc.1998.226
Boulikas, T., & Vougiouka, M. (2004). Recent clinical trials using cisplatin, carboplatin
and their combination chemotherapy drugs (Review). Oncology Reports, 11(3),
559-595. doi:10.3892/or.11.3.559
Brennan-Jones, C. G., Eikelboom, R. H., Swanepoel, D., Friedland, P. L., & Atlas, M. D.
(2016). Clinical validation of automated audiometry with continuous noise-
monitoring in clinically heterogeneous population outside a sound-treated
environment. International Journal of Audiology, 55(9), 507-513.
doi:10.1080/14992027.2016.1178858
Carhart, R., & Jerger, J. (1959). Preferred method for clinical determination of pure-tone
thresholds. Journal of Speech & Hearing Disorders, 24, 330-345.
doi:10.1037/e539802008-001
Carretta, R. M., Eisenhauer, E., & Rozencweig, M. (1997). Methods for administration of
taxol. Washington, DC: U.S. Patent and Trademark Office.
82
Cavaletti, G., Bogliun, G., Zincone, A., Marzorati, L., Melzi, P., Frattola, L., ...Galli,
A. (1997). Neuro-and ototoxicity of high-dose carboplatin treatment in poor
prognosis ovarian cancer patients. Anticancer Research, 18(5B), 3797-3802.
Retrieved from http://europepmc.org/abstract/med/9854499
Chia, E., Wang, J., Rochtchina, E., Cumming, R. R., Newall, P., & Mitchell, P. (2007).
Hearing impairment and health-related quality of life: The blue mountains hearing
study. Ear & Hearing, 28(2), 187-195. doi:10.1097/AUD.0b013e31803126b6
Chisolm, T. H., Johnson, C. E., Danhauer, J. L., Portz, L. J. P., Abrams, H. B., Lesner, S.,
…Newman, C. W. (2007). A systematic review of health-related quality of life
and hearing aids: Final report of the American Academy of Audiology task force
on the health-related quality of life benefits of amplification in adults. Journal of
the American Academy of Audiology, 18(2), 151-183. doi:10.3766/jaaa.18.2.7
Creare. (2016). Hearing assessment. Hanover, NH: Creare Research and
Development.
Creaven, P. J., Pendyala, L., & Petrelli, N. J. (1993). Evaluation of alpha-
difluoromethylornithine as a potential chemopreventive agent: Tolerance to daily
oral administration in humans. Cancer Epidemiology Biomarkers & Prevention,
2(3), 243-247.
Croghan, M. K., Aickin, M. G., & Meyskens, F. L. (1991). Dose-related alpha-
difluoromethylornithine ototoxicity. American Journal of Clinical Oncology,
14(4), 331-335. doi:10.1097/00000421-199108000-00012
83
Dalton, D. S., Cruickshanks, K. J., Klein, B. E. K., Klein, R., Wiley, T. L., & Nondahl,
D. M. (2002). The impact of hearing loss on quality of life in older adults. The
Gerontologist, 43(5), 661-668. doi:10.1093/geront/43.5.661
de Jongh, F. E., Van Veen, R. N., Veltman, S. J., de Wit, R., Van der Burg, M. E. L.,
Van den Bent, M. J., ...Verweij, J. (2003). Weekly high-dose cisplatin is a
feasible treatment option: Analysis on prognostic factors for toxicity in 400
patients. British Journal of Cancer, 88(8), 1199-1206.
doi:10.1038/sj.bjc.6600884
Dille, M. F., McMillan, G. P., Helt, W. J., Konrad-Martin, D., & Jacobs, P. (2015). A
store-and-forward tele-audiology solution to promote efficient screenings for
ototoxicity during cisplatin cancer treatment. Journal of the American Academy of
Audiology, 26(9), 750-760. doi:10.3766/jaaa.15028
Estrem, S. A., Babin, R. W., Ryu, J. H., & Moore, K. C. (1981). Cis-diamminedichloro-
platinum (II) ototoxicity in the guinea pig. Otolaryngology--Head and Neck
Surgery, 89(4), 638-645.
Fausti, S. A., Helt, W. J., Phillips, D. S., Gordon, J. S., Bratt, G. W., Sugiura, K. M., &
Noffsinger, D. (2003). Early detection of ototoxicity using 1/6th-octave steps.
Journal of the American Academy of Audiology, 14(8), 444-450. Retrieved from
http://www.ingentaconnect.com.unco.idm.oclc.org/contentone/aaa/jaaa/2003/000
00014/00000008/art00006
84
Fausti, S. A., Henry, J. A., Helt, W. J., Phillips, D. S., Frey, R. H., Noffsinger, D.,
…Fowler, C. G. (1999) An individualized, sensitive frequency range for early
detection of ototoxicity. Ear & Hearing, 20(6), 497-505.
doi:10.1097/00003446-199912000-00005
Fausti, S. A., Rappaport, B. Z., Schechter, M. A., Frey, R. H., Ward, T. T., & Brummett,
R. E. (1984). Detection of aminoglycoside ototoxicity by high-frequency auditory
evaluation: Selected case studies. American Journal of Otolaryngology, 5(3), 177-
182.
Frank, T. (1990). High-frequency hearing thresholds in young adults using a
commercially available audiometer. Ear and Hearing, 11(6), 450-454.
doi:10.1097/00003446-199012000-00007
Gatzemeier, U., Hossfeld, D. K., Neuhauss, R., Reck, M., Achterrath, W., & Lenaz, L.
(1991). Carboplatin in small cell lung cancer. The Oncologist, 3(3), 145-154.
doi:10.1016/0169-5002(91)90055-B
Go, R. S., & Adjei, A. A. (1999). Review of the comparative pharmacology and clinical
activity of cisplatin and carboplatin. Journal of Clinical Oncology, 17(1), 409-
409.
Gordon, A. N., Hancock, K. C., Matthews, C. M., Messing, M., Stringer, C. A., Doherty
M. G., & Teneriello, M. (2002). Phase I study of alternating doublets of
topotecan/carboplatin and paclitaxel/carboplatin in patients with newly
diagnosed, advanced ovarian cancer. Gynecologic Oncology, 85(1), 129-135.
doi:10.1006/gyno.2001.6581
85
Gordon, J. S., Phillips, D. S., Helt, W. J., Konrad-Martin, D., & Fausti, S. A. (2005).
Evaluation of insert earphones for high-frequency bedside ototoxicity monitoring.
Journal of Rehabilitation Research and Development, 42(3), 353-361.
doi:10.1682/jrrd.2004.06.0093
Green, T. P., & Mirkin, B. L. (1981). Furosemide disposition in normal and proteinuric
rats: Urinary drug-protein binding as a determinant of drug excretion. Journal of
Pharmacology and Experimental Therapeutics, 218(1), 122-127.
doi:10.1016/0024-3205(80)90238-6
Gruney, J. G., Tersak, J. M., Ness, K. K., Landier, W., Matthay, K. K., & Schmidt, M.
(2007). Hearing loss, quality of life, and academic problems in long-term
neuroblastoma survivors: A report from the children’s oncology group.
Pediatrics, 120(5), 1229-1236. doi:10.1542/peds.2007-0178
Hartmann, J. T., & Lipp, H. P. (2003). Toxicity of platinum compounds. Expert Opinion
on Pharmacotherapy, 4(6), 889-901. doi:10.1517/14656566.4.6.889
Hawkins, Jr., J. E. (1976). Drug ototoxicity. In Auditory system (pp. 707-748). Berlin
Heidelberg: Springer.
Horn, Y., Schechter, P. J., & Marton, L. J. (1987). Phase I–II clinical trial with alpha-
difluoromethylornithine: An inhibitor of polyamine biosynthesis. European
Journal of Cancer and Clinical Oncology, 23(8), 1103-1107.
doi:10.1016/0277-5379(87)90141-6
Hughson, W., & Westlake, H. D. (1944). Manual for program outline for rehabilitation
of aural casualties both military and civilian. Omaha, NE: Douglas Print Co.
86
International Organization for Standardization. (2009). ISO 8252: Acoustics--
Audiometric test methods, Part 1. Retrieved from https://www.iso.org/standard/
43601.html
Klinke, R., & Mertens, M. (1988). Quantitative assessment of torasemide ototoxicity.
Arzneimittel-Forschung, 38(1A), 153-155.
Klis, S. F., O’Leary, S. J., Wijbenga, J., de Groot, J. C., Hamers, F. P., & Smoorenburg,
G. F. (2002). Partial recovery of cisplatin-induced hearing loss in the albino
guinea pig in relation to cisplatin dose. Hearing Research, 164(1), 138-146.
doi:10.1016/s0378-5955(01)00425-7
Konrad-Martin, D., Reavis, K. M., McMillan, G., Helt, W. J., & Dille, M. (2014).
Proposed comprehensive ototoxicity monitoring program for VA healthcare
(COMP-VA). Journal of Rehabilitation Research and Development, 51(1), 81.
Konrad-Martin, D., Poling, G. L., Garinis, A. C., Ortiz, C. E., Hopper, J., O’Connell-
Bennett, K., & Dille, M. F. (2017). Applying US national guidelines for
ototoxicity monitoring in adult patients: perspectives on patient populations,
service gaps, barriers and solutions. International Journal of Audiology,
57(sup4), 1-16.
Kopelman, J., Budnick, A. S., Sessions, R. B., Kramer, M. B., & Wong, G. Y. (1988).
Ototoxicity of high‐dose cisplatin by bolus administration in patients with
advanced cancers and normal hearing. The Laryngoscope, 98(8), 858-864.
doi:10.1288/00005537-198808000-00014
87
Laurell, G. F. (1992). Combined effects of noise and cisplatin: short-and long-term
follow-up. The Annals of Otology, Rhinology, and Laryngology, 101(12), 969-
976.
Laurell, G., & Jungnelius, U. (1990). High‐dose cisplatin treatment: Hearing loss and
plasma concentrations. The Laryngoscope, 100(7), 724-734.
doi:10.1288/00005537-199007000-00008
Lesman Instrument Co. (2019). Quest Model QC-10/QC-20 acoustic calibrator.
Retrieved from http://www.raeco.com/products/noise/quest_qc10sound
calibrator.html
Li, Y., Womer, R. B., & Silber, J. H. (2004). Predicting cisplatin ototoxicity in children:
The influence of age and the cumulative dose. European Journal of Cancer,
40(16), 2445-2451. doi:10.1016/j.ejca.2003.08.009
Lin, F. R., Yaffe, K., Xia, J., Xue, Q. L., Harris, T. B., Purchase-Helzner, E.,
…Simonsick, E. M. (2013). Hearing loss and cognitive decline in older adults.
Journal of American Medical Assotiation, 173(4), 293-299.
doi:10.1001/jamainternmed.2013.1868.
Lonsbury-Martin, B. L., Martin, G. K., & Pettis, J. (2007). Other ototoxins: Aspirin and
other nonsteroidal anti-inflammatory drugs, quinine, and macrolides. In K. C. M.
Campbell (Ed.), Pharmacology and ototoxicity for audiologists (pp. 187-196).
Clifton Park, NY: Delmar Cengage Learning.
88
Mahajan, S. L., Ikeda, Y., Myers, T. J., & Baldini, M. G. (1981). Acute acoustic nerve
palsy associated with vincristine therapy. Cancer, 47(10), 2404-2406.
doi:10.1002/1097-0142(19810515)47:10%3C2404::aid-cncr2820471014%
3E3.0.co;2-2
Mahomed, F., Swanepoel, D., Eikelboom, R. H., & Soer, M. (2013). Validity of
automated threshold audiometry: A systematic review and meta-analysis. Ear
and Hearing, 34(6), 745-752. doi:10.1097/aud.0b013e3182944bdf
Marco-Algarra, J., Basterra, J., & Marco, J. (1985). cis-Diaminedichloro platinum
ototoxicity: An experimental study. Acta oto-laryngologica, 99(3-4), 343-347.
doi:10.3109/00016488509108921
Margolis, R. H., & Morgan, D. E. (2008). Automated pure-tone audiometry: An analysis
of capacity, need and benefit. American Journal of Audiology, 18, 78-89.
doi:10.1044/1059-0889(2008/07-0047
Meinke, D. K., Norris, J. A., Flynn, B. P., & Clavier, O. H. (2017). Going wireless and
booth-less for hearing testing in industry. International Journal of
Audiology, 56(sup1), 41-51.
Meyskens, F. L., & Gerner, E. W. (1999). Development of difluoromethylornithine
(DFMO) as a chemoprevention agent. Clinical Cancer Research, 5(5), 945-951.
doi:10.1002/jcb.240590816
Meyskens, F. L., Kingsley, E. M., Glattke, T., Loescher, L., & Booth, A. (1986). A phase
II study of α-difluoromethylornithine (DFMO) for the treatment of metastatic
melanoma. Investigational New Drugs, 4(3), 257-262.
89
Moss, P. E., Hickman, S., & Harrison, B. R. (1999). Ototoxicity associated with
vinblastine. Annals of Pharmacotherapy, 33(4), 423-425. doi:10.1345/aph.18288
Multimedia. (n.d.). OB-300 octave band analyzer. Retrieved from
http://multimedia.3m.com/mws/media/760877O/1700-2700-sound-level-meter-
user-manual.pdf
National Comprehensive Cancer Network. (2003). Clinical practice guidelines in
oncology. Retrieved from https://www.nccn.org/professionals/physician_gls/
default.aspx
Neuwelt, E. A., Brummett, R. E., Doolittle, D. N., Muldoon, L. L., Kroll, R. A., Pagel.
M. A, …Bubalo, J. S. (1998). First evidence of otoprotection against
carboplatin-induced hearing loss with a two- compartment system in patients with
central nervous system malignancy using sodium thiosulfate. The Journal of
Pharmacology, 286(1), 77-84. Retrieved from http://jpet.aspetjournals.org/
content/286/1/77.short
Osterhammel, D. (1978). High-frequency thresholds using a quasi-free-field technique.
Scandinavian Audiology, 7(1), 27-30. doi:10.3109/01050397809043128
Pine Environmental. (2019a.). Quest Type 2 SLM, Model 2700. Retrieved from
http://www.pine-environmental.com/products/detail/10775/quest-model-2700-
impulse-sound-level-meter/
Pine Environmental. (2019b). Quest Type 2 SLM, Model 2900. Retrieved from
http://www.pine-environmental.com/products/detail/10219/quest-2900-type-2-w-
calibrator/
90
Pouyatos, B., & Pettis, J. (2007). Industrial chemicals and solvents affecting the auditory
system. In K. C. M. Campbell (Ed.), Pharmacology and ototoxicity for
audiologists (pp. 197-215). Clifton Park, NY: Delmar Cengage Learning.
Punnett, A., Bliss, B., Dupuis, L. L., Abdolell, M., Doyle, J., & Sung, L. (2004).
Ototoxicity following pediatric hematopoietic stem cell transplantation: A
prospective cohort study. Pediatric Blood & Cancer, 42(7), 598-603.
doi:10.1002/pbv.20036
Ramsdale, C., & Charman, W. N. (1989). A longitudinal study of the changes in the static
accommodation response. Ophthalmic and Physiological Optics, 9(3), 255-263.
Rieke, C. C., Clavier, O. H., Allen, L. V., Anderson, A. P., Brooks, C. A., Fellows, A.
M., ...Buckey, J. C. (2017). Fixed-level frequency threshold testing for
ototoxicity monitoring. Ear and Hearing, 38(6), e369-e375.
Rybak, L. P. (1993). Ototoxicity of loop diuretics. Otolaryngologic Clinics of North
America, 26(5), 829-844. doi:10. 1016/s0030-6665(06)00098-3
Rybak, L. P. (2007). Renal function and ototoxicity of loop diuretics. In K. C. M.
Campbell (Ed.), Pharmacology and ototoxicity for audiologists (pp. 177-186).
Clifton Park, NY: Delmar Cengage Learning.
Rybak, L. P., Huang, X., & Campbell, K. C. M. (2007). Cancer and ototoxicity of
chemotherapeutics. In K. C. M. Campbell (Ed.), Pharmacology and ototoxicity
for audiologists (pp. 139-162). Clifton Park, NY: Delmar Cengage Learning.
Saito, T., Saito, H., Saito, K., Wakui, S., Manabe, Y., & Tsuda, G. (1989). Ototoxicity of
carboplatin in guinea pigs. Auris Nasus Larynx, 16(1), 13-21.
doi:10.1016/s0385-8146(89)80003-3
91
Schacht, J. (2007). Aminoglycoside antibiotics. In K. C. M. Campbell (Ed.),
Pharmacology and ototoxicity for audiologists (pp. 163-176). Clifton Park, NY:
Delmar Cengage Learning.
Schatz, A., & Waksman, S. A. (1944). Effect of streptomycin and other antibiotic
substances upon mycobacterium tuberculosis and related organisms. Experimental
Biology and Medicine, 57(2), 244-248. doi:10. 3181/00379727-57-14769
Seniors Research Group. 1999. The consequences of untreated hearing loss in older
persons. Washington, DC: National Council on the Aging.
Serafy, A., & Hashash, M. (1982). The effect of vinblastine sulphate on the neurological
elements of the rabbit cochlea. The Journal of Laryngology & Otology, 96(11),
975-979. doi:10.1017/s0022215100093385
Shapiro, M., & Galloza, H. (2016). Open source mobile software platform for distributed
studies of hearing. Presented at the American Auditory Society Conference,
Scottsdale, AZ. Also available http://creare-com.github.io/tabstint/
Skeel, R. T. (1999). Biologic and pharmacologic basis of cancer chemotherapy. In
Handbook of cancer and chemotherapy (5th ed., pp. 3-19). Philadelphia:
Lippincott.
Strauss, M., Towfighi, J., Lord, S., Lipton, A., Harvey, H. A., & Brown, B. (1983). Cis‐
platinum ototoxicity: Clinical experience and temporal bone histopathology. The
Laryngoscope, 93(12), 1554-1559. doi:10.1288/00005537-198312000-00007
Sturgeon, J. (2004). Clinical uses of cisplatin. In P. S. Roland & J. A. Rutka (Eds.),
Ototoxicity (pp. 50-59). New York: BC Decker Inc.
92
Swanepoel, D. W., Mngemane, S., Molemong, S., Mkwanazi, H., & Tutshini, S. (2010).
Hearing assessment-reliability, accuracy, and efficiency of automated audiometry.
Telemedicine and e-Health, 16(5), 557-563. doi:10.1089/tmj.2009.0143
Varni, J. W. (2019). Pediatric Quality of Life Inventory 4.0. Retrieved from
http://www.pedsql.org/about_pedsql.html
Ventry, I. M., & Weinstein, B. E. (1982). The hearing handicap inventory for the elderly:
A new tool. Ear and Hearing, 3(3), 128-134.
Vermorken, J. B., Kapteijn, T. S., Hart, A. A. M., & Pinedo, H. M. (1983). Ototoxicity of
cis-diamminedichloroplatinum (II): Influence of dose, schedule and mode of
administration. European Journal of Cancer and Clinical Oncology, 19(1), 53-58.
doi:10.1016/0277-5379(83)90398-x
Vermorken, J. B., Mangioni, C., & Van Oosterom, A. T. (1983). Vincristine, bleomycin,
mitomycin C and cisplatin (VBMP) in squamous cell carcinoma of the uterine
cervix (SCCUC). International Journal of Gynecological Cancer, 10(5), 358-365.
Wake, M., Takeno, S., Ibrahim, D., Harrison, R., & Mount, R. (1993). Carboplatin
ototoxicity: an animal model. The Journal of Laryngology & Otology, 107(07),
585-589. doi:10.1017/s0022215100123771
Ware, J. E., Kosinski, M., Keller, S. D. (1994). SF-36 Physical and Mental Health
Summary Scales. Boston: The Health Institute, New England Medical Center.
Wilcoxon, F. (1945). Individual comparisons by ranking methods. Biometrics
Bulletin, 1(6), 80-83.
93
Williams, W. (2010). The calculation of maximum permissible ambient noise level for
audiometric testing to a given threshold level with a specified uncertainty.
Retrieved from https://dspace.nal.gov.au/xmlui/handle/123456789/479
Windmill, I. M., & Freeman, B. A. (2013). Demand for audiology services: 30-yr
projections and impact on academic programs. Journal of American Academy of
Audiology, 24(5), 407-416. doi:10.3766/jaaa.24.5.7
94
APPENDIX A
INSTITUTIONAL REVIEW BOARD APPROVAL
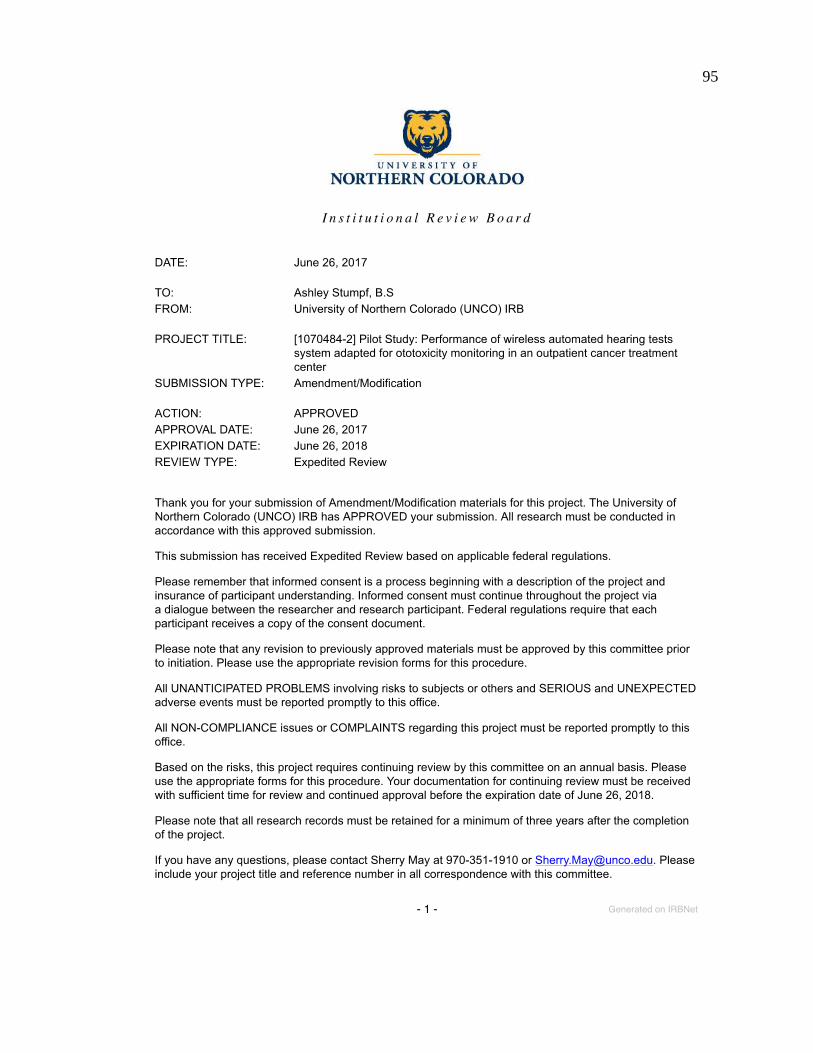
95
96
97
APPENDIX B
WIRELESS HEADSET SYSTEM SURVEY
FOR OPERATORS
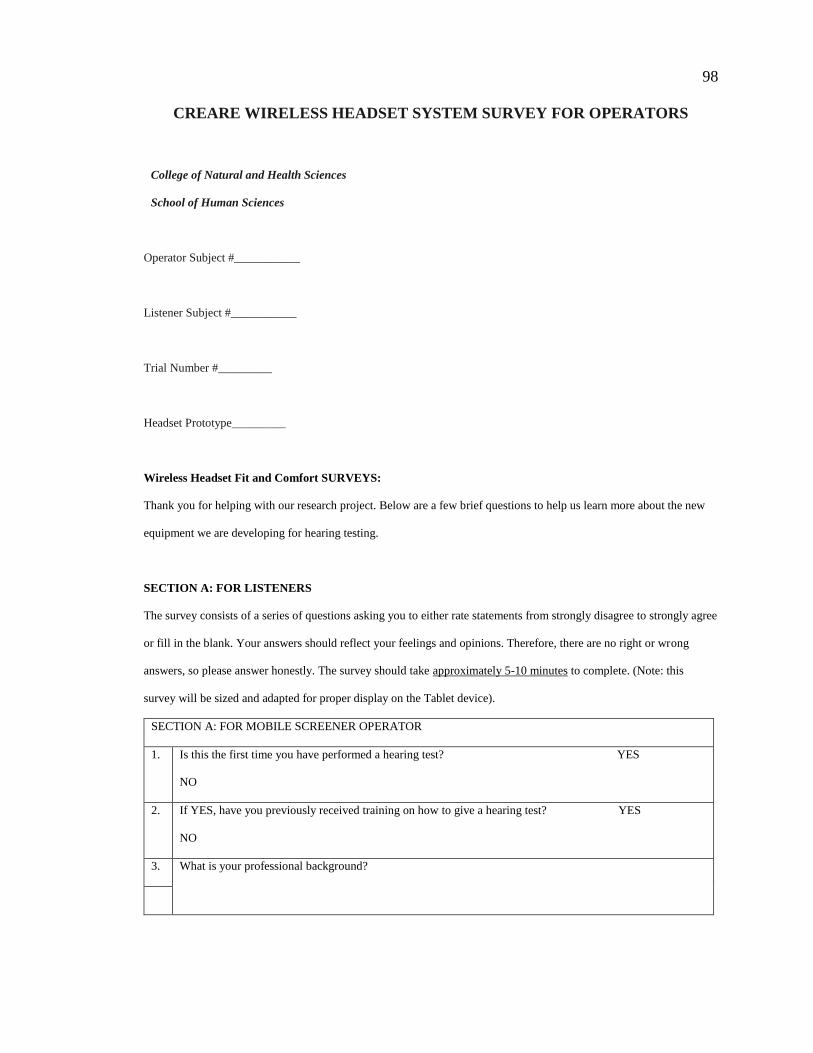
98
CREARE WIRELESS HEADSET SYSTEM SURVEY FOR OPERATORS
College of Natural and Health Sciences
School of Human Sciences
Operator Subject #___________
Listener Subject #___________
Trial Number #_________
Headset Prototype_________
Wireless Headset Fit and Comfort SURVEYS:
Thank you for helping with our research project. Below are a few brief questions to help us learn more about the new
equipment we are developing for hearing testing.
SECTION A: FOR LISTENERS
The survey consists of a series of questions asking you to either rate statements from strongly disagree to strongly agree
or fill in the blank. Your answers should reflect your feelings and opinions. Therefore, there are no right or wrong
answers, so please answer honestly. The survey should take approximately 5-10 minutes to complete. (Note: this
survey will be sized and adapted for proper display on the Tablet device).
SECTION A: FOR MOBILE SCREENER OPERATOR
1. Is this the first time you have performed a hearing test? YES
NO
2. If YES, have you previously received training on how to give a hearing test? YES
NO
3. What is your professional background?
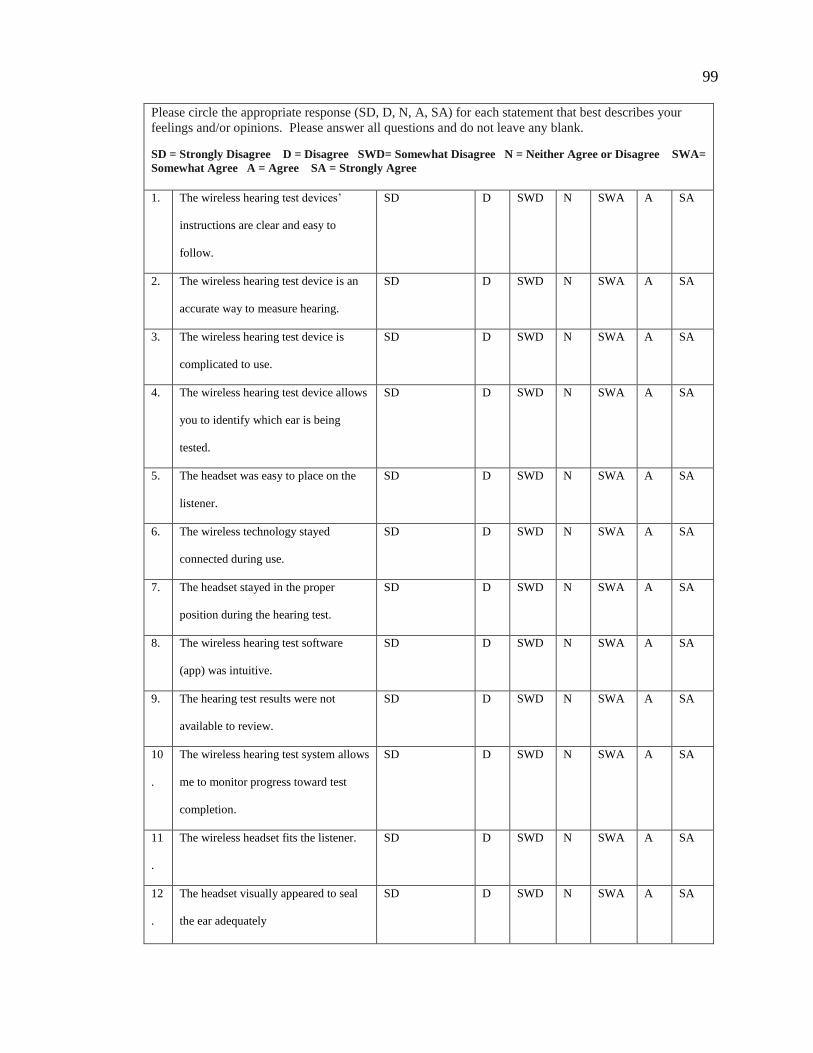
99
Please circle the appropriate response (SD, D, N, A, SA) for each statement that best describes your
feelings and/or opinions. Please answer all questions and do not leave any blank.
SD = Strongly Disagree D = Disagree SWD= Somewhat Disagree N = Neither Agree or Disagree SWA=
Somewhat Agree A = Agree SA = Strongly Agree
1. The wireless hearing test devices’
instructions are clear and easy to
follow.
SD D SWD N SWA A SA
2. The wireless hearing test device is an
accurate way to measure hearing.
SD D SWD N SWA A SA
3. The wireless hearing test device is
complicated to use.
SD D SWD N SWA A SA
4. The wireless hearing test device allows
you to identify which ear is being
tested.
SD D SWD N SWA A SA
5. The headset was easy to place on the
listener.
SD D SWD N SWA A SA
6. The wireless technology stayed
connected during use.
SD D SWD N SWA A SA
7. The headset stayed in the proper
position during the hearing test.
SD D SWD N SWA A SA
8. The wireless hearing test software
(app) was intuitive.
SD D SWD N SWA A SA
9. The hearing test results were not
available to review.
SD D SWD N SWA A SA
10
.
The wireless hearing test system allows
me to monitor progress toward test
completion.
SD D SWD N SWA A SA
11
.
The wireless headset fits the listener. SD D SWD N SWA A SA
12
.
The headset visually appeared to seal
the ear adequately
SD D SWD N SWA A SA
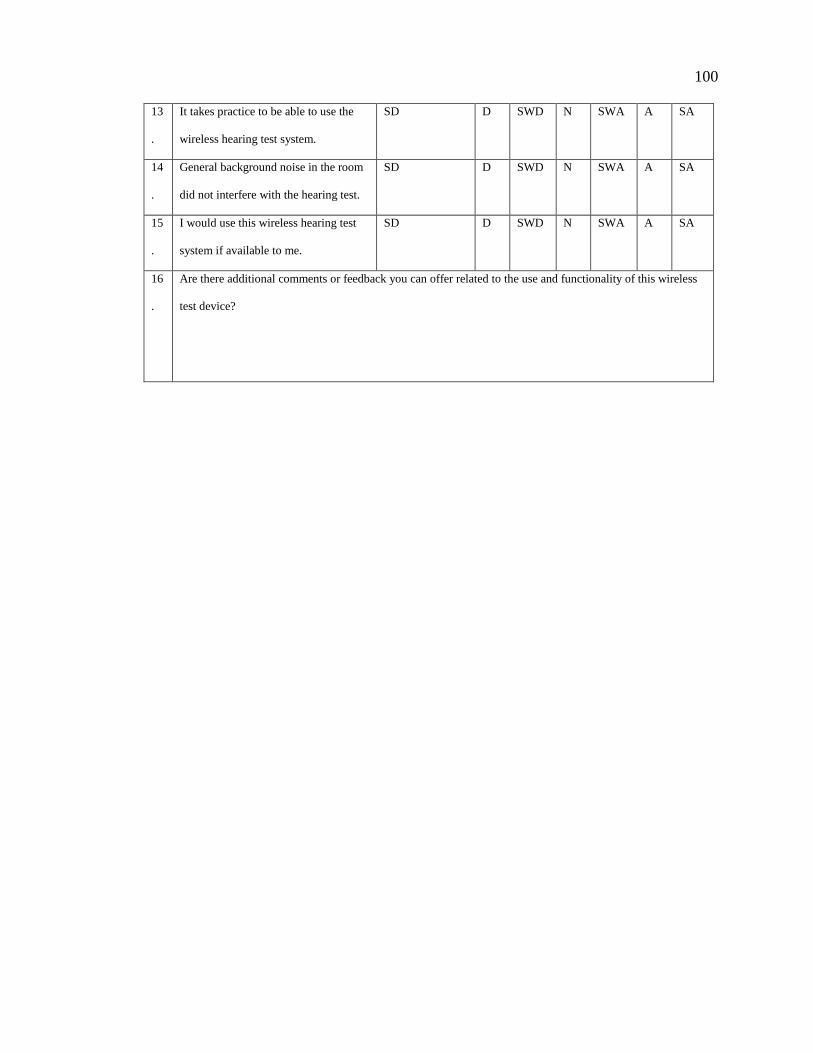
100
13
.
It takes practice to be able to use the
wireless hearing test system.
SD D SWD N SWA A SA
14
.
General background noise in the room
did not interfere with the hearing test.
SD D SWD N SWA A SA
15
.
I would use this wireless hearing test
system if available to me.
SD D SWD N SWA A SA
16
.
Are there additional comments or feedback you can offer related to the use and functionality of this wireless
test device?
101
APPENDIX C
WIRELESS HEADSET SYSTEM SURVEY
FOR LISTENERS
102
CREARE WIRELESS HEADSET SYSTEM SURVEY FOR LISTENERS
College of Natural and Health Sciences
School of Human Sciences
Operator Subject #___________
Listener Subject #___________
Trial Number #_________
Headset Prototype_________
Wireless Headset Fit and Comfort SURVEYS:
Thank you for helping with our research project. Below are a few brief questions to help us learn more about the new
equipment we are developing for hearing testing.
SECTION A: FOR LISTENERS
The survey consists of a series of questions asking you to either rate statements from strongly disagree to strongly agree
or fill in the blank. Your answers should reflect your feelings and opinions. Therefore, there are no right or wrong
answers, so please answer honestly. The survey should take approximately 5-10 minutes to complete. (Note: this
survey will be sized and adapted for proper display on the Tablet device).
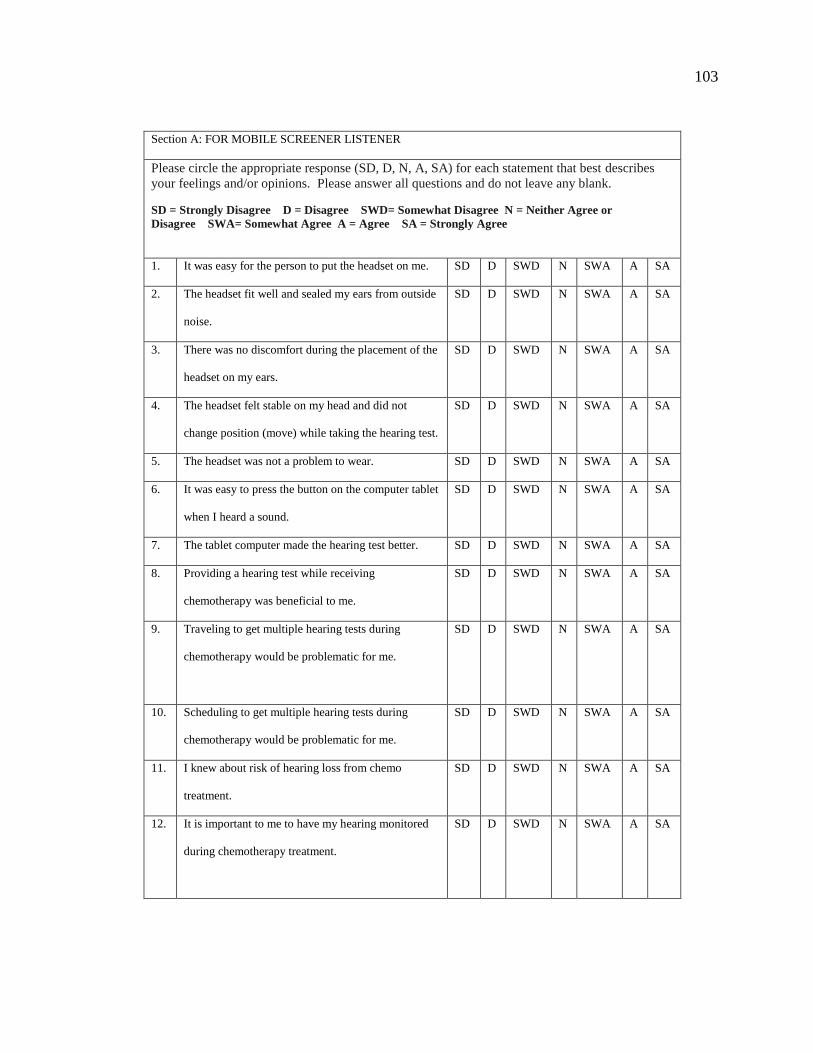
103
Section A: FOR MOBILE SCREENER LISTENER
Please circle the appropriate response (SD, D, N, A, SA) for each statement that best describes
your feelings and/or opinions. Please answer all questions and do not leave any blank.
SD = Strongly Disagree D = Disagree SWD= Somewhat Disagree N = Neither Agree or
Disagree SWA= Somewhat Agree A = Agree SA = Strongly Agree
1. It was easy for the person to put the headset on me. SD D SWD N SWA A SA
2. The headset fit well and sealed my ears from outside
noise.
SD D SWD N SWA A SA
3. There was no discomfort during the placement of the
headset on my ears.
SD D SWD N SWA A SA
4. The headset felt stable on my head and did not
change position (move) while taking the hearing test.
SD D SWD N SWA A SA
5. The headset was not a problem to wear. SD D SWD N SWA A SA
6. It was easy to press the button on the computer tablet
when I heard a sound.
SD D SWD N SWA A SA
7. The tablet computer made the hearing test better. SD D SWD N SWA A SA
8. Providing a hearing test while receiving
chemotherapy was beneficial to me.
SD D SWD N SWA A SA
9. Traveling to get multiple hearing tests during
chemotherapy would be problematic for me.
SD D SWD N SWA A SA
10. Scheduling to get multiple hearing tests during
chemotherapy would be problematic for me.
SD D SWD N SWA A SA
11. I knew about risk of hearing loss from chemo
treatment.
SD D SWD N SWA A SA
12. It is important to me to have my hearing monitored
during chemotherapy treatment.
SD D SWD N SWA A SA
104
13. Are there additional comments or feedback you can offer related to the use and functionality of this
wireless test device?
105
APPENDIX D
RECIPROCAL AGREEMENT
106