Embed Size (px)
Citation preview

Comparison of Automated and Manual Identification Methods for Acoustic Bat
Survey Datasets: Implications for Future Protocols
Trevor Peterson, Sarah Boyden, and Kristen Watrous Stantec Consulting Services Inc.

Introduction
• Increasing scope of acoustic bat surveys – Rare species presence – Activity levels in relation to
risk at wind farms – Long-term species
composition and activity trends as WNS progresses
• Recognized need to standardize certain aspects of acoustic analysis
Photo by Al Hicks, NYS DEC
Photo from Reichard and Kunz 2009

Introduction
• Acoustic bat data analysis methods – Visual (Analook) – Automated (EchoClass,
BCID) • Pros and cons of methods
– Objectivity – Sensitivity – Accuracy – Repeatability – Variability – Efficiency
Photo by Al Hicks, NYS DEC
Photo from Reichard and Kunz 2009
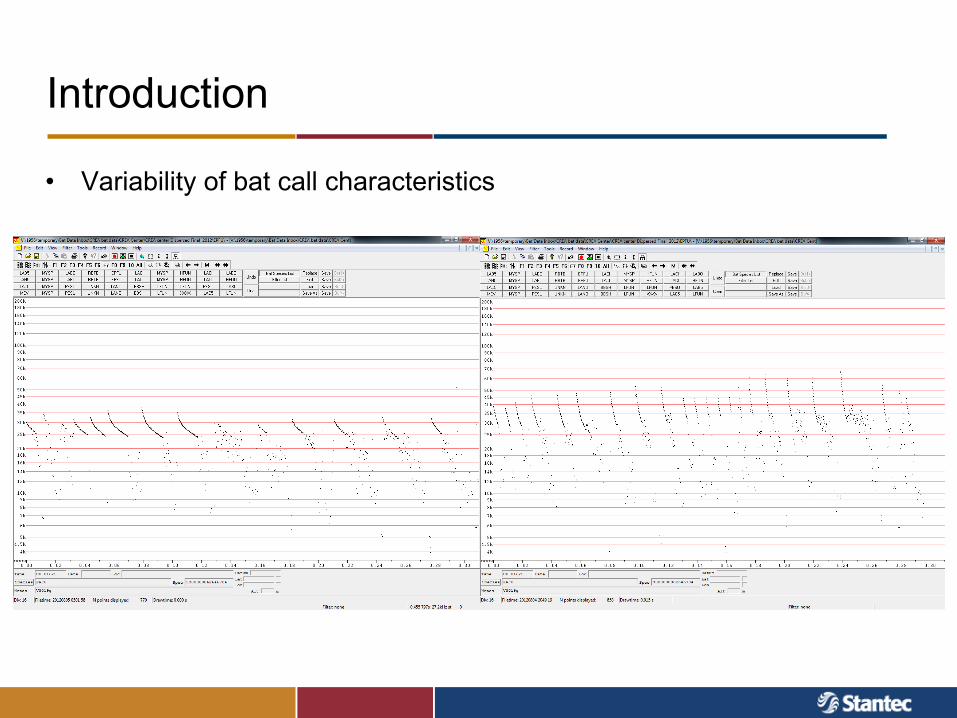
Introduction
• Variability of bat call characteristics
Photo by Al Hicks, NYS DEC
Photo from Reichard and Kunz 2009
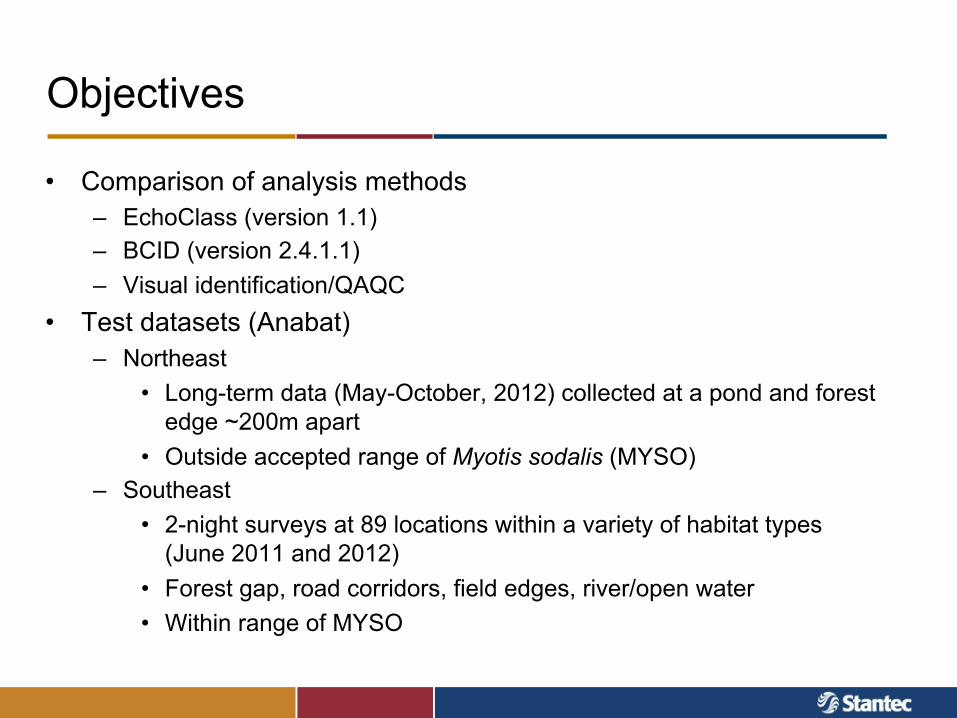
Objectives
• Comparison of analysis methods – EchoClass (version 1.1) – BCID (version 2.4.1.1) – Visual identification/QAQC
• Test datasets (Anabat) – Northeast
• Long-term data (May-October, 2012) collected at a pond and forest edge ~200m apart
• Outside accepted range of Myotis sodalis (MYSO) – Southeast
• 2-night surveys at 89 locations within a variety of habitat types (June 2011 and 2012)
• Forest gap, road corridors, field edges, river/open water • Within range of MYSO
Photo by Al Hicks, NYS DEC
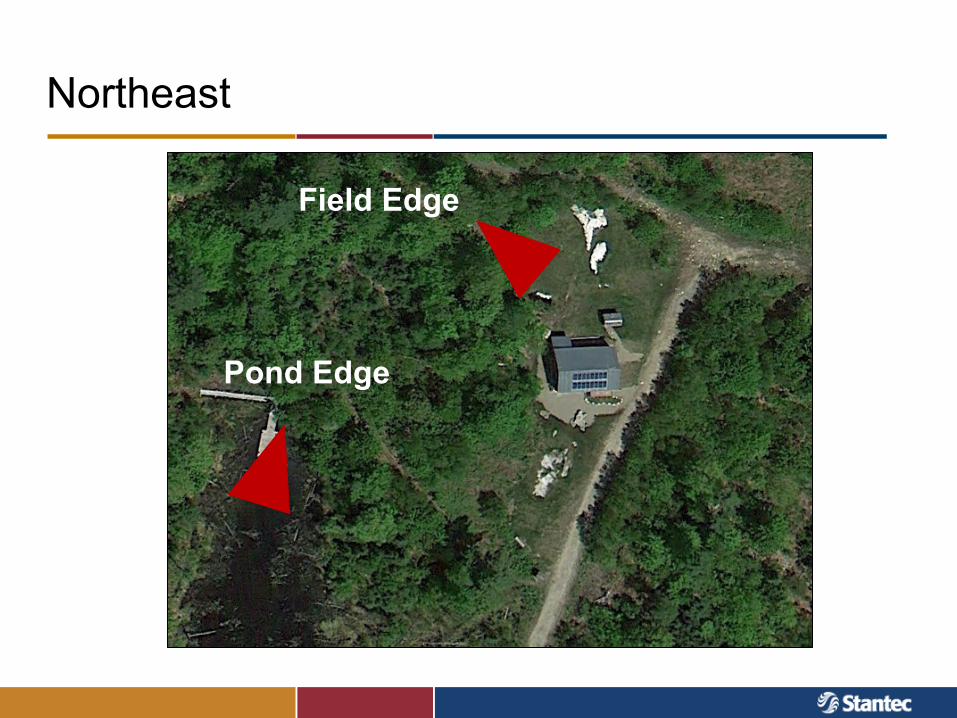
Northeast
Photo by Al Hicks, NYS DEC
Field Edge
Pond Edge
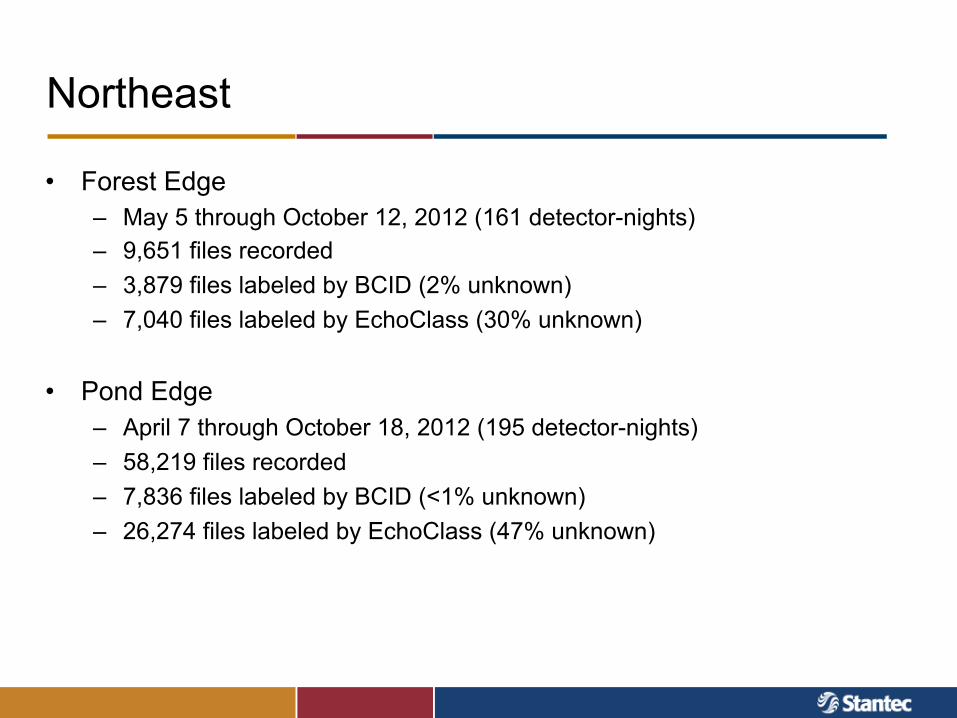
Northeast
• Forest Edge – May 5 through October 12, 2012 (161 detector-nights) – 9,651 files recorded – 3,879 files labeled by BCID (2% unknown) – 7,040 files labeled by EchoClass (30% unknown)
• Pond Edge – April 7 through October 18, 2012 (195 detector-nights) – 58,219 files recorded – 7,836 files labeled by BCID (<1% unknown) – 26,274 files labeled by EchoClass (47% unknown)
Photo by Al Hicks, NYS DEC

EPFU LABO LACI LANO MYLE MYLU MYSE MYSO PESU UNKN5905 5257 4193 957 16 257 952 1380 7 14490
EPFU 4347 3643 213 108 13 0 0 42 49 0 279LABO 546 3 464 5 0 1 4 12 9 1 47LACI 467 28 0 247 147 0 0 0 0 0 45LANO 3151 1817 143 330 553 0 0 2 0 0 306MYLE 64 0 20 0 0 2 0 25 7 0 10MYLU 1160 0 229 1 0 0 236 26 553 0 115MYSE 744 1 375 0 0 4 0 304 0 0 60MYSO 1048 2 138 2 0 6 3 139 663 0 95PESU 60 1 31 0 0 0 0 1 0 2 25UNKN 127 14 29 26 18 0 2 15 5 0 18Blank 21700 396 3615 3474 226 3 12 386 94 4 13490
N=33,414 filesEchoClass Identifications
BCID Identifica
tions
Northeast
Photo by Al Hicks, NYS DEC • BCID and EchoClass agreed on ID of 6,132 files (18%) • EPFU/LANO “strategies” differ between programs • LABO differs substantially between programs • UNKN “strategies” differ between programs

Northeast
Photo by Al Hicks, NYS DEC • MYSO comprised 53% of Myotis sequences (n=2,605) according to EchoClass
• MYSO comprised 35% of Myotis sequences (n=3,016) according to BCID
• 663 sequences identified as MYSO by both programs
EPFU LABO LACI LANO MYLE MYLU MYSE MYSO PESU UNKN5905 5257 4193 957 16 257 952 1380 7 14490
EPFU 4347 3643 213 108 13 0 0 42 49 0 279LABO 546 3 464 5 0 1 4 12 9 1 47LACI 467 28 0 247 147 0 0 0 0 0 45LANO 3151 1817 143 330 553 0 0 2 0 0 306MYLE 64 0 20 0 0 2 0 25 7 0 10MYLU 1160 0 229 1 0 0 236 26 553 0 115MYSE 744 1 375 0 0 4 0 304 0 0 60MYSO 1048 2 138 2 0 6 3 139 663 0 95PESU 60 1 31 0 0 0 0 1 0 2 25UNKN 127 14 29 26 18 0 2 15 5 0 18Blank 21700 396 3615 3474 226 3 12 386 94 4 13490
N=33,414 filesEchoClass Identifications
BCID Identifica
tions
Forest Edge
• 7,795 sequences labeled during visual analysis (755 more than EchoClass, 3,916 more than BCID)
• 2,915 “UNKN” sequences: 90% not labeled by BCID, 23% not labeled by EchoClass

Forest Edge
• 2,329 sequences labeled as “BBSH” during visual analysis
EPFU58.9%
LABO5.2%
LACI6.6%
LANO12.7%
MYLU0.0%
MYSE0.3%
MYSO0.5%
Unknown15.8%
EPFU31.9%
LACI0.6%
LANO47.8%
MYSE0.0%
MYSO0.1%
Unknown0.5%
Blank19.0%
EchoClass BCID
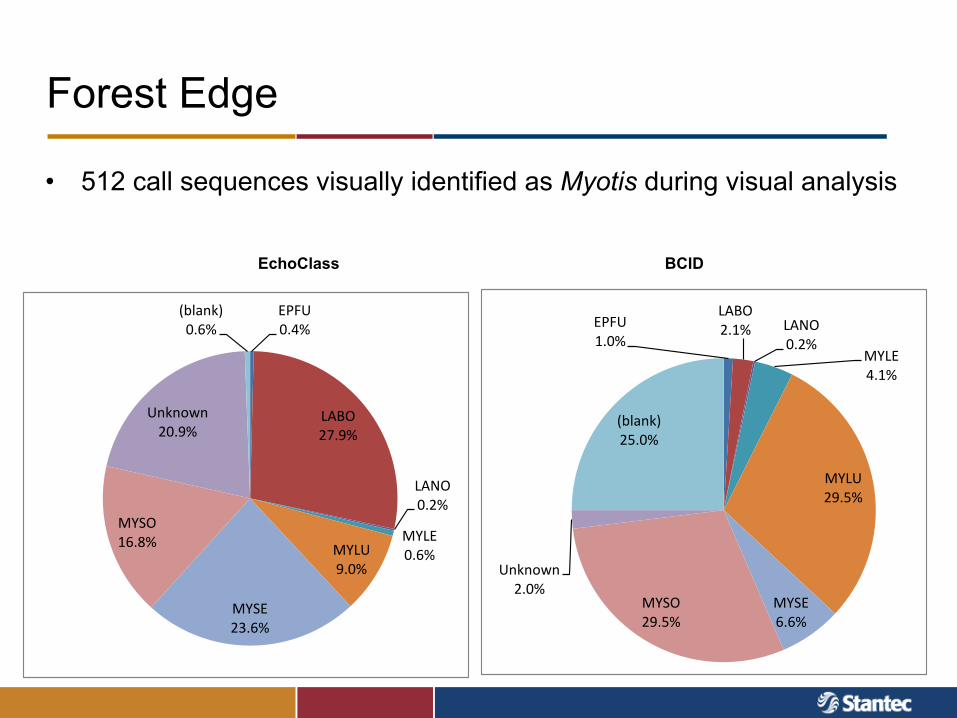
Forest Edge
• 512 call sequences visually identified as Myotis during visual analysis
EchoClass BCID
EPFU0.4%
LABO27.9%
LANO0.2%
MYLE0.6%MYLU
9.0%
MYSE23.6%
MYSO16.8%
Unknown20.9%
(blank)0.6% EPFU
1.0%
LABO2.1% LANO
0.2%MYLE4.1%
MYLU29.5%
MYSE6.6%
MYSO29.5%
Unknown2.0%
(blank)25.0%

Forest Edge
• Visual analysis of sequences identified as MYSO by:
EchoClass = MYSO (n=178)
BCID = MYSO (n=181)
BBSH6.7% EPFU
7.8%
HFUN27.8%
LABO0.6%LACI
0.6%
LFUN7.8%
MYSP47.8%
RBTB1.1%
BBSH1.1%
EPFU0.6%
HFUN7.7%
LABO3.3%
LACI0.6%
LFUN2.2%
MYSP83.4%
RBTB1.1%

Northeast Summary
• BCID and EchoClass each “agreed” that MYSO comprised 30% or greater of identified Myotis call sequences (outside accepted range of MYSO)
• MYSO present during 31 nights at Field Edge (19% of nights) and 48 nights (25% of nights) at Pond Edge according to EchoClass ML estimator (ML index of “3”)
• Identification “strategies” differ substantially between BCID and EchoClass (EPFU/LANO, LABO, MYSP/LABO)
• Visual analysis identified higher numbers of call sequences than either program (particularly fragments)
Photo by Al Hicks, NYS DEC

Southeast (Example Detector Locations)
Photo by Al Hicks, NYS DEC

Southeast
• 89 sites each monitored for 2 nights during June, 2011/2012 • 178 detector-nights of Anabat data • 58,173 files recorded • 17,303 files labeled by BCID (2% unknown) • 31,007 files labeled by EchoClass (32% unknown)
Photo by Al Hicks, NYS DEC
Southeast
Photo by Al Hicks, NYS DEC
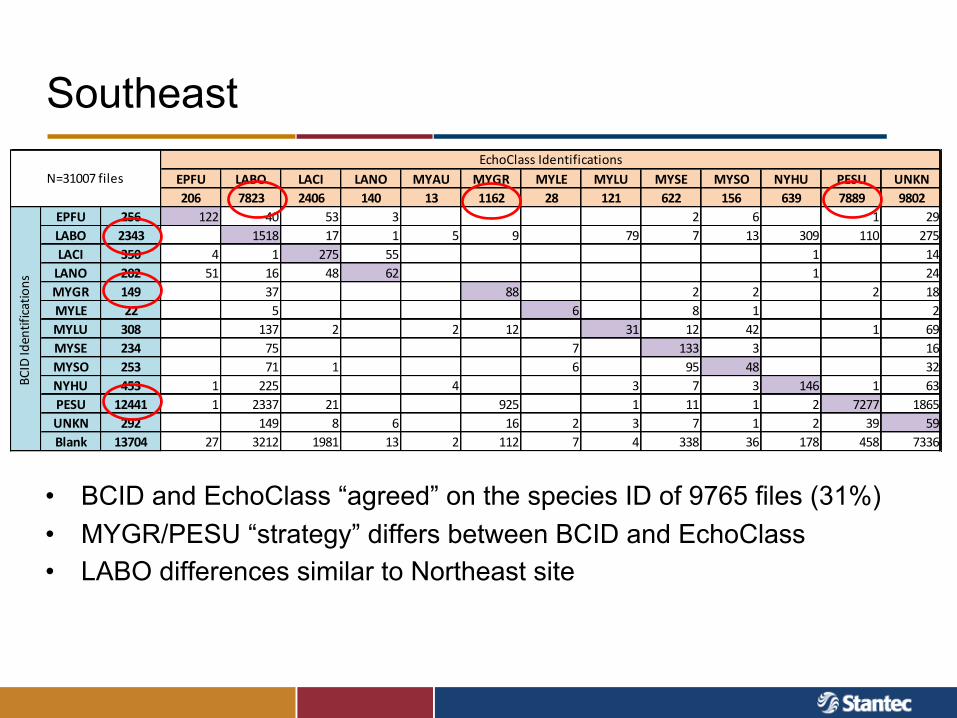
EPFU LABO LACI LANO MYAU MYGR MYLE MYLU MYSE MYSO NYHU PESU UNKN206 7823 2406 140 13 1162 28 121 622 156 639 7889 9802
EPFU 256 122 40 53 3 2 6 1 29LABO 2343 1518 17 1 5 9 79 7 13 309 110 275LACI 350 4 1 275 55 1 14LANO 202 51 16 48 62 1 24MYGR 149 37 88 2 2 2 18MYLE 22 5 6 8 1 2MYLU 308 137 2 2 12 31 12 42 1 69MYSE 234 75 7 133 3 16MYSO 253 71 1 6 95 48 32NYHU 453 1 225 4 3 7 3 146 1 63PESU 12441 1 2337 21 925 1 11 1 2 7277 1865UNKN 292 149 8 6 16 2 3 7 1 2 39 59Blank 13704 27 3212 1981 13 2 112 7 4 338 36 178 458 7336
BCID Identifica
tions
EchoClass IdentificationsN=31007 files
• BCID and EchoClass “agreed” on the species ID of 9765 files (31%) • MYGR/PESU “strategy” differs between BCID and EchoClass • LABO differences similar to Northeast site
Southeast
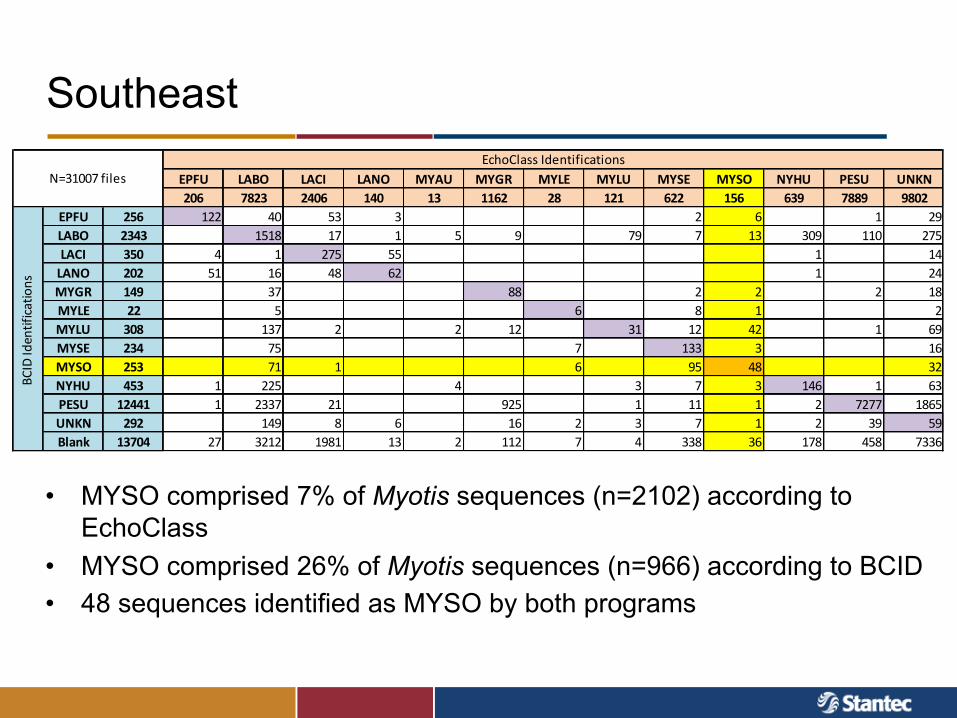
Photo by Al Hicks, NYS DEC • MYSO comprised 7% of Myotis sequences (n=2102) according to
EchoClass • MYSO comprised 26% of Myotis sequences (n=966) according to BCID • 48 sequences identified as MYSO by both programs
EPFU LABO LACI LANO MYAU MYGR MYLE MYLU MYSE MYSO NYHU PESU UNKN206 7823 2406 140 13 1162 28 121 622 156 639 7889 9802
EPFU 256 122 40 53 3 2 6 1 29LABO 2343 1518 17 1 5 9 79 7 13 309 110 275LACI 350 4 1 275 55 1 14LANO 202 51 16 48 62 1 24MYGR 149 37 88 2 2 2 18MYLE 22 5 6 8 1 2MYLU 308 137 2 2 12 31 12 42 1 69MYSE 234 75 7 133 3 16MYSO 253 71 1 6 95 48 32NYHU 453 1 225 4 3 7 3 146 1 63PESU 12441 1 2337 21 925 1 11 1 2 7277 1865UNKN 292 149 8 6 16 2 3 7 1 2 39 59Blank 13704 27 3212 1981 13 2 112 7 4 338 36 178 458 7336
BCID Identifica
tions
EchoClass IdentificationsN=31007 files

Southeast Summary
• MYSO present at 18 of 89 locations (20%) according to EchoClass Maximum Likelihood indicator, with MYSO sequences identified at 49 of 89 (55%) locations
• Percent Myotis sequences identified as MYSO differs between programs
• PESU/MYGR identification contributes to substantial differences between programs
Considerations
• Substantial disagreement between BCID, EchoClass, and visual analysis – MYSO identification (low % concurrence) – Activity levels – “UNKN” files
• Confounding factors – Noise – Variability of bats (EPFU, LABO, etc) – Habitat, detector placement – Files with multiple bats/species
• No identification system is perfectly accurate – Visual QAQC may provide a necessary “reality check” – Errors may be more related to bats than software – Uncertainty should be applied to species presence/absence
Considerations
• Appropriate identification method must align with objectives and stated assumptions of acoustic bat surveys!
– Activity levels and activity patterns – Presence/absence of activity – Presence/absence of rare species
• Bat’s variability and substantial effect of habitat and detector placement will add uncertainty to any acoustic identification method

Questions?