1
printed by www.postersession.com Comparison of antioxidant capacity in urine by ORAC analysis after consumption of muscadine grape juice B. DeRatt, G. Whitwell, F. X. Arredondo, N. E. Craft North Carolina Wesleyan College and Craft Technologies Inc., Wilson, NC Approximately 2-3% of oxygen consumed during cellular aerobic metabolism is converted into free radicals. 1 Antioxidants and phenolic compounds work to remove the free radicals before damage can occur. Most fruits and vegetables contain high levels of antioxidants. 2 Muscadine grapes, which are native to the southeastern United States, contain high levels of antioxidants. In this study, urine was analyzed before and after the consumption of muscadine grape juice to compare the antioxidant statuses. The Oxygen Radical Absorbance Capacity assay (ORAC) measures the antioxidant scavenging activity against peroxyl radicals which is induced by 2,2-Azobis(2-amidinopropane) dihydrochloride (AAPH). 3 ORAC was used to determine the entire antioxidant status of each sample but uric acid, which is naturally produced in the body, was found to overshadow the effects of the juice consumption. The uric acid and vitamin C concentration were determined for the control and experimental data using high pressure liquid chromatography. As a population, there was no significant change in the antioxidant capacity of urine before the consumption of grape juice compared to the antioxidant capacity of urine after grape juice consumption. This was determined by the ANOVA statistical analysis. The experimental t-test analysis showed that two participants had statistical increases in the antioxidant capacity after consuming the grape juice. This is shown by the asterisks above the bars in the ORAC graph. Uric Acid analysis was performed to determine if the uric acid in the samples was overshadowing the antioxidant effects from the grape juice. Urinary uric acid concentration was lower in nearly all subjects after the consumption of muscadine grape juice. It is unknown if the uric acid decrease is due to juice consumption but any changes in urinary ORAC due to juice consumption were obscured by concomitant changes in urinary uric acid. Although some people's initial urine sample did not contain Vitamin C, in those that did, an increase was seen after the consumption of the grape juice. The total phenolics analysis of the grape juice indicated that 115.4 μg/g is available for each sample consumed. Figure 2. Statistical significance was determined for 2 participants when comparing the averages of the control and experimental data while 8 participants had no significant increase. I would like to thank Craft Technologies for their support and the opportunity to attend this conference. I would like to thank Dr. Craft, Dr. Arredondo, and Dr. Whitwell for their insight and guidance. I would also like to thank Roger and Gail Davenport Taylor for their contributions to the Honor’s Program at North Carolina Wesleyan College. 1 Wu, X. B. (2004). Lipophilic and Hydrophilic Antioxidant Capacities of Common Foods in the United States. J. Agric. Food Chem. , 4026-4037. 2 Prior, R. H.-W. (2003). Assays for Hydrophilic and Lipophilic Antioxidant Capacity (oxygen radical absorbance capacity (ORACFL)) of Plasma and Other Biological and Food Samples. J. Agric. Food Chem. , 3273-3279 3 Ou, B. H.-W. (2001). Development and Validation of an Improved Oxygen Radical Absorbance Capacity Assay Using Fluorescein as the Fluorescent Probe. J. Agric. Food Chem. , 4619-4626. 4 zenbio. (2008, September 8). ORAC Antioxidant Assay Kit. Retrieved July 2010, from www.zenbio.com ORAC Each urine sample was diluted by 100-fold before performing the ORAC analysis. Fluorescein was used as the fluorescent probe and Trolox was the standard. Loss of fluorescence over time is due to the peroxyl-radical formation by the breakdown of AAPH. 4 The results were analyzed in Excel and statistical analyses was performed with IBM SPSS Statistics Software. Uric Acid Analysis High Pressure Liquid Chromatography (HPLC) was used to determine uric acid concentration. Daily aliquots for the control, day 1-10, were combined so a approximate uric acid content could be determined. The same protocol was used for experimental days. Vitamin C concentrations in the grape juice and each sample were also determined in this test. Total Phenolics This spectophotometric test measures all the phenolic compounds in the sample. The Folin reagent used causes a color change based on the ability of each sample to be oxidized. A calibration curve of catechin was used to estimate the phenolic concentration of the muscadine grape juice. The wavelength used was 765 nm. INTRODUCTION METHODS RESULTS DISCUSSION BIBLIOGRAPHY ACKNOWLEDGEMENTS 0 10 20 30 40 50 60 70 80 90 100 1 2 3 4 5 6 7 8 9 10 11 12 13 14 15 Area Under the Curve Cycle Number Trolox Calibration Blank S1 (200 μM) S2 (100 μM) S3 (50 μM) S4 (25 μM) S5 (12.5 μM) 0 5 10 15 20 25 30 1 2 3 4 5 6 7 8 9 10 ORAC (μmol Trolox/mL) Participants Antioxidant content of urine before and during Muscadine juice consumption Avg 1-10 Avg 11-20 * * Figure 1. Trolox calibrations were run at the beginning and end of each run. Figure 3. Uric acid (μg/mL) in combined urine samples by subject and juice consumption status. Generally higher uric acid content can be seen in the control days. Significance was not determined. 0 100 200 300 400 500 600 700 800 1 2 3 4 5 6 7 8 9 10 ug/mL Uric Acid Particpants Uric acid content of urine before and during Muscadine juice consumption Uric Acid Control Uric Acid with Juice y = 0.204x - 0.121 0 0.1 0.2 0.3 0.4 0.5 0.6 0.7 0.8 0 1 2 3 4 5 Absorbance Calibrants Total Phenolics Determination in Muscadine Grape Juice Figure 4. Catechin calibrant curve is used to determine the micrograms of total phenolic for per gram of sample. Figure 5. A chromatogram showing the Vitamin C and uric acid peaks of one subject. Uric Acid Analysis Chromatogram CONCLUSIONS Positive variance was found in two participants consistent with a positive correlation between antioxidant consumption and antioxidant absorption. Since uric acid was found to play a major role in total antioxidant capacity, future studies will account for this contribution. The availability of the analytical methods for antioxidant assays in urine and other biological samples have provided means for observing enhanced antioxidant concentration in urine.

Comparison of antioxidant capacity in urine by ORAC analysis after

  • Upload
    others

  • View
    5

  • Download
    0

Embed Size (px)

Citation preview

printed by

www.postersession.com

Comparison of antioxidant capacity in urine by ORAC analysis after

consumption of muscadine grape juice B. DeRatt, G. Whitwell, F. X. Arredondo, N. E. Craft North Carolina Wesleyan College and Craft Technologies Inc., Wilson, NC

Approximately 2-3% of oxygen consumed during cellular aerobic

metabolism is converted into free radicals.1 Antioxidants and phenolic

compounds work to remove the free radicals before damage can occur.

Most fruits and vegetables contain high levels of antioxidants.2

Muscadine grapes, which are native to the southeastern United States,

contain high levels of antioxidants. In this study, urine was analyzed

before and after the consumption of muscadine grape juice to compare the

antioxidant statuses. The Oxygen Radical Absorbance Capacity assay

(ORAC) measures the antioxidant scavenging activity against peroxyl

radicals which is induced by 2,2’-Azobis(2-amidinopropane)

dihydrochloride (AAPH).3 ORAC was used to determine the entire

antioxidant status of each sample but uric acid, which is naturally

produced in the body, was found to overshadow the effects of the juice

consumption. The uric acid and vitamin C concentration were determined

for the control and experimental data using high pressure liquid

chromatography.

•As a population, there was no significant change in the antioxidant capacity of

urine before the consumption of grape juice compared to the antioxidant

capacity of urine after grape juice consumption. This was determined by the

ANOVA statistical analysis.

•The experimental t-test analysis showed that two participants had statistical

increases in the antioxidant capacity after consuming the grape juice. This is

shown by the asterisks above the bars in the ORAC graph.

•Uric Acid analysis was performed to determine if the uric acid in the samples

was overshadowing the antioxidant effects from the grape juice. Urinary uric

acid concentration was lower in nearly all subjects after the consumption of

muscadine grape juice. It is unknown if the uric acid decrease is due to juice

consumption but any changes in urinary ORAC due to juice consumption were

obscured by concomitant changes in urinary uric acid.

•Although some people's initial urine sample did not contain Vitamin C, in those

that did, an increase was seen after the consumption of the grape juice.

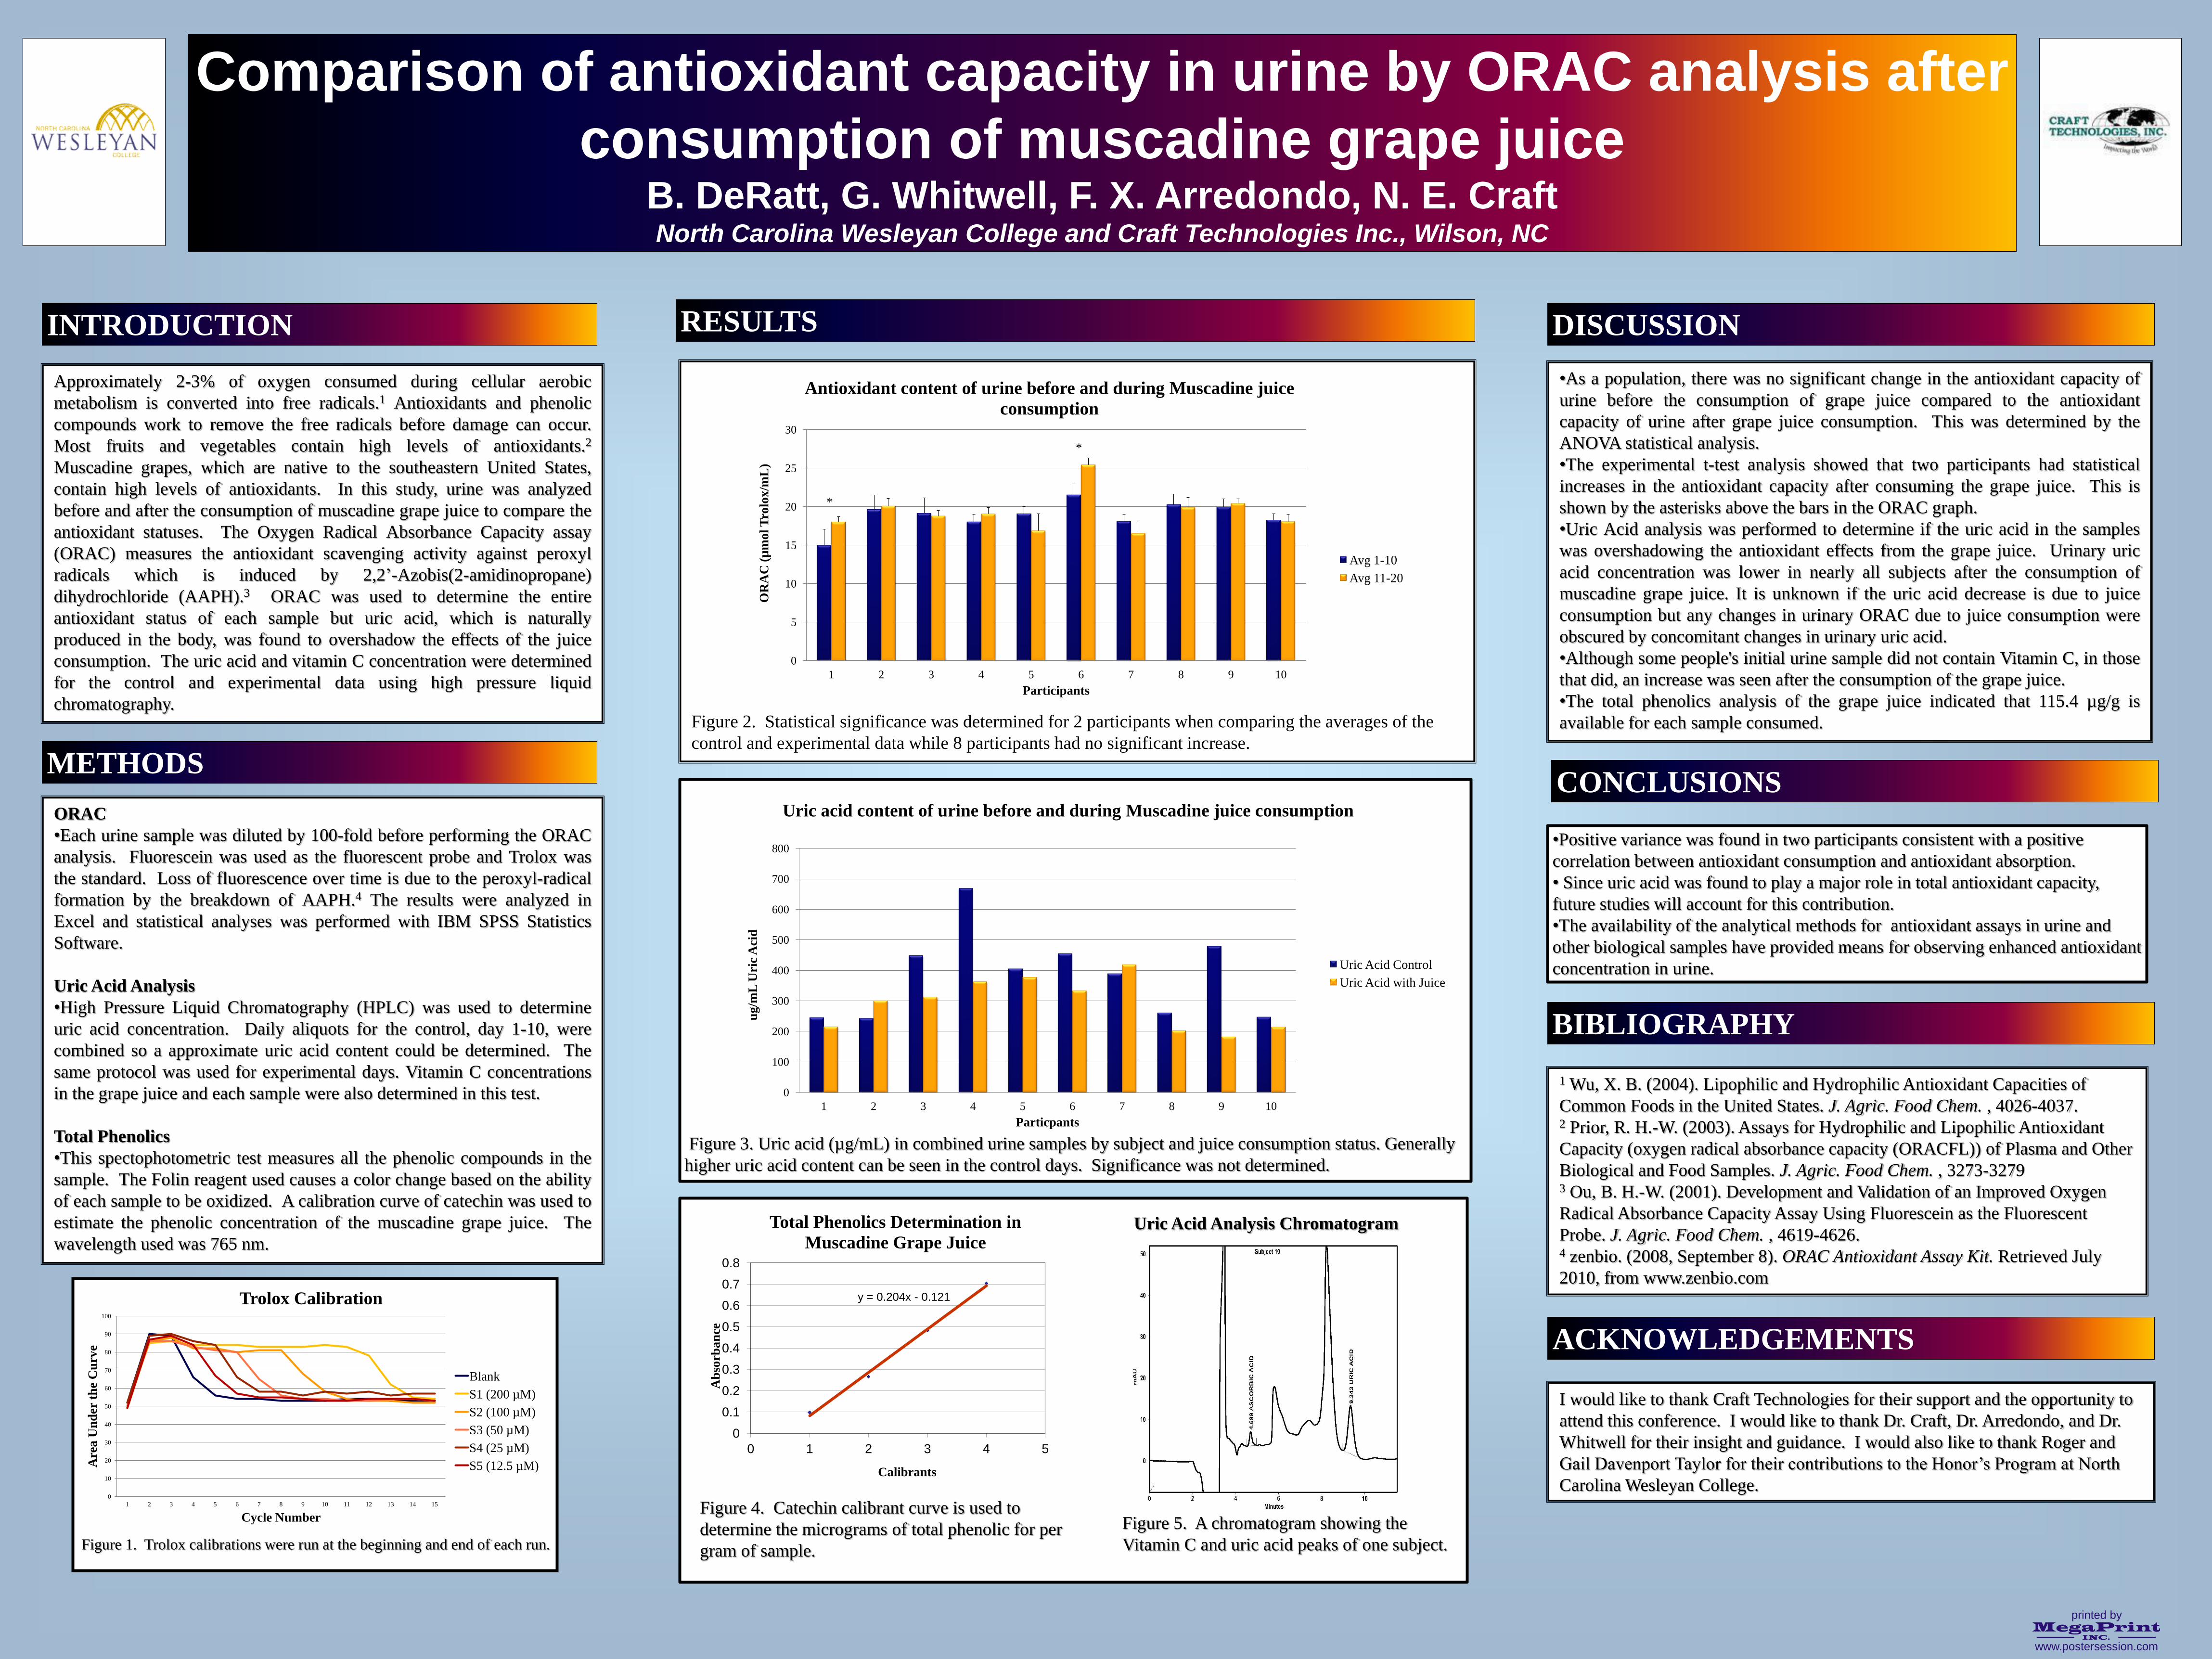
•The total phenolics analysis of the grape juice indicated that 115.4 µg/g is

available for each sample consumed.

Figure 2. Statistical significance was determined for 2 participants when comparing the averages of the

control and experimental data while 8 participants had no significant increase.

I would like to thank Craft Technologies for their support and the opportunity to

attend this conference. I would like to thank Dr. Craft, Dr. Arredondo, and Dr.

Whitwell for their insight and guidance. I would also like to thank Roger and

Gail Davenport Taylor for their contributions to the Honor’s Program at North

Carolina Wesleyan College.

1 Wu, X. B. (2004). Lipophilic and Hydrophilic Antioxidant Capacities of

Common Foods in the United States. J. Agric. Food Chem. , 4026-4037. 2 Prior, R. H.-W. (2003). Assays for Hydrophilic and Lipophilic Antioxidant

Capacity (oxygen radical absorbance capacity (ORACFL)) of Plasma and Other

Biological and Food Samples. J. Agric. Food Chem. , 3273-3279 3 Ou, B. H.-W. (2001). Development and Validation of an Improved Oxygen

Radical Absorbance Capacity Assay Using Fluorescein as the Fluorescent

Probe. J. Agric. Food Chem. , 4619-4626. 4 zenbio. (2008, September 8). ORAC Antioxidant Assay Kit. Retrieved July

2010, from www.zenbio.com

ORAC

•Each urine sample was diluted by 100-fold before performing the ORAC

analysis. Fluorescein was used as the fluorescent probe and Trolox was

the standard. Loss of fluorescence over time is due to the peroxyl-radical

formation by the breakdown of AAPH.4 The results were analyzed in

Excel and statistical analyses was performed with IBM SPSS Statistics

Software.

Uric Acid Analysis

•High Pressure Liquid Chromatography (HPLC) was used to determine

uric acid concentration. Daily aliquots for the control, day 1-10, were

combined so a approximate uric acid content could be determined. The

same protocol was used for experimental days. Vitamin C concentrations

in the grape juice and each sample were also determined in this test.

Total Phenolics

•This spectophotometric test measures all the phenolic compounds in the

sample. The Folin reagent used causes a color change based on the ability

of each sample to be oxidized. A calibration curve of catechin was used to

estimate the phenolic concentration of the muscadine grape juice. The

wavelength used was 765 nm.

INTRODUCTION

METHODS

RESULTS DISCUSSION

BIBLIOGRAPHY

ACKNOWLEDGEMENTS

0

10

20

30

40

50

60

70

80

90

100

1 2 3 4 5 6 7 8 9 10 11 12 13 14 15

Are

a U

nd

er t

he

Cu

rve

Cycle Number

Trolox Calibration

Blank

S1 (200 µM)

S2 (100 µM)

S3 (50 µM)

S4 (25 µM)

S5 (12.5 µM)

0

5

10

15

20

25

30

1 2 3 4 5 6 7 8 9 10

OR

AC

mo

l T

rolo

x/m

L)

Participants

Antioxidant content of urine before and during Muscadine juice

consumption

Avg 1-10

Avg 11-20

*

*

Figure 1. Trolox calibrations were run at the beginning and end of each run.

Figure 3. Uric acid (µg/mL) in combined urine samples by subject and juice consumption status. Generally

higher uric acid content can be seen in the control days. Significance was not determined.

0

100

200

300

400

500

600

700

800

1 2 3 4 5 6 7 8 9 10

ug

/mL

Uri

c A

cid

Particpants

Uric acid content of urine before and during Muscadine juice consumption

Uric Acid Control

Uric Acid with Juice

y = 0.204x - 0.121

0

0.1

0.2

0.3

0.4

0.5

0.6

0.7

0.8

0 1 2 3 4 5

Ab

sorb

an

ce

Calibrants

Total Phenolics Determination in

Muscadine Grape Juice

Figure 4. Catechin calibrant curve is used to

determine the micrograms of total phenolic for per

gram of sample.

Figure 5. A chromatogram showing the

Vitamin C and uric acid peaks of one subject.

Uric Acid Analysis Chromatogram

CONCLUSIONS

•Positive variance was found in two participants consistent with a positive

correlation between antioxidant consumption and antioxidant absorption.

• Since uric acid was found to play a major role in total antioxidant capacity,

future studies will account for this contribution.

•The availability of the analytical methods for antioxidant assays in urine and

other biological samples have provided means for observing enhanced antioxidant

concentration in urine.