Embed Size (px)
Citation preview


1
Comparison of Aircraft Observed with Calculated Downwelling Solar Fluxes during ARESE
Abstract
The objectives of the Atmospheric Radiation Measurement (ARM)
Enhanced Shortwave Experiment (ARESE) are to directly measure clear
and cloudy sky shortwave atmospheric absorption and to quantify any
absorption found in excess of model predictions. We have the
measurements made from collocated aircraft of the absorption of solar
radiation within the atmospheric column between the two aircraft, Egrett
and Twin-Otter. The focus of this study is to find the confidence intervals
of these ARESE measurements. Egrett downwelling flux measurements on
ten days in Fall 1995 are investigated and are compared to SBDART
model calculations. The result shows that the model calculated fluxes have
higher values than those observed, and the differences vary from 0.1 to
24.2 W/m2. The average difference of the ensemble data set is about 11
W/m2. Due to a good understanding of the radiative transfer process at the
level of the Egrett, we assume that this discrepancy is mainly caused by a
radiometer error on board of the aircraft. Because the same instruments
were used also for downwelling flux measurement on the Egrett and both
upward and downwelling flux measurements on the Twin-Otter, we
assume the same magnitude of system error for the other three
observations. With these assumptions, we conclude that the confidence
intervals for the ARESE atmospheric absorption approximately fall into a
± 22 W/m2 range.

2
1. Introduction
The most fundamental quantity determining Earth’s climate is the amount of solar
radiation absorbed by the climate system. This flux of energy is determined by the
amount of short-wave radiation both reflected and absorbed by the system. A major
component in determining the disposition of shortwave radiation in the atmosphere is the
presence of clouds. Radiation models indicate that cloudy skies absorb about as much
shortwave energy as clear skies. Observations of how much shortwave radiation is
absorbed in clouds suggest discrepancies with these models. Recent studies by Cess et al.
[1995], Ramanathan et al. [1995], Pilewskie and Valero [1995], and Waliser et al. [1996]
indicate that clouds absorb considerably more shortwave radiation than current radiative
transfer models suggest. Indeed, there is still a vigorous debate in the atmospheric
radiation community on the cloud shortwave absorption. The disagreement in
interpretation of atmospheric absorption prompted the Atmospheric Radiation
Measurement (ARM) program to initiate a field experiment named the Enhanced
Shortwave Experiment (ARESE) at the Southern Great Plains site in Oklahoma, which
was carried out in 1995. The primary goals of ARESE were to obtain sets of
measurements to determine accurately the absorption of solar radiation by the clear and
cloudy atmospheric column at midlatitudes, and to investigate the spectral regions where
the excess absorption occurs [Valero et al., 1997].
The ARESE data comprise a unique data set for testing our understanding of the
absorption of solar radiation in both clear and cloudy atmospheres. The interest of this
study is to find the confidence intervals for the accuracy of the Egrett measurements. The
calculations from a radiative transfer model are used to compare with the observations.
The uncertainty of the instrument measurement obtained from this study should be

3
incorporated in the comparison of absorption between model prediction and field
measurements.
2. Model Description
The model description in this section is taken from an online paper that appears in
SBDART’s homepage located at http://arm.mrcsb.com/sbdart/html/sbdart-intro.html .
SBDART (Santa Barbara DISORT Atmospheric Radiative Transfer) is a FORTRAN
computer code designed for the analysis of a wide variety of radiative transfer problems
encountered in satellite remote sensing and atmospheric energy budget studies. The
program is based on a collection of highly developed and reliable, physical models which
have been developed by the atmospheric science community over the past few decades.
SBDART relies on low resolution band models developed for the LOWTRAN 7
atmospheric transmission code (Pierluissi and Marogoudakis, 1986). These models
provide the clear sky atmospheric transmission from 0 to 50000 cm-1 and include the
effects of all radiatively active molecular species found in the earth's atmosphere. The
models were derived from detailed line-by-line calculations that were degraded to 20 cm-1
resolution for use in LOWTRAN.
The radiative transfer equation is numerically integrated with the DISORT (DIScreet
Ordinate Radiative Transfer, Stamnes et al., 1988). The discrete ordinate method provides
a numerically stable algorithm to solve the equations of plane-parallel radiative transfer in
a vertically inhomogeneous atmosphere. The intensity of both scattered and thermally
emitted radiation can be computed at different heights and directions. SBDART is
4
configured to allow up to 40 atmospheric layers and 16 radiation streams (16 zenith
angles and 16 azimuthal modes).
SBDART adopts six standard atmospheric profiles from the 5s (Tanre' et al., 1958)
atmospheric radiation code which are intended to model the following typical climatic
conditions: tropical, midlatitude summer, midlatitude winter, subarctic summer, subarctic
winter and US62. These model atmospheres (McClatchey et al., 1971) have been widely
used in the atmospheric research community and provide standard vertical profiles of
pressure, temperature, water vapor and ozone density. In addition, the users can specify
their own model atmosphere based on, for example, a series of radiosonde profiles. In this
work, sounding data from the ARM SGP site are used to specify the atmospheric profile
for input to the SBDART.
3. Aircraft Measurement and Data
The ARM Enhanced Shortwave Experiment (ARESE) was a joint effort by the DOE's
Atmospheric Radiation Measurement Program and its Unmanned Aerospace Vehicle
(UAV) Program. Field measurements, consisting of coordinated observations from three
instrumented aircraft platforms, several operational satellites, and a variety of specialized
ground-based instrument platforms, were made in the vicinity of the ARM Southern
Great Plains Site (SGP) in north central Oklahoma from September 25 to November 1,
1995. The Central Facility for this site is located at longitude 97.48 o W and latitude
36.59 o N. The ARESE data are being used by many scientists to test and refine the
understanding of how clear and cloudy skies interact with solar radiation.
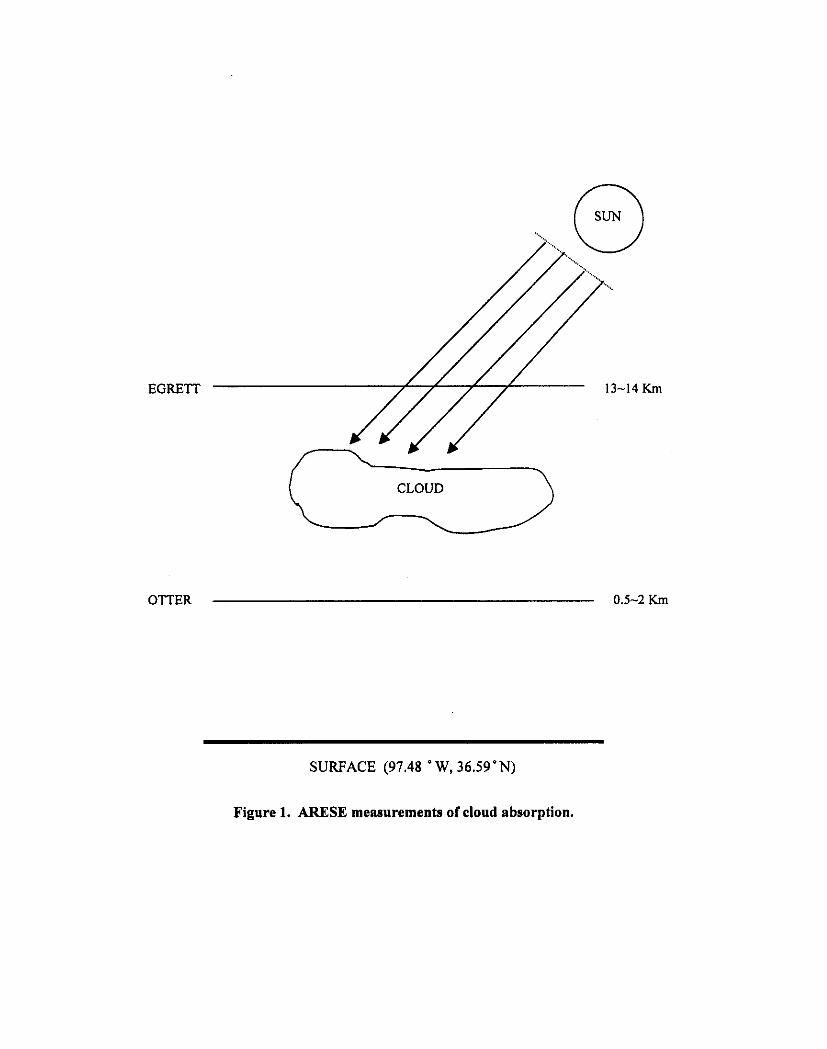
Three kinds of aircraft were used in ARESE: the NASA ER-2 flying at an altitude of
about 20 km, an Egrett flying at an altitude of about 14 km, and a Twin Otter flying at
altitudes ranging from 0.5 to 2 km. Each aircraft was equipped with identical zenith and
nadir pointing radiometers as follows: Total Solar Broadband Radiometers (TSBR) that

5
measure the total broadband solar irradiance (0.224 to 3.91 µ m), Fractional Solar
Broadband Radiometers (FSBR) that measure the broadband near-infrared solar irradiance
(0.68 to 3.30 µ m), and Total, Direct, Diffuse Radiometers (TDDR) that measure in 10
nm wide spectral bands centered at seven wavelengths. Table 1 lists the dates,
observational platforms, and atmospheric conditions encountered during the ARESE
radiometric observations. Figure 1 illustrates schematically the ARESE experiment for the
measurements of atmospheric absorption. The absorption is defined as the difference
between the net fluxes at each level in the atmosphere.
The flux measurement by the Egrett is the focus of this work. Ten days of measurements
are investigated. The days studied in Fall 1995 are:
- Sept. 25, 29
- Oct. 11, 13, 17, 19, 24, 26, 30 and
- Nov. 1.
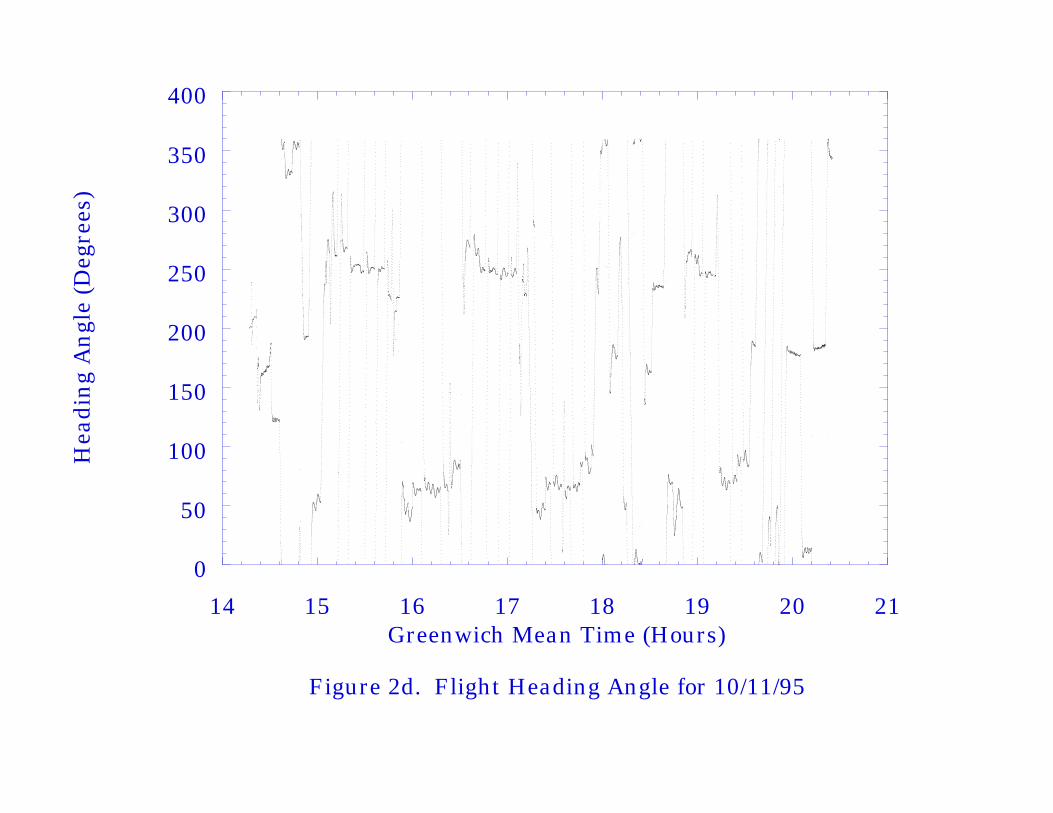
Aircraft navigational data are also available to determine the instrument platform's
position throughout the flight. Figure 2a, 2b, 2c and 2d show the aircraft altitude, pitch,
roll and heading respectively for October 11, 1995. When the aircraft ascends, descends or
makes turns, the aircraft and the instruments on board cannot keep themselves horizontal.
This will affect the measured downwelling flux by a factor of the cosine of the tilting
angle. For refinement, Valero applied corrections to account for the aircraft pitch, roll and
heading. However, the errors of these corrections when the pitch and roll angle is larger
than 2 degrees is unknown. Thus our analysis only includes data with pitch and roll
angles that are less then 2 degrees. Sections when the aircraft was ascending, descending or
turning have been removed (i.e. when the pitch and/or roll exceed approximately ± 2
degree from the zero pitch/roll during level flight). The effect of this refinement is shown
in Figure 3, where Figure 3a shows the downwelling flux for all angles, and Figure 3b
shows the one after the refinement. We can see that the flux is further smoothed, although

6
the change is not significant. We also notice some oscillation of the flux that is too large to
be caused merely by the oscillation of the flight pitch and roll angles and the heading
changes.
4. Model-Measurement Comparisons
The downwelling flux at any given level is composed of direct and diffuse components.
However, at a flight level of the order of 13 km, the optical depths for wavelengths
covered by the radiometers are very small. Thus, to a first order, the monochromatic
downwelling flux at the flight level ( )λF might be approximated as direct beam flux alone
given as
Fλ ↓= Sλµe−τλ
µ (1)
where Sλ is the monochromatic flux incident at the top of the atmosphere, τλ is the
optical depth above the aircraft, and µ is the cosine of the solar zenith angle.
Sinceτλ is small, Eq.(1) may be expanded in a first order Taylor’s series as
Fλ ↓= Sλ µ 1− τλ
µ
(2)
Integrating over all wavelengths yields
F ↓= Sµ − Sλτλdλ∫ (3)
where S is the spectrally integrated solar parameter. Eq.(3) is of the form
F ↓= A + Bµ (4)
That is, for a given distribution of absorbers, F ↓ should be linear in µ .
At the level of the flight at about 13 km, the atmosphere is very thin and the air pressure
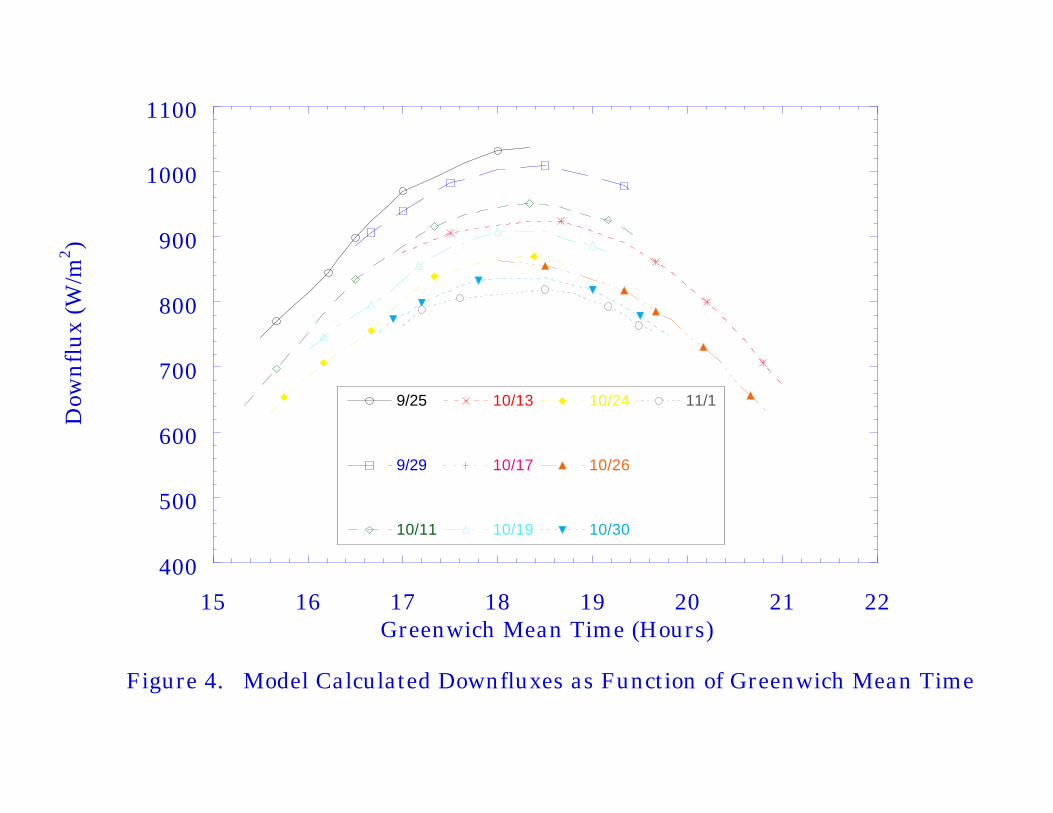
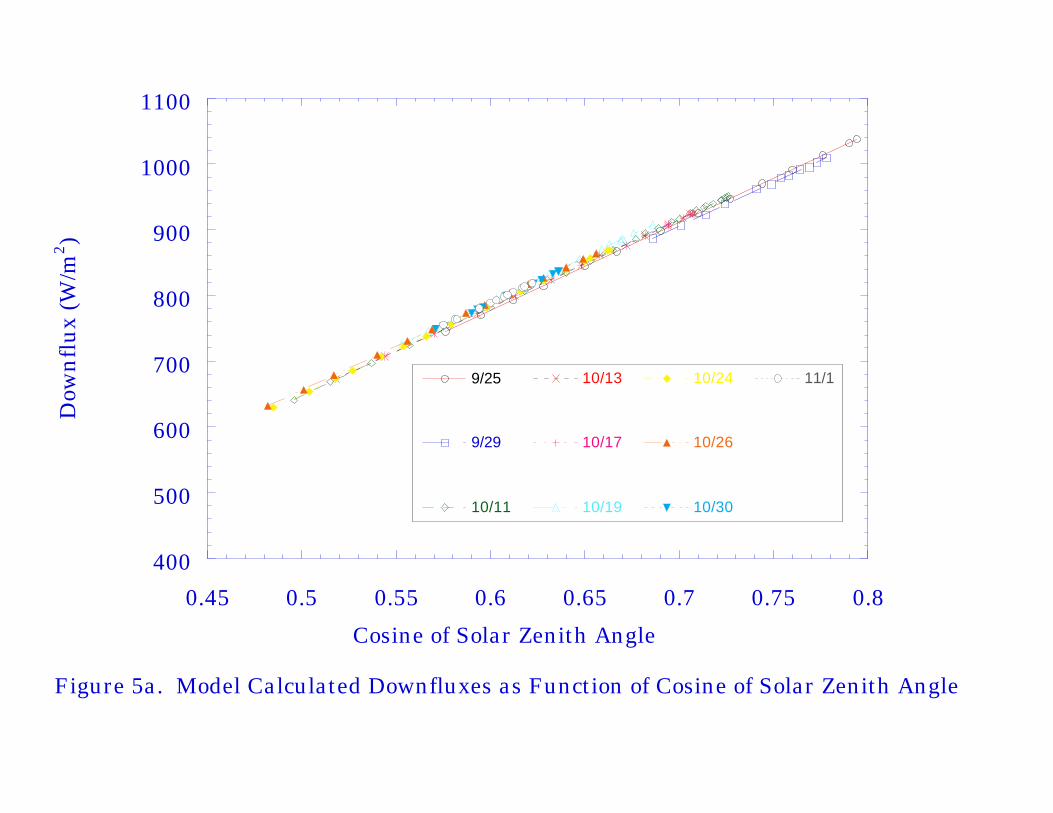
is as low as 150 mb. Figure 4 shows the SBDART-calculated downwelling fluxes versus
the Greenwich Mean Time for the ten flights. The model-calculated downwelling fluxes as

7
the function of µ are shown in Figure 5a. As shown in Figure 5b, the linear regression for
each flight is almost perfect (i.e., the explained variance is nearly 1). This result is what
we expected beforehand because of the small optical depth above the aircraft.
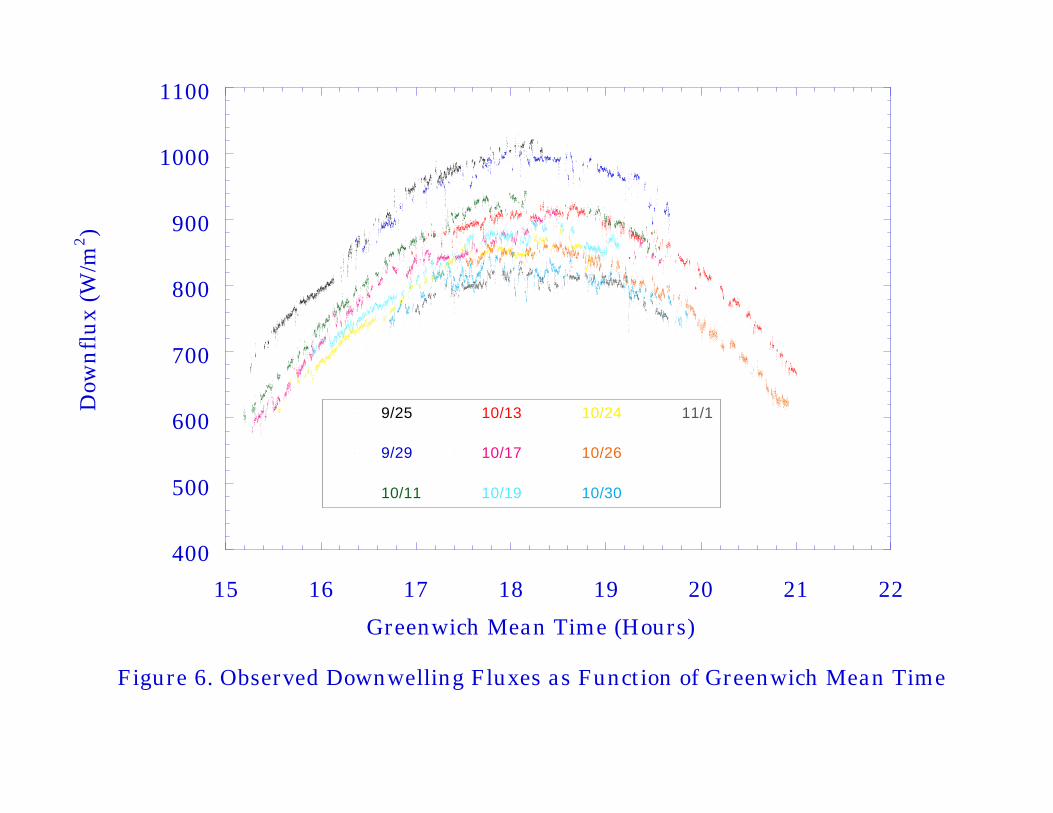
Figure 6 shows the observed downwelling flux versus Greenwich Mean Time for the ten
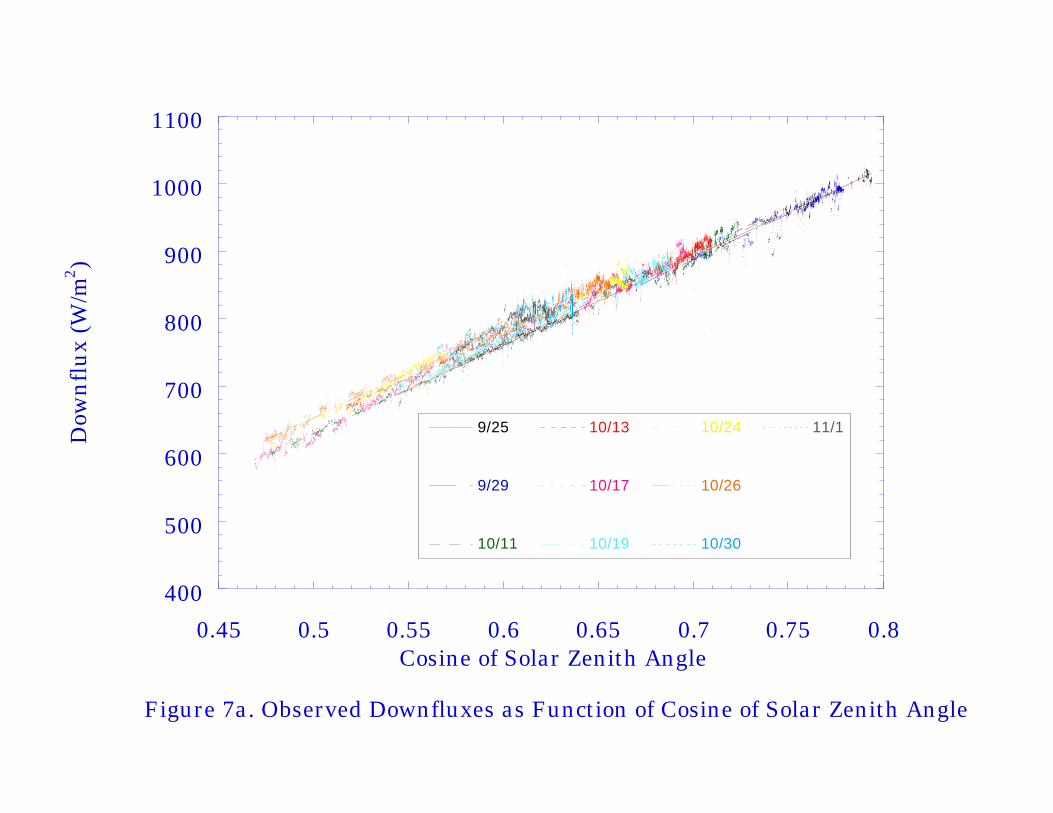
flights. The observed downwelling fluxes as the function of µ for the ten flights are
shown in Figure 7a, and the linear regressions of the flux with µ for the individual days
are given in figure 7b. We can see that the linear properties for the majority days are quite
good except two days, Oct. 10 and Nov. 1. The reason for the large flux deviation for
these two days is still not known. A possible reason is that there were unseen high level
clouds above the Egrett aircraft during its flights. For the entire data set, even without the
effect of two days’ large deviation, we still cannot get a good linear regression because the
downwelling fluxes for each day do not fit very well to each other, though they may look
fine themselves from day to day.
We can write the linear regressions of these two sets as
Fobs ↓= Aobs + Bobs × µFcal ↓= Acal + Bcal × µ
(5)
where Fcal and Fobs are the observed and calculated downwelling flux respectively. The
mean difference between them for a given day can be written as
ε ↓= Fobs ↓ −Fcal ↓= ∆A + ∆B × µ (6)
where µ is the average of the cosine of the solar zenith angle for a given day.
A comparison of the flight averaged flux differences is given in Table 2. The table shows
that the differences range from 0.1 to 24.2 W/m2. Although the difference between the
observations and the calculations changes without any trend from day to day, the model-
8
calculated downwelling fluxes always have higher values than the observations. The linear
average of the flux difference for the ensemble data set is about 11 W/m2.
In the SBDART calculation, a user has freedom to set various parameters for the input to
the model. Besides the atmospheric profile, the time, location, solar zenith angle, aerosol
type, visibility and surface albedo are among the available choices. For the fluxes shown
in Figure 4 and 5, the flight measured sounding and navigation data are used to determine
the profile, the time, the location and the solar zenith angle to minimize the potential
cause of the difference between the observation and the calculation. The only subjectively
selected parameters for the input are aerosols type, surface albedo and ozone
concentration. For the calculations shown, we use a rural aerosol with a visibility of 23
km, and the surface albedo is set to 0.22. At the height of the Egrett, the aerosol and the
albedo are not the crucial factors for the model calculation. In order to ensure this
assumption, we tested other combinations for these two parameters. The urban aerosol,
no aerosol and vegetation surface albedo have been tried. In addition, we also tried the
mid-latitude summer, mid-latitude winter and US62 atmospheric profile for the input to
SBDART. The resulting changes to the original fluxes are no larger than 3 to 4 W/m2, and
this value cannot explain the large deficit of the observation compared to the calculation.
The cause of this deficit is still unclear. But due to our good understanding of the radiative
transfer at high altitudes, the consistency of the model calculations, and the drastic change
of the observations from day to day, we are suspicious that there exist system errors in
the radiometric instruments on board the Egrett, and the errors in the downwelling flux is
primarily caused by the instrument error.
Due to our poor understanding of radiative transfer in presence of clouds,, it is impossible
to use the same technique to estimate the errors in the upward flux at Egrett levels and
both the upward and downwelling fluxes at Otter levels. Because the same instruments
are used for both upward and downwelling flux measurement, and since they are used on

9
both the Egrett and the Otter, we assume the same instrument system error holds for the
other three comparisons.
Let εdenote the instrument system error. Assuming random error, the net flux deviation
for each level can be written as
δFnet = ε ↓
2 +ε ↑2
12= 2ε (7)
Then the error in the net flux difference between the two levels E( )netF∆ is 2ε , because
E ∆Fnet( ) = δFnetEgrett
2 + δFnetOtter2( )
12 = 2 ε (8)
i.e.
∆Fnet = ∆FnetObs ± E ∆Fnet( ) = ∆FnetObs ± 2ε (9)
where ∆FnetObs and ∆Fnet are the observed and the actual net flux difference between
the two levels.
Thus the 95% confidence intervals on the net absorption of the atmosphere between the
layer falls into 4ε , which is about 44 W/m2. This uncertainty should be incorporated in
studies of the cloud absorption comparison between model prediction and field
measurements.
5. Conclusion
One of the goals of the ARM ARESE experiment is to measure the atmospheric
absorption of shortwave solar radiation in both clear and cloudy sky cases. By comparing
the measurements with the model prediction, we can have better understanding of the
shortwave absorption process, especially for the cloudy case. The absorption can be
obtained by differencing the net fluxes measured by two collocated aircraft, Egrett and
Otter, which flew above and below the cloud respectively.

10
The purpose of this study is to find the confidence intervals for the measurement by
comparing the observed fluxes with the SBDART model calculations. A total of ten days’
Egrett downwelling flux measurements in Fall 1995 were compared to the SBDART
model calculations. We find that the model calculated fluxes have higher values than the
observations, and the differences vary from 0.1 to 24.2 W/m2. The average difference of
the ensemble data set is about 11 W/m2. Due to our good understanding of the radiative
transfer process at and above the level of the Egrett, we can assume that this discrepancy
is mainly caused by an error in the radiometer system on board the aircraft. Because of
our poor knowledge of the effects of the clouds between the two levels, similar
comparisons between the observation and calculations the Egrett’s upward flux and both
Otter’s upward and downwelling flux cannot be performed. The fact that the same
instruments were also used for downwelling flux measurement on the Egrett and both
upward and downwelling flux measurements on the Twin-Otter enable us to make the
assumption that the same same magnitude of system error for the other three instruments.
With these assumptions, we find that the confidence limits on the ARESE atmospheric
absorption approximately falls into a ± 24 W/m2 range.
This uncertainty of the shortwave absorption should be incorporated in any study that
interprets the comparison of ARESE shortwave observations with calculations. Further
investigation is needed to find the cause of the discrepancy between the EGRETT
observed and SBDART calculated downwelling fluxes.
References
Cess, R. D., et al., Absorption of lolar radiation by clouds: Observations versus models,
Science, 267, 496-499, 1995.
Cess, R. D., M.H. Zhang, X. Jing, and V. Dvortsov, Absorption of solar radiation by
clouds: Interpretations of satellite, surface, and aircraft measurements, J.
Geophys. Res., 101(D18), 23,299-23,309, 1996.
Valero, F. P. J., R. D. Cell, M. Zhang, S. K. Pope, A. Bucholtz, B. Bush, and J. Vitko,
Jr., Absorption of solar radiation by the cloudy atmosphere: Interpretations of
collocated aircraft measurements, J. Geophys. Res., 102(D25), 29,917-29,927,
1997.
Velaro, F. P.J., A. Bucholtz, B. C. Bush, S. K. Pope, W. D. Collins, and P. Flatau,
Atmospheric Radiation Measurements Enhanced Shortwave Experiment
(ARESE): Experimental and data details, J. Geophys. Res., 102(D25), 29,929-
29-937, 1997.
Zender, C. S., B. Bush, S. K. Pope, A. Bucholtz, W. D. Collins, J. T. Kiehl, P. J. Valero,
and J. Vitko Jr., Atmospheric absorption during the Atmospheric Radiation
Measurement (ARM) Enhanced Shortwave Experiment (ARESE), J. Geophys.
Res., 102(D25), 29,901-29,915, 1997.
Gautier, C., P. Ricchiazzi and S. Yang, SBDART: A practical tool for plane-parallel
radiative transfer in the earth’s atmosphere.
on-line: http://arm.mrcsb.com/sbdart/html/sbdart-intro.html

0
2000
4000
6000
8000
1 104
1.2 104
1.4 104
1.6 104
14 15 16 17 18 19 20 21
Alt
itu
de
(m)
Greenwich Mean Time (Hours)
Figure 2a. Flight altitude for 10/11/95.

-15
-10
-5
0
5
10
15
14 15 16 17 18 19 20 21
Pit
ch A
ngl
e (R
ad
ian
)
Greenwich Mean Time (Hours)
Figure 2b. Flight Pitch Angle for 10/11/95

-60
-40
-20
0
20
40
14 15 16 17 18 19 20 21
Rol
l A
ngl
e (R
ad
ian
)
Greenwich Mean Time (Hours)
Figure 2c. Flight Roll Angle for 10/11/95
0
50
100
150
200
250
300
350
400
14 15 16 17 18 19 20 21
Hea
din
g A
ngl
e (D
egre
es)
Greenwich Mean Time (Hours)
Figure 2d. Flight Heading Angle for 10/11/95

500
600
700
800
900
1000
15 16 17 18 19 20 21
Dow
nfl
ux
(W/m
2)
Greenwich Mean Time (Hours)
Figure 3a. Downwelling flux for 10/11/95 (for all pitch and roll angles)

550
600
650
700
750
800
850
900
950
15 16 17 18 19 20
Dow
nfl
ux
(W/m
2)
Greenwich Mean Time (Hours)
Figure 3b. Downwelling flux for 10/11/95 (for pitch and roll angleswithin ± 2 degrees of level flight).
400
500
600
700
800
900
1000
1100
15 16 17 18 19 20 21 22
9/25
9/29
10/11
10/13
10/17
10/19
10/24
10/26
10/30
11/1
Dow
nfl
ux
(W/m
2)
Greenwich Mean Time (Hours)
Figure 4. Model Calculated Downfluxes as Function of Greenwich Mean Time
400
500
600
700
800
900
1000
1100
0.45 0.5 0.55 0.6 0.65 0.7 0.75 0.8
9/25
9/29
10/11
10/13
10/17
10/19
10/24
10/26
10/30
11/1
Dow
nfl
ux
(W/m
2)
Cosine of Solar Zenith Angle
Figure 5a. Model Calculated Downfluxes as Function of Cosine of Solar Zenith Angle
400
500
600
700
800
900
1000
1100
15 16 17 18 19 20 21 22
9/25
9/29
10/11
10/13
10/17
10/19
10/24
10/26
10/30
11/1Dow
nfl
ux
(W/m
2)
Greenwich Mean Time (Hours)
Figure 6. Observed Downwelling Fluxes as Function of Greenwich Mean Time
400
500
600
700
800
900
1000
1100
0.45 0.5 0.55 0.6 0.65 0.7 0.75 0.8
9/25
9/29
10/11
10/13
10/17
10/19
10/24
10/26
10/30
11/1Dow
nfl
ux
(W/m
2)
Cosine of Solar Zenith Angle
Figure 7a. Observed Downfluxes as Function of Cosine of Solar Zenith Angle

y = -30.023 + 1316.5x R2= 0.99622
y = -62.726 + 1357x R2= 0.92826
y = -36.975 + 1332.3x R2= 0.99197
y = 19.98 + 1258.8x R2= 0.98993
y = -35.407 + 1337.7x R2= 0.98847
y = -20.335 + 1312.9x R2= 0.97825
y = 17.758 + 1270.3x R2= 0.98524
y = -4.0442 + 1315.2x R2= 0.98904
y = 138.25 + 1079.6x R2= 0.7449
y = 44.428 + 1240.8x R2= 0.76974
Figure 7b. Linear Regressions of observed downwelling fluxes with thecosine of the solar zenith angle. The dash line patterns correspond to thedates shown in Fig. 7a, and R2 is the explained variance.
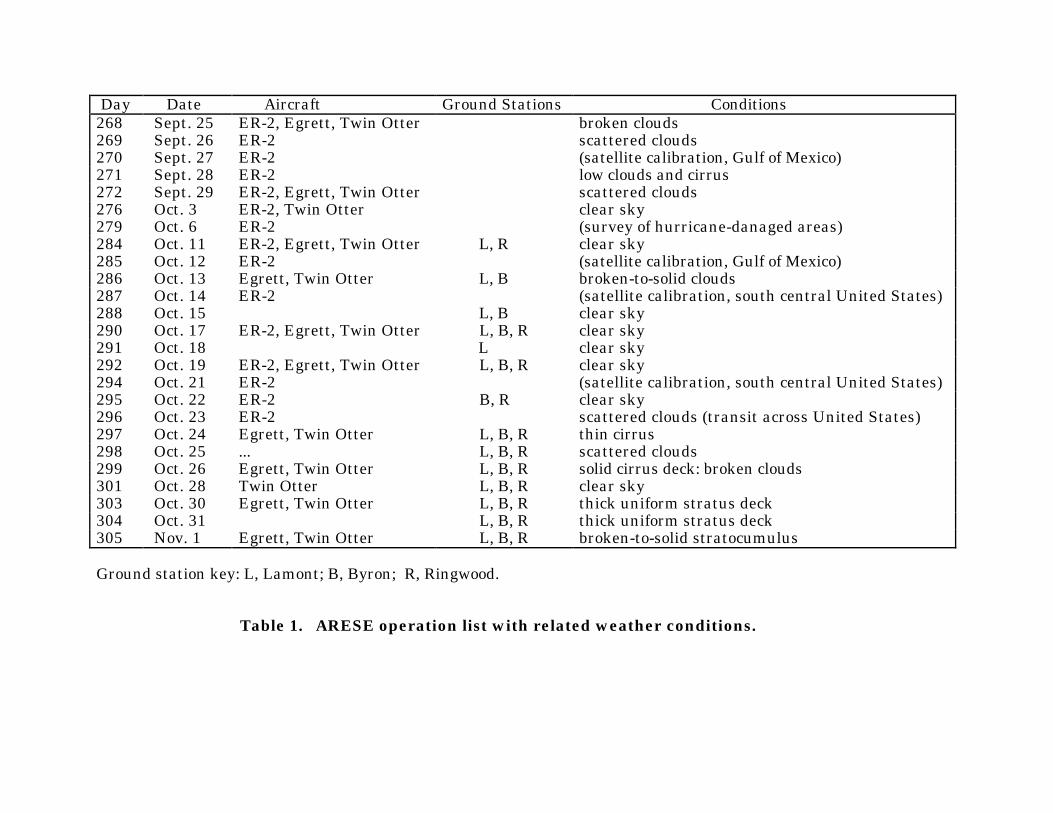
Day Date Aircraft Ground Stations Conditions268 Sept. 25 ER-2, Egrett, Twin Otter broken clouds269 Sept. 26 ER-2 scattered clouds270 Sept. 27 ER-2 (satellite calibration, Gulf of Mexico)271 Sept. 28 ER-2 low clouds and cirrus272 Sept. 29 ER-2, Egrett, Twin Otter scattered clouds276 Oct. 3 ER-2, Twin Otter clear sky279 Oct. 6 ER-2 (survey of hurricane-danaged areas)284 Oct. 11 ER-2, Egrett, Twin Otter L, R clear sky285 Oct. 12 ER-2 (satellite calibration, Gulf of Mexico)286 Oct. 13 Egrett, Twin Otter L, B broken-to-solid clouds287 Oct. 14 ER-2 (satellite calibration, south central United States)288 Oct. 15 L, B clear sky290 Oct. 17 ER-2, Egrett, Twin Otter L, B, R clear sky291 Oct. 18 L clear sky292 Oct. 19 ER-2, Egrett, Twin Otter L, B, R clear sky294 Oct. 21 ER-2 (satellite calibration, south central United States)295 Oct. 22 ER-2 B, R clear sky296 Oct. 23 ER-2 scattered clouds (transit across United States)297 Oct. 24 Egrett, Twin Otter L, B, R thin cirrus298 Oct. 25 ... L, B, R scattered clouds299 Oct. 26 Egrett, Twin Otter L, B, R solid cirrus deck: broken clouds301 Oct. 28 Twin Otter L, B, R clear sky303 Oct. 30 Egrett, Twin Otter L, B, R thick uniform stratus deck304 Oct. 31 L, B, R thick uniform stratus deck305 Nov. 1 Egrett, Twin Otter L, B, R broken-to-solid stratocumulus
Ground station key: L, Lamont; B, Byron; R, Ringwood.
Table 1. ARESE operation list with related weather conditions.