Embed Size (px)
Citation preview
Metrologia 52 (2015) Tech. Suppl. 06024
1/98
Comparison of air kerma area product and air kerma meter calibrations
for X-ray radiation qualities used in diagnostic radiology.
Report on the EURAMET project #1177, identified in the BIPM key comparison database (KCDB) as EURAMET RI(I) – S9
C.J. Hourdakis (a), I. Csete(b,j), J. Daures(c), H. Jarvinen(d), L-C Mihailescu(e), V. Sochor(f), L. Novak(g), K. M. Pedersen(h), A. Kosunen(d), P. Toroi(d), M. Denoziere(c), L. Büermann(i), A. Megzifene(b), G. Einarsson(k), P. Ferrari(l), J. dePooter(m), H. Bjerke(n), M. Brodecki(o), J. Cardoso(p), S. Bercea(q), O. Ciraj-Bjelac(r), J. Compel(s), D. Glavič-Cindro(t), M.Ginjaume(u), Linda Persson(v) and Jan-Erik Grindborg(v) (a) Ionizing Radiation Calibration Laboratory, Greek Atomic Enegy Commission (IRCL/GAEC-EIM), (pilot
laboratory and corresponding author), Greece (b) International Atomic Energy Agency, IAEA
(c) LNE–Laboratoire National Henri Becquerel (LNHB-LNE), France
(d) Radiation and Nuclear Safety Authority (STUK), Finland
(e) Belgian Nuclear Research Centre (SCK•CEN), Belgium (f) Czech Metrology Institute (CMI), Czech Republic (g) “SURO” National Radiation Protection Institute (SURO), Czech Republic (h) National Institute of Radiation Protection (SIS), Denmark (i) Physikalisch-Technische Bundesanstalt (PTB), Germany (j) Hungarian Trade Licensing Office (MKEH), Hungary (k) Icelandic Radiation Safety Authority / Geislavarnir ríkisins (GR), Iceland (l) Istituto di Radioprotezione (IRP-DOS, ENEA), Italy (m) Dutch Metrology Institute (VSL), The Netherlands (n) Norwegian Radiation Protection Authority (NRPA), Norway (o) Nofer Institute of Occupational Medicine (NIOM), Poland (p) Nuclear and Technology Institute, Metrology Laboratory for Ionising Radiation and Radiocativity (ITN-
LMRI), Portugul (q) Horia Hulubei National Institute of R&D for Physics and Nuclear Engineering (IFIN-HH), Romania (r) “VINCA” Institute of Nuclear Science, Radiation and Environmental Protection Laboratory (VINCA),
Serbia (s) Slovak Institute of Metrology, (SIM), Slovakia (t) Jozef Stefan Institute (JSI), Slovenia (u) Universitat Politècnica de Catalunya, (UPC), Spain (v) Swedish Radiation Safety Authority (SSM), Sweden
Metrologia 52 (2015) Tech. Suppl. 06024
2/98
Abstract The EURAMET #1177 project, identified as EURAMET.RI(I)-S9 comparison, was the first EURAMET wide scale supplementary comparison in the field of diagnostic radiology for air kerma area product, PKA, and air kerma, K. It was conducted with the goal of testing the measurement and calibration capabilities for PKA and K, as well as of supporting the relevant CMCs of the participating laboratories.. Two commercial KAP meters and an ionization chamber were selected as transfer instruments and circulated between the 22 European participants. The measurements were performed from April 2011 until July 2012. The stability and the performance of the transfer instruments were tested by the pilot laboratory (IRCL/GAEC-EIM) and few other laboratories as well. The test results revealed that the energy
(radiation quality), Q, irradiation area, A, and air kerma rate, K̇, dependences of response of the transfer KAP meters influence the comparison of the results when different measurement conditions were pertained and therefore, appropriate correction factors were obtained and applied to the reported calibration results of the laboratories, when necessary. The comparison reference values (CRVs) for each instrument were determined as the weighted mean of the calibration coefficients of the three participating primary laboratories. The relative standard uncertainty of the CRVs were in the range of (0.4 - 1.6) % depending on the transfer instruments and beam qualities. The comparison result as the ratio of the corrected calibration coefficient of participant and the respective CRV, and its uncertainty were calculated for all beam qualities and transfer instruments. The informative degrees of equivalence (DoE) were calculated for the refrence RQR 5 beam quality. In case of air kema area product measurements the results for the RADCAL PDC KAP meter were used. The 216 KAP meter calibration results of the two different transfer instruments in terms of air kerma area product were consistent within 5 % except 40 results of 8 participants. The 103 air kerma calibration results were consistent within 1.7 %, except 10 results of 4 participants.
Metrologia 52 (2015) Tech. Suppl. 06024
3/98
Contents
1. Introduction .................................................................................................................................... 5 2. Participating laboratories ............................................................................................................... 6 2.1 General data ................................................................................................................................. 6
2.2 Calibrating conditions ................................................................................................................... 9
2.2.1 X-ray systems ............................................................................................................................. 9 2.2.2 Radiation qualities and HVL values ......................................................................................... 10 2.2.3 Irradiation conditions: Irradiation field size, irradiation area ................................................. 11 2.2.4 Irradiation conditions: Air kerma rate ..................................................................................... 13 2.2.5. Irradiation conditions: Focus to Detector Distance, FDD ...................................................... 15 2.3 Source of traceability and the standards of the laboratories. ................................................... 15
3. Comparison method ..................................................................................................................... 17 3.1. Description of the overall procedures ....................................................................................... 17
3.2. Transfer instruments ................................................................................................................. 18
3.3 Calibration quantities and radiation qualities ............................................................................ 20
3.4. Method of analysis .................................................................................................................... 20
3.4.1. Comparison Reference Value - CRV ....................................................................................... 20 3.4.2. Comparison result .................................................................................................................. 22 3.4.3. Performance tests of the transfer instruments ...................................................................... 24 3.4.3.1. Stability tests of the transfer instruments .......................................................................... 24
3 4.3.2. Influence of radiation quality, air kerma rate, 𝑲 and irradiation area, A ........................... 24
3.4.3.3. Automatic corrections for air density of the PDC ............................................................... 26
3.4.4. PomPlots ................................................................................................................................. 26 3.4.5. Method for deriving the Degree of Equivalence .................................................................... 27 4. Results and Discussion .................................................................................................................. 28 4.1. Results of calibrations at the participating laboratories ............................................................ 28
4.2. Transfer instruments performance ............................................................................................ 28
4.2.1. Performance tests of KERMA-X .............................................................................................. 28 4.2.1.1. Stability tests of KERMA-X ................................................................................................... 28
4.2.1.2. Energy (radiation quality) dependence of response ........................................................... 29
4.2.1.3. Air kerma rate, 𝑲, dependence of response ....................................................................... 30
4.2.1.4. Irradiation area dependence of response ........................................................................... 32
4.2.2. Performance tests of PDC ....................................................................................................... 33 4.2.2.1. Stability tests of PDC as a KAP meter .................................................................................. 33
4.2.2.2. Temperature and pressure internal indications .................................................................. 33
4.2.2.3. Energy (radiation quality) dependence of response ........................................................... 35
4.2.2.4. Air kerma rate, 𝑲, dependence of response ....................................................................... 36
4.2.2.5. Irradiation area, A, dependence of response ...................................................................... 38
4.2.3. Performance of MAGNA ......................................................................................................... 39 4.2.3.1. Stability of MAGNA chamber .............................................................................................. 39
4.2.3.2. Energy (radiation quality) dependence of response ........................................................... 40
4.2.3.3. Air kerma rate, 𝑲, dependence of response ....................................................................... 41
4.2.3.4. Irradiation area dependence of response ........................................................................... 41
4.2.4. General comments on the instruments performance ........................................................... 42
Metrologia 52 (2015) Tech. Suppl. 06024
4/98
4.3. Determination of the Comparison Reference Value (CRV) ........................................................ 42
4.3.1. CRV for KERMA-X ................................................................................................................... 43 4.3.2. CRV for PDC ........................................................................................................................... 44 4.3.3. CRV for MAGNA ...................................................................................................................... 45 4.4. Comparison result evaluation .................................................................................................... 46
4.4.1. Comparison results of KERMA-X ............................................................................................ 47 4.4.2. Comparison results of the PDC KAP meter ............................................................................. 53 4.4.3. Comparison results of MAGNA. .............................................................................................. 59 4.5. PomPlots ..................................................................................................................................... 64
4.6. Proposal for the Degree of Equivalence ..................................................................................... 68
4.7 Comments on laboratories results .............................................................................................. 72
5. Conclusion .................................................................................................................................... 73 6. Acknowledgments ........................................................................................................................ 73 7. References .................................................................................................................................... 74 APPENDIX A : The submitted results of the participating laboratories ............................................ 76 Notation ............................................................................................................................................. 76
SCK•CEN : Belgian Nuclear Research Centre, Belgium ...................................................................... 77
CMI : Czech Metrology Institute, Czech Republic.............................................................................. 78
SURO : “SURO” National Radiation Protection Institute, Czech Republic. ........................................ 79
SIS : National Institute of Radiation Protection, Denmark ................................................................ 80
STUK : Radiation and Nuclear Safety Authority, Finland ................................................................... 81
LNE-LNHB : Laboratoire National Henri Becquerel/Commissariat à l'Energie Atomique, France .... 82
PTB: Physikalisch -Technische Bundesanstalt, Germany ................................................................... 83
IRCL/GAEC-EIM : Ionizing Radiation Calibration Laboratory, Greek Atomic Energy Commission, Greece ............................................................................................................................................... 84
MKEH: Hungarian Trade Licensing Office, Hungary .......................................................................... 85
IAEA : International Atomic Energy Agency ...................................................................................... 86
GR : Icelandic Radiation Safety Authority / Geislavarnir ríkisins, Iceland ......................................... 87
IRP-DOS : Istituto di Radioprotezione, ENEA, Italy ............................................................................ 88
VSL : Dutch Metrology Institute, The Netherlands ............................................................................ 89
NRPA : Norwegian Radiation Protection Authority, Norway ............................................................ 90
NIOM : Nofer Institute of Occupational Medicine, Poland ............................................................... 91
ITN-LMRI : Nuclear and Technology Institute, Metrology Laboratory for Ionising Radiation and Radiocativity, Portugal ...................................................................................................................... 92
IFIN-HH : Horia Hulubei National Institute of R&D for Physics and Nuclear Engineering, Romania 93
VINCA : “VINCA” Institute of Nuclear Science, Radiation and Environmental Protection Laboratory, Serbia ................................................................................................................................................. 94
SIM : Slovak Institute of Metrology, Slovakia .................................................................................... 95
JSI : Jozef Stefan Institute, Slovenia ................................................................................................... 96
UPC : Universitat Politècnica de Catalunya, Spain ............................................................................ 97
SSM : Swedish Radiation Safety Authority, Sweden ......................................................................... 98
Metrologia 52 (2015) Tech. Suppl. 06024
5/98
1. Introduction Few key and supplementary comparisons in dosimetry at diagnostic radiology (DR) level have been conducted and published yet. In the first comparison, performed under the EUROMET #364 project (2000), a few European primary standard dosimetry laboratories (PSDL) compared their primary air kerma standards for a selected set of X ray qualities used for calibration in DR, including mammography [1]. The EURAMET project #526 (2001-2003), identified as EUROMET.RI(I)-S4 comparison involved a wide variety of available mammography ionization chambers and beam qualities [2]. The BIPM mammography key comparison was established in 2007. Five PSDLs have published results in the data base BIPM.RI(I)-K7. The EURAMET project #1221 (2012) identified as EURAMET.RI(I)-S10, referred to the PTB and IAEA bilateral comparison of the air kerma standards for x-radiation qualities used in general diagnostic radiology and mammography [3]. The BIPM.RI(I)-S1 (2012) supplementary comparison concerned the comparison of the air-kerma standards of the IAEA and the BIPM in the mammography x-ray range from 25 kV to 35 kV [4]. Finally, some international DR research projects also included comparison of dosimeters in clinical and calibration laboratory beams [5, 6, 7, 8, 9]. Considering the lack of robust traceability of the air kerma (Ka), air kerma area product (PKA) and air kerma length, and uncertainty budgets for the different calibration methods, a comparison at the DR level was considered important and desirable. It would enable the PSDL, SSDLs and other dosimetry laboratories to test their dosimetry measurement standards and support their calibration and measurement capabilities (CMC). For this need, the EURAMET #1177 project, identified as EURAMET RI(I)-S9 comparison, was proposed and conducted. It was carried out in conjunction with two other similar comparison programs, scheduled under different organizations and projects as follows:
(a) EURADOS project (EURADOS WG 12, SG 3: Technical aspects on DAP calibration and CT calibration), where laboratories from 5 countries participated (ES, IT, FI, EL and PL), and
(b) IAEA Coordinated Research Program (CRP E2.10.08), Activity 3, focusing on the comparison of air kerma area product (KAP) meter calibration procedures carried out by the participating calibration laboratories in four countries (CZ, FI, EL, RS)
It is worth mentioning that a few laboratories participated in more than one of these three projects. Two KAP meters, the IBA Kerma X-plus DDP TinO (referred as KERMA-X hereafter) and the Radcal PDC (referred as PDC hereafter) and one diagnostic ionization chamber, type Exradin Magna A650 (referred as MAGNA hereafter), were selected as transfer instruments and circulated between the participants. The comparison parameters were their calibration coefficients in terms of air kerma area product, NPKA, and air kerma, NK. Details on the transfer instruments, calibration quantities and beam qualities are presented in section 3. For the EURAMET project, calibrations only at standard radiation beam qualities, i.e. at RQR reference X-ray beam qualities [10], were requested and used for the analysis of results. This was decided in order to maintain the traceability of the measurements and to use the results for supporting the CMC claims of the laboratories published in the BIPM CMC database. Although calibrations for KERMA-X were requested both for incident and transmitted radiation [11], the results were analysed only for calibrations at incident radiation. For the EURADOS and IAEA projects, besides calibrations at standard beam qualities, calibrations also at non-standard beam qualities, selected to resemble the clinical beam qualities, were requested but only on a voluntary basis; i.e. if the laboratory could provide also these calibrations, it was accepted as a partner in this extra comparison. The primary purpose of the comparison at
Metrologia 52 (2015) Tech. Suppl. 06024
6/98
non-standard beam qualities was to study the feasibility of the suggested qualities for calibration, both for incident and transmitted beams; the results will be reported elsewhere and will not be discussed more in this report. Upon an open call between participants, a specific working group (WG) was established to support the coordinator in data evaluation and drafting the report:
Costas J. Hourdakis, IRCL/GAEC-EIM, Greece, coordinator of the EURAMET project #1177 and IAEA CRP E2.10.08 Activity 3,
Hannu Jarvinen, STUK, FInland, coordinator of the EURADOS WG 12 SG 3
Josiane Daures, LNHB-LNE, Franc, member from a PSDL
Istvan Csete, IAEA, convenor of the EURAMET TC-IR Working Group on CMCs and Comparisons
2. Participating laboratories
2.1 General data Twenty two (22) laboratories (PSDLs and SSDLs) participated in this EURAMET #1177 comparison (Table 1): EUARAMET members and associates : SCK-CEN/LNK Belgian Nuclear Research Centre* (BE), CMI (CZ), PTB (DE), SIS (DK), STUK (FI), LNE-LNHB (FR), IRCL/GAEC-EIM (EL), MKEH (HU), IAEA, GR (IS), VSL (NL), NRPA (NO), ITN (PT), IFIN-HH (RO), SSM (SE), SIM (SK) and JSI (SI). (* SCK-CEN/LNK became a member of EURAMET in 2013, during the project reporting phase) Not being EURAMET members : SURO National Radiation Protection Institute (CZ), UPC Universitat Politècnica de Catalunya (ES), IRP-DOS Istituto di Radioprotezione (IT), NIOM Nofer Institute of Occupational Medicine (PL), VINCA Institute of Nuclear Science, Radiation and Environmental Protection Laboratory (RS). The ICRL/GAEC-EIM, Greece (EL) as the pilot laboratory was responsible for the overall coordination of the comparison and the analysis and the reporting of the results.
Metrologia 52 (2015) Tech. Suppl. 06024
7/98
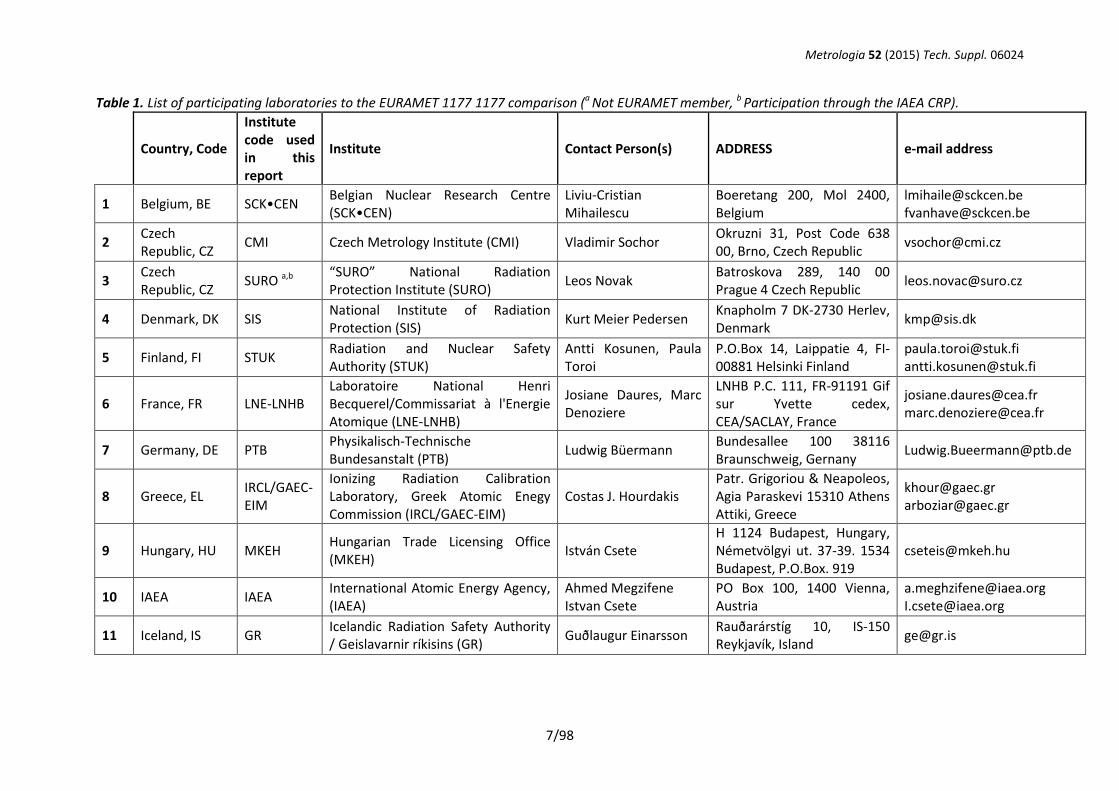
Table 1. List of participating laboratories to the EURAMET 1177 1177 comparison (a Not EURAMET member, b Participation through the IAEA CRP).
Country, Code
Institute code used in this report
Institute Contact Person(s) ADDRESS e-mail address
1 Belgium, BE SCK•CEN Belgian Nuclear Research Centre (SCK•CEN)
Liviu-Cristian Mihailescu
Boeretang 200, Mol 2400, Belgium
[email protected] [email protected]
2 Czech Republic, CZ
CMI Czech Metrology Institute (CMI) Vladimir Sochor Okruzni 31, Post Code 638 00, Brno, Czech Republic
3 Czech Republic, CZ
SURO a,b “SURO” National Radiation Protection Institute (SURO)
Leos Novak Batroskova 289, 140 00 Prague 4 Czech Republic
4 Denmark, DK SIS National Institute of Radiation Protection (SIS)
Kurt Meier Pedersen Knapholm 7 DK-2730 Herlev, Denmark
5 Finland, FI STUK Radiation and Nuclear Safety Authority (STUK)
Antti Kosunen, Paula Toroi
P.O.Box 14, Laippatie 4, FI-00881 Helsinki Finland
[email protected] [email protected]
6 France, FR LNE-LNHB Laboratoire National Henri Becquerel/Commissariat à l'Energie Atomique (LNE-LNHB)
Josiane Daures, Marc Denoziere
LNHB P.C. 111, FR-91191 Gif sur Yvette cedex, CEA/SACLAY, France
[email protected] [email protected]
7 Germany, DE PTB Physikalisch-Technische Bundesanstalt (PTB)
Ludwig Büermann Bundesallee 100 38116 Braunschweig, Gernany
8 Greece, EL IRCL/GAEC-EIM
Ionizing Radiation Calibration Laboratory, Greek Atomic Enegy Commission (IRCL/GAEC-EIM)
Costas J. Hourdakis Patr. Grigoriou & Neapoleos, Agia Paraskevi 15310 Athens Attiki, Greece
[email protected] [email protected]
9 Hungary, HU MKEH Hungarian Trade Licensing Office (MKEH)
István Csete H 1124 Budapest, Hungary, Németvölgyi ut. 37-39. 1534 Budapest, P.O.Box. 919
10 IAEA IAEA International Atomic Energy Agency, (IAEA)
Ahmed Megzifene Istvan Csete
PO Box 100, 1400 Vienna, Austria
[email protected] [email protected]
11 Iceland, IS GR Icelandic Radiation Safety Authority / Geislavarnir ríkisins (GR)
Guðlaugur Einarsson Rauðarárstíg 10, IS-150 Reykjavík, Island
Metrologia 52 (2015) Tech. Suppl. 06024
8/98
12 Italy, IT IRP-DOS a Istituto di Radioprotezione (IRP-DOS, ENEA)
Paolo Ferrari Via dei colli 16, 40136 Bologna (BO) Italy
13 Netherlands, NL
VSL Dutch Metrology Institute (VSL) Jacco de Pooter P.O.Box 654, 2600 AR Delft, The Netherlands
14 Norway, NO NRPA Norwegian Radiation Protection Authority (NRPA)
Hans Bjerke P.O.Box 55 NO-1332 Osteras, Norway
15 Poland, PL NIOM a Nofer Institute of Occupational Medicine (NIOM)
Marcin Brodecki
SSDL, Radiation Protection Dept, Nofer Institute for Occupational Medicine, Sw. Teresy 8, str, 91-348 Lodz
16 Portugal, PT ITN-LMRI
Nuclear and Technology Institute, Metrology Laboratory for Ionising Radiation and Radiocativity (ITN-LMRI)
João Cardoso Estrada Nacional 10, 2686-953 Sacavém, Portugal
17 Romania, RO IFIN-HH Horia Hulubei National Institute of R&D for Physics and Nuclear Engineering (IFIN-HH)
Sorin BERCEA 30 Reactorului st., Magurele, jud. Ilfov, P.O. Box MG-6, RO-077125, Romania
[email protected] [email protected]
18 Serbia, RS VINCA a,b “VINCA” Institute of Nuclear Science, Radiation and Environmental Protection Laboratory (VINCA)
Olivera Ciraj-Bjelac M.P.Alasa 12-14, Vinca, Belgrade (P.O. Box 522, 11001 Belgrade), Serbia
19 Slovakia, SK SIM Slovak Institute of Metrology, SIM Jaroslav Compel Karloveská 63, 842 55 Bratislava 4, Slovakia
20 Slovenia, SI JSI Jozef Stefan Institute (JSI) Denis Glavič-Cindro Jamova 39 1000 Ljubljana, Slovenia
21 Spain, ES UPC a Universitat Politècnica de Catalunya, (UPC)
Merce Ginjaume Diagonal 647, Pavello C, 08028, Barcelona, Spain
22 Sweden, SE SSM Swedish Radiation Safety Authority (SSM)
Jan-Erik Grindborg, Linda Persson
Solna strandväg 122, SE-171 54 Solna, Sweden
Metrologia 52 (2015) Tech. Suppl. 06024
9/98
2.2 Calibrating conditions
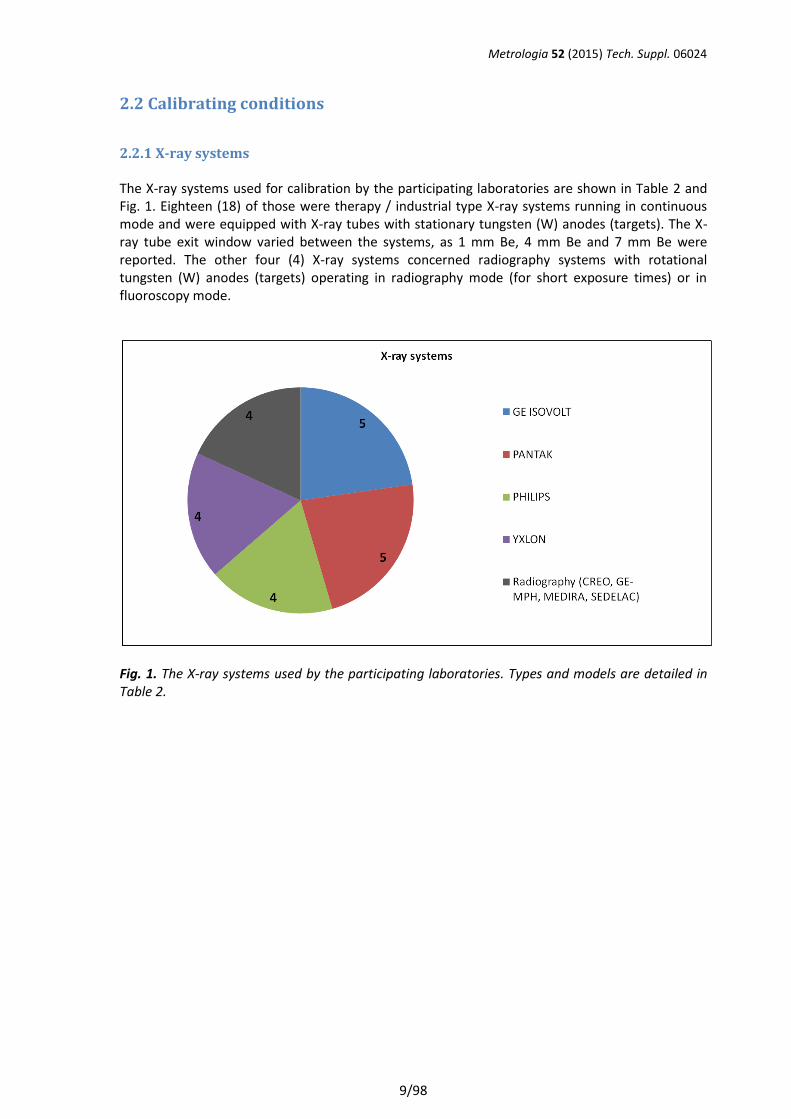
2.2.1 X-ray systems The X-ray systems used for calibration by the participating laboratories are shown in Table 2 and Fig. 1. Eighteen (18) of those were therapy / industrial type X-ray systems running in continuous mode and were equipped with X-ray tubes with stationary tungsten (W) anodes (targets). The X-ray tube exit window varied between the systems, as 1 mm Be, 4 mm Be and 7 mm Be were reported. The other four (4) X-ray systems concerned radiography systems with rotational tungsten (W) anodes (targets) operating in radiography mode (for short exposure times) or in fluoroscopy mode.
Fig. 1. The X-ray systems used by the participating laboratories. Types and models are detailed in Table 2.
Metrologia 52 (2015) Tech. Suppl. 06024
10/98
Table 2. X-ray systems used by the participating laboratories.
Lab X-ray system Stated Inherent tube filtration
SCK•CEN Pantak 350 kV 1.3 mmAl
CMI Isovolt HS 160 1 mm Be
SURO Isovolt Titan, X-ray tube GE, type MXR 160 1 mm Be
SIS Philips MGC 30 Industrial X-ray 4 mmBe
STUK Seifert Isovolt 160 HS generators and MB 161/4 x-ray tube 1 mmBe
LNE-LNHB GEMS MPH65, Maxiray 100 X-ray tube 2 mm Al
PTB XGG generator of Yxlon and MXR165 tube of Comet 4 mm Be
IRCL/GAEC-EIM PANTAK 225 HF 1 mm Be + 5.2 mm PMMA
MKEH Philips MCN 321 Tube 2.2 mm Be +2.5 mm AL
IAEA GE Isovolt Titan 160, tube MRX 160/0.4-3.0 #590030 1 mmBe + PTW monitor chamber
GR Medira Medium High Frequency, Diagnostic X-ray generator --
IRP-DOS PHILIPS MGC 323 3 mm Be window
VSL MG324 CP + MCN321 from Yxlon - Hamburg 4 mm Be
NRPA Pantax, HF320/160. X-ray tube: CometMXR-160 1 mm Be
NIOM Gulmay X-ray Calibration System 300kV 3 mm Be
ITN-LMRI Yxlon MGG42 + Philips MCN165 1 mm Be
IFIN-HH SEDECAL (40 - 150 kV, max 10 s, max 650 mA) 2.1 mm Al
VINCA Philips MG320 #32234 4 mm Al
SIM X-ray Generator CREOS type XHF-30 with X-ray Tube RAD 8 1,8 mm Al at 70 kVp
JSI PANTAK HF 160 1 mm Be + 0.3 mm Al
UPC SEIFERT Isovolt HS of 320 kV. X-ray Seifert, type MB 350 7 mm Be
SSM Tube Yxlon MG 325/4.5-320 kV, generator Yxlon MGP41 3 mm Be
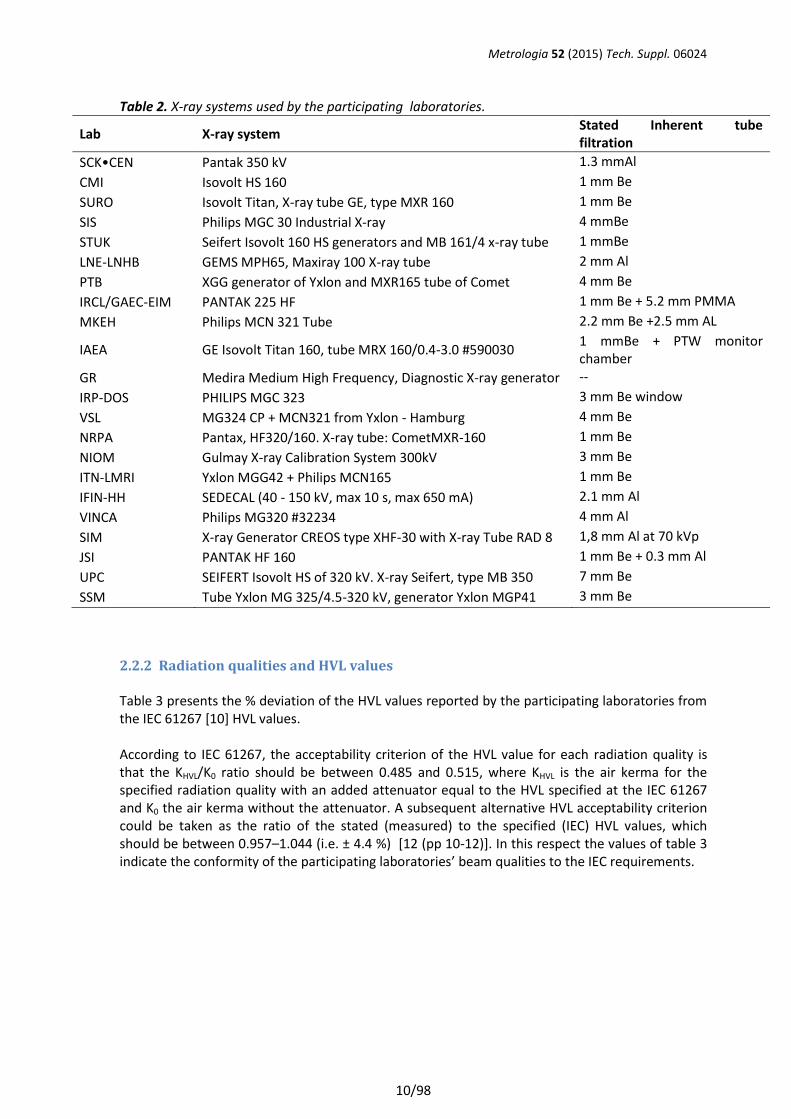
2.2.2 Radiation qualities and HVL values Table 3 presents the % deviation of the HVL values reported by the participating laboratories from the IEC 61267 [10] HVL values. According to IEC 61267, the acceptability criterion of the HVL value for each radiation quality is that the KHVL/K0 ratio should be between 0.485 and 0.515, where KHVL is the air kerma for the specified radiation quality with an added attenuator equal to the HVL specified at the IEC 61267 and K0 the air kerma without the attenuator. A subsequent alternative HVL acceptability criterion could be taken as the ratio of the stated (measured) to the specified (IEC) HVL values, which should be between 0.957–1.044 (i.e. ± 4.4 %) [12 (pp 10-12)]. In this respect the values of table 3 indicate the conformity of the participating laboratories’ beam qualities to the IEC requirements.
Metrologia 52 (2015) Tech. Suppl. 06024
11/98
Table 3. The deviation of the reported HVL from the IEC 61267 HVL values.
Lab code HVL deviation in % from the IEC values
RQR 3 RQR 5 RQR 6 RQR 8 RQR 9
SCK•CEN 0.0 % 0.0 % 0.0 % 0.0 % 0.0 %
CMI -0.1 % 0.2 % -0.9 % 2.5 % 1.0 %
SURO 0.6 % -0.4 % -1.3 % 3.4 % 1.8 %
SIS 0.0 % 0.0 % 0.0 % 0.0 % 0.0 %
STUK 0.6 % 4.1 % -0.7 % -0.3 % 0.6 %
LNE-LNHB -0.6 % 0.4 % 0.3 % 0.3 % 0.0 %
PTB -2.8 % 0.7 % -2.2 % -2.3 % -1.8 %
IRCL/GAEC-EIM 1.4 % 0.0 % -1.9 % 0.3 % -0.4 %
MKEH -0.3 % -0.7 % -1.3 % -0.4 % -1.8 %
IAEA 1.7 % 1.1 % 2.9 % 2.0 % 2.3 %
GR -1.5% 0.7 % -0.2 % -0.2 % -1.4 %
IRP-DOS -1.7 % -0.4 % 1.3 % 2.7 % 2.5 %
VSL -20.3 % -4.0 % -3.1 % -6.4 % -10.9 %
NRPA * 3.0 % * 2.7 % -0.4 %
NIOM 1.1 % 0.4 % -0.7 % -1.8 % -3.1 %
ITN-LMRI -0.6 % 0.0 % 0.0 % 0.0 % 0.0 %
IFIN-HH 1.1% 0.0 % 0.7 % -1.8 % 0.2 %
VINCA 10.6 % 1.9 % 1.3 % 0.7 % -0.2 %
SIM -0.3 % -3.2 % -0.3 % 0.0 % 0.0 %
JSI -1.7 % -1.6 % 1.3 % 0.3 % 2.2 %
UPC 2.2 % -6.2 % 2.0 % -3.7 % -1.4 %
SSM 1.1 % -1.6 % 1.0 % 2.5 % 1.2 % * not applied in this comparison project
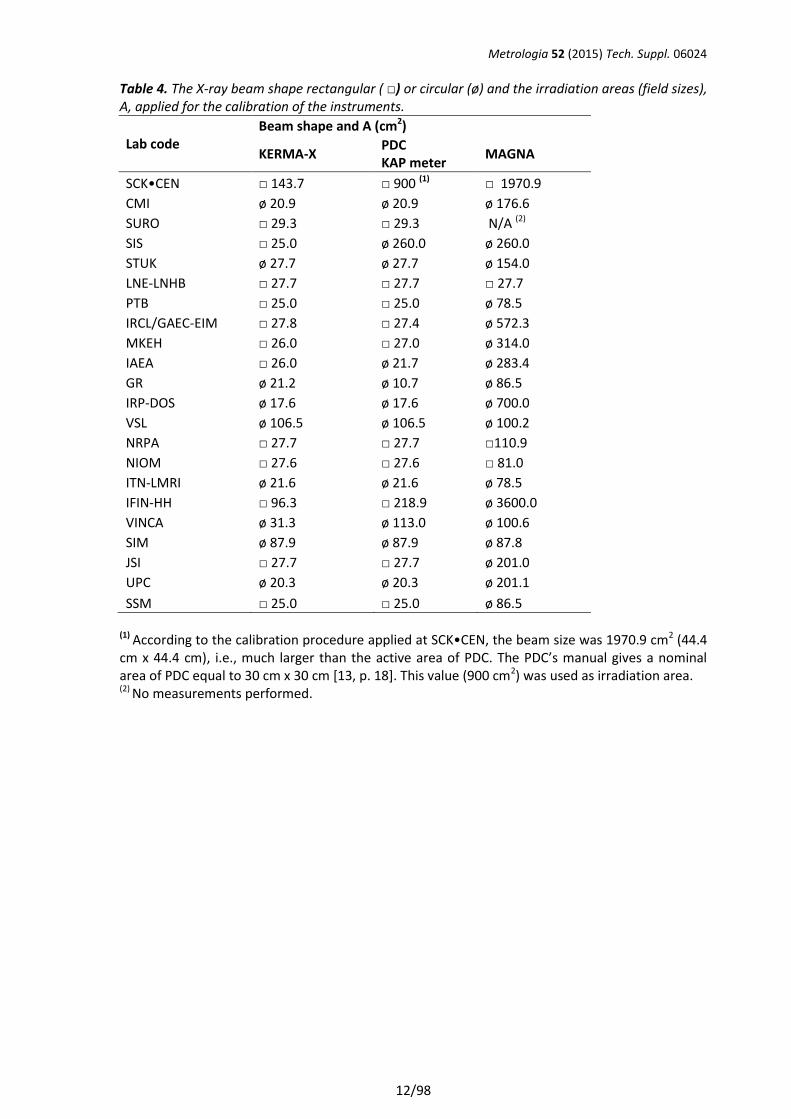
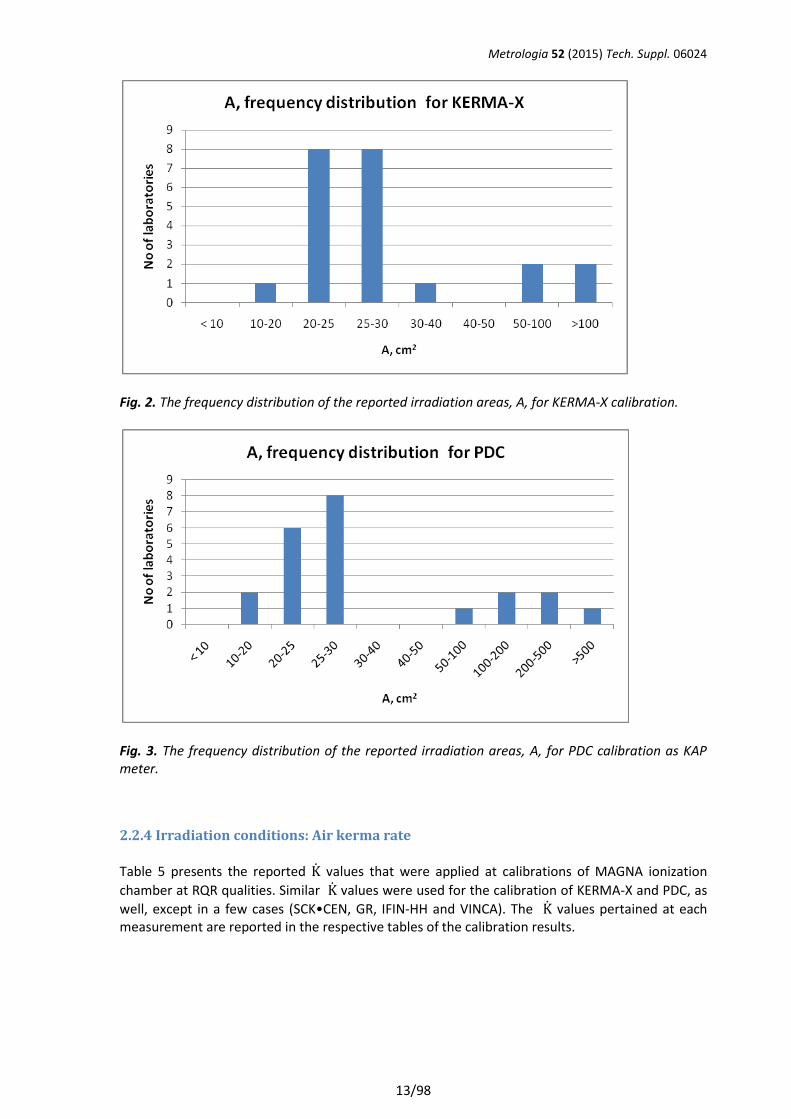
2.2.3 Irradiation conditions: Irradiation field size, irradiation area Table 4 summarizes the irradiation beam shapes, rectangular ( □) or circular (ø), and the field size in cm2, for the calibration of instruments, as reported by the participating laboratories. Every laboratory applied the same radiation field for all radiation qualities. Fig. 2 and Fig. 3 present the frequency distribution of the irradiation areas, A, for KERMA-X and PDC (as KAP meter), respectively.
Metrologia 52 (2015) Tech. Suppl. 06024
12/98
Table 4. The X-ray beam shape rectangular ( □) or circular (ø) and the irradiation areas (field sizes), A, applied for the calibration of the instruments.
Lab code Beam shape and A (cm2)
KERMA-X PDC KAP meter
MAGNA
SCK•CEN □ 143.7 □ 900 (1) □ 1970.9
CMI ø 20.9 ø 20.9 ø 176.6
SURO □ 29.3 □ 29.3 N/A (2)
SIS □ 25.0 ø 260.0 ø 260.0
STUK ø 27.7 ø 27.7 ø 154.0
LNE-LNHB □ 27.7 □ 27.7 □ 27.7
PTB □ 25.0 □ 25.0 ø 78.5
IRCL/GAEC-EIM □ 27.8 □ 27.4 ø 572.3
MKEH □ 26.0 □ 27.0 ø 314.0
IAEA □ 26.0 ø 21.7 ø 283.4
GR ø 21.2 ø 10.7 ø 86.5
IRP-DOS ø 17.6 ø 17.6 ø 700.0
VSL ø 106.5 ø 106.5 ø 100.2
NRPA □ 27.7 □ 27.7 □110.9
NIOM □ 27.6 □ 27.6 □ 81.0
ITN-LMRI ø 21.6 ø 21.6 ø 78.5
IFIN-HH □ 96.3 □ 218.9 ø 3600.0
VINCA ø 31.3 ø 113.0 ø 100.6
SIM ø 87.9 ø 87.9 ø 87.8
JSI □ 27.7 □ 27.7 ø 201.0
UPC ø 20.3 ø 20.3 ø 201.1
SSM □ 25.0 □ 25.0 ø 86.5
(1) According to the calibration procedure applied at SCK•CEN, the beam size was 1970.9 cm2 (44.4 cm x 44.4 cm), i.e., much larger than the active area of PDC. The PDC’s manual gives a nominal area of PDC equal to 30 cm x 30 cm [13, p. 18]. This value (900 cm2) was used as irradiation area. (2) No measurements performed.
Metrologia 52 (2015) Tech. Suppl. 06024
13/98
Fig. 2. The frequency distribution of the reported irradiation areas, A, for KERMA-X calibration.
Fig. 3. The frequency distribution of the reported irradiation areas, A, for PDC calibration as KAP meter.
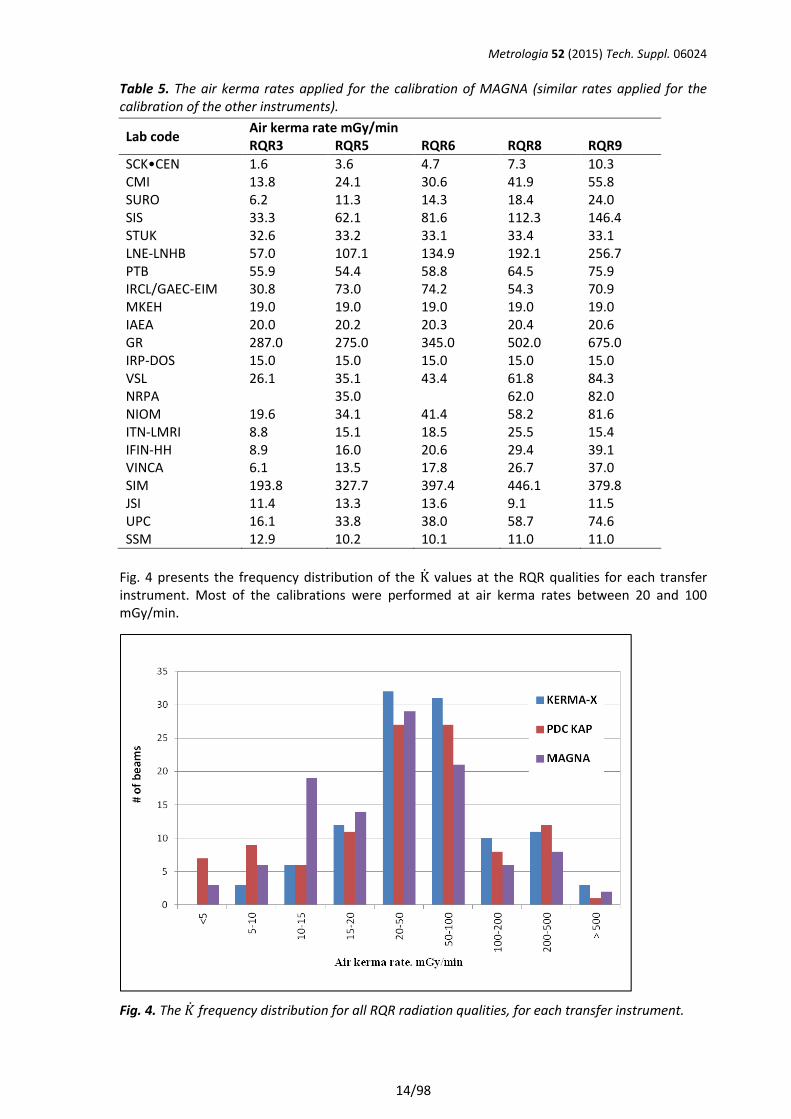
2.2.4 Irradiation conditions: Air kerma rate
Table 5 presents the reported K̇ values that were applied at calibrations of MAGNA ionization
chamber at RQR qualities. Similar K̇ values were used for the calibration of KERMA-X and PDC, as
well, except in a few cases (SCK•CEN, GR, IFIN-HH and VINCA). The K̇ values pertained at each measurement are reported in the respective tables of the calibration results.
Metrologia 52 (2015) Tech. Suppl. 06024
14/98
Table 5. The air kerma rates applied for the calibration of MAGNA (similar rates applied for the calibration of the other instruments).
Lab code Air kerma rate mGy/min RQR3 RQR5 RQR6 RQR8 RQR9
SCK•CEN 1.6 3.6 4.7 7.3 10.3 CMI 13.8 24.1 30.6 41.9 55.8 SURO 6.2 11.3 14.3 18.4 24.0 SIS 33.3 62.1 81.6 112.3 146.4 STUK 32.6 33.2 33.1 33.4 33.1 LNE-LNHB 57.0 107.1 134.9 192.1 256.7 PTB 55.9 54.4 58.8 64.5 75.9 IRCL/GAEC-EIM 30.8 73.0 74.2 54.3 70.9 MKEH 19.0 19.0 19.0 19.0 19.0 IAEA 20.0 20.2 20.3 20.4 20.6 GR 287.0 275.0 345.0 502.0 675.0 IRP-DOS 15.0 15.0 15.0 15.0 15.0 VSL 26.1 35.1 43.4 61.8 84.3 NRPA
35.0
62.0 82.0
NIOM 19.6 34.1 41.4 58.2 81.6 ITN-LMRI 8.8 15.1 18.5 25.5 15.4 IFIN-HH 8.9 16.0 20.6 29.4 39.1 VINCA 6.1 13.5 17.8 26.7 37.0 SIM 193.8 327.7 397.4 446.1 379.8 JSI 11.4 13.3 13.6 9.1 11.5 UPC 16.1 33.8 38.0 58.7 74.6 SSM 12.9 10.2 10.1 11.0 11.0
Fig. 4 presents the frequency distribution of the K̇ values at the RQR qualities for each transfer instrument. Most of the calibrations were performed at air kerma rates between 20 and 100 mGy/min.
Fig. 4. The �̇� frequency distribution for all RQR radiation qualities, for each transfer instrument.
Metrologia 52 (2015) Tech. Suppl. 06024
15/98
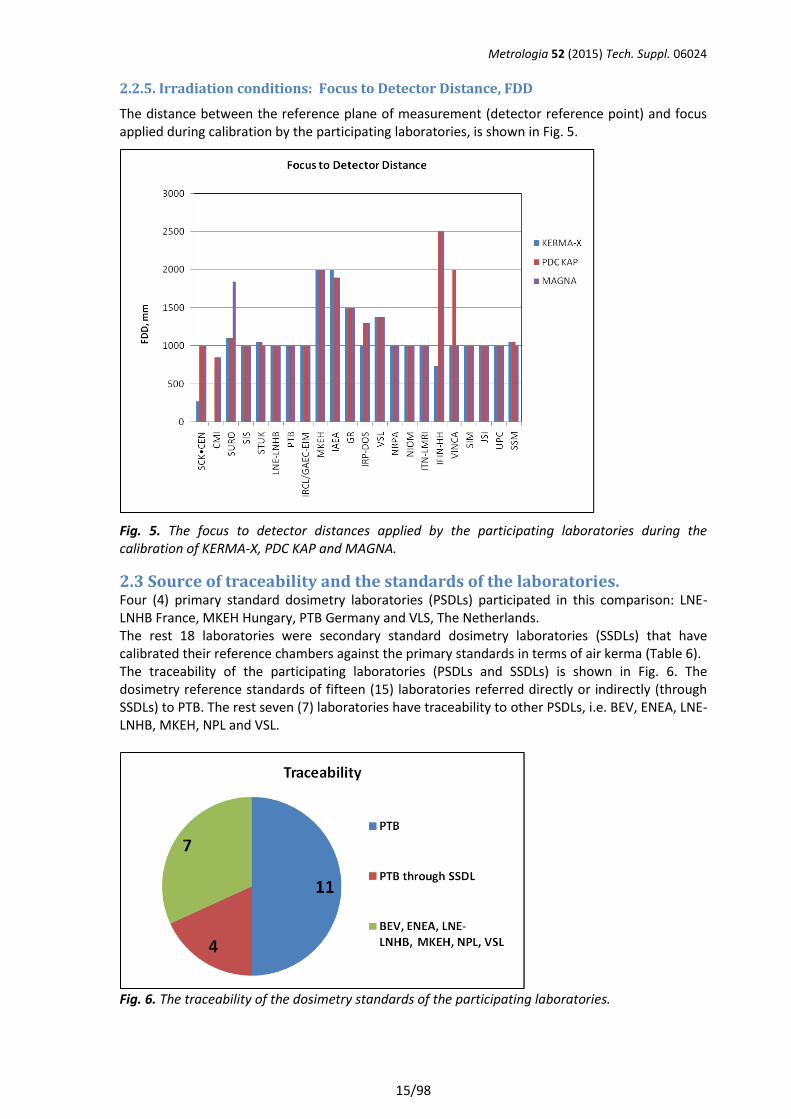
2.2.5. Irradiation conditions: Focus to Detector Distance, FDD
The distance between the reference plane of measurement (detector reference point) and focus applied during calibration by the participating laboratories, is shown in Fig. 5.
Fig. 5. The focus to detector distances applied by the participating laboratories during the calibration of KERMA-X, PDC KAP and MAGNA.
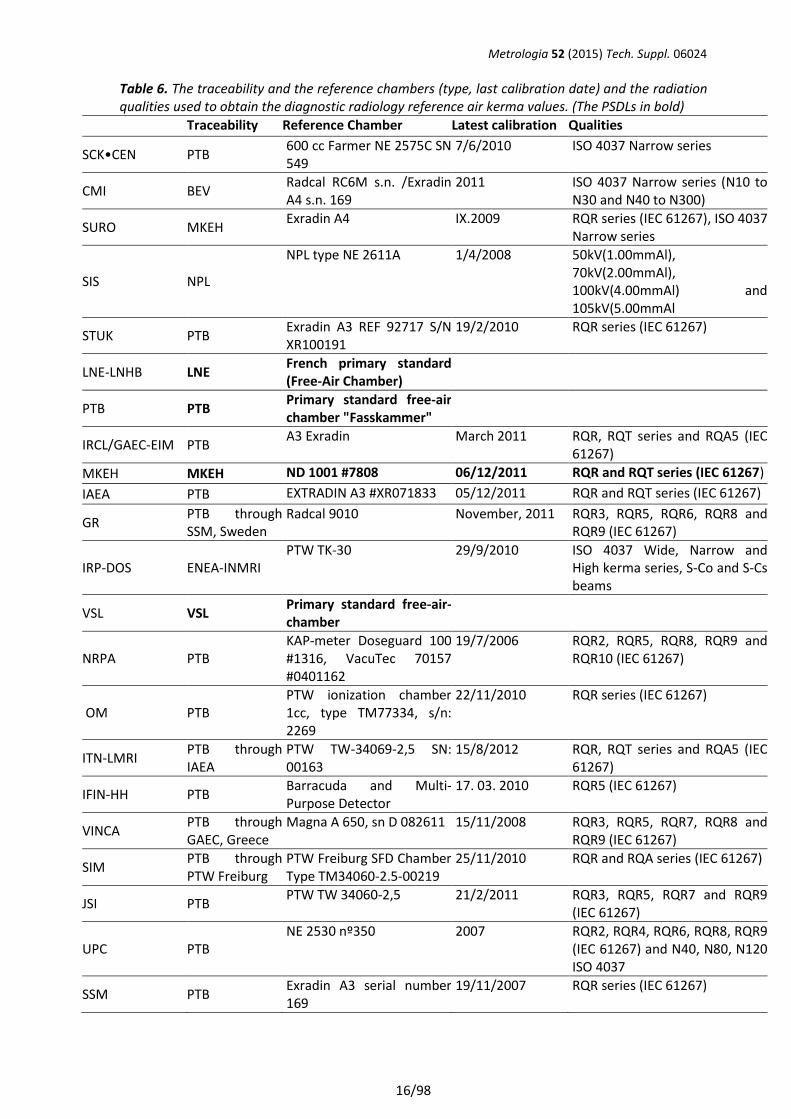
2.3 Source of traceability and the standards of the laboratories. Four (4) primary standard dosimetry laboratories (PSDLs) participated in this comparison: LNE-LNHB France, MKEH Hungary, PTB Germany and VLS, The Netherlands. The rest 18 laboratories were secondary standard dosimetry laboratories (SSDLs) that have calibrated their reference chambers against the primary standards in terms of air kerma (Table 6). The traceability of the participating laboratories (PSDLs and SSDLs) is shown in Fig. 6. The dosimetry reference standards of fifteen (15) laboratories referred directly or indirectly (through SSDLs) to PTB. The rest seven (7) laboratories have traceability to other PSDLs, i.e. BEV, ENEA, LNE-LNHB, MKEH, NPL and VSL.
Fig. 6. The traceability of the dosimetry standards of the participating laboratories.
Metrologia 52 (2015) Tech. Suppl. 06024
16/98
Table 6. The traceability and the reference chambers (type, last calibration date) and the radiation qualities used to obtain the diagnostic radiology reference air kerma values. (The PSDLs in bold)
Traceability Reference Chamber Latest calibration Qualities
SCK•CEN PTB 600 cc Farmer NE 2575C SN 549
7/6/2010 ISO 4037 Narrow series
CMI BEV Radcal RC6M s.n. /Exradin A4 s.n. 169
2011 ISO 4037 Narrow series (N10 to N30 and N40 to N300)
SURO MKEH Exradin A4 IX.2009 RQR series (IEC 61267), ISO 4037
Narrow series
SIS NPL
NPL type NE 2611A 1/4/2008 50kV(1.00mmAl), 70kV(2.00mmAl), 100kV(4.00mmAl) and 105kV(5.00mmAl
STUK PTB Exradin A3 REF 92717 S/N XR100191
19/2/2010 RQR series (IEC 61267)
LNE-LNHB LNE French primary standard (Free-Air Chamber)
PTB PTB Primary standard free-air chamber "Fasskammer"
IRCL/GAEC-EIM PTB A3 Exradin March 2011 RQR, RQT series and RQA5 (IEC
61267)
MKEH MKEH ND 1001 #7808 06/12/2011 RQR and RQT series (IEC 61267)
IAEA PTB EXTRADIN A3 #XR071833 05/12/2011 RQR and RQT series (IEC 61267)
GR PTB through SSM, Sweden
Radcal 9010 November, 2011 RQR3, RQR5, RQR6, RQR8 and RQR9 (IEC 61267)
IRP-DOS ENEA-INMRI PTW TK-30 29/9/2010 ISO 4037 Wide, Narrow and
High kerma series, S-Co and S-Cs beams
VSL VSL Primary standard free-air-chamber
NRPA PTB KAP-meter Doseguard 100 #1316, VacuTec 70157 #0401162
19/7/2006 RQR2, RQR5, RQR8, RQR9 and RQR10 (IEC 61267)
OM PTB PTW ionization chamber 1cc, type TM77334, s/n: 2269
22/11/2010 RQR series (IEC 61267)
ITN-LMRI PTB through IAEA
PTW TW-34069-2,5 SN: 00163
15/8/2012 RQR, RQT series and RQA5 (IEC 61267)
IFIN-HH PTB Barracuda and Multi-Purpose Detector
17. 03. 2010 RQR5 (IEC 61267)
VINCA PTB through GAEC, Greece
Magna A 650, sn D 082611 15/11/2008 RQR3, RQR5, RQR7, RQR8 and RQR9 (IEC 61267)
SIM PTB through PTW Freiburg
PTW Freiburg SFD Chamber Type TM34060-2.5-00219
25/11/2010 RQR and RQA series (IEC 61267)
JSI PTB PTW TW 34060-2,5 21/2/2011 RQR3, RQR5, RQR7 and RQR9
(IEC 61267)
UPC PTB NE 2530 nº350 2007 RQR2, RQR4, RQR6, RQR8, RQR9
(IEC 61267) and N40, N80, N120 ISO 4037
SSM PTB Exradin A3 serial number 169
19/11/2007 RQR series (IEC 61267)
Metrologia 52 (2015) Tech. Suppl. 06024
17/98
3. Comparison method
3.1. Description of the overall procedures
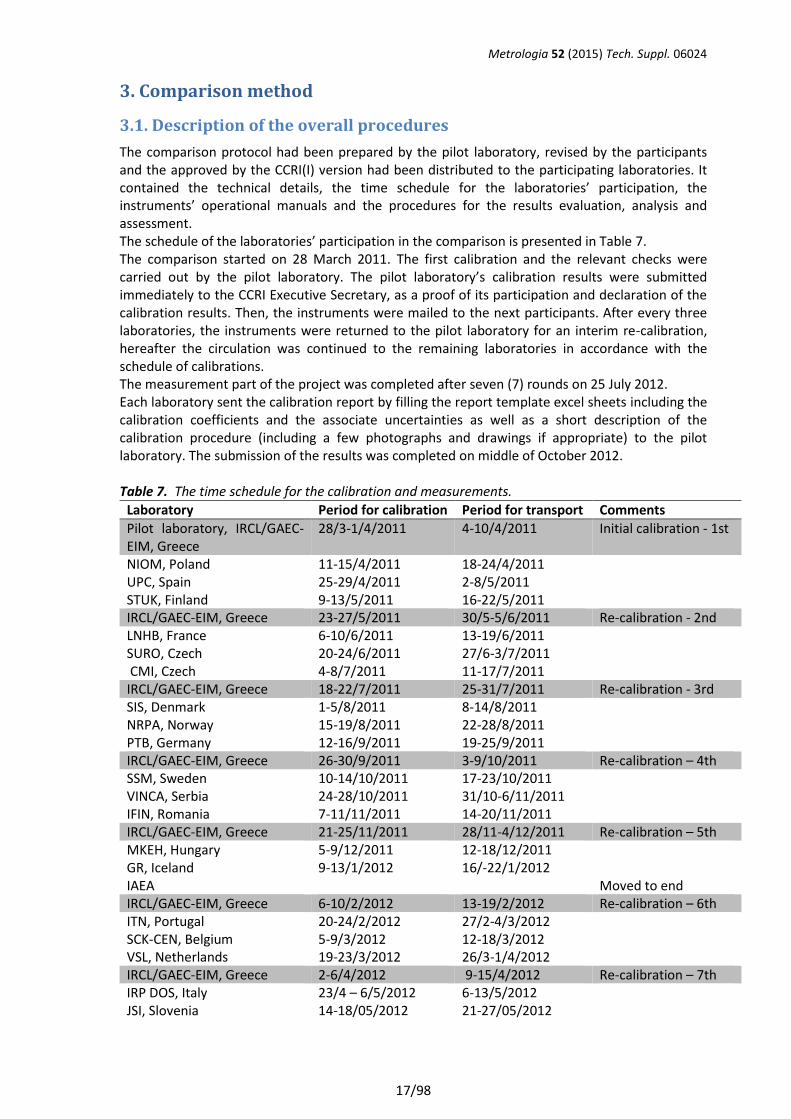
The comparison protocol had been prepared by the pilot laboratory, revised by the participants and the approved by the CCRI(I) version had been distributed to the participating laboratories. It contained the technical details, the time schedule for the laboratories’ participation, the instruments’ operational manuals and the procedures for the results evaluation, analysis and assessment. The schedule of the laboratories’ participation in the comparison is presented in Table 7. The comparison started on 28 March 2011. The first calibration and the relevant checks were carried out by the pilot laboratory. The pilot laboratory’s calibration results were submitted immediately to the CCRI Executive Secretary, as a proof of its participation and declaration of the calibration results. Then, the instruments were mailed to the next participants. After every three laboratories, the instruments were returned to the pilot laboratory for an interim re-calibration, hereafter the circulation was continued to the remaining laboratories in accordance with the schedule of calibrations. The measurement part of the project was completed after seven (7) rounds on 25 July 2012. Each laboratory sent the calibration report by filling the report template excel sheets including the calibration coefficients and the associate uncertainties as well as a short description of the calibration procedure (including a few photographs and drawings if appropriate) to the pilot laboratory. The submission of the results was completed on middle of October 2012. Table 7. The time schedule for the calibration and measurements.
Laboratory Period for calibration Period for transport Comments
Pilot laboratory, IRCL/GAEC-EIM, Greece
28/3-1/4/2011 4-10/4/2011 Initial calibration - 1st
NIOM, Poland 11-15/4/2011 18-24/4/2011 UPC, Spain 25-29/4/2011 2-8/5/2011 STUK, Finland 9-13/5/2011 16-22/5/2011 IRCL/GAEC-EIM, Greece 23-27/5/2011 30/5-5/6/2011 Re-calibration - 2nd LNHB, France 6-10/6/2011 13-19/6/2011 SURO, Czech 20-24/6/2011 27/6-3/7/2011 CMI, Czech 4-8/7/2011 11-17/7/2011 IRCL/GAEC-EIM, Greece 18-22/7/2011 25-31/7/2011 Re-calibration - 3rd SIS, Denmark 1-5/8/2011 8-14/8/2011 NRPA, Norway 15-19/8/2011 22-28/8/2011 PTB, Germany 12-16/9/2011 19-25/9/2011 IRCL/GAEC-EIM, Greece 26-30/9/2011 3-9/10/2011 Re-calibration – 4th SSM, Sweden 10-14/10/2011 17-23/10/2011 VINCA, Serbia 24-28/10/2011 31/10-6/11/2011 IFIN, Romania 7-11/11/2011 14-20/11/2011 IRCL/GAEC-EIM, Greece 21-25/11/2011 28/11-4/12/2011 Re-calibration – 5th MKEH, Hungary 5-9/12/2011 12-18/12/2011 GR, Iceland 9-13/1/2012 16/-22/1/2012 IAEA Moved to end IRCL/GAEC-EIM, Greece 6-10/2/2012 13-19/2/2012 Re-calibration – 6th ITN, Portugal 20-24/2/2012 27/2-4/3/2012 SCK-CEN, Belgium 5-9/3/2012 12-18/3/2012 VSL, Netherlands 19-23/3/2012 26/3-1/4/2012 IRCL/GAEC-EIM, Greece 2-6/4/2012 9-15/4/2012 Re-calibration – 7th IRP DOS, Italy 23/4 – 6/5/2012 6-13/5/2012 JSI, Slovenia 14-18/05/2012 21-27/05/2012
Metrologia 52 (2015) Tech. Suppl. 06024
18/98
SIM, Slovakia 28/5-1/6/2012 4-10/6/2012 IAEA 11-15/6/2012 18-24/6/2012 IRCL/GAEC-EIM, Greece 28/6/2012 Final calibration
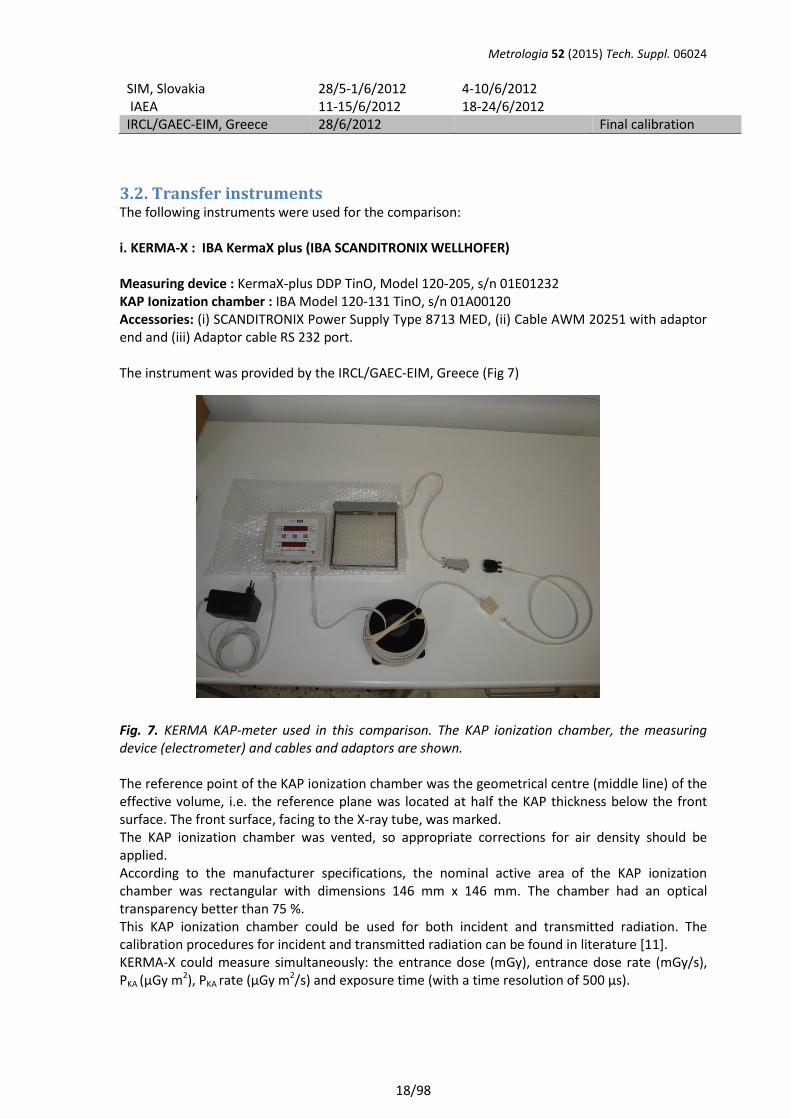
3.2. Transfer instruments The following instruments were used for the comparison: i. KERMA-X : IBA KermaX plus (IBA SCANDITRONIX WELLHOFER) Measuring device : KermaX-plus DDP TinO, Model 120-205, s/n 01E01232 KAP Ionization chamber : IBA Model 120-131 TinO, s/n 01A00120 Accessories: (i) SCANDITRONIX Power Supply Type 8713 MED, (ii) Cable AWM 20251 with adaptor end and (iii) Adaptor cable RS 232 port. The instrument was provided by the IRCL/GAEC-EIM, Greece (Fig 7) Fig. 7. KERMA KAP-meter used in this comparison. The KAP ionization chamber, the measuring device (electrometer) and cables and adaptors are shown. The reference point of the KAP ionization chamber was the geometrical centre (middle line) of the effective volume, i.e. the reference plane was located at half the KAP thickness below the front surface. The front surface, facing to the X-ray tube, was marked. The KAP ionization chamber was vented, so appropriate corrections for air density should be applied. According to the manufacturer specifications, the nominal active area of the KAP ionization chamber was rectangular with dimensions 146 mm x 146 mm. The chamber had an optical transparency better than 75 %. This KAP ionization chamber could be used for both incident and transmitted radiation. The calibration procedures for incident and transmitted radiation can be found in literature [11]. KERMA-X could measure simultaneously: the entrance dose (mGy), entrance dose rate (mGy/s), PKA (μGy m2), PKA rate (μGy m2/s) and exposure time (with a time resolution of 500 μs).
Metrologia 52 (2015) Tech. Suppl. 06024
19/98
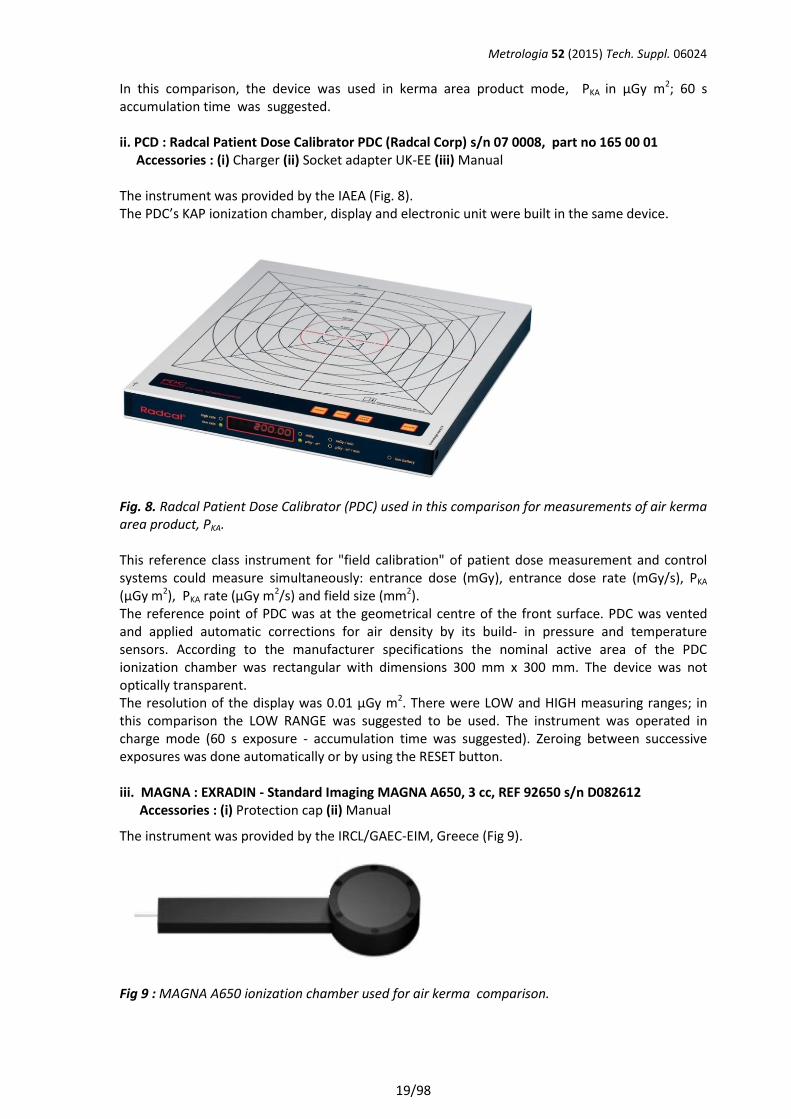
In this comparison, the device was used in kerma area product mode, PKA in μGy m2; 60 s accumulation time was suggested. ii. PCD : Radcal Patient Dose Calibrator PDC (Radcal Corp) s/n 07 0008, part no 165 00 01 Accessories : (i) Charger (ii) Socket adapter UK-EE (iii) Manual The instrument was provided by the IAEA (Fig. 8). The PDC’s KAP ionization chamber, display and electronic unit were built in the same device.
Fig. 8. Radcal Patient Dose Calibrator (PDC) used in this comparison for measurements of air kerma area product, PKA. This reference class instrument for "field calibration" of patient dose measurement and control systems could measure simultaneously: entrance dose (mGy), entrance dose rate (mGy/s), PKA (μGy m2), PKA rate (μGy m2/s) and field size (mm2). The reference point of PDC was at the geometrical centre of the front surface. PDC was vented and applied automatic corrections for air density by its build- in pressure and temperature sensors. According to the manufacturer specifications the nominal active area of the PDC ionization chamber was rectangular with dimensions 300 mm x 300 mm. The device was not optically transparent. The resolution of the display was 0.01 μGy m2. There were LOW and HIGH measuring ranges; in this comparison the LOW RANGE was suggested to be used. The instrument was operated in charge mode (60 s exposure - accumulation time was suggested). Zeroing between successive exposures was done automatically or by using the RESET button. iii. MAGNA : EXRADIN - Standard Imaging MAGNA A650, 3 cc, REF 92650 s/n D082612 Accessories : (i) Protection cap (ii) Manual
The instrument was provided by the IRCL/GAEC-EIM, Greece (Fig 9).
Fig 9 : MAGNA A650 ionization chamber used for air kerma comparison.
Metrologia 52 (2015) Tech. Suppl. 06024
20/98
MAGNA was parallel plate ionization chamber with 3 cm3 active volume and a 3.9 mg/cm2 Kapton conductive film entrance window. The effective diameter of the chamber was 42 mm. The participating laboratory had to use its own electrometer for the bias voltage supply and the electrical current (charge) measurements. The polarizing voltage was 300 V, with the negative polarity to the middle shielding electrode (guard ring); the outer shielding (wall) was on earth potential. With this polarity configuration the displayed charge values on the electrometer had positive sign (+). The manufacturer has grooved the reference plane at 3 mm from the entrance window. However, for this comparison, the reference point was at the geometrical centre of the entrance window.
3.3 Calibration quantities and radiation qualities The instruments were requested to be calibrated as follows:
KERMA-X in terms of PKA (in Gy cm2/digit)
PDC in terms of PKA (in Gy cm2/digit)
MAGNA in terms of Ka (in mGy/nC) The calibrations were performed at the standard X-rays beam qualities according to IEC 61267 as shown in Table 8. Table 8. Standard X-ray beam qualities from IEC 61267 [10] used in this comparison
Beam code Tube voltage, kV HVL, mm Al
RQR3 50 1.78 RQR5 70 2.58 RQR6 80 3.01 RQR8 100 3.97 RQR9 120 5.00
3.4. Method of analysis The comparison result of a participating laboratory at each radiation quality and for each instrument was determined by comparing the calibration coefficient to the respective Comparison Reference Value (CRV). The CRVs were planned to be obtained from the calibration results of the participating PSDLs, i.e. LNE-LNHB (France), MKEH (Hungary), PTB (Germany) and VSL (The Netherlands). However, the HVL values of X-ray beam qualities RQR3, RQR8 and RQR9 established at the VSL were not consistent to the requirements of the IEC 61267, as they differed from the nominal IEC 61267 HVL values by more than 4.4 %, (section 2.2.2 of this report), so the results of VSL have not been used for the CRV determination.
3.4.1. Comparison Reference Value - CRV The CRV and the associated uncertainty at a radiation quality Q (CRV) were determined as follows: The weighted mean calibration coefficient at a radiation quality Q, of the three PSDLs, Nref, was deduced, where the weights were equal to the reciprocals of the variances, u2
i [15], , i.e.
𝐍𝐫𝐞𝐟 = ∑
𝐍𝐢
𝐮𝐢𝟐
𝐩𝐢=𝟏
∑𝟏
𝐮𝐢𝟐
𝐩𝐢=𝟏
⁄ eq. 1a
Metrologia 52 (2015) Tech. Suppl. 06024
21/98
where: p : the number of PSDL (p=3) Nref : the weighted mean of the calibration coefficients at radiation quality Q Ni : the reported calibration coefficient at the radiation quality, Q of the ith PSDL ui : the standard uncertainty of the calibration coefficient at the Q beam quality of the ith PSDL The internal standard uncertainty of the weighted mean calibration coefficient at the beam quality Q, uint,Nref, which took into account the precision of its results, was obtained from [16]
𝑢𝑖𝑛𝑡,𝑁𝑟𝑒𝑓 = (∑1
𝑢𝑖2
𝑝𝑖=1 )
−1/2
eq. 1b
The external standard uncertainty of the weighted mean calibration coefficient at the beam quality Q, uext,Nref, which took into account the dispersion of the results from the weighted mean, was obtained from [16]
𝑢𝑒𝑥𝑡,𝑁𝑟𝑒𝑓 = √∑
(𝑁𝑖−𝑁𝑟𝑒𝑓)2
𝑢𝑖2
𝑝𝑖=1
∑ 1
𝑢𝑖2
𝑝𝑖=1
eq. 1c
The uncertainty of weighted mean calibration coefficient was the maximum value of the internal, uint,Nref and external, uext,Nref uncertainties (eq 1b and 1c).
uNref= max{uint,Nref , uext,Nref } eq. 1d
The weighted mean and its uncertainty may be inadequate when applied to discrepant data. In order to check the overall consistency of the results the reduced observed chi-squared value, x2
obs
was calculated for each the beam quality, Q, [14, 15]
𝑥𝑜𝑏𝑠2 =
1
𝑝−1 ∑
(𝑁𝑖−𝑁𝑟𝑒𝑓)2
𝑢𝑖2
𝑝𝑖=1 eq. 2
If x2
obs ≤ 1, consistency was pertained; the weighted mean and the associate uncertainty as deduced from eq. 1a and eq. 1b, were accepted as the CRV and the uCRV respectively, i.e. CRV = Nref and uCRV = uNref If x2
obs > 1, consistency failed, so the “Mandel – Paule mean” (M-P mean) approach was followed. According to it, the laboratory variances ui
2 were incremented by a further variance s2 to give augmented variances u2
MP,i = ui2 + s2. The value of the variance s2 was chosen such that the
modified reduced observed chi-squared value x2MP,obs (eq. 3) equal one (x2
MP,obs = 1) [14].
xMP,obs2 =
1
p−1 ∑
(Ni−Nref)2
ui2+s2
pi=1 eq. 3
The calculation of the CRV (M-P mean) and its uncertainty proceeded through the same equations as for the weighted mean (eq. 1a – 1d), replacing the stated variances ui
2 by the augmented variances u2
MP,i. Therefore, the M-P weighted mean, NMP,ref and the associate uncertainty uMP,Nref were calculated from
Metrologia 52 (2015) Tech. Suppl. 06024
22/98
𝐍𝐌𝐏,𝐫𝐞𝐟 = ∑
𝐍𝐢
𝐮𝐢𝟐+𝐬𝟐
𝐩𝐢=𝟏
∑𝟏
𝐮𝐢𝟐+𝐬𝟐
𝐩𝐢=𝟏
⁄ eq. 4a
uint,MP,Nref = (∑1
ui2+s2
pi=1 )
−1/2
eq. 4b
uext,MP,Nref = √∑
(Ni−Nref)2
ui2+s2
pi=1
∑ 1
ui2+s2
pi=1
eq. 4c
uMP,Nref= max{uint,MP,Nref , uext,MP,Nref } eq. 4d
Hence, in case x2
obs > 1, the CRV and the uCRV were CRV = NMP,ref and uCRV = uMP,Nref. The arithmetic mean, Nmean, of the calibration coefficients and its uncertainty uNmean were also calculated from
Nmean =∑ Ni
pi=1
p eq. 5a
uNmean= √
∑ (Ni −Nref)2pi=1
p∙(p−1) eq. 5b
However, Nmean and uNmean were not used in the analysis of the results; they were calculated for comparison reasons only. Finally, it should be mentioned that each calculation methodology of a mean value, i.e. based on the arithmetic mean or weighted mean or other, has advantages, disadvantages and limitations. A limitation of the weighted mean method is that there should be no correlations between laboratories. In this comparison, although such correlations existed, there were restricted to the physical constants being used by the PSDL and has limited influence to the calculation of the CRV and its uncertainties [17]. In order to further reduce such limitations, the methodologies proposed and applied by the CCRI(II) key comparison [14] and other statistical checks described in other parts of this repost, have been considered in this project .
3.4.2. Comparison result The comparison result R of a participating laboratory (at each radiation quality and per instrument) was expressed as the ratio of the calibration coefficient and the respective CRV.
𝐑 = 𝐍
𝐂𝐑𝐕 eq. 6
This EURAMET 1177 supplementary comparison has a few particularities, comparing to the traditional air kerma comparisons; the most important were:
Metrologia 52 (2015) Tech. Suppl. 06024
23/98
In principle, there are no direct linking laboratories. The three (3) participating PSDLs (LNE-LNHB, MKEH and PTB) have reported key comparisons neither in terms of air kerma area product, PKA, nor in terms of air kerma (rate) at diagnostic radiology level. The CCRI(I) decided in 2011 that the range of agreed CCRI x-ray qualities ,used for the BIPM.RI-K2, K3, and K7 key comparisons, provide adequate coverage foll all diagnostic x-ray qualities, and the CCRI/12-05 document ‘Validity of Ionizing Radiation Comparisons under the CIPM MRA’ declares that any CMCs related to other quantites will normally need to be supported by regional supplementary comparisons. Note that only the PTB has published CMC for the air kerma area product quantity. BIPM.RI(I)-K2 and BIPM.RI(I)-K3, between MKEH and BIPM at low and medium CCRI therapy radiation qualities [18, 19, 20, 21]. According to the BIPM and EURAMET database, only the EURAMET RI(I)-S10 has been reported, which is a bilateral supplementary – supporting comparison between IAEA and PTB [17, 22], as well as the EURAMET 536 project which concerned mammography radiation qualities [2].
The transfer KAP meters used in this comparison were commercial instruments that read directly the PKA and they could not measure electric current; so any correlation of the measurement components between participating laboratories and PSDL or BIPM were not feasible.
In this respect, the methodology used for key comparisons could not be practically applied for the result evaluation of this comparison. Therefore, the following simplified formula was used for the calculation of the variance of the comparison result, R
𝐮𝐑𝟐 = 𝐮𝐍
𝟐 + 𝐮𝐍𝐫𝐞𝐟𝟐 + 𝐮𝐬𝐭𝐚𝐛
𝟐 eq. 7 where uN and uNref are the relative standard uncertainties of the calibration coefficient deduced by the laboratory and the uncertainty of the CRV at the radiation quality, respectively and ustab the relative standard uncertainty assigned for the stability of the chamber (eq. 10). For the laboratories that have not contributed to the calculation of the CRV, the variance of the comparison result, R, was calculated by the following formula,
uua
uu stabp
i
i
p
iPSDLiNi
Nj
aRj
2
2
2
,,
2
22
eq. 8a
where uN,i.PSDL is the relative standard uncertainties of the calibration coefficients reported by the PSDLs, that have contributed to the CRV and ai is the normalized weighting factor u2
CRV / u2N,i.PSDi
[14]. For the jth laboratory (PSDL) that has contributed to the CRV the above formula was changed to
uua
uau stabp
ji
i
p
jiPSDLiNi
jNjR
aj
2
2
2
,,
2
2
,
2
,
2)21(
eq. 8b in order to avoid the uncertainty of their results to be taken into account twice. Finally, the consistency of the comparison result of a laboratory at radiation quality Q and for each transfer instrument was assessed by the En score, as [23]
Metrologia 52 (2015) Tech. Suppl. 06024
24/98
𝐄𝐧 =|𝐍−𝐍𝐫𝐞𝐟|
√𝐔𝐍𝟐+𝐔𝐍,𝐫𝐞𝐟
𝟐 +𝐔𝐬𝐭𝐚𝐛𝟐
, eq. 9
where UN , UN,ref and Ustab are the expanded uncertainties (at k=2) of the calibration coefficient determined by the laboratory, the CRV and the stability of the transfer instrument (section 3.5.1), respectively. En is an objective measure of whether or not an individual result is consistent with the CRV. The use of standard or expanded uncertainties in the En-score formula (eq. 9) is a matter of convention and agreement between the participating laboratories and it is correlated to the critical value that is set for the assessment of a laboratory result. If standard uncertainties are used in the En-score formula, the critical value is 1.96 (approximately 2). If expanded uncertainties are used, the critical value is 1, and therefore, En ≤ 1 indicates that the laboratory result and the CRV are in agreement within their respective uncertainties. Unlike z-scores, which consider standard uncertainties and require carefully selected “target” coefficients of variation among the laboratories as critical values, En-score, as in eq. 9, is more objective, robust and easy assessment method [24]. Therefore, in this work, expanded uncertainties in En-score formula were used and the critical value of 1 was set.
3.4.3. Performance tests of the transfer instruments
3.4.3.1. Stability tests of the transfer instruments At the beginning of each round (7 rounds in total) the pilot laboratory performed stability tests for each transfer instrument, by means of the determination of the calibration coefficients at all (5) beam qualities used in this comparison. Each time, the same irradiation conditions were applied. Therefore, for each beam quality and transfer instrument, seven calibration coefficients were obtained (8 for MAGNA due to an extra calibration), as the ratio of the reference dosimetric quantity, (PKA or K) and instrument reading corrected for all influence quantities. The stability of each instrument was represented by the standard uncertainty ustab which was calculated as
𝑢𝑠𝑡𝑎𝑏 = √𝑢𝑅𝑒𝑓2 + 𝑢𝑀
2 eq. 10
uRef = √∑ si,Ref
2mi=1
m eq. 11.a uM = √
∑ si,M2m
i=1
m eq. 11.b
where si,Ref and si,M are the relative standard deviation of the reference dosimetric quantity (PKA or K) and instrument readings at the radiation quality i and m is the total number of radiation qualities used for the stability check (m=5). In this respect, the stability took into account both variation of the reference dosimetric quantity and instrument performance.
3 4.3.2. Influence of radiation quality, air kerma rate, �̇� and irradiation area, A
The response of the transfer instruments may depend on the radiation quality, air kerma rate, K̇, and irradiation area, A. Therefore, to obtain comparable results of calibrations, the calibration conditions should be similar or the calibration coefficient should refer to the same irradiation conditions. As shown in Section 2.2, the calibration conditions varied between the laboratories
Metrologia 52 (2015) Tech. Suppl. 06024
25/98
and, therefore, the influence of the radiation quality, air kerma rate, K̇, and irradiation area, A, on the response of the transfer instruments used in this comparison were studied, and respective correction factors, k, were introduced. The corrected calibration coefficient can be calculated from
1 arearateQcor kkkNN eq. 12a
where kQ, krate and karea are the correction factors for the beam quality Q, K̇and A, respectively. The relative standard uncertainty of the corrected calibration coefficient, urel
Ni,cor , is
uNcor
rel = √uNrel
2 + ukQ,rel
2 + ukrate,rel
2 + ukarea,rel
2 eq. 12b
where the components in square-root are the relative standard uncertainties of the Ni, kQ, krate and karea respectively. The radiation beam quality correction factor, kQ adjusted the laboratory’s calibration coefficient to the reference HVL value (average HVL value of the 3 participating PSDLs) for the respective radiation quality. The kQ values (for a specific laboratory’s results) were obtained from the fitting Ni = f(HVL) curves of that laboratory, where Ni and HVL were the reported calibration coefficients and HVL values. The uncertainty of the kQ values should combine the reported uncertainty of the calibration coefficient and the uncertainty due to the fitting of the Ni = f(HVL) curve. For the latest, the root mean square deviation (r.m.s.) was used, as an overall measure of the “goodness of fit”. The r.m.s. measures how close the regression line is to all of the points simultaneously. The r.m.s. was computed using the residuals from a regression, as [25]
r. m. s = 100 √1
n−m∑
(Ni′ −Ni)2
Ni′2
ni=1 % eq. 13
where Ni is the reported calibration coefficient at certain radiation quality (HVLi), N’i, is the value deduced from the regression at the reported HVLi, n is the number of points of the Ni = f(HVL) curve (n=5, as the number of radiation qualities) and m the number of the parameters used for the regression (e.g. m=4, for cubic fitting). The kQ was applied only in the cases where the HVLs of the laboratory’s beams differed from the nominal HVL value (IEC 61267) by more than ± 4.4 % (section 2.2.2 of this report). Details on the calculation of the kQ values and their uncertainties are given in Section 4.2. The air kerma rate correction factor, krate , was used to correct the calibration coefficient of the
transfer instruments to the reference air kerma rate, K̇ value of 50 mGy/min. This reference value
corresponded to the K̇ values that applied by the participating PSDL. It also was higher than 15
mGy/min, where the influence of the K ̇ dependence of response of the instruments was negligible (see section 4.2).
The K̇ dependence of response and the determination of the krate correction factors were studied at the IRCL/GAEC-EIM.The measurements performed at the RQR6 (80 kV) radiation quality at distance of 1000 mm from X-ray focus; the air kerma ranged from 2 mGy/min to 90 mGy/min. An Exrading A3 ionization chamber was placed behind the KAP meters at 1050 mm distance from X-ray focus and measured the air kerma simultaneously with the KAP meter. For the determination of the air kerma, appropriate corrections to the A3 readings for the attenuation of the beam and the beam hardening by the KAP meter as well as for the distance from X-ray focus were
considered. The krate vs K̇ curves, krate = f(K̇), were determined.
Metrologia 52 (2015) Tech. Suppl. 06024
26/98
The uncertainty of the krate correction factors was estimated taken into account all influence
quantities, as well as the fitting to the krate = f(K̇) curve; for the latter the r.m.s. concept was applied (eq. 13). Details on the calculation of the krate values and their uncertainties are given in Section 4.2. The irradiation area correction factor, karea , was used to correct the calibration coefficient of the KAP meters (KERMA-X and PDC) to a reference value of 25 cm2 of the irradiation area, A. This standard value corresponds to the irradiation areas applied by the participating PSDL for the calibration of the KERMA X (LNE-LNHB 27.7 cm2, MKEH 26 cm2 and PTB 25 cm2) and PDC (LNE-LNHB 27.7cm2, MKEH 27 cm2 and PTB 25 cm2). The irradiation area dependence of response and the determination of the karea correction factors were studied at the IRCL/GAEC-EIM (for ΚΕΡΜΑ-Χ) and MKEH (for PDC). The karea vs irradiation area curves were determined for both KAP meters. The uncertainty of the karea correction factors was estimated taken into account all influence quantities and fitting parameters. Details on the calculation of the karea values and their uncertainties are given in the 4.2 section of this report. The application of the correction factors had direct impact on the comparison result of a laboratory and the associate uncertainty. The “corrected” comparison result, Rcor and its uncertainty uR,cor were obtained from
𝐑𝐜𝐨𝐫 = 𝐍𝐜𝐨𝐫
𝐂𝐑𝐕 eq. 14a
and
𝐮𝐑,𝐜𝐨𝐫𝟐 = 𝐮𝐑
𝟐 + 𝐮𝐤𝐪
𝟐 + 𝐮𝐤𝐫𝐚𝐭𝐞
𝟐 + 𝐮𝐤𝐚𝐫𝐞𝐚
𝟐 eq. 14b
Finally the corrected En score was given by
𝐄𝐧 =|𝐍𝐜𝐨𝐫−𝐍𝐫𝐞𝐟|
√𝐔𝐍,𝐜𝐨𝐫𝟐 +𝐔𝐍,𝐫𝐞𝐟
𝟐 +𝐔𝐬𝐭𝐚𝐛𝟐
, eq. 15
where Ncor is the corrected calibration coefficient (eq. 12a) and UN,cor the expanded relative uncertainty (k=2) of the Ncor (eq. 12b)
3.4.3.3. Automatic corrections for air density of the PDC
The PDC had internal sensors for the measurement of temperature and pressure, so the device performs correction for the air density automatically. Therefore, the PDC reading referred to the reference air density value. The environmental stabilization and the accuracy of the automatic temperature and pressure correction of the PDC were studied by IRCL/GAEC-EIM (Section 4.2). PDC was turned on and the PDC’s temperature and pressure indications were recorded in real time through PDC software. At the same time intervals, the room temperature and pressure were recorded from the reference thermometer and barometer of the IRCL/GAEC-EIM placed close to PDC.
3.4.4. PomPlots
From graphical representations of the comparison results, i.e. plot of the comparison results (R or Rcor) and the associated uncertainties against radiation quality (HVL), one can derive a general impression of the quality of the results: i.e. the accuracy of the measurement results and the adequacy of the assigned uncertainty. The data represents the position of the measurement result relative to the reference value, the uncertainty being indicated by an ‘‘error bar’’. Alternatively,
Metrologia 52 (2015) Tech. Suppl. 06024
27/98
one can use a type of plot that underlines the importance of the assigned uncertainties, i.e. the PomPlot [27, 28].
The PomPlot displays the relative deviations, D, of the individual results from the reference value, i.e. D = Rcor – 1, on the horizontal axis and the standard uncertainties uRcor on the vertical axis. The ζ-scores, |ζ| = |Rcor-1| / uRcor = 1, 2, and 3, are represented by diagonal solid lines, creating the aspect of a pyramidal structure. The ζ-score is a measure for the deviation between laboratory result and reference value relative to the total uncertainty. Points on the right-hand side of the graph correspond to results that are higher than the reference value while lower values are situated on the left. When the laboratory result’s uncertainty is low, the corresponding point is situated higher in the graph; when the uncertainty is high, the point is situated lower in the graph. Consequently, the most accurate results should be situated close to the top of the pyramid and close to the central line, with D = 0. Points outside of the ζ = ± 3 lines are probably inconsistent with the reference value.
PomPlots were obtained for KERMA-X and PDC comparison results at the RQR5 radiation quality. PomPlots were also deduced for the weighted mean comparison results of KERMA-X and PDC at the RQR5. The results between KERMA-X and PDC were weighted according to the reciprocal of the comparison result variances (eq. 1a and 1b). Therefore, in such a graph, the uRcor,WM (vertical axis) was plotted against DWM = Rcor,WM – 1, where
𝐑𝐜𝐨𝐫,𝐖𝐌 =(
𝐑𝟏
𝐮𝟏𝟐 +
𝐑𝟐
𝐮𝟐𝟐)
(𝟏
𝐮𝟏𝟐 +
𝟏
𝐮𝟐𝟐)
⁄ eq. 16a
and
𝐮𝐑𝐜𝐨𝐫,𝐖𝐌 = (𝟏
𝐮𝟏𝟐 +
𝟏
𝐮𝟐𝟐)
−𝟏𝟐⁄
eq. 16b
where R1 and R2 are the corrected comparison results, Rcor, at RQR5 for KERMA-X and PDC, respectively and u1 and u2 their standard uncertainties, uRcor.
3.4.5. Method for deriving the Degree of Equivalence
The degree of equivalence (DoE) is the degree to which the value of a measurement standard is consistent with the comparison reference value. It is expressed as the difference of the companion result and the respective CRV. When a number of radiation qualities and instruments are used in a comparison, the results are deduced for each quality and instrument, separately [2, 3, 4, 17, 20], as described in the previous sections. In this comparison, the DoE was obtained at the RQR5 radiation quality, which is the reference quality of the RQR series [10, 11], i.e.
DoE = |D| = |𝑅cor,RQR5 − 1| eq. 17
The uncertainty of the DoE was expressed as the expanded uncertainty at k=2, i.e. UDoE = UD = 2 uDoE = 2 uRcor,RQR5. eq. 18
where Rcor,RQR5 and uRcor,RQR5 are the corrected comparison result (eq 14a) and its uncertainty (eq 14b) of the laboratory at RQR5 radiation quality.
Regarding the instruments, the DoE for the air kerma area product, PKA, was obtained from the results of PDC. The reasons for this are described in the “Result and Discussion section. The DoE for the air kerma was obtained from the results of MAGNA.
Metrologia 52 (2015) Tech. Suppl. 06024
28/98
4. Results and Discussion
4.1. Results of calibrations at the participating laboratories
The results of transfer instrument calibrations at RQR radiation qualities as submitted by the participating laboratories are presented in ANNEX A. The symbols in the column headings are as follows
HVL : reported HVL in mm Al of the radiation quality
A : reported irradiation area, in cm2 at the point of measurement
K̇ : reported value of the air kerma rate at the point of measurement
NPKA : reported calibration coefficient in terms of air kerma area product
NK : reported calibration coefficient in terms of air kerma
U % : reported relative expanded uncertainty of the calibration coefficient, k=2
u : standard uncertainty (k=1) of the calibration coefficient calculated from U % and NPKA or NK (three digits are kept for the u values)
A radiation quality established at different laboratories is rarely exactly the same either between the laboratories or with the stated IEC standard quality. For this, in this study, the result analysis considered the radiation qualities in terms of HVL (in mm Al), while in the text the IEC code (e.g. RQR5) was used. This approach is followed in most key, supplementary or other comparisons [2, 3, 4], although in a few others only the radiation code (e.g. kV) is given to the results presentation [20].
4.2. Transfer instruments performance
As described in section 3.6, the performance of the instruments being used in this comparison was studied through the determination of respective correction factors, as presented below.
4.2.1. Performance tests of KERMA-X
4.2.1.1. Stability tests of KERMA-X
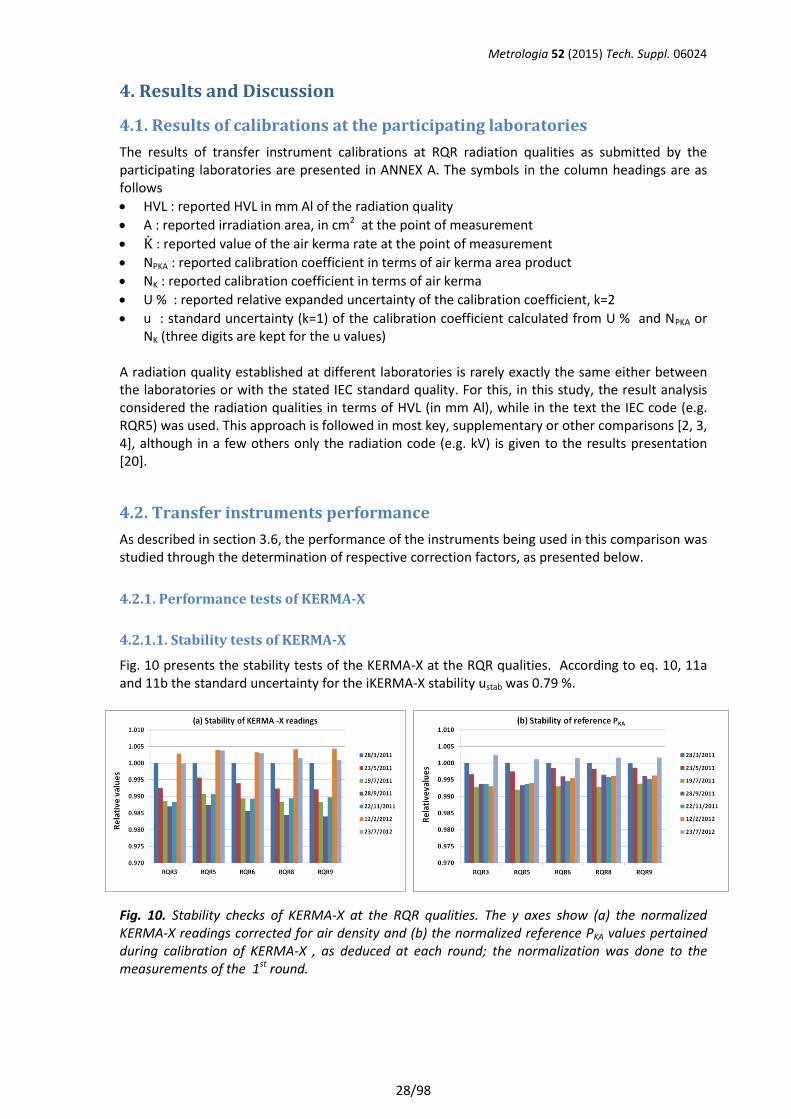
Fig. 10 presents the stability tests of the KERMA-X at the RQR qualities. According to eq. 10, 11a and 11b the standard uncertainty for the iKERMA-X stability ustab was 0.79 %.
Fig. 10. Stability checks of KERMA-X at the RQR qualities. The y axes show (a) the normalized KERMA-X readings corrected for air density and (b) the normalized reference PKA values pertained during calibration of KERMA-X , as deduced at each round; the normalization was done to the measurements of the 1st round.
Metrologia 52 (2015) Tech. Suppl. 06024
29/98
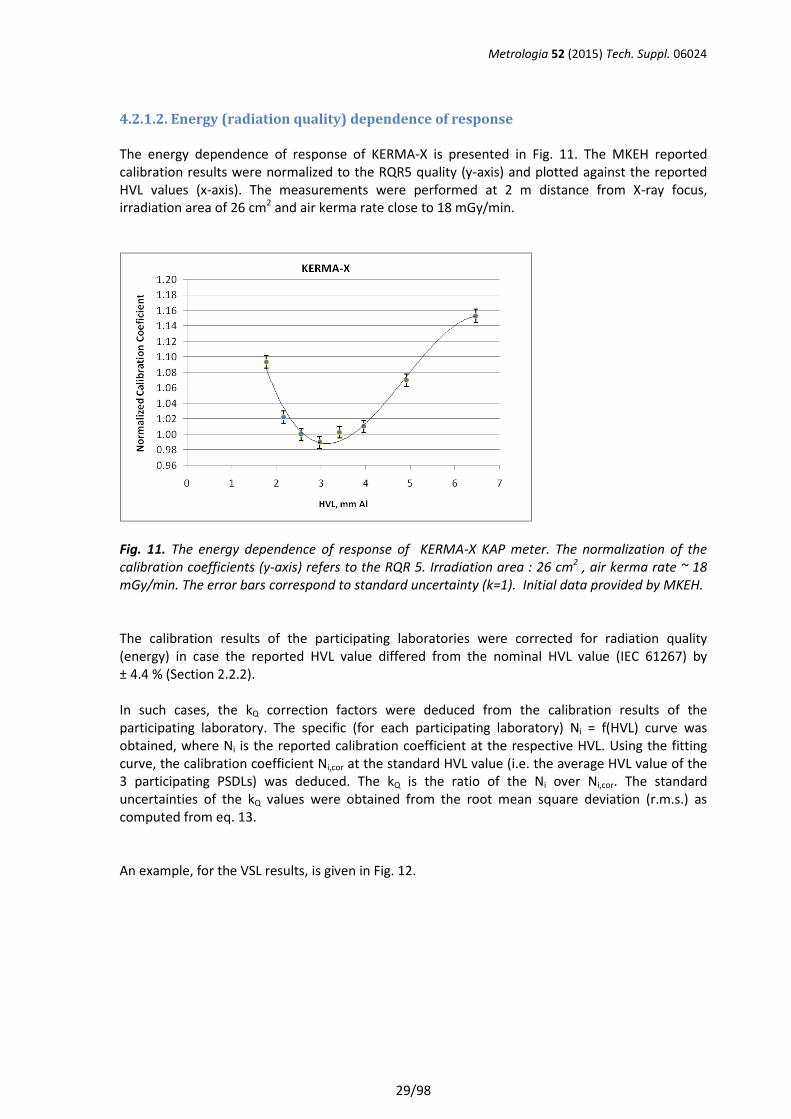
4.2.1.2. Energy (radiation quality) dependence of response The energy dependence of response of KERMA-X is presented in Fig. 11. The MKEH reported calibration results were normalized to the RQR5 quality (y-axis) and plotted against the reported HVL values (x-axis). The measurements were performed at 2 m distance from X-ray focus, irradiation area of 26 cm2 and air kerma rate close to 18 mGy/min.
Fig. 11. The energy dependence of response of KERMA-X KAP meter. The normalization of the calibration coefficients (y-axis) refers to the RQR 5. Irradiation area : 26 cm2 , air kerma rate ~ 18 mGy/min. The error bars correspond to standard uncertainty (k=1). Initial data provided by MKEH. The calibration results of the participating laboratories were corrected for radiation quality (energy) in case the reported HVL value differed from the nominal HVL value (IEC 61267) by ± 4.4 % (Section 2.2.2). In such cases, the kQ correction factors were deduced from the calibration results of the participating laboratory. The specific (for each participating laboratory) Ni = f(HVL) curve was obtained, where Ni is the reported calibration coefficient at the respective HVL. Using the fitting curve, the calibration coefficient Ni,cor at the standard HVL value (i.e. the average HVL value of the 3 participating PSDLs) was deduced. The kQ is the ratio of the Ni over Ni,cor. The standard uncertainties of the kQ values were obtained from the root mean square deviation (r.m.s.) as computed from eq. 13. An example, for the VSL results, is given in Fig. 12.
Metrologia 52 (2015) Tech. Suppl. 06024
30/98
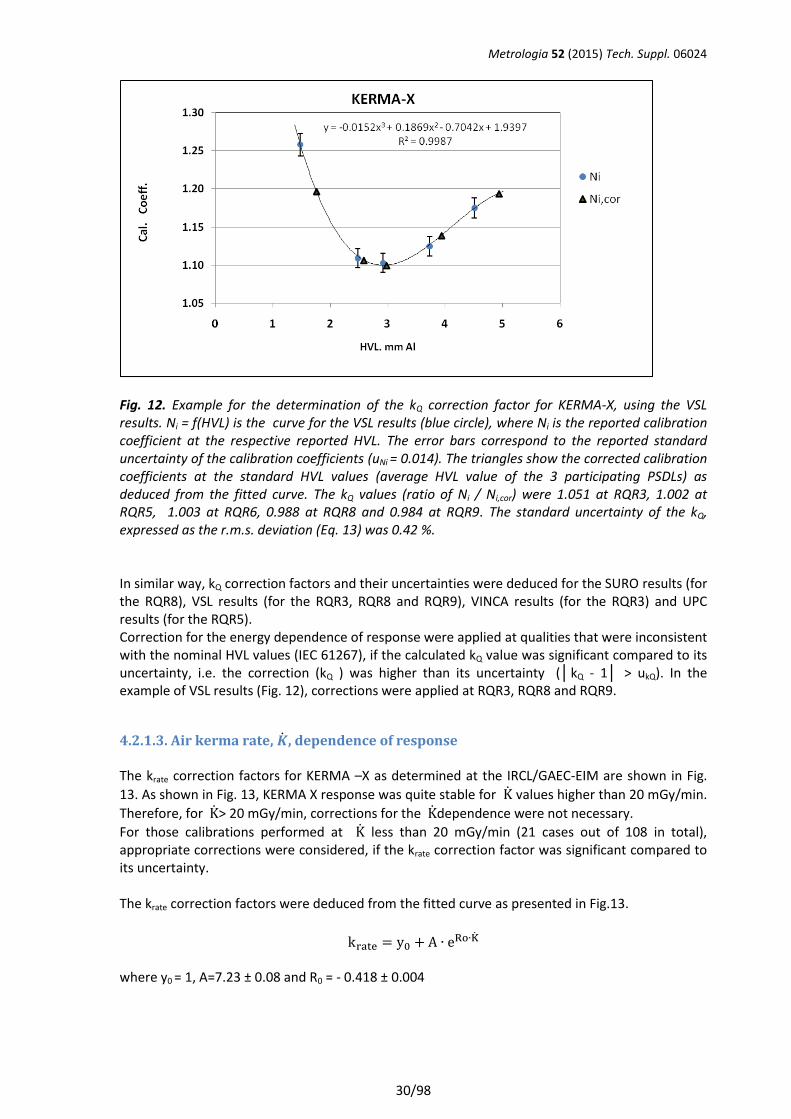
Fig. 12. Example for the determination of the kQ correction factor for KERMA-X, using the VSL results. Ni = f(HVL) is the curve for the VSL results (blue circle), where Ni is the reported calibration coefficient at the respective reported HVL. The error bars correspond to the reported standard uncertainty of the calibration coefficients (uNi = 0.014). The triangles show the corrected calibration coefficients at the standard HVL values (average HVL value of the 3 participating PSDLs) as deduced from the fitted curve. The kQ values (ratio of Ni / Ni,cor) were 1.051 at RQR3, 1.002 at RQR5, 1.003 at RQR6, 0.988 at RQR8 and 0.984 at RQR9. The standard uncertainty of the kQ, expressed as the r.m.s. deviation (Eq. 13) was 0.42 %. In similar way, kQ correction factors and their uncertainties were deduced for the SURO results (for the RQR8), VSL results (for the RQR3, RQR8 and RQR9), VINCA results (for the RQR3) and UPC results (for the RQR5). Correction for the energy dependence of response were applied at qualities that were inconsistent with the nominal HVL values (IEC 61267), if the calculated kQ value was significant compared to its uncertainty, i.e. the correction (kQ ) was higher than its uncertainty (│kQ - 1│ > ukQ). In the example of VSL results (Fig. 12), corrections were applied at RQR3, RQR8 and RQR9.
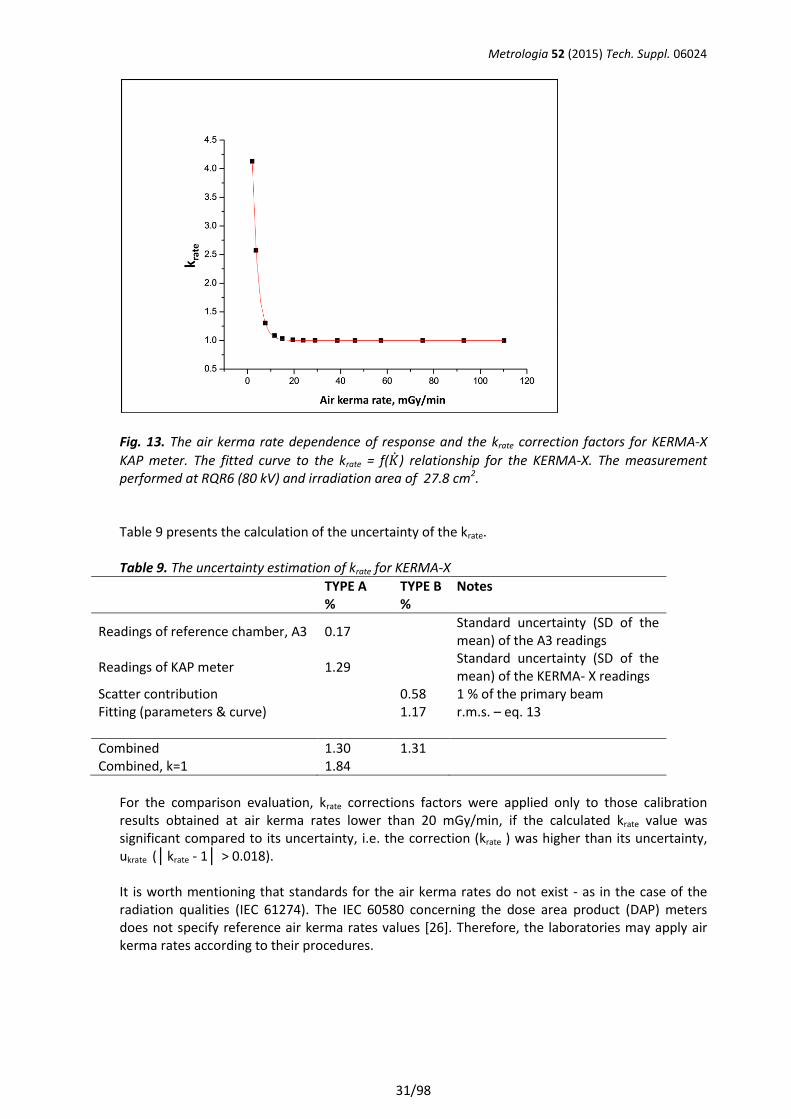
4.2.1.3. Air kerma rate, �̇�, dependence of response The krate correction factors for KERMA –X as determined at the IRCL/GAEC-EIM are shown in Fig.
13. As shown in Fig. 13, KERMA X response was quite stable for K̇ values higher than 20 mGy/min.
Therefore, for K̇> 20 mGy/min, corrections for the K̇dependence were not necessary.
For those calibrations performed at K̇ less than 20 mGy/min (21 cases out of 108 in total), appropriate corrections were considered, if the krate correction factor was significant compared to its uncertainty. The krate correction factors were deduced from the fitted curve as presented in Fig.13.
krate = y0 + A ∙ eRo∙K̇ where y0 = 1, A=7.23 ± 0.08 and R0 = - 0.418 ± 0.004
Metrologia 52 (2015) Tech. Suppl. 06024
31/98
Fig. 13. The air kerma rate dependence of response and the krate correction factors for KERMA-X
KAP meter. The fitted curve to the krate = f(�̇�) relationship for the KERMA-X. The measurement performed at RQR6 (80 kV) and irradiation area of 27.8 cm2. Table 9 presents the calculation of the uncertainty of the krate. Table 9. The uncertainty estimation of krate for KERMA-X
TYPE A TYPE B Notes
% %
Readings of reference chamber, A3 0.17
Standard uncertainty (SD of the mean) of the A3 readings
Readings of KAP meter 1.29
Standard uncertainty (SD of the mean) of the KERMA- X readings
Scatter contribution
0.58 1 % of the primary beam Fitting (parameters & curve)
1.17 r.m.s. – eq. 13
Combined 1.30 1.31 Combined, k=1 1.84
For the comparison evaluation, krate corrections factors were applied only to those calibration results obtained at air kerma rates lower than 20 mGy/min, if the calculated krate value was significant compared to its uncertainty, i.e. the correction (krate ) was higher than its uncertainty, ukrate (│krate - 1│ > 0.018). It is worth mentioning that standards for the air kerma rates do not exist - as in the case of the radiation qualities (IEC 61274). The IEC 60580 concerning the dose area product (DAP) meters does not specify reference air kerma rates values [26]. Therefore, the laboratories may apply air kerma rates according to their procedures.
Metrologia 52 (2015) Tech. Suppl. 06024
32/98
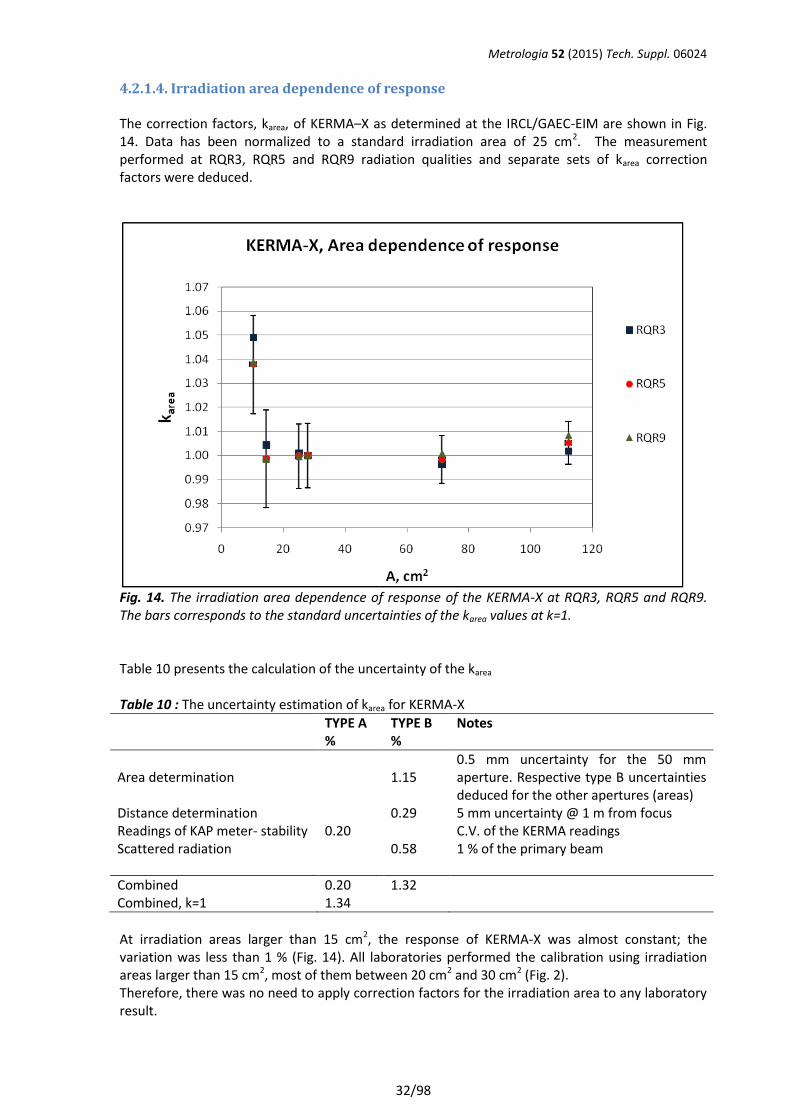
4.2.1.4. Irradiation area dependence of response The correction factors, karea, of KERMA–X as determined at the IRCL/GAEC-EIM are shown in Fig. 14. Data has been normalized to a standard irradiation area of 25 cm2. The measurement performed at RQR3, RQR5 and RQR9 radiation qualities and separate sets of karea correction factors were deduced.
Fig. 14. The irradiation area dependence of response of the KERMA-X at RQR3, RQR5 and RQR9. The bars corresponds to the standard uncertainties of the karea values at k=1. Table 10 presents the calculation of the uncertainty of the karea Table 10 : The uncertainty estimation of karea for KERMA-X
TYPE A TYPE B Notes
% %
Area determination
1.15 0.5 mm uncertainty for the 50 mm aperture. Respective type B uncertainties deduced for the other apertures (areas)
Distance determination
0.29 5 mm uncertainty @ 1 m from focus Readings of KAP meter- stability 0.20
C.V. of the KERMA readings
Scattered radiation
0.58 1 % of the primary beam
Combined 0.20 1.32 Combined, k=1 1.34
At irradiation areas larger than 15 cm2, the response of KERMA-X was almost constant; the variation was less than 1 % (Fig. 14). All laboratories performed the calibration using irradiation areas larger than 15 cm2, most of them between 20 cm2 and 30 cm2 (Fig. 2). Therefore, there was no need to apply correction factors for the irradiation area to any laboratory result.
Metrologia 52 (2015) Tech. Suppl. 06024
33/98
Concluding on the application of correction factors and their uncertainties to the calibration results of KERMA-X: kQ applied only to those results where the radiation quality was not consistent to the IEC 61274 standard, if kQ was higher than its uncertainty (i.e. │krate - 1│ > ukQ). krate applied to those results obtained at air kerma rates lower than 20 mGy/min, if krate was higher than its uncertainty, ukrate (i.e. │krate - 1│ > 0.018). karea did not apply to any calibration result.
4.2.2. Performance tests of PDC
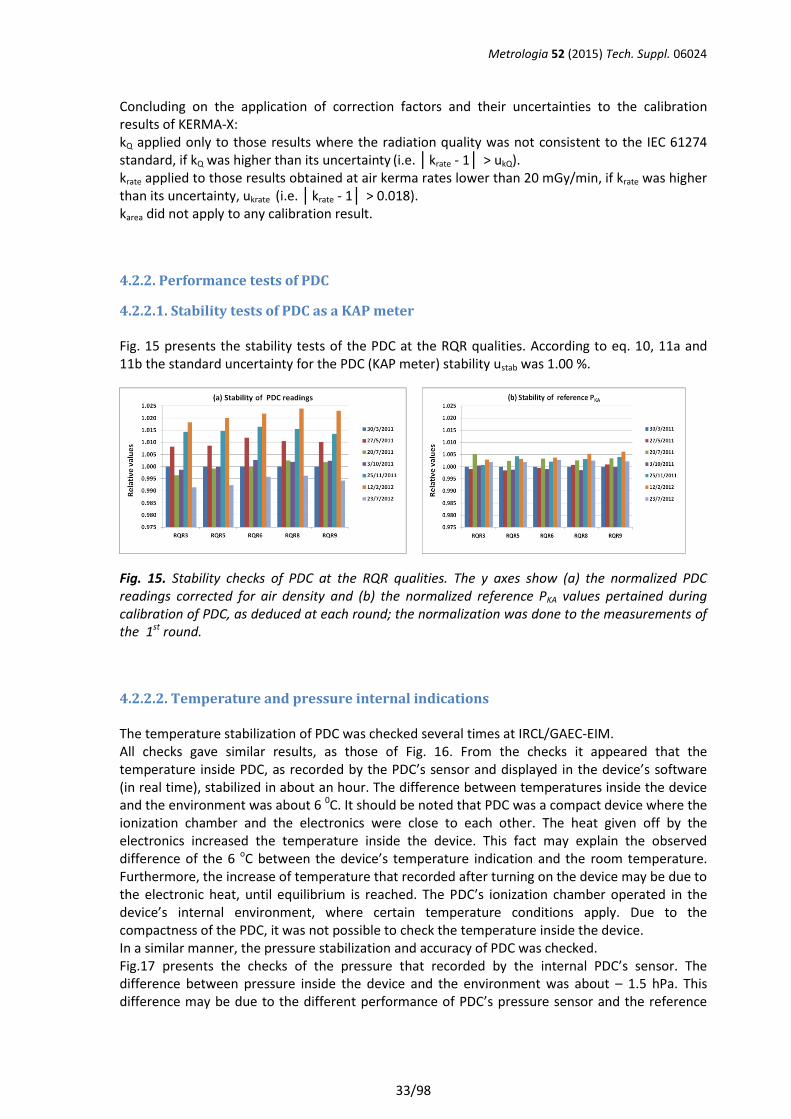
4.2.2.1. Stability tests of PDC as a KAP meter Fig. 15 presents the stability tests of the PDC at the RQR qualities. According to eq. 10, 11a and 11b the standard uncertainty for the PDC (KAP meter) stability ustab was 1.00 %.
Fig. 15. Stability checks of PDC at the RQR qualities. The y axes show (a) the normalized PDC readings corrected for air density and (b) the normalized reference PKA values pertained during calibration of PDC, as deduced at each round; the normalization was done to the measurements of the 1st round.
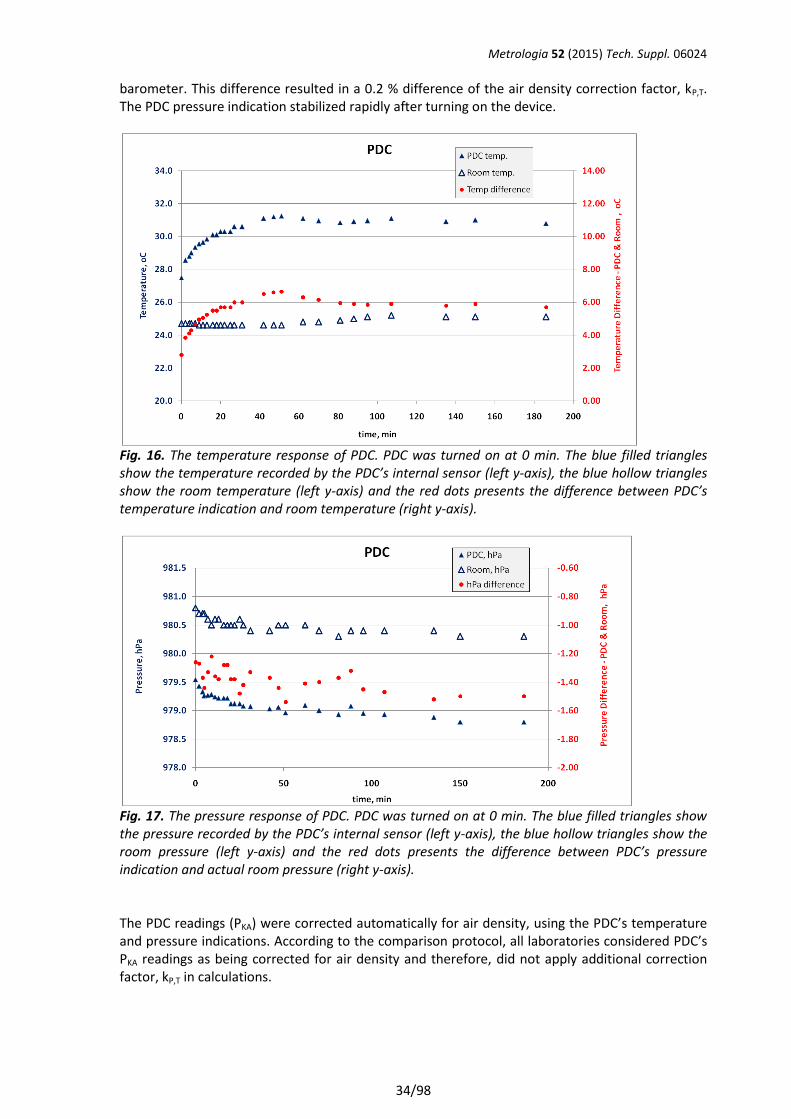
4.2.2.2. Temperature and pressure internal indications The temperature stabilization of PDC was checked several times at IRCL/GAEC-EIM. All checks gave similar results, as those of Fig. 16. From the checks it appeared that the temperature inside PDC, as recorded by the PDC’s sensor and displayed in the device’s software (in real time), stabilized in about an hour. The difference between temperatures inside the device and the environment was about 6 0C. It should be noted that PDC was a compact device where the ionization chamber and the electronics were close to each other. The heat given off by the electronics increased the temperature inside the device. This fact may explain the observed difference of the 6 oC between the device’s temperature indication and the room temperature. Furthermore, the increase of temperature that recorded after turning on the device may be due to the electronic heat, until equilibrium is reached. The PDC’s ionization chamber operated in the device’s internal environment, where certain temperature conditions apply. Due to the compactness of the PDC, it was not possible to check the temperature inside the device. In a similar manner, the pressure stabilization and accuracy of PDC was checked. Fig.17 presents the checks of the pressure that recorded by the internal PDC’s sensor. The difference between pressure inside the device and the environment was about – 1.5 hPa. This difference may be due to the different performance of PDC’s pressure sensor and the reference
Metrologia 52 (2015) Tech. Suppl. 06024
34/98
barometer. This difference resulted in a 0.2 % difference of the air density correction factor, kP,T. The PDC pressure indication stabilized rapidly after turning on the device.
Fig. 16. The temperature response of PDC. PDC was turned on at 0 min. The blue filled triangles show the temperature recorded by the PDC’s internal sensor (left y-axis), the blue hollow triangles show the room temperature (left y-axis) and the red dots presents the difference between PDC’s temperature indication and room temperature (right y-axis).
Fig. 17. The pressure response of PDC. PDC was turned on at 0 min. The blue filled triangles show the pressure recorded by the PDC’s internal sensor (left y-axis), the blue hollow triangles show the room pressure (left y-axis) and the red dots presents the difference between PDC’s pressure indication and actual room pressure (right y-axis). The PDC readings (PKA) were corrected automatically for air density, using the PDC’s temperature and pressure indications. According to the comparison protocol, all laboratories considered PDC’s PKA readings as being corrected for air density and therefore, did not apply additional correction factor, kP,T in calculations.
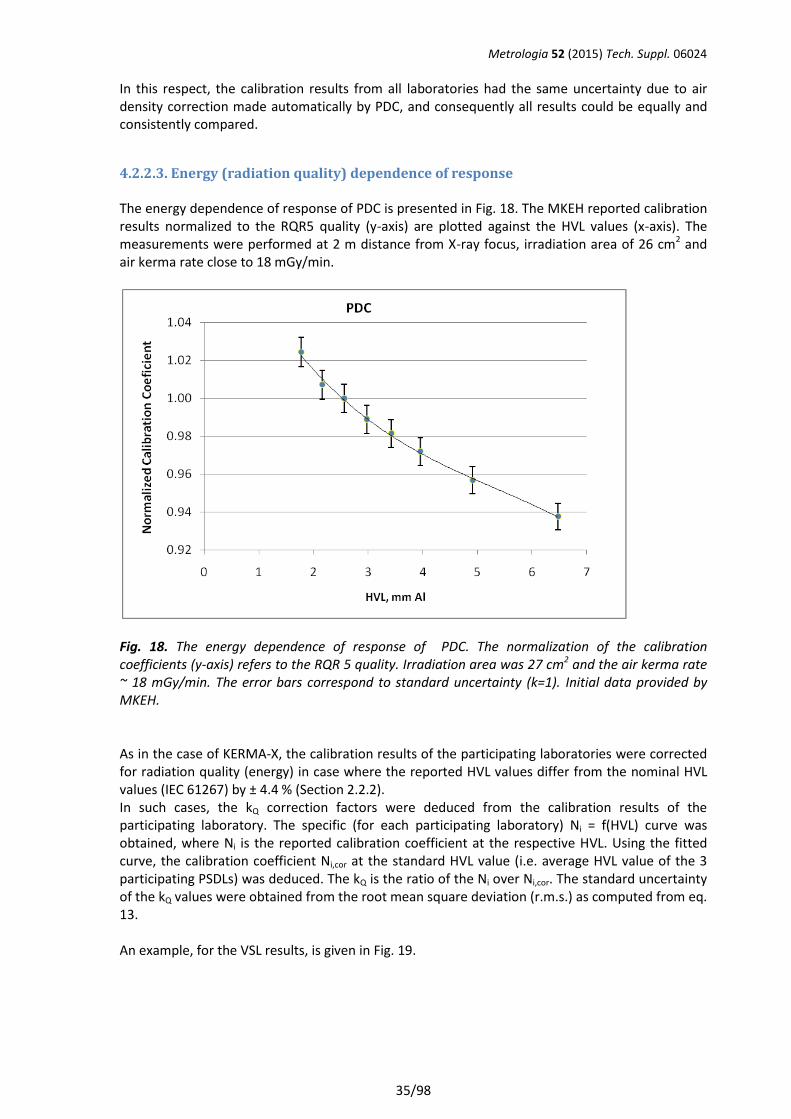
Metrologia 52 (2015) Tech. Suppl. 06024
35/98
In this respect, the calibration results from all laboratories had the same uncertainty due to air density correction made automatically by PDC, and consequently all results could be equally and consistently compared.
4.2.2.3. Energy (radiation quality) dependence of response The energy dependence of response of PDC is presented in Fig. 18. The MKEH reported calibration results normalized to the RQR5 quality (y-axis) are plotted against the HVL values (x-axis). The measurements were performed at 2 m distance from X-ray focus, irradiation area of 26 cm2 and air kerma rate close to 18 mGy/min.
Fig. 18. The energy dependence of response of PDC. The normalization of the calibration coefficients (y-axis) refers to the RQR 5 quality. Irradiation area was 27 cm2 and the air kerma rate ~ 18 mGy/min. The error bars correspond to standard uncertainty (k=1). Initial data provided by MKEH. As in the case of KERMA-X, the calibration results of the participating laboratories were corrected for radiation quality (energy) in case where the reported HVL values differ from the nominal HVL values (IEC 61267) by ± 4.4 % (Section 2.2.2). In such cases, the kQ correction factors were deduced from the calibration results of the participating laboratory. The specific (for each participating laboratory) Ni = f(HVL) curve was obtained, where Ni is the reported calibration coefficient at the respective HVL. Using the fitted curve, the calibration coefficient Ni,cor at the standard HVL value (i.e. average HVL value of the 3 participating PSDLs) was deduced. The kQ is the ratio of the Ni over Ni,cor. The standard uncertainty of the kQ values were obtained from the root mean square deviation (r.m.s.) as computed from eq. 13. An example, for the VSL results, is given in Fig. 19.
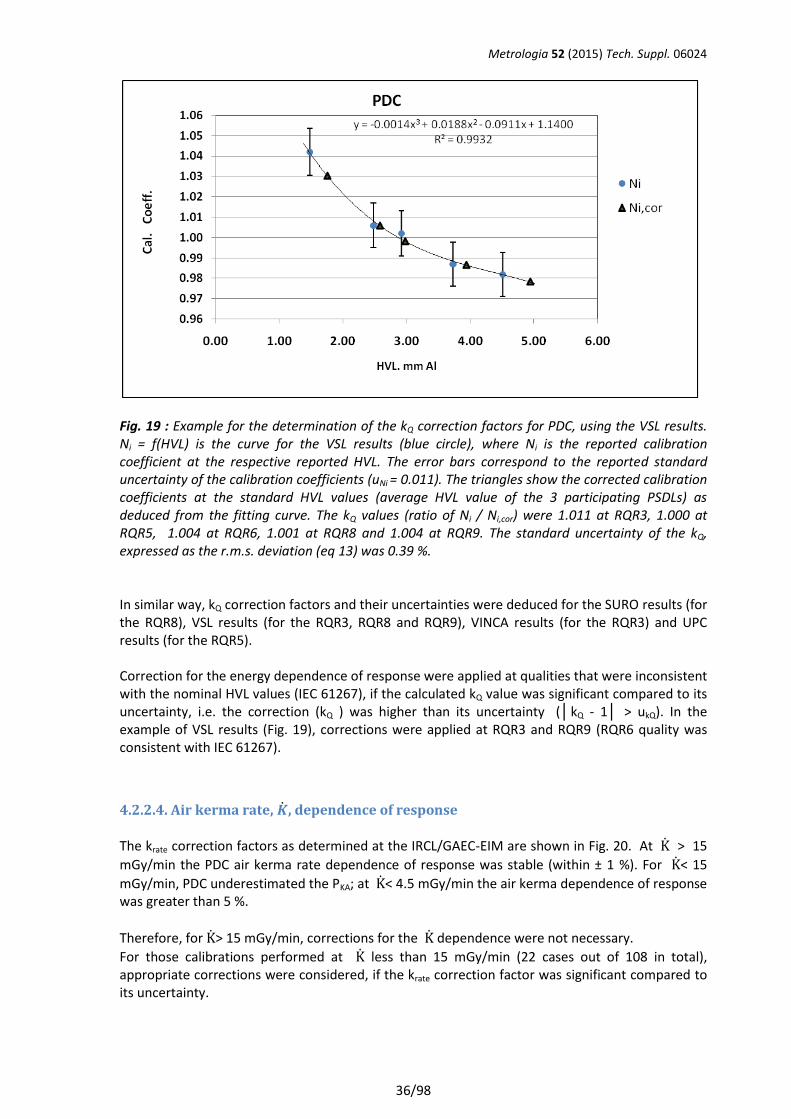
Metrologia 52 (2015) Tech. Suppl. 06024
36/98
Fig. 19 : Example for the determination of the kQ correction factors for PDC, using the VSL results. Ni = f(HVL) is the curve for the VSL results (blue circle), where Ni is the reported calibration coefficient at the respective reported HVL. The error bars correspond to the reported standard uncertainty of the calibration coefficients (uNi = 0.011). The triangles show the corrected calibration coefficients at the standard HVL values (average HVL value of the 3 participating PSDLs) as deduced from the fitting curve. The kQ values (ratio of Ni / Ni,cor) were 1.011 at RQR3, 1.000 at RQR5, 1.004 at RQR6, 1.001 at RQR8 and 1.004 at RQR9. The standard uncertainty of the kQ, expressed as the r.m.s. deviation (eq 13) was 0.39 %. In similar way, kQ correction factors and their uncertainties were deduced for the SURO results (for the RQR8), VSL results (for the RQR3, RQR8 and RQR9), VINCA results (for the RQR3) and UPC results (for the RQR5). Correction for the energy dependence of response were applied at qualities that were inconsistent with the nominal HVL values (IEC 61267), if the calculated kQ value was significant compared to its uncertainty, i.e. the correction (kQ ) was higher than its uncertainty (│kQ - 1│ > ukQ). In the example of VSL results (Fig. 19), corrections were applied at RQR3 and RQR9 (RQR6 quality was consistent with IEC 61267).
4.2.2.4. Air kerma rate, �̇�, dependence of response
The krate correction factors as determined at the IRCL/GAEC-EIM are shown in Fig. 20. At K̇ > 15
mGy/min the PDC air kerma rate dependence of response was stable (within ± 1 %). For K̇< 15
mGy/min, PDC underestimated the PKA; at K̇< 4.5 mGy/min the air kerma dependence of response was greater than 5 %.
Therefore, for K̇> 15 mGy/min, corrections for the K̇ dependence were not necessary.
For those calibrations performed at K̇ less than 15 mGy/min (22 cases out of 108 in total), appropriate corrections were considered, if the krate correction factor was significant compared to its uncertainty.
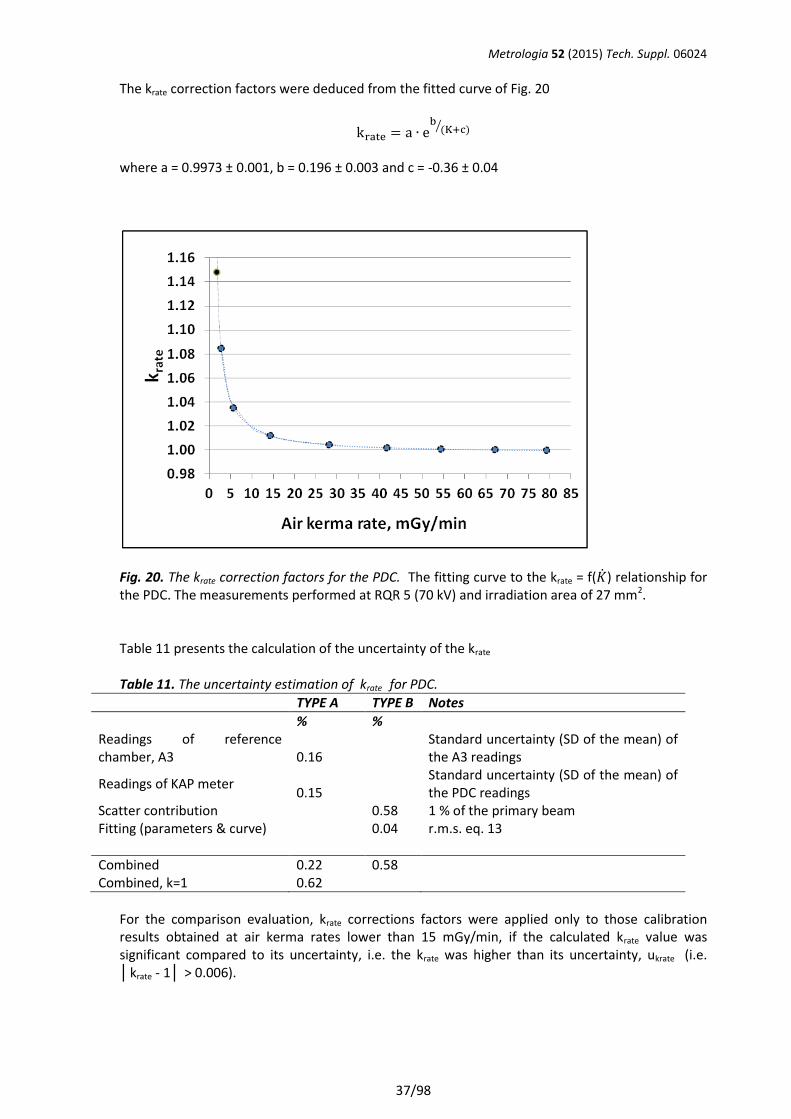
Metrologia 52 (2015) Tech. Suppl. 06024
37/98
The krate correction factors were deduced from the fitted curve of Fig. 20
krate = a ∙ eb
(K+c)⁄
where a = 0.9973 ± 0.001, b = 0.196 ± 0.003 and c = -0.36 ± 0.04
Fig. 20. The krate correction factors for the PDC. The fitting curve to the krate = f(�̇�) relationship for the PDC. The measurements performed at RQR 5 (70 kV) and irradiation area of 27 mm2. Table 11 presents the calculation of the uncertainty of the krate Table 11. The uncertainty estimation of krate for PDC.
TYPE A TYPE B Notes
% %
Readings of reference chamber, A3 0.16
Standard uncertainty (SD of the mean) of the A3 readings
Readings of KAP meter 0.15
Standard uncertainty (SD of the mean) of the PDC readings
Scatter contribution
0.58 1 % of the primary beam Fitting (parameters & curve)
0.04 r.m.s. eq. 13
Combined 0.22 0.58 Combined, k=1 0.62
For the comparison evaluation, krate corrections factors were applied only to those calibration results obtained at air kerma rates lower than 15 mGy/min, if the calculated krate value was significant compared to its uncertainty, i.e. the krate was higher than its uncertainty, ukrate (i.e. │krate - 1│ > 0.006).
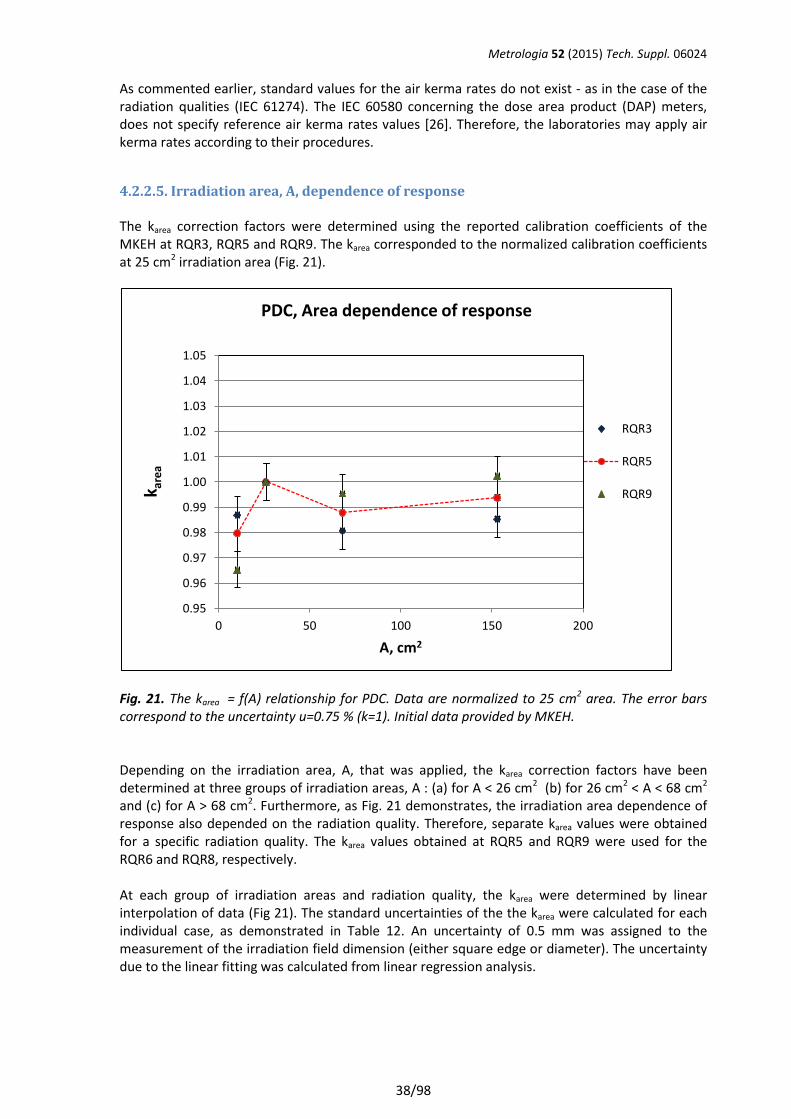
Metrologia 52 (2015) Tech. Suppl. 06024
38/98
As commented earlier, standard values for the air kerma rates do not exist - as in the case of the radiation qualities (IEC 61274). The IEC 60580 concerning the dose area product (DAP) meters, does not specify reference air kerma rates values [26]. Therefore, the laboratories may apply air kerma rates according to their procedures.
4.2.2.5. Irradiation area, A, dependence of response The karea correction factors were determined using the reported calibration coefficients of the MKEH at RQR3, RQR5 and RQR9. The karea corresponded to the normalized calibration coefficients at 25 cm2 irradiation area (Fig. 21).
Fig. 21. The karea = f(A) relationship for PDC. Data are normalized to 25 cm2 area. The error bars correspond to the uncertainty u=0.75 % (k=1). Initial data provided by MKEH. Depending on the irradiation area, A, that was applied, the karea correction factors have been determined at three groups of irradiation areas, A : (a) for A < 26 cm2 (b) for 26 cm2 < A < 68 cm2 and (c) for A > 68 cm2. Furthermore, as Fig. 21 demonstrates, the irradiation area dependence of response also depended on the radiation quality. Therefore, separate karea values were obtained for a specific radiation quality. The karea values obtained at RQR5 and RQR9 were used for the RQR6 and RQR8, respectively. At each group of irradiation areas and radiation quality, the karea were determined by linear interpolation of data (Fig 21). The standard uncertainties of the the karea were calculated for each individual case, as demonstrated in Table 12. An uncertainty of 0.5 mm was assigned to the measurement of the irradiation field dimension (either square edge or diameter). The uncertainty due to the linear fitting was calculated from linear regression analysis.
0.95
0.96
0.97
0.98
0.99
1.00
1.01
1.02
1.03
1.04
1.05
0 50 100 150 200
k are
a
A, cm2
PDC, Area dependence of response
RQR3
RQR5
RQR9
Metrologia 52 (2015) Tech. Suppl. 06024
39/98
Table 12 gives an example for the calculation of the karea uncertainty at RQR 5 and 28 cm2 irradiation area. The respective karea value, in this example, was 1.00 (Fig. 21). Similar uncertainty calculations were performed for each irradiation area and radiation quality for all results. Table 12. Example for uncertainty estimation of karea for PDC, at RQR 5 and 28 cm2 irradiation area.
TYPE A TYPE B Notes
% %
Area determination
1.10 Uncertainty of 0.5 mm for a 52.6 mm x 52.6 mm square field, A = 28 cm2
Linear fitting
0.72 Uncertainty of the linear fitting of 28 cm2 to to the range 10 cm2 < A < 68 cm2
Combined
1.31 Combined, k=1 1.31
Most of the laboratories performed the calibrations at irradiation areas, A, between 20 cm2 and 30 cm2 (Fig. 3). Two laboratories performed the calibration at smaller than 20 cm2 areas, i.e. IRP-DOS at 17.6 cm2 and GR at 10.7 cm2 and four laboratories performed the calibration at larger than 30 cm2 areas, i.e. SCK•CEN at 900 cm2, SIS at 260 cm2, VSL at 106.5 cm2, IFIN-HH at 218.9 cm2, VINCA 113.04 cm2, SIM at 87.9 cm2. The karea corrections factors were applied to those cases where the karea correction factor was significant compared to its standard combined uncertainty, i.e. if karea was higher larger than its uncertainty (│karea - 1│ > ukarea). As previously mentioned, reference values for the irradiation area do not exist - as in the case of the radiation qualities (IEC 61274) –. The IEC 60580 concerning the dose area product (DAP) meters, does not specify reference irradiation areas values [26]. Therefore, the laboratories may apply irradiation areas according to their procedures. Concluding on the application of correction factors and their uncertainties to the calibration results of the PDC: kQ was applied to those results where the radiation quality was not consistent to the IEC 61274 standard, if kQ was higher than its uncertainty (i.e. │kQ - 1│ > ukQ). krate was applied to those results obtained at air kerma rates lower than 15 mGy/min, if krate was higher than its uncertainty, ukrate (i.e. │krate - 1│ > 0.006). karea was applied, if karea value was significant, i.e. if karea was higher larger than its uncertainty (│karea - 1│ > ukarea).
4.2.3. Performance of MAGNA
4.2.3.1. Stability of MAGNA chamber Fig. 22 presents the stability tests of the MAGNA at the RQR qualities. According to eq. 10,11a and 11b the standard uncertainty for the MAGNA stability ustab was 0.30 %.
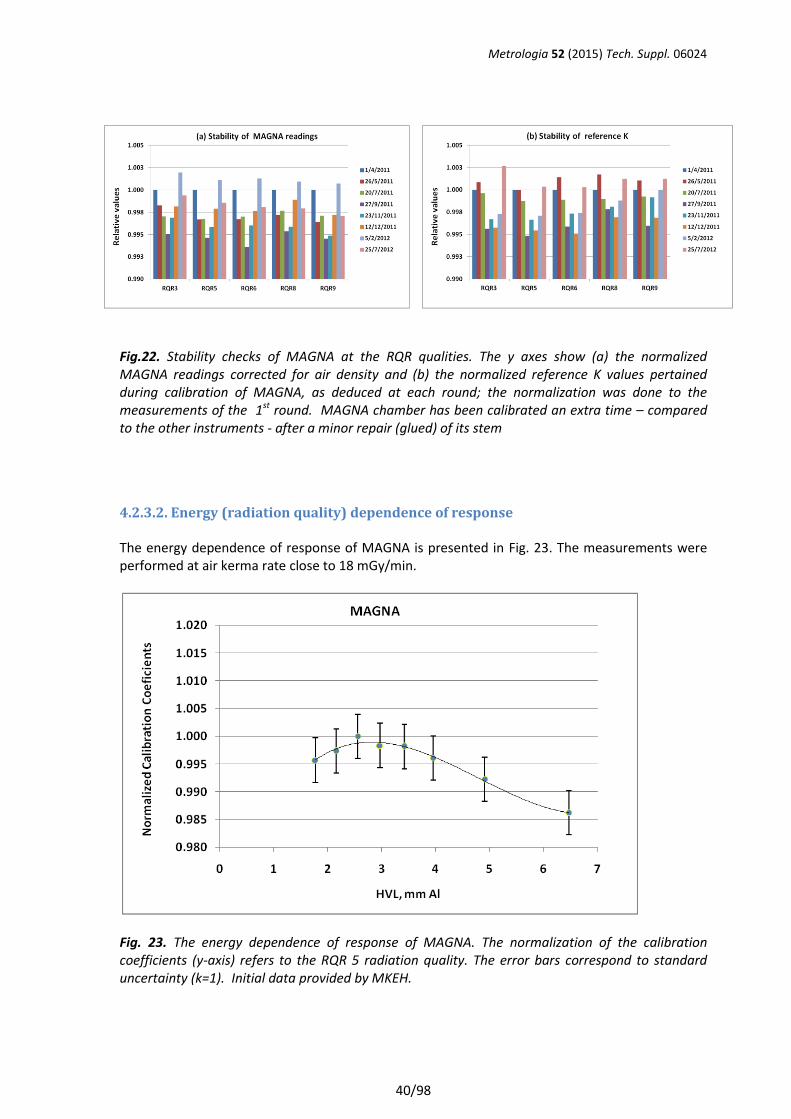
Metrologia 52 (2015) Tech. Suppl. 06024
40/98
Fig.22. Stability checks of MAGNA at the RQR qualities. The y axes show (a) the normalized MAGNA readings corrected for air density and (b) the normalized reference K values pertained during calibration of MAGNA, as deduced at each round; the normalization was done to the measurements of the 1st round. MAGNA chamber has been calibrated an extra time – compared to the other instruments - after a minor repair (glued) of its stem
4.2.3.2. Energy (radiation quality) dependence of response The energy dependence of response of MAGNA is presented in Fig. 23. The measurements were performed at air kerma rate close to 18 mGy/min.
Fig. 23. The energy dependence of response of MAGNA. The normalization of the calibration coefficients (y-axis) refers to the RQR 5 radiation quality. The error bars correspond to standard uncertainty (k=1). Initial data provided by MKEH.
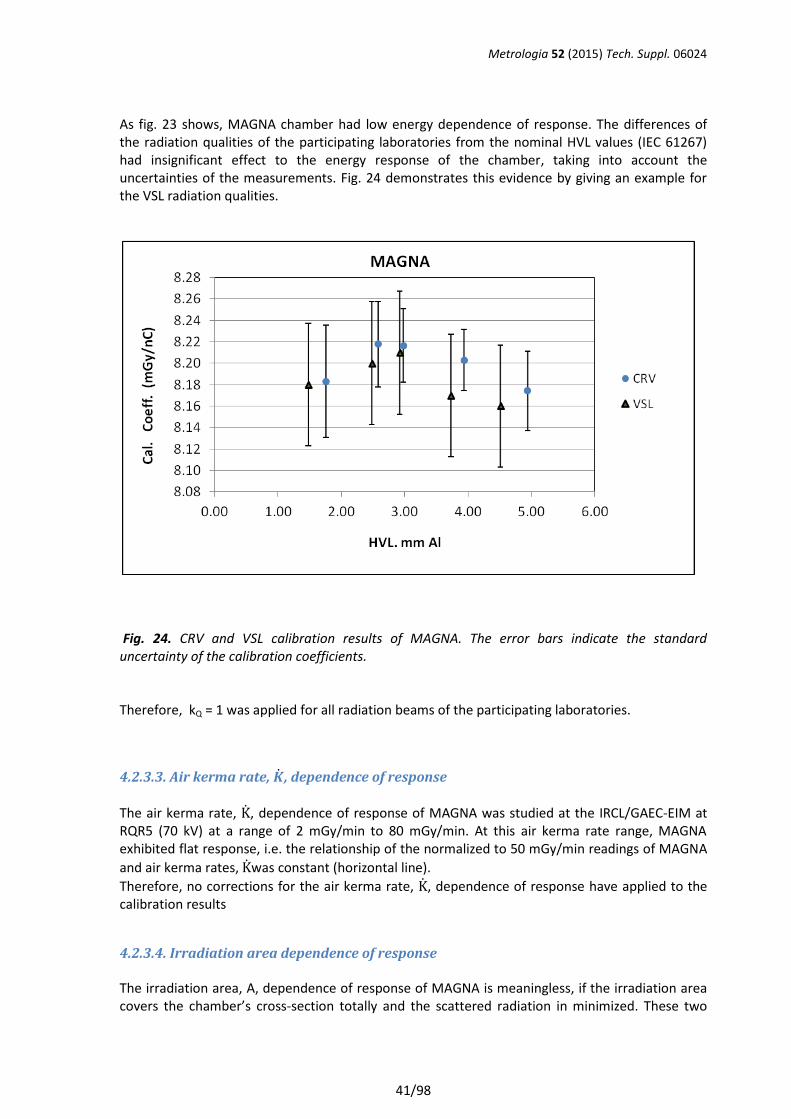
Metrologia 52 (2015) Tech. Suppl. 06024
41/98
As fig. 23 shows, MAGNA chamber had low energy dependence of response. The differences of the radiation qualities of the participating laboratories from the nominal HVL values (IEC 61267) had insignificant effect to the energy response of the chamber, taking into account the uncertainties of the measurements. Fig. 24 demonstrates this evidence by giving an example for the VSL radiation qualities.
Fig. 24. CRV and VSL calibration results of MAGNA. The error bars indicate the standard uncertainty of the calibration coefficients. Therefore, kQ = 1 was applied for all radiation beams of the participating laboratories.
4.2.3.3. Air kerma rate, �̇�, dependence of response
The air kerma rate, K̇, dependence of response of MAGNA was studied at the IRCL/GAEC-EIM at RQR5 (70 kV) at a range of 2 mGy/min to 80 mGy/min. At this air kerma rate range, MAGNA exhibited flat response, i.e. the relationship of the normalized to 50 mGy/min readings of MAGNA
and air kerma rates, K̇was constant (horizontal line).
Therefore, no corrections for the air kerma rate, K̇, dependence of response have applied to the calibration results
4.2.3.4. Irradiation area dependence of response The irradiation area, A, dependence of response of MAGNA is meaningless, if the irradiation area covers the chamber’s cross-section totally and the scattered radiation in minimized. These two
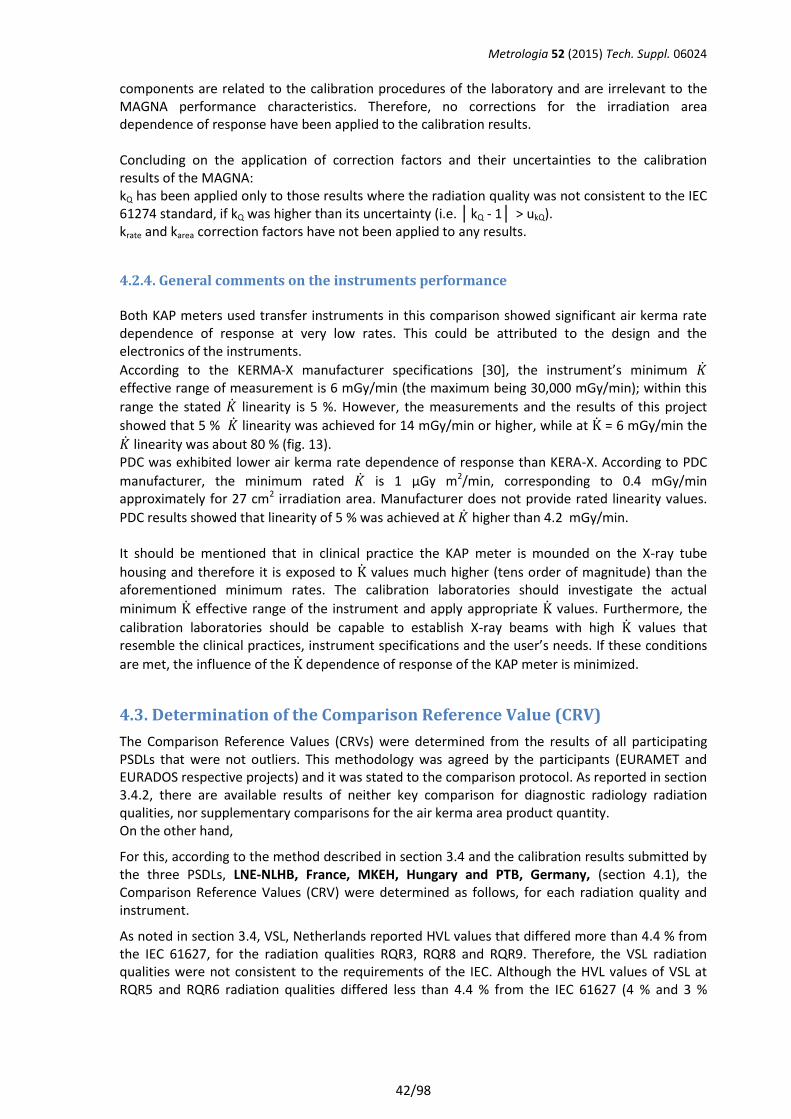
Metrologia 52 (2015) Tech. Suppl. 06024
42/98
components are related to the calibration procedures of the laboratory and are irrelevant to the MAGNA performance characteristics. Therefore, no corrections for the irradiation area dependence of response have been applied to the calibration results. Concluding on the application of correction factors and their uncertainties to the calibration results of the MAGNA: kQ has been applied only to those results where the radiation quality was not consistent to the IEC 61274 standard, if kQ was higher than its uncertainty (i.e. │kQ - 1│ > ukQ). krate and karea correction factors have not been applied to any results.
4.2.4. General comments on the instruments performance Both KAP meters used transfer instruments in this comparison showed significant air kerma rate dependence of response at very low rates. This could be attributed to the design and the electronics of the instruments.
According to the KERMA-X manufacturer specifications [30], the instrument’s minimum �̇� effective range of measurement is 6 mGy/min (the maximum being 30,000 mGy/min); within this
range the stated �̇� linearity is 5 %. However, the measurements and the results of this project
showed that 5 % �̇� linearity was achieved for 14 mGy/min or higher, while at K̇ = 6 mGy/min the
�̇� linearity was about 80 % (fig. 13). PDC was exhibited lower air kerma rate dependence of response than KERA-X. According to PDC
manufacturer, the minimum rated �̇� is 1 μGy m2/min, corresponding to 0.4 mGy/min approximately for 27 cm2 irradiation area. Manufacturer does not provide rated linearity values.
PDC results showed that linearity of 5 % was achieved at �̇� higher than 4.2 mGy/min. It should be mentioned that in clinical practice the KAP meter is mounded on the X-ray tube
housing and therefore it is exposed to K̇ values much higher (tens order of magnitude) than the aforementioned minimum rates. The calibration laboratories should investigate the actual
minimum K̇ effective range of the instrument and apply appropriate K̇ values. Furthermore, the
calibration laboratories should be capable to establish X-ray beams with high K̇ values that resemble the clinical practices, instrument specifications and the user’s needs. If these conditions
are met, the influence of the K̇ dependence of response of the KAP meter is minimized.
4.3. Determination of the Comparison Reference Value (CRV)
The Comparison Reference Values (CRVs) were determined from the results of all participating PSDLs that were not outliers. This methodology was agreed by the participants (EURAMET and EURADOS respective projects) and it was stated to the comparison protocol. As reported in section 3.4.2, there are available results of neither key comparison for diagnostic radiology radiation qualities, nor supplementary comparisons for the air kerma area product quantity. On the other hand,
For this, according to the method described in section 3.4 and the calibration results submitted by the three PSDLs, LNE-NLHB, France, MKEH, Hungary and PTB, Germany, (section 4.1), the Comparison Reference Values (CRV) were determined as follows, for each radiation quality and instrument.
As noted in section 3.4, VSL, Netherlands reported HVL values that differed more than 4.4 % from the IEC 61627, for the radiation qualities RQR3, RQR8 and RQR9. Therefore, the VSL radiation qualities were not consistent to the requirements of the IEC. Although the HVL values of VSL at RQR5 and RQR6 radiation qualities differed less than 4.4 % from the IEC 61627 (4 % and 3 %
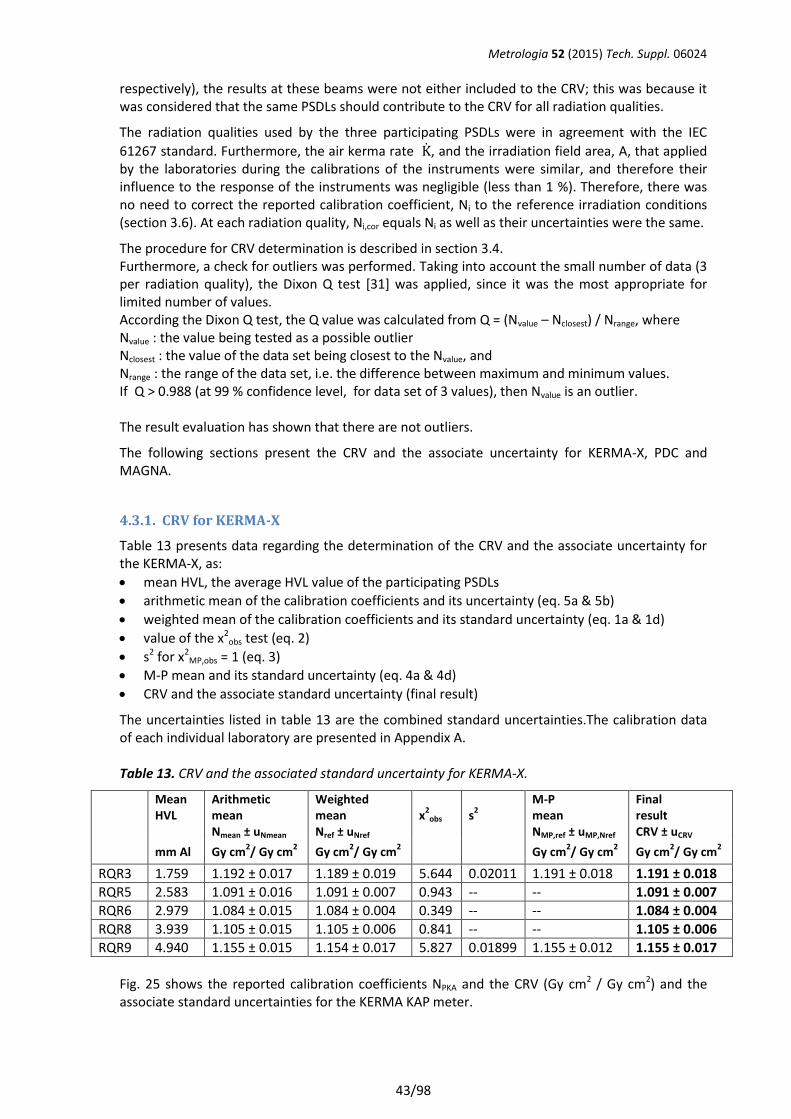
Metrologia 52 (2015) Tech. Suppl. 06024
43/98
respectively), the results at these beams were not either included to the CRV; this was because it was considered that the same PSDLs should contribute to the CRV for all radiation qualities.
The radiation qualities used by the three participating PSDLs were in agreement with the IEC
61267 standard. Furthermore, the air kerma rate K̇, and the irradiation field area, A, that applied by the laboratories during the calibrations of the instruments were similar, and therefore their influence to the response of the instruments was negligible (less than 1 %). Therefore, there was no need to correct the reported calibration coefficient, Ni to the reference irradiation conditions (section 3.6). At each radiation quality, Ni,cor equals Ni as well as their uncertainties were the same.
The procedure for CRV determination is described in section 3.4. Furthermore, a check for outliers was performed. Taking into account the small number of data (3 per radiation quality), the Dixon Q test [31] was applied, since it was the most appropriate for limited number of values. According the Dixon Q test, the Q value was calculated from Q = (Nvalue – Nclosest) / Nrange, where Nvalue : the value being tested as a possible outlier Nclosest : the value of the data set being closest to the Nvalue, and Nrange : the range of the data set, i.e. the difference between maximum and minimum values. If Q > 0.988 (at 99 % confidence level, for data set of 3 values), then Nvalue is an outlier. The result evaluation has shown that there are not outliers.
The following sections present the CRV and the associate uncertainty for KERMA-X, PDC and MAGNA.
4.3.1. CRV for KERMA-X
Table 13 presents data regarding the determination of the CRV and the associate uncertainty for the KERMA-X, as:
mean HVL, the average HVL value of the participating PSDLs
arithmetic mean of the calibration coefficients and its uncertainty (eq. 5a & 5b)
weighted mean of the calibration coefficients and its standard uncertainty (eq. 1a & 1d)
value of the x2obs test (eq. 2)
s2 for x2MP,obs = 1 (eq. 3)
M-P mean and its standard uncertainty (eq. 4a & 4d)
CRV and the associate standard uncertainty (final result)
The uncertainties listed in table 13 are the combined standard uncertainties.The calibration data of each individual laboratory are presented in Appendix A. Table 13. CRV and the associated standard uncertainty for KERMA-X.
Mean HVL
Arithmetic mean Nmean ± uNmean
Weighted mean Nref ± uNref
x2
obs s2
M-P mean NMP,ref ± uMP,Nref
Final result CRV ± uCRV
mm Al Gy cm2/ Gy cm
2 Gy cm
2/ Gy cm
2 Gy cm
2/ Gy cm
2 Gy cm
2/ Gy cm
2
RQR3 1.759 1.192 ± 0.017 1.189 ± 0.019 5.644 0.02011 1.191 ± 0.018 1.191 ± 0.018
RQR5 2.583 1.091 ± 0.016 1.091 ± 0.007 0.943 -- -- 1.091 ± 0.007
RQR6 2.979 1.084 ± 0.015 1.084 ± 0.004 0.349 -- -- 1.084 ± 0.004
RQR8 3.939 1.105 ± 0.015 1.105 ± 0.006 0.841 -- -- 1.105 ± 0.006
RQR9 4.940 1.155 ± 0.015 1.154 ± 0.017 5.827 0.01899 1.155 ± 0.012 1.155 ± 0.017
Fig. 25 shows the reported calibration coefficients NPKA and the CRV (Gy cm2 / Gy cm2) and the associate standard uncertainties for the KERMA KAP meter.
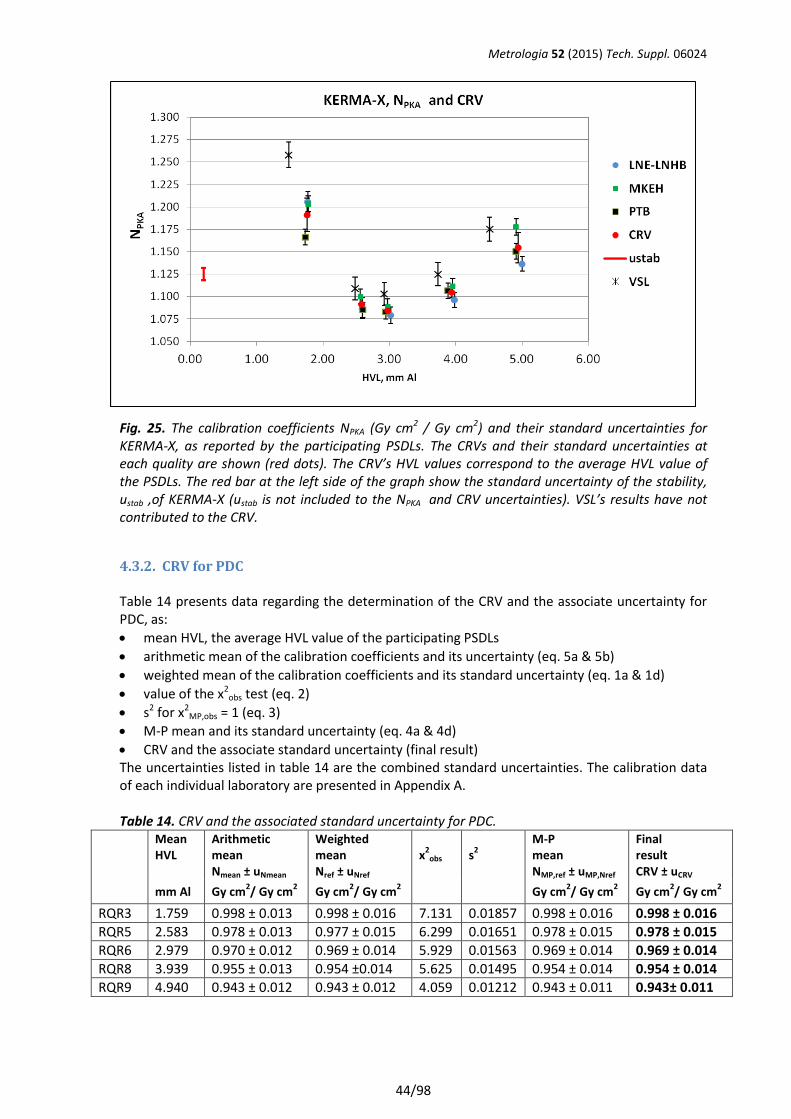
Metrologia 52 (2015) Tech. Suppl. 06024
44/98
Fig. 25. The calibration coefficients NPKA (Gy cm2 / Gy cm2) and their standard uncertainties for KERMA-X, as reported by the participating PSDLs. The CRVs and their standard uncertainties at each quality are shown (red dots). The CRV’s HVL values correspond to the average HVL value of the PSDLs. The red bar at the left side of the graph show the standard uncertainty of the stability, ustab ,of KERMA-X (ustab is not included to the NPKA and CRV uncertainties). VSL’s results have not contributed to the CRV.
4.3.2. CRV for PDC Table 14 presents data regarding the determination of the CRV and the associate uncertainty for PDC, as:
mean HVL, the average HVL value of the participating PSDLs
arithmetic mean of the calibration coefficients and its uncertainty (eq. 5a & 5b)
weighted mean of the calibration coefficients and its standard uncertainty (eq. 1a & 1d)
value of the x2obs test (eq. 2)
s2 for x2MP,obs = 1 (eq. 3)
M-P mean and its standard uncertainty (eq. 4a & 4d)
CRV and the associate standard uncertainty (final result) The uncertainties listed in table 14 are the combined standard uncertainties. The calibration data of each individual laboratory are presented in Appendix A. Table 14. CRV and the associated standard uncertainty for PDC.
Mean HVL
Arithmetic mean Nmean ± uNmean
Weighted mean Nref ± uNref
x2
obs s2
M-P mean NMP,ref ± uMP,Nref
Final result CRV ± uCRV
mm Al Gy cm2/ Gy cm
2 Gy cm
2/ Gy cm
2 Gy cm
2/ Gy cm
2 Gy cm
2/ Gy cm
2
RQR3 1.759 0.998 ± 0.013 0.998 ± 0.016 7.131 0.01857 0.998 ± 0.016 0.998 ± 0.016
RQR5 2.583 0.978 ± 0.013 0.977 ± 0.015 6.299 0.01651 0.978 ± 0.015 0.978 ± 0.015
RQR6 2.979 0.970 ± 0.012 0.969 ± 0.014 5.929 0.01563 0.969 ± 0.014 0.969 ± 0.014
RQR8 3.939 0.955 ± 0.013 0.954 ±0.014 5.625 0.01495 0.954 ± 0.014 0.954 ± 0.014
RQR9 4.940 0.943 ± 0.012 0.943 ± 0.012 4.059 0.01212 0.943 ± 0.011 0.943± 0.011
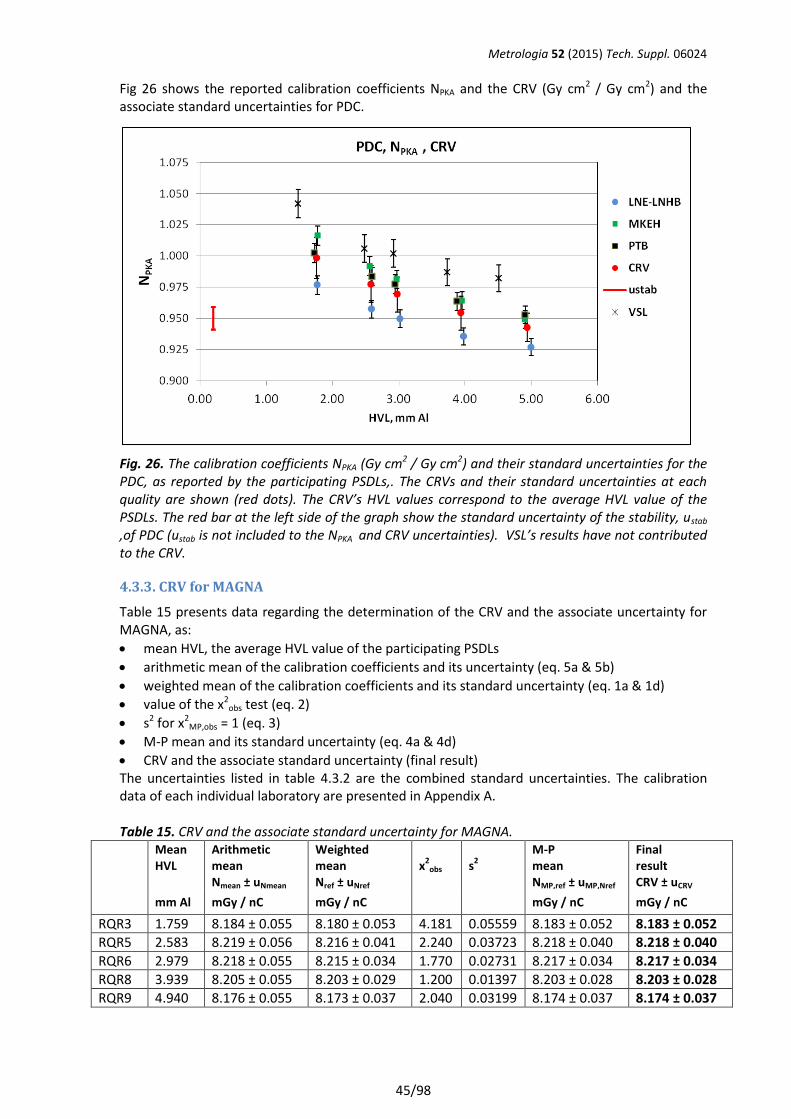
Metrologia 52 (2015) Tech. Suppl. 06024
45/98
Fig 26 shows the reported calibration coefficients NPKA and the CRV (Gy cm2 / Gy cm2) and the associate standard uncertainties for PDC.
Fig. 26. The calibration coefficients NPKA (Gy cm2 / Gy cm2) and their standard uncertainties for the PDC, as reported by the participating PSDLs,. The CRVs and their standard uncertainties at each quality are shown (red dots). The CRV’s HVL values correspond to the average HVL value of the PSDLs. The red bar at the left side of the graph show the standard uncertainty of the stability, ustab ,of PDC (ustab is not included to the NPKA and CRV uncertainties). VSL’s results have not contributed to the CRV.
4.3.3. CRV for MAGNA
Table 15 presents data regarding the determination of the CRV and the associate uncertainty for MAGNA, as:
mean HVL, the average HVL value of the participating PSDLs
arithmetic mean of the calibration coefficients and its uncertainty (eq. 5a & 5b)
weighted mean of the calibration coefficients and its standard uncertainty (eq. 1a & 1d)
value of the x2obs test (eq. 2)
s2 for x2MP,obs = 1 (eq. 3)
M-P mean and its standard uncertainty (eq. 4a & 4d)
CRV and the associate standard uncertainty (final result) The uncertainties listed in table 4.3.2 are the combined standard uncertainties. The calibration data of each individual laboratory are presented in Appendix A. Table 15. CRV and the associate standard uncertainty for MAGNA.
Mean HVL
Arithmetic mean Nmean ± uNmean
Weighted mean Nref ± uNref
x2
obs s2
M-P mean NMP,ref ± uMP,Nref
Final result CRV ± uCRV
mm Al mGy / nC mGy / nC mGy / nC mGy / nC
RQR3 1.759 8.184 ± 0.055 8.180 ± 0.053 4.181 0.05559 8.183 ± 0.052 8.183 ± 0.052
RQR5 2.583 8.219 ± 0.056 8.216 ± 0.041 2.240 0.03723 8.218 ± 0.040 8.218 ± 0.040
RQR6 2.979 8.218 ± 0.055 8.215 ± 0.034 1.770 0.02731 8.217 ± 0.034 8.217 ± 0.034
RQR8 3.939 8.205 ± 0.055 8.203 ± 0.029 1.200 0.01397 8.203 ± 0.028 8.203 ± 0.028
RQR9 4.940 8.176 ± 0.055 8.173 ± 0.037 2.040 0.03199 8.174 ± 0.037 8.174 ± 0.037
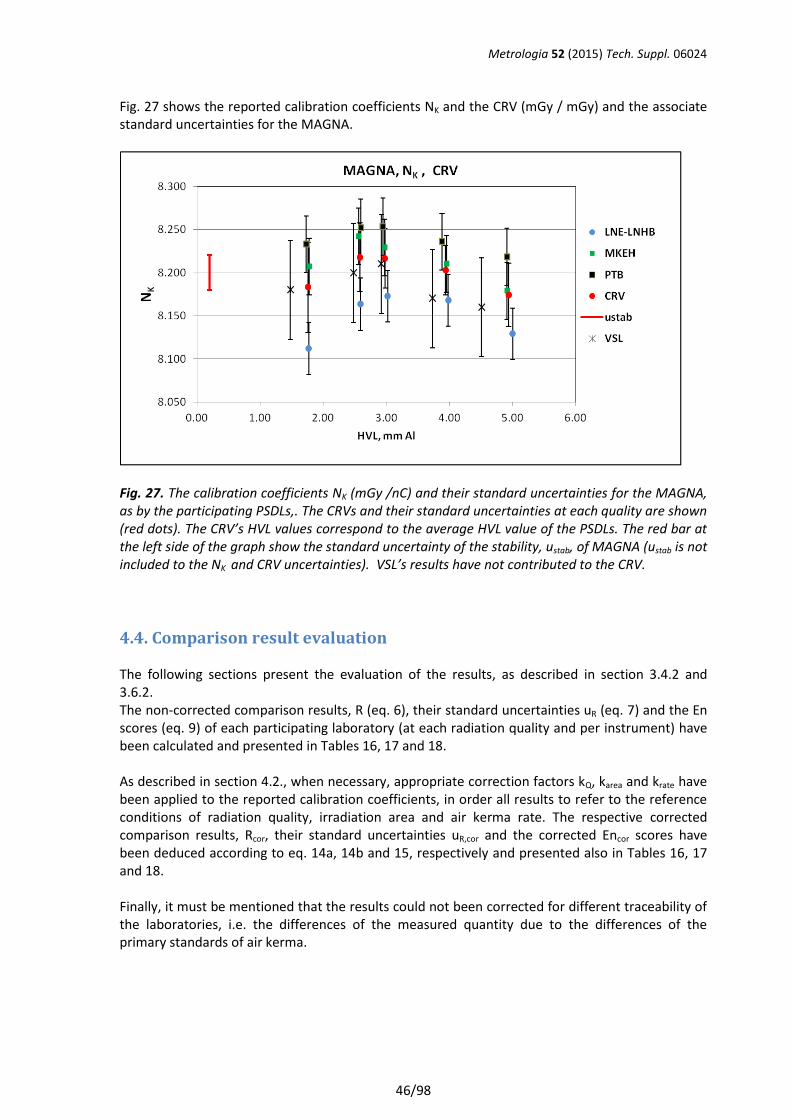
Metrologia 52 (2015) Tech. Suppl. 06024
46/98
Fig. 27 shows the reported calibration coefficients NK and the CRV (mGy / mGy) and the associate standard uncertainties for the MAGNA.
Fig. 27. The calibration coefficients NK (mGy /nC) and their standard uncertainties for the MAGNA, as by the participating PSDLs,. The CRVs and their standard uncertainties at each quality are shown (red dots). The CRV’s HVL values correspond to the average HVL value of the PSDLs. The red bar at the left side of the graph show the standard uncertainty of the stability, ustab, of MAGNA (ustab is not included to the NK and CRV uncertainties). VSL’s results have not contributed to the CRV.
4.4. Comparison result evaluation The following sections present the evaluation of the results, as described in section 3.4.2 and 3.6.2. The non-corrected comparison results, R (eq. 6), their standard uncertainties uR (eq. 7) and the En scores (eq. 9) of each participating laboratory (at each radiation quality and per instrument) have been calculated and presented in Tables 16, 17 and 18. As described in section 4.2., when necessary, appropriate correction factors kQ, karea and krate have been applied to the reported calibration coefficients, in order all results to refer to the reference conditions of radiation quality, irradiation area and air kerma rate. The respective corrected comparison results, Rcor, their standard uncertainties uR,cor and the corrected Encor scores have been deduced according to eq. 14a, 14b and 15, respectively and presented also in Tables 16, 17 and 18. Finally, it must be mentioned that the results could not been corrected for different traceability of the laboratories, i.e. the differences of the measured quantity due to the differences of the primary standards of air kerma.
Metrologia 52 (2015) Tech. Suppl. 06024
47/98
4.4.1. Comparison results of KERMA-X Table 16 presents the comparison results of KERMA-X. The first three (left side) columns of Table 16 give the non-corrected comparison result, R (ratio of reported calibration coefficient and CRV) and its standard uncertainty, uR, for KERMA-X, as well as the En scores for the non-corrected results. The rest of the columns indicate: kQ, karea & krate : correction factors for energy, irradiation area and air kerma rate that were applied to the reported calibration coefficients, NPKA NPKA,cor : calibration coefficient corrected for energy, irradiation area and air kerma rate, i.e NPKA,cor = NPKA · kQ · karea · krate Rcor : comparison result (ratio of corrected calibration coefficient and CRV), corrected for energy, irradiation area and air kerma rate uRcor : standard uncertainty of the Rcor En,cor : score using results corrected for energy, irradiation area and air kerma rate The results are presented in alphabetic order of the laboratories’ codes used in this report.
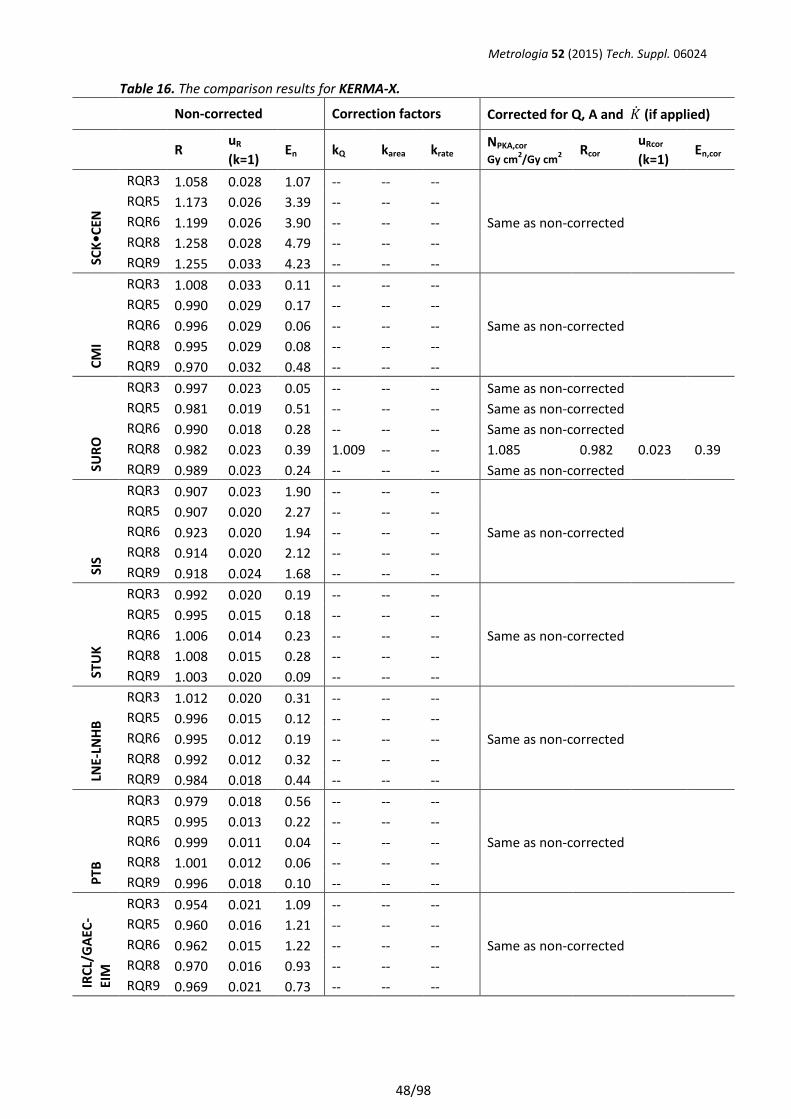
Metrologia 52 (2015) Tech. Suppl. 06024
48/98
Table 16. The comparison results for KERMA-X. Non-corrected Correction factors Corrected for Q, A and �̇� (if applied)
R uR
(k=1) En kQ karea krate
NPKA,cor Gy cm
2/Gy cm
2 Rcor
uRcor
(k=1) En,cor
SCK
•CEN
RQR3 1.058 0.028 1.07 -- -- --
RQR5 1.173 0.026 3.39 -- -- --
RQR6 1.199 0.026 3.90 -- -- -- Same as non-corrected
RQR8 1.258 0.028 4.79 -- -- --
RQR9 1.255 0.033 4.23 -- -- --
CM
I
RQR3 1.008 0.033 0.11 -- -- --
RQR5 0.990 0.029 0.17 -- -- --
RQR6 0.996 0.029 0.06 -- -- -- Same as non-corrected
RQR8 0.995 0.029 0.08 -- -- --
RQR9 0.970 0.032 0.48 -- -- --
SUR
O
RQR3 0.997 0.023 0.05 -- -- -- Same as non-corrected
RQR5 0.981 0.019 0.51 -- -- -- Same as non-corrected
RQR6 0.990 0.018 0.28 -- -- -- Same as non-corrected
RQR8 0.982 0.023 0.39 1.009 -- -- 1.085 0.982 0.023 0.39
RQR9 0.989 0.023 0.24 -- -- -- Same as non-corrected
SIS
RQR3 0.907 0.023 1.90 -- -- --
RQR5 0.907 0.020 2.27 -- -- --
RQR6 0.923 0.020 1.94 -- -- -- Same as non-corrected
RQR8 0.914 0.020 2.12 -- -- --
RQR9 0.918 0.024 1.68 -- -- --
STU
K
RQR3 0.992 0.020 0.19 -- -- --
RQR5 0.995 0.015 0.18 -- -- --
RQR6 1.006 0.014 0.23 -- -- -- Same as non-corrected
RQR8 1.008 0.015 0.28 -- -- --
RQR9 1.003 0.020 0.09 -- -- --
LNE-
LNH
B
RQR3 1.012 0.020 0.31 -- -- --
RQR5 0.996 0.015 0.12 -- -- --
RQR6 0.995 0.012 0.19 -- -- -- Same as non-corrected
RQR8 0.992 0.012 0.32 -- -- --
RQR9 0.984 0.018 0.44 -- -- --
PTB
RQR3 0.979 0.018 0.56 -- -- --
RQR5 0.995 0.013 0.22 -- -- --
RQR6 0.999 0.011 0.04 -- -- -- Same as non-corrected
RQR8 1.001 0.012 0.06 -- -- --
RQR9 0.996 0.018 0.10 -- -- --
IRC
L/G
AEC
-EI
M
RQR3 0.954 0.021 1.09 -- -- --
RQR5 0.960 0.016 1.21 -- -- --
RQR6 0.962 0.015 1.22 -- -- -- Same as non-corrected
RQR8 0.970 0.016 0.93 -- -- --
RQR9 0.969 0.021 0.73 -- -- --
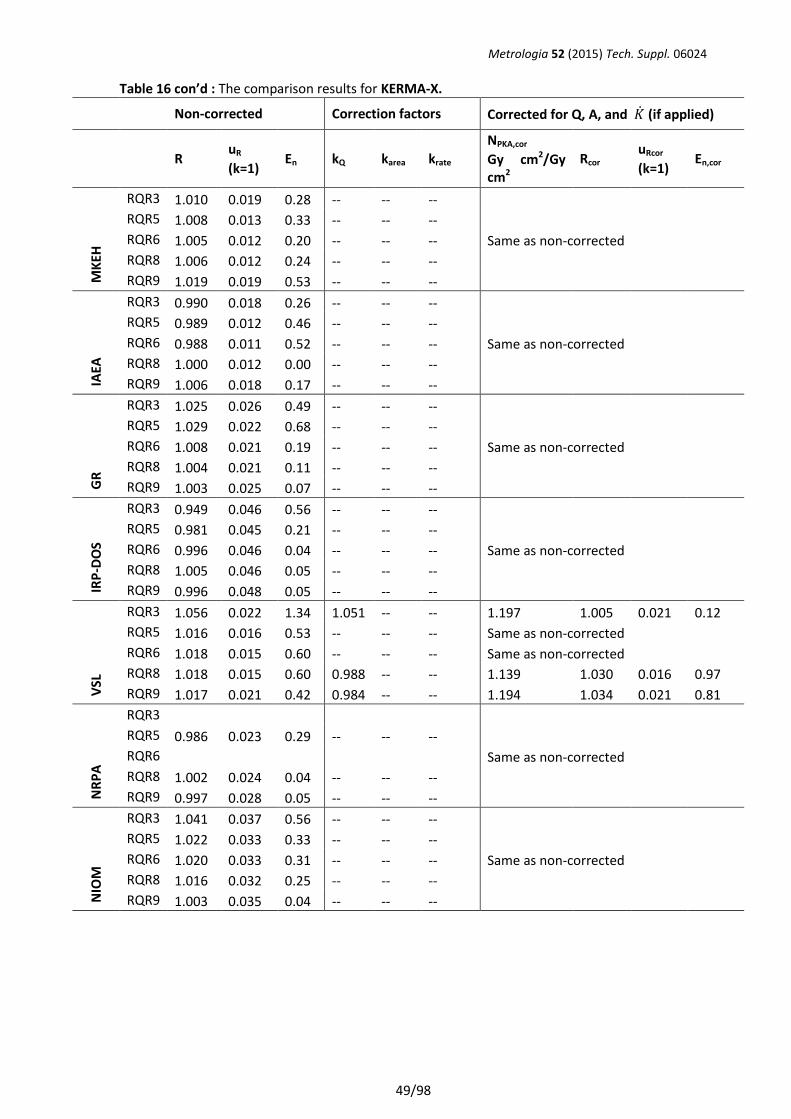
Metrologia 52 (2015) Tech. Suppl. 06024
49/98
Table 16 con’d : The comparison results for KERMA-X. Non-corrected Correction factors Corrected for Q, A, and �̇� (if applied)
R uR
(k=1) En kQ karea krate
NPKA,cor
Gy cm2/Gy cm2
Rcor uRcor
(k=1) En,cor
MK
EH
RQR3 1.010 0.019 0.28 -- -- --
RQR5 1.008 0.013 0.33 -- -- --
RQR6 1.005 0.012 0.20 -- -- -- Same as non-corrected
RQR8 1.006 0.012 0.24 -- -- --
RQR9 1.019 0.019 0.53 -- -- --
IAEA
RQR3 0.990 0.018 0.26 -- -- --
RQR5 0.989 0.012 0.46 -- -- --
RQR6 0.988 0.011 0.52 -- -- -- Same as non-corrected
RQR8 1.000 0.012 0.00 -- -- --
RQR9 1.006 0.018 0.17 -- -- --
GR
RQR3 1.025 0.026 0.49 -- -- --
RQR5 1.029 0.022 0.68 -- -- --
RQR6 1.008 0.021 0.19 -- -- -- Same as non-corrected
RQR8 1.004 0.021 0.11 -- -- --
RQR9 1.003 0.025 0.07 -- -- --
IRP
-DO
S
RQR3 0.949 0.046 0.56 -- -- --
RQR5 0.981 0.045 0.21 -- -- --
RQR6 0.996 0.046 0.04 -- -- -- Same as non-corrected
RQR8 1.005 0.046 0.05 -- -- --
RQR9 0.996 0.048 0.05 -- -- --
VSL
RQR3 1.056 0.022 1.34 1.051 -- -- 1.197 1.005 0.021 0.12
RQR5 1.016 0.016 0.53 -- -- -- Same as non-corrected
RQR6 1.018 0.015 0.60 -- -- -- Same as non-corrected
RQR8 1.018 0.015 0.60 0.988 -- -- 1.139 1.030 0.016 0.97
RQR9 1.017 0.021 0.42 0.984 -- -- 1.194 1.034 0.021 0.81
NR
PA
RQR3
RQR5 0.986 0.023 0.29 -- -- --
RQR6 Same as non-corrected
RQR8 1.002 0.024 0.04 -- -- --
RQR9 0.997 0.028 0.05 -- -- --
NIO
M
RQR3 1.041 0.037 0.56 -- -- --
RQR5 1.022 0.033 0.33 -- -- --
RQR6 1.020 0.033 0.31 -- -- -- Same as non-corrected
RQR8 1.016 0.032 0.25 -- -- --
RQR9 1.003 0.035 0.04 -- -- --
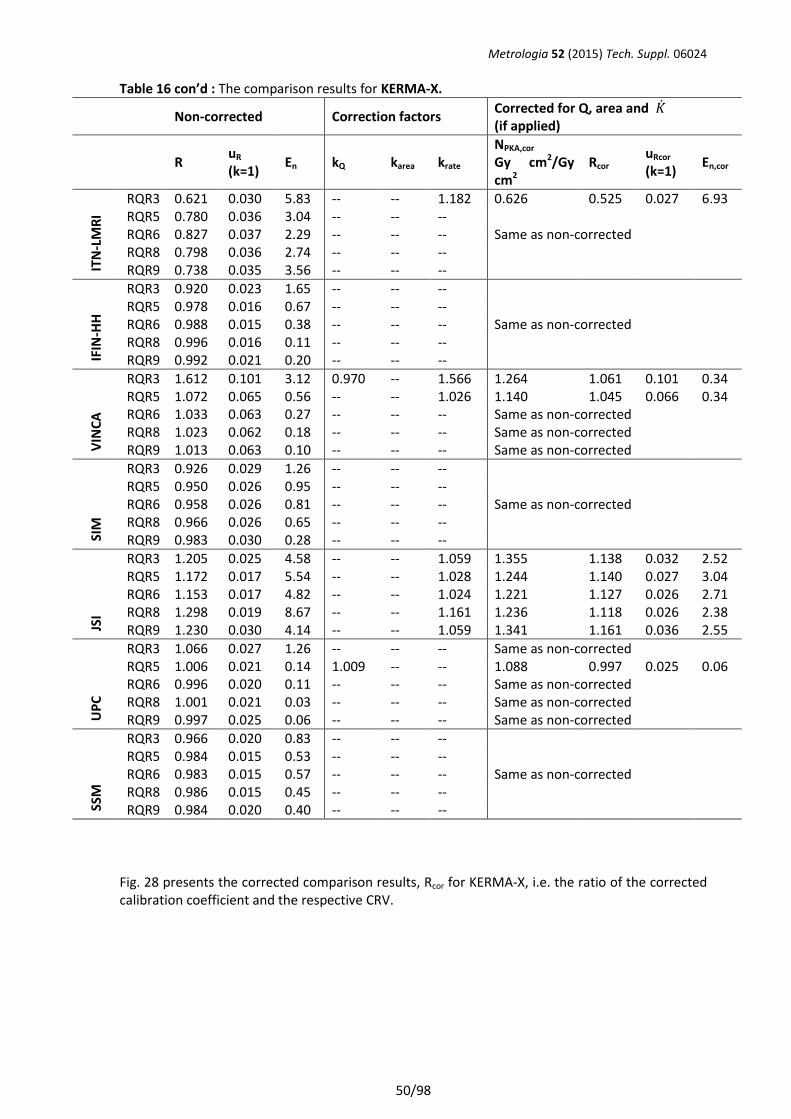
Metrologia 52 (2015) Tech. Suppl. 06024
50/98
Table 16 con’d : The comparison results for KERMA-X. Non-corrected Correction factors
Corrected for Q, area and �̇� (if applied)
R uR (k=1)
En kQ karea krate NPKA,cor Gy cm2/Gy cm2
Rcor uRcor
(k=1) En,cor
ITN
-LM
RI
RQR3 0.621 0.030 5.83 -- -- 1.182 0.626 0.525 0.027 6.93 RQR5 0.780 0.036 3.04 -- -- -- RQR6 0.827 0.037 2.29 -- -- -- Same as non-corrected RQR8 0.798 0.036 2.74 -- -- -- RQR9 0.738 0.035 3.56 -- -- --
IFIN
-HH
RQR3 0.920 0.023 1.65 -- -- -- RQR5 0.978 0.016 0.67 -- -- -- RQR6 0.988 0.015 0.38 -- -- -- Same as non-corrected RQR8 0.996 0.016 0.11 -- -- -- RQR9 0.992 0.021 0.20 -- -- --
VIN
CA
RQR3 1.612 0.101 3.12 0.970 -- 1.566 1.264 1.061 0.101 0.34 RQR5 1.072 0.065 0.56 -- -- 1.026 1.140 1.045 0.066 0.34 RQR6 1.033 0.063 0.27 -- -- -- Same as non-corrected RQR8 1.023 0.062 0.18 -- -- -- Same as non-corrected RQR9 1.013 0.063 0.10 -- -- -- Same as non-corrected
SIM
RQR3 0.926 0.029 1.26 -- -- -- RQR5 0.950 0.026 0.95 -- -- -- RQR6 0.958 0.026 0.81 -- -- -- Same as non-corrected RQR8 0.966 0.026 0.65 -- -- -- RQR9 0.983 0.030 0.28 -- -- --
JSI
RQR3 1.205 0.025 4.58 -- -- 1.059 1.355 1.138 0.032 2.52 RQR5 1.172 0.017 5.54 -- -- 1.028 1.244 1.140 0.027 3.04 RQR6 1.153 0.017 4.82 -- -- 1.024 1.221 1.127 0.026 2.71 RQR8 1.298 0.019 8.67 -- -- 1.161 1.236 1.118 0.026 2.38 RQR9 1.230 0.030 4.14 -- -- 1.059 1.341 1.161 0.036 2.55
UP
C
RQR3 1.066 0.027 1.26 -- -- -- Same as non-corrected RQR5 1.006 0.021 0.14 1.009 -- -- 1.088 0.997 0.025 0.06 RQR6 0.996 0.020 0.11 -- -- -- Same as non-corrected RQR8 1.001 0.021 0.03 -- -- -- Same as non-corrected RQR9 0.997 0.025 0.06 -- -- -- Same as non-corrected
SSM
RQR3 0.966 0.020 0.83 -- -- -- RQR5 0.984 0.015 0.53 -- -- -- RQR6 0.983 0.015 0.57 -- -- -- Same as non-corrected RQR8 0.986 0.015 0.45 -- -- -- RQR9 0.984 0.020 0.40 -- -- --
Fig. 28 presents the corrected comparison results, Rcor for KERMA-X, i.e. the ratio of the corrected calibration coefficient and the respective CRV.
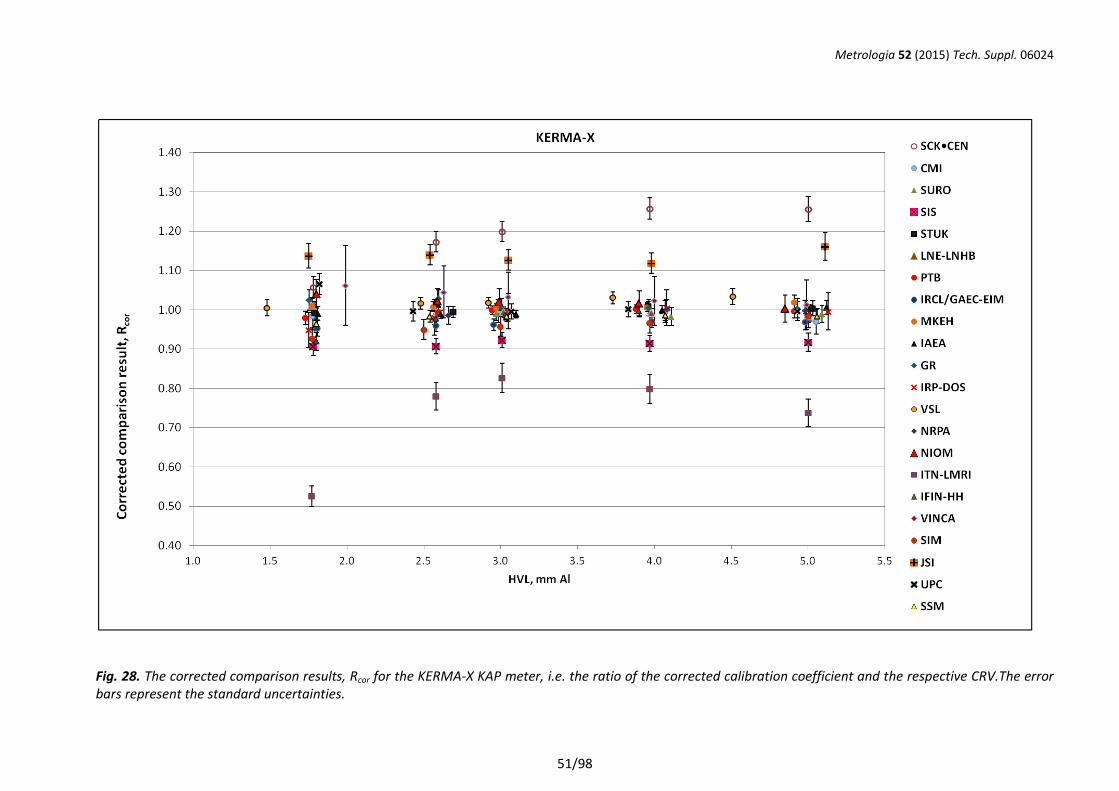
Metrologia 52 (2015) Tech. Suppl. 06024
51/98
Fig. 28. The corrected comparison results, Rcor for the KERMA-X KAP meter, i.e. the ratio of the corrected calibration coefficient and the respective CRV.The error bars represent the standard uncertainties.
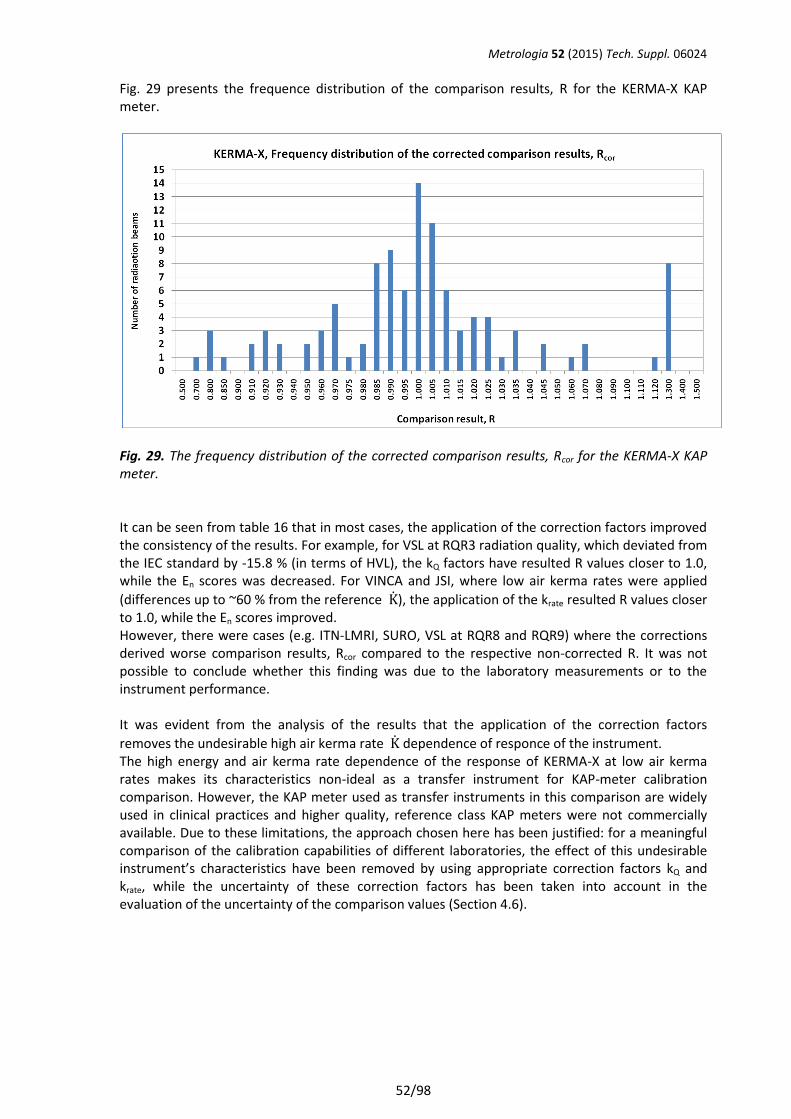
Metrologia 52 (2015) Tech. Suppl. 06024
52/98
Fig. 29 presents the frequence distribution of the comparison results, R for the KERMA-X KAP meter.
Fig. 29. The frequency distribution of the corrected comparison results, Rcor for the KERMA-X KAP meter. It can be seen from table 16 that in most cases, the application of the correction factors improved the consistency of the results. For example, for VSL at RQR3 radiation quality, which deviated from the IEC standard by -15.8 % (in terms of HVL), the kQ factors have resulted R values closer to 1.0, while the En scores was decreased. For VINCA and JSI, where low air kerma rates were applied
(differences up to ~60 % from the reference K̇), the application of the krate resulted R values closer to 1.0, while the En scores improved. However, there were cases (e.g. ITN-LMRI, SURO, VSL at RQR8 and RQR9) where the corrections derived worse comparison results, Rcor compared to the respective non-corrected R. It was not possible to conclude whether this finding was due to the laboratory measurements or to the instrument performance. It was evident from the analysis of the results that the application of the correction factors
removes the undesirable high air kerma rate K̇ dependence of responce of the instrument. The high energy and air kerma rate dependence of the response of KERMA-X at low air kerma rates makes its characteristics non-ideal as a transfer instrument for KAP-meter calibration comparison. However, the KAP meter used as transfer instruments in this comparison are widely used in clinical practices and higher quality, reference class KAP meters were not commercially available. Due to these limitations, the approach chosen here has been justified: for a meaningful comparison of the calibration capabilities of different laboratories, the effect of this undesirable instrument’s characteristics have been removed by using appropriate correction factors kQ and krate, while the uncertainty of these correction factors has been taken into account in the evaluation of the uncertainty of the comparison values (Section 4.6).
Metrologia 52 (2015) Tech. Suppl. 06024
53/98
4.4.2. Comparison results of the PDC KAP meter Table 17 presents the comparison results of PDC. The first three (left side) columns of Table 17 give the non-corrected comparison result, R (ratio of reported calibration coefficient and CRV) and its standard uncertainty, uR, for PDC, as well as the En scores for the non-corrected results. The rest of the columns indicate: kQ, karea & krate : correction factors for energy, irradiation area and air kerma rate that were applied to the reported calibration coefficients, NPKA NPKA,cor : calibration coefficient corrected for energy, irradiation area and air kerma rate, i.e NPKA,cor = NPKA · kQ · karea · krate Rcor : comparison result (ratio of corrected calibration coefficient and CRV), corrected for energy, irradiation area and air kerma rate uRcor : standard uncertainty of the Rcor En,cor : score using the results corrected for energy, irradiation area and air kerma rate The results are presented in alphabetic order of the laboratories’ codes used in this report.
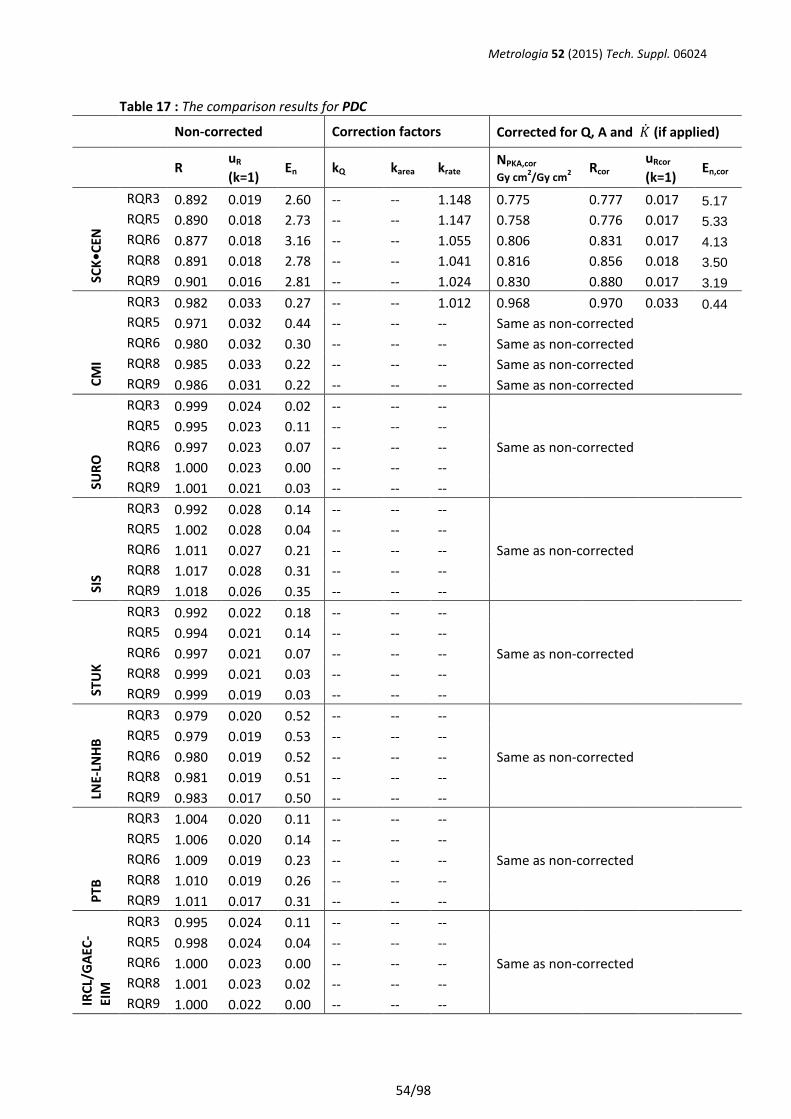
Metrologia 52 (2015) Tech. Suppl. 06024
54/98
Table 17 : The comparison results for PDC
Non-corrected Correction factors Corrected for Q, A and �̇� (if applied)
R uR
(k=1) En kQ karea krate
NPKA,cor Gy cm
2/Gy cm
2 Rcor
uRcor
(k=1) En,cor
SCK
•CEN
RQR3 0.892 0.019 2.60 -- -- 1.148 0.775 0.777 0.017 5.17
RQR5 0.890 0.018 2.73 -- -- 1.147 0.758 0.776 0.017 5.33
RQR6 0.877 0.018 3.16 -- -- 1.055 0.806 0.831 0.017 4.13
RQR8 0.891 0.018 2.78 -- -- 1.041 0.816 0.856 0.018 3.50
RQR9 0.901 0.016 2.81 -- -- 1.024 0.830 0.880 0.017 3.19
CM
I
RQR3 0.982 0.033 0.27 -- -- 1.012 0.968 0.970 0.033 0.44
RQR5 0.971 0.032 0.44 -- -- -- Same as non-corrected
RQR6 0.980 0.032 0.30 -- -- -- Same as non-corrected
RQR8 0.985 0.033 0.22 -- -- -- Same as non-corrected
RQR9 0.986 0.031 0.22 -- -- -- Same as non-corrected
SUR
O
RQR3 0.999 0.024 0.02 -- -- --
RQR5 0.995 0.023 0.11 -- -- --
RQR6 0.997 0.023 0.07 -- -- -- Same as non-corrected
RQR8 1.000 0.023 0.00 -- -- --
RQR9 1.001 0.021 0.03 -- -- --
SIS
RQR3 0.992 0.028 0.14 -- -- --
RQR5 1.002 0.028 0.04 -- -- --
RQR6 1.011 0.027 0.21 -- -- -- Same as non-corrected
RQR8 1.017 0.028 0.31 -- -- --
RQR9 1.018 0.026 0.35 -- -- --
STU
K
RQR3 0.992 0.022 0.18 -- -- --
RQR5 0.994 0.021 0.14 -- -- --
RQR6 0.997 0.021 0.07 -- -- -- Same as non-corrected
RQR8 0.999 0.021 0.03 -- -- --
RQR9 0.999 0.019 0.03 -- -- --
LNE-
LNH
B
RQR3 0.979 0.020 0.52 -- -- --
RQR5 0.979 0.019 0.53 -- -- --
RQR6 0.980 0.019 0.52 -- -- -- Same as non-corrected
RQR8 0.981 0.019 0.51 -- -- --
RQR9 0.983 0.017 0.50 -- -- --
PTB
RQR3 1.004 0.020 0.11 -- -- --
RQR5 1.006 0.020 0.14 -- -- --
RQR6 1.009 0.019 0.23 -- -- -- Same as non-corrected
RQR8 1.010 0.019 0.26 -- -- --
RQR9 1.011 0.017 0.31 -- -- --
IRC
L/G
AEC
-EI
M
RQR3 0.995 0.024 0.11 -- -- --
RQR5 0.998 0.024 0.04 -- -- --
RQR6 1.000 0.023 0.00 -- -- -- Same as non-corrected
RQR8 1.001 0.023 0.02 -- -- --
RQR9 1.000 0.022 0.00 -- -- --
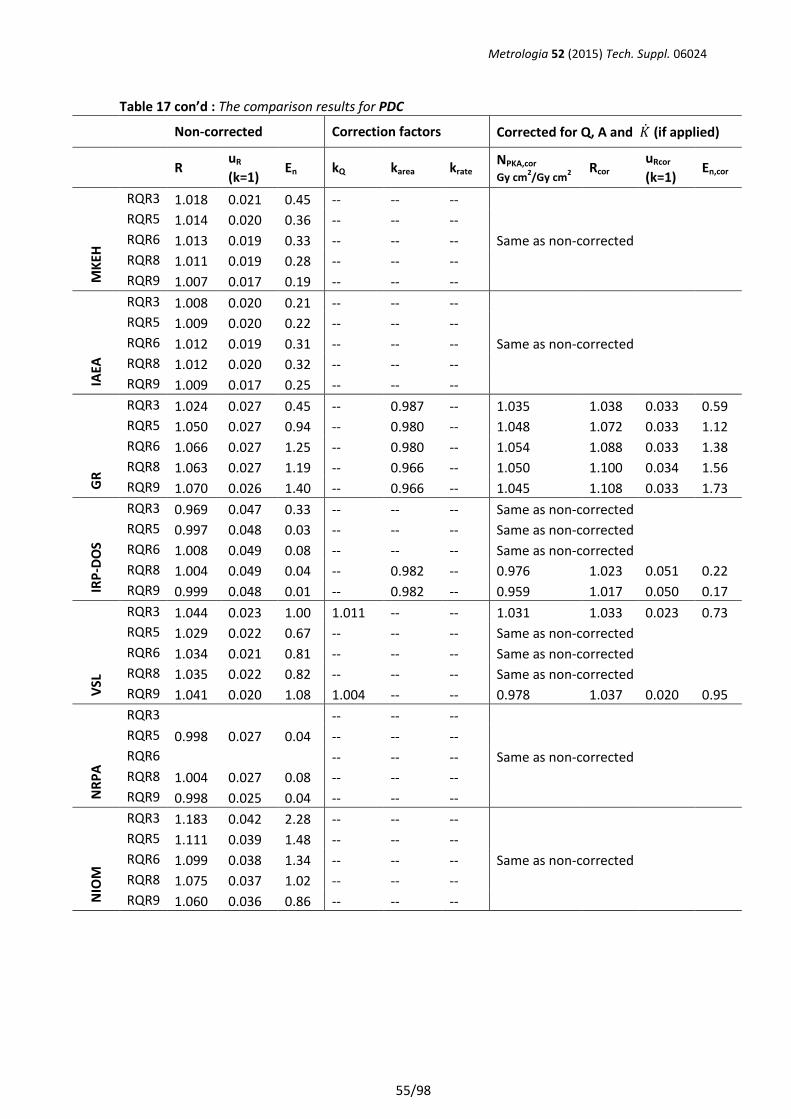
Metrologia 52 (2015) Tech. Suppl. 06024
55/98
Table 17 con’d : The comparison results for PDC
Non-corrected Correction factors Corrected for Q, A and �̇� (if applied)
R uR
(k=1) En kQ karea krate
NPKA,cor Gy cm
2/Gy cm
2 Rcor
uRcor
(k=1) En,cor
MK
EH
RQR3 1.018 0.021 0.45 -- -- --
RQR5 1.014 0.020 0.36 -- -- --
RQR6 1.013 0.019 0.33 -- -- -- Same as non-corrected
RQR8 1.011 0.019 0.28 -- -- --
RQR9 1.007 0.017 0.19 -- -- --
IAEA
RQR3 1.008 0.020 0.21 -- -- --
RQR5 1.009 0.020 0.22 -- -- --
RQR6 1.012 0.019 0.31 -- -- -- Same as non-corrected
RQR8 1.012 0.020 0.32 -- -- --
RQR9 1.009 0.017 0.25 -- -- --
GR
RQR3 1.024 0.027 0.45 -- 0.987 -- 1.035 1.038 0.033 0.59
RQR5 1.050 0.027 0.94 -- 0.980 -- 1.048 1.072 0.033 1.12
RQR6 1.066 0.027 1.25 -- 0.980 -- 1.054 1.088 0.033 1.38
RQR8 1.063 0.027 1.19 -- 0.966 -- 1.050 1.100 0.034 1.56
RQR9 1.070 0.026 1.40 -- 0.966 -- 1.045 1.108 0.033 1.73
IRP
-DO
S
RQR3 0.969 0.047 0.33 -- -- -- Same as non-corrected
RQR5 0.997 0.048 0.03 -- -- -- Same as non-corrected
RQR6 1.008 0.049 0.08 -- -- -- Same as non-corrected
RQR8 1.004 0.049 0.04 -- 0.982 -- 0.976 1.023 0.051 0.22
RQR9 0.999 0.048 0.01 -- 0.982 -- 0.959 1.017 0.050 0.17
VSL
RQR3 1.044 0.023 1.00 1.011 -- -- 1.031 1.033 0.023 0.73
RQR5 1.029 0.022 0.67 -- -- -- Same as non-corrected
RQR6 1.034 0.021 0.81 -- -- -- Same as non-corrected
RQR8 1.035 0.022 0.82 -- -- -- Same as non-corrected
RQR9 1.041 0.020 1.08 1.004 -- -- 0.978 1.037 0.020 0.95
NR
PA
RQR3 -- -- --
RQR5 0.998 0.027 0.04 -- -- --
RQR6 -- -- -- Same as non-corrected
RQR8 1.004 0.027 0.08 -- -- --
RQR9 0.998 0.025 0.04 -- -- --
NIO
M
RQR3 1.183 0.042 2.28 -- -- --
RQR5 1.111 0.039 1.48 -- -- --
RQR6 1.099 0.038 1.34 -- -- -- Same as non-corrected
RQR8 1.075 0.037 1.02 -- -- --
RQR9 1.060 0.036 0.86 -- -- --
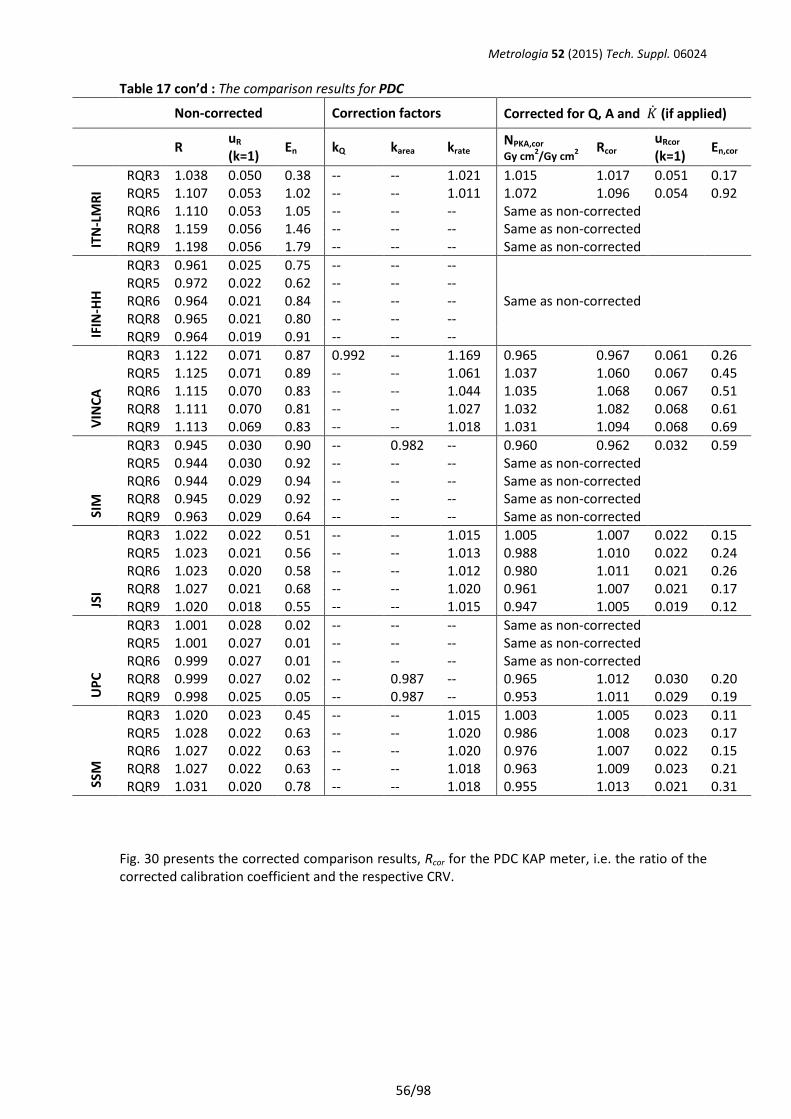
Metrologia 52 (2015) Tech. Suppl. 06024
56/98
Table 17 con’d : The comparison results for PDC Non-corrected Correction factors Corrected for Q, A and �̇� (if applied)
R uR (k=1)
En kQ karea krate NPKA,cor Gy cm
2/Gy cm
2 Rcor
uRcor
(k=1) En,cor
ITN
-LM
RI
RQR3 1.038 0.050 0.38 -- -- 1.021 1.015 1.017 0.051 0.17 RQR5 1.107 0.053 1.02 -- -- 1.011 1.072 1.096 0.054 0.92 RQR6 1.110 0.053 1.05 -- -- -- Same as non-corrected RQR8 1.159 0.056 1.46 -- -- -- Same as non-corrected RQR9 1.198 0.056 1.79 -- -- -- Same as non-corrected
IFIN
-HH
RQR3 0.961 0.025 0.75 -- -- -- RQR5 0.972 0.022 0.62 -- -- -- RQR6 0.964 0.021 0.84 -- -- -- Same as non-corrected RQR8 0.965 0.021 0.80 -- -- -- RQR9 0.964 0.019 0.91 -- -- --
VIN
CA
RQR3 1.122 0.071 0.87 0.992 -- 1.169 0.965 0.967 0.061 0.26 RQR5 1.125 0.071 0.89 -- -- 1.061 1.037 1.060 0.067 0.45 RQR6 1.115 0.070 0.83 -- -- 1.044 1.035 1.068 0.067 0.51 RQR8 1.111 0.070 0.81 -- -- 1.027 1.032 1.082 0.068 0.61 RQR9 1.113 0.069 0.83 -- -- 1.018 1.031 1.094 0.068 0.69
SIM
RQR3 0.945 0.030 0.90 -- 0.982 -- 0.960 0.962 0.032 0.59 RQR5 0.944 0.030 0.92 -- -- -- Same as non-corrected RQR6 0.944 0.029 0.94 -- -- -- Same as non-corrected RQR8 0.945 0.029 0.92 -- -- -- Same as non-corrected RQR9 0.963 0.029 0.64 -- -- -- Same as non-corrected
JSI
RQR3 1.022 0.022 0.51 -- -- 1.015 1.005 1.007 0.022 0.15 RQR5 1.023 0.021 0.56 -- -- 1.013 0.988 1.010 0.022 0.24 RQR6 1.023 0.020 0.58 -- -- 1.012 0.980 1.011 0.021 0.26 RQR8 1.027 0.021 0.68 -- -- 1.020 0.961 1.007 0.021 0.17 RQR9 1.020 0.018 0.55 -- -- 1.015 0.947 1.005 0.019 0.12
UP
C
RQR3 1.001 0.028 0.02 -- -- -- Same as non-corrected RQR5 1.001 0.027 0.01 -- -- -- Same as non-corrected RQR6 0.999 0.027 0.01 -- -- -- Same as non-corrected RQR8 0.999 0.027 0.02 -- 0.987 -- 0.965 1.012 0.030 0.20 RQR9 0.998 0.025 0.05 -- 0.987 -- 0.953 1.011 0.029 0.19
SSM
RQR3 1.020 0.023 0.45 -- -- 1.015 1.003 1.005 0.023 0.11 RQR5 1.028 0.022 0.63 -- -- 1.020 0.986 1.008 0.023 0.17 RQR6 1.027 0.022 0.63 -- -- 1.020 0.976 1.007 0.022 0.15 RQR8 1.027 0.022 0.63 -- -- 1.018 0.963 1.009 0.023 0.21 RQR9 1.031 0.020 0.78 -- -- 1.018 0.955 1.013 0.021 0.31
Fig. 30 presents the corrected comparison results, Rcor for the PDC KAP meter, i.e. the ratio of the corrected calibration coefficient and the respective CRV.
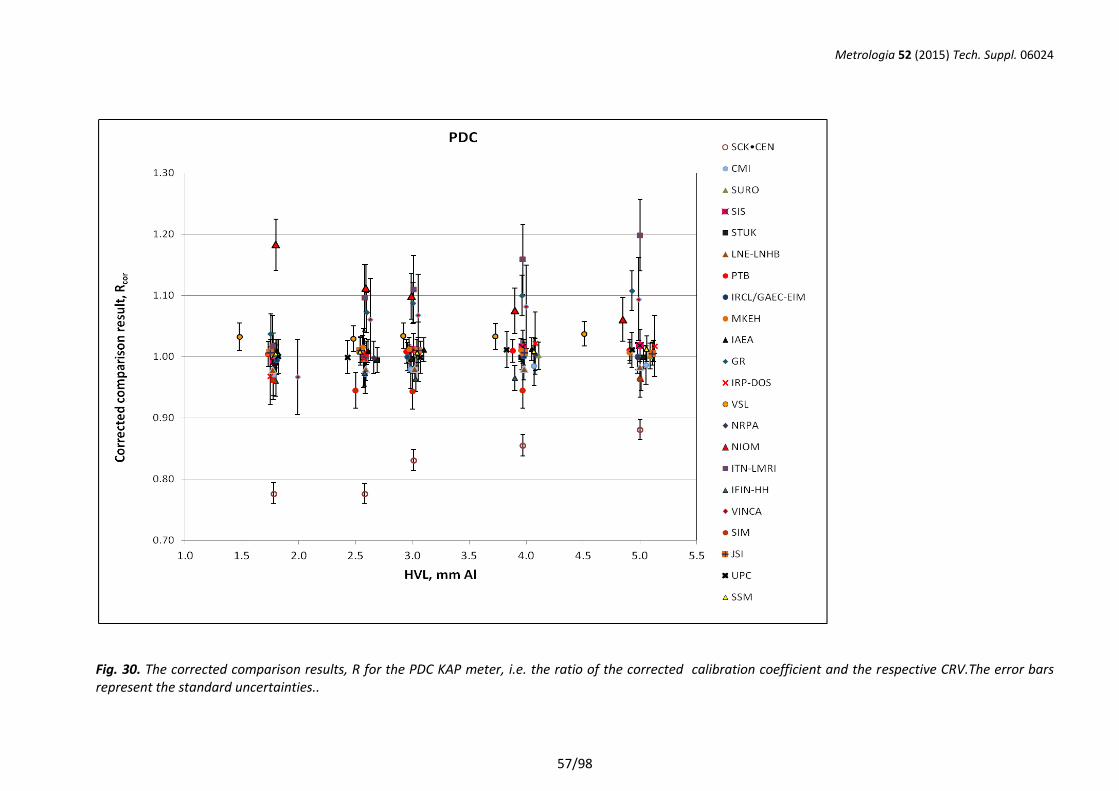
Metrologia 52 (2015) Tech. Suppl. 06024
57/98
Fig. 30. The corrected comparison results, R for the PDC KAP meter, i.e. the ratio of the corrected calibration coefficient and the respective CRV.The error bars represent the standard uncertainties..
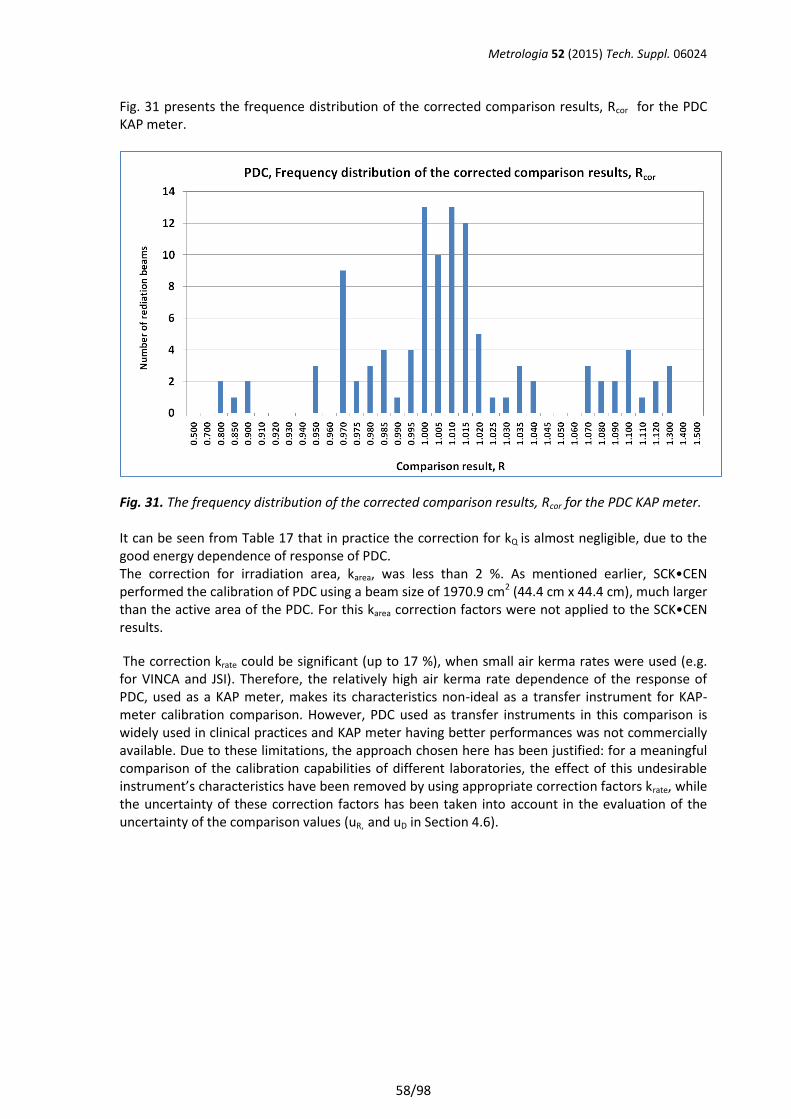
Metrologia 52 (2015) Tech. Suppl. 06024
58/98
Fig. 31 presents the frequence distribution of the corrected comparison results, Rcor for the PDC KAP meter.
Fig. 31. The frequency distribution of the corrected comparison results, Rcor for the PDC KAP meter. It can be seen from Table 17 that in practice the correction for kQ is almost negligible, due to the good energy dependence of response of PDC. The correction for irradiation area, karea, was less than 2 %. As mentioned earlier, SCK•CEN performed the calibration of PDC using a beam size of 1970.9 cm2 (44.4 cm x 44.4 cm), much larger than the active area of the PDC. For this karea correction factors were not applied to the SCK•CEN results.
The correction krate could be significant (up to 17 %), when small air kerma rates were used (e.g. for VINCA and JSI). Therefore, the relatively high air kerma rate dependence of the response of PDC, used as a KAP meter, makes its characteristics non-ideal as a transfer instrument for KAP-meter calibration comparison. However, PDC used as transfer instruments in this comparison is widely used in clinical practices and KAP meter having better performances was not commercially available. Due to these limitations, the approach chosen here has been justified: for a meaningful comparison of the calibration capabilities of different laboratories, the effect of this undesirable instrument’s characteristics have been removed by using appropriate correction factors krate, while the uncertainty of these correction factors has been taken into account in the evaluation of the uncertainty of the comparison values (uR, and uD in Section 4.6).
Metrologia 52 (2015) Tech. Suppl. 06024
59/98
4.4.3. Comparison results of MAGNA.
Table 18 presents the comparison results of MAGNA.
The first three (left side) columns of Table 18 give the non-corrected comparison result, R (ratio of reported calibration coefficient and CRV) and its standard uncertainty, uR, for MAGNA, as well as the En scores for the non-corrected results.
As discussed in section 4.2.3, correction factors for the energy dependence of response (kQ) of the MAGNA were applied to limited cases, i.e. for VSL (at RQR3) and UPC (at RQR5), while no corrections were applied for the beam size and air kerma rate dependence of response. Table 18 presents the corrected comparison results, Rcor and their standard uncertainty uRcor and the corrected En,cor scores for these laboratories at the respective RQR radiation quality.
The results are presented in alphabetic order of the laboratories’ codes used in this report.
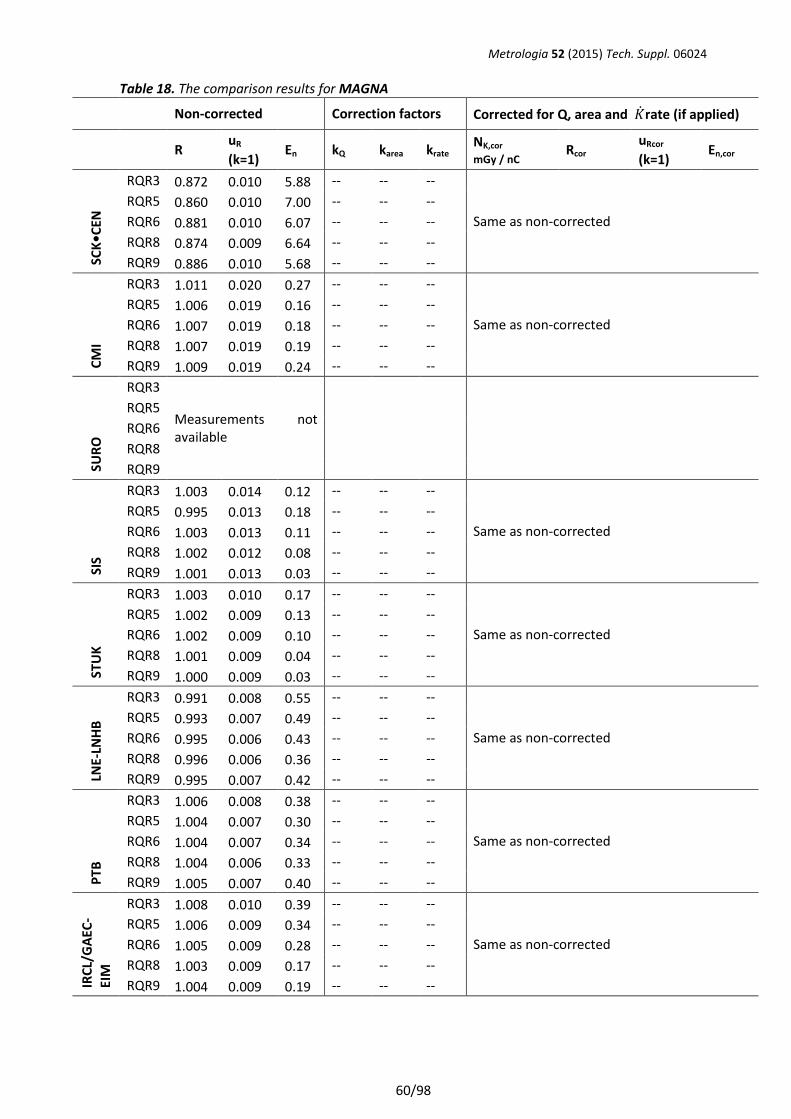
Metrologia 52 (2015) Tech. Suppl. 06024
60/98
Table 18. The comparison results for MAGNA Non-corrected Correction factors Corrected for Q, area and �̇�rate (if applied)
R uR
(k=1) En kQ karea krate
NK,cor mGy / nC
Rcor uRcor
(k=1) En,cor
SCK
•CEN
RQR3 0.872 0.010 5.88 -- -- --
Same as non-corrected
RQR5 0.860 0.010 7.00 -- -- --
RQR6 0.881 0.010 6.07 -- -- --
RQR8 0.874 0.009 6.64 -- -- --
RQR9 0.886 0.010 5.68 -- -- --
CM
I
RQR3 1.011 0.020 0.27 -- -- --
Same as non-corrected
RQR5 1.006 0.019 0.16 -- -- --
RQR6 1.007 0.019 0.18 -- -- --
RQR8 1.007 0.019 0.19 -- -- --
RQR9 1.009 0.019 0.24 -- -- --
SUR
O
RQR3
Measurements not available
RQR5
RQR6
RQR8
RQR9
SIS
RQR3 1.003 0.014 0.12 -- -- --
Same as non-corrected
RQR5 0.995 0.013 0.18 -- -- --
RQR6 1.003 0.013 0.11 -- -- --
RQR8 1.002 0.012 0.08 -- -- --
RQR9 1.001 0.013 0.03 -- -- --
STU
K
RQR3 1.003 0.010 0.17 -- -- --
Same as non-corrected
RQR5 1.002 0.009 0.13 -- -- --
RQR6 1.002 0.009 0.10 -- -- --
RQR8 1.001 0.009 0.04 -- -- --
RQR9 1.000 0.009 0.03 -- -- --
LNE-
LNH
B
RQR3 0.991 0.008 0.55 -- -- --
Same as non-corrected
RQR5 0.993 0.007 0.49 -- -- --
RQR6 0.995 0.006 0.43 -- -- --
RQR8 0.996 0.006 0.36 -- -- --
RQR9 0.995 0.007 0.42 -- -- --
PTB
RQR3 1.006 0.008 0.38 -- -- --
Same as non-corrected
RQR5 1.004 0.007 0.30 -- -- --
RQR6 1.004 0.007 0.34 -- -- --
RQR8 1.004 0.006 0.33 -- -- --
RQR9 1.005 0.007 0.40 -- -- --
IRC
L/G
AEC
-EI
M
RQR3 1.008 0.010 0.39 -- -- --
Same as non-corrected
RQR5 1.006 0.009 0.34 -- -- --
RQR6 1.005 0.009 0.28 -- -- --
RQR8 1.003 0.009 0.17 -- -- --
RQR9 1.004 0.009 0.19 -- -- --
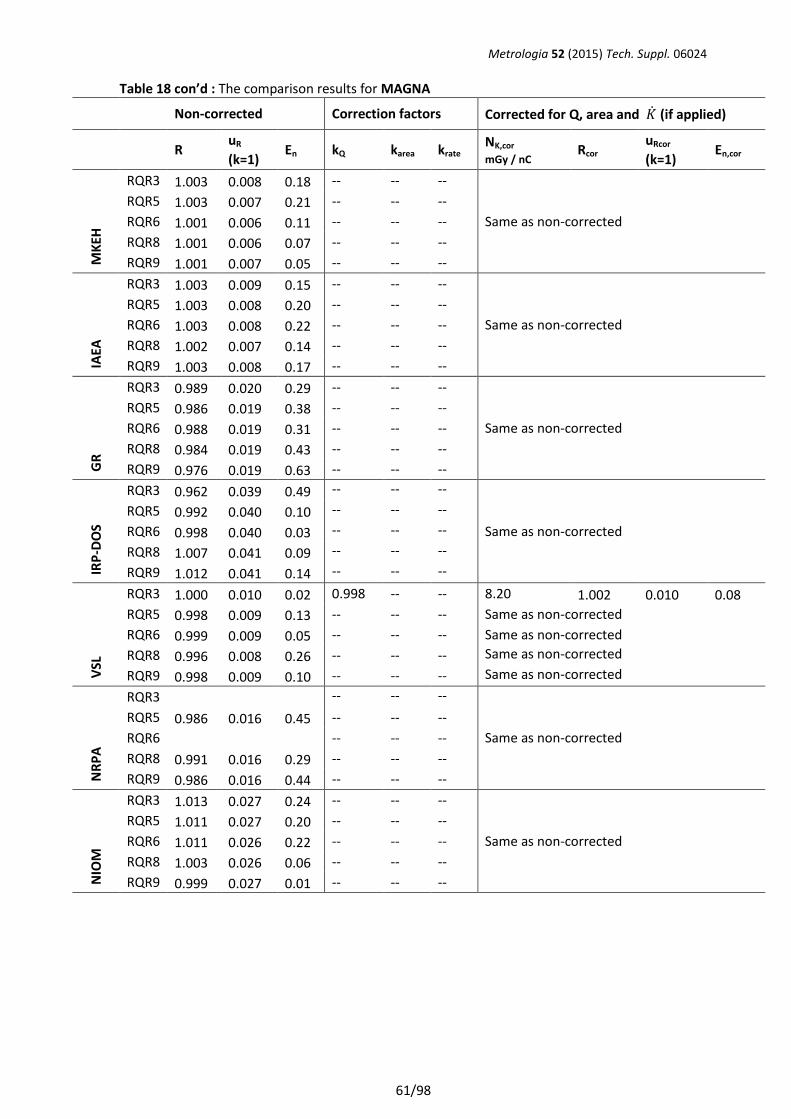
Metrologia 52 (2015) Tech. Suppl. 06024
61/98
Table 18 con’d : The comparison results for MAGNA Non-corrected Correction factors Corrected for Q, area and �̇� (if applied)
R uR
(k=1) En kQ karea krate
NK,cor mGy / nC
Rcor uRcor
(k=1) En,cor
MK
EH
RQR3 1.003 0.008 0.18 -- -- --
Same as non-corrected
RQR5 1.003 0.007 0.21 -- -- --
RQR6 1.001 0.006 0.11 -- -- --
RQR8 1.001 0.006 0.07 -- -- --
RQR9 1.001 0.007 0.05 -- -- --
IAEA
RQR3 1.003 0.009 0.15 -- -- --
Same as non-corrected
RQR5 1.003 0.008 0.20 -- -- --
RQR6 1.003 0.008 0.22 -- -- --
RQR8 1.002 0.007 0.14 -- -- --
RQR9 1.003 0.008 0.17 -- -- --
GR
RQR3 0.989 0.020 0.29 -- -- --
Same as non-corrected
RQR5 0.986 0.019 0.38 -- -- --
RQR6 0.988 0.019 0.31 -- -- --
RQR8 0.984 0.019 0.43 -- -- --
RQR9 0.976 0.019 0.63 -- -- --
IRP
-DO
S
RQR3 0.962 0.039 0.49 -- -- --
Same as non-corrected
RQR5 0.992 0.040 0.10 -- -- --
RQR6 0.998 0.040 0.03 -- -- --
RQR8 1.007 0.041 0.09 -- -- --
RQR9 1.012 0.041 0.14 -- -- --
VSL
RQR3 1.000 0.010 0.02 0.998 -- -- 8.20 1.002 0.010 0.08
RQR5 0.998 0.009 0.13 -- -- -- Same as non-corrected
RQR6 0.999 0.009 0.05 -- -- -- Same as non-corrected
RQR8 0.996 0.008 0.26 -- -- -- Same as non-corrected
RQR9 0.998 0.009 0.10 -- -- -- Same as non-corrected
NR
PA
RQR3 -- -- --
Same as non-corrected
RQR5 0.986 0.016 0.45 -- -- --
RQR6 -- -- --
RQR8 0.991 0.016 0.29 -- -- --
RQR9 0.986 0.016 0.44 -- -- --
NIO
M
RQR3 1.013 0.027 0.24 -- -- --
Same as non-corrected
RQR5 1.011 0.027 0.20 -- -- --
RQR6 1.011 0.026 0.22 -- -- --
RQR8 1.003 0.026 0.06 -- -- --
RQR9 0.999 0.027 0.01 -- -- --
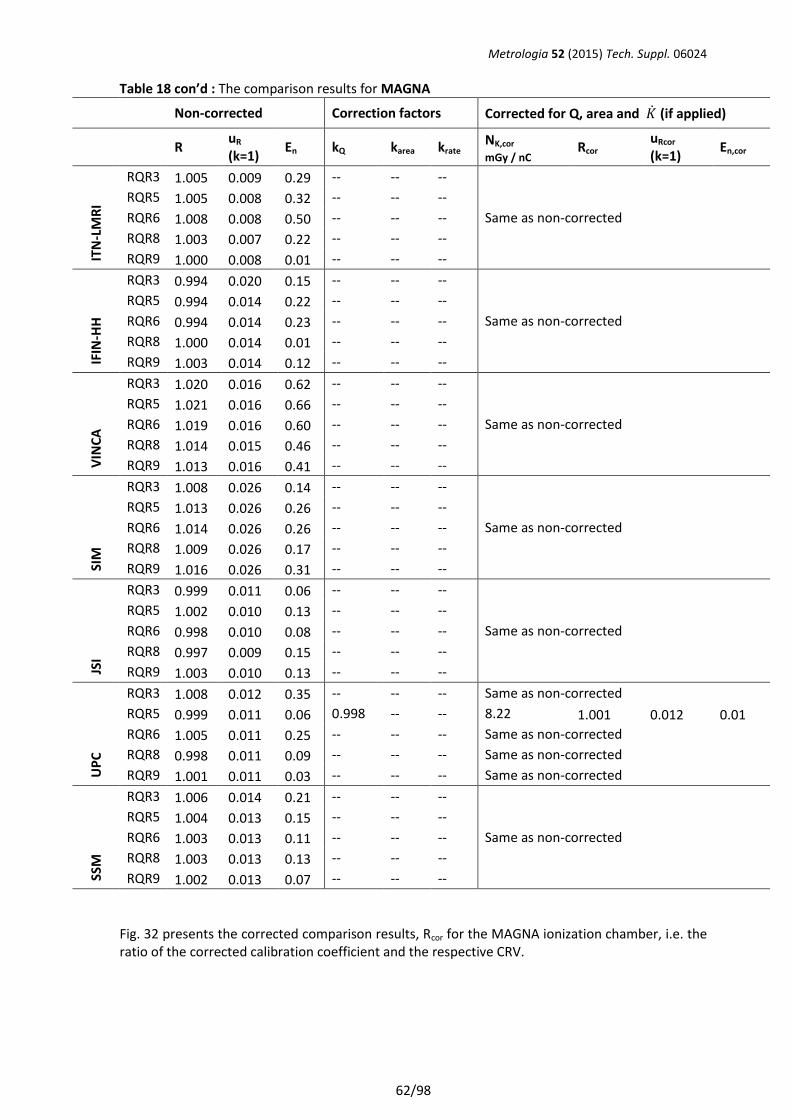
Metrologia 52 (2015) Tech. Suppl. 06024
62/98
Table 18 con’d : The comparison results for MAGNA Non-corrected Correction factors Corrected for Q, area and �̇� (if applied)
R uR (k=1)
En kQ karea krate NK,cor mGy / nC
Rcor uRcor
(k=1) En,cor
ITN
-LM
RI
RQR3 1.005 0.009 0.29 -- -- --
Same as non-corrected
RQR5 1.005 0.008 0.32 -- -- --
RQR6 1.008 0.008 0.50 -- -- --
RQR8 1.003 0.007 0.22 -- -- --
RQR9 1.000 0.008 0.01 -- -- --
IFIN
-HH
RQR3 0.994 0.020 0.15 -- -- --
Same as non-corrected
RQR5 0.994 0.014 0.22 -- -- --
RQR6 0.994 0.014 0.23 -- -- --
RQR8 1.000 0.014 0.01 -- -- --
RQR9 1.003 0.014 0.12 -- -- --
VIN
CA
RQR3 1.020 0.016 0.62 -- -- --
RQR5 1.021 0.016 0.66 -- -- --
RQR6 1.019 0.016 0.60 -- -- -- Same as non-corrected
RQR8 1.014 0.015 0.46 -- -- --
RQR9 1.013 0.016 0.41 -- -- --
SIM
RQR3 1.008 0.026 0.14 -- -- --
Same as non-corrected
RQR5 1.013 0.026 0.26 -- -- --
RQR6 1.014 0.026 0.26 -- -- --
RQR8 1.009 0.026 0.17 -- -- --
RQR9 1.016 0.026 0.31 -- -- --
JSI
RQR3 0.999 0.011 0.06 -- -- --
Same as non-corrected
RQR5 1.002 0.010 0.13 -- -- --
RQR6 0.998 0.010 0.08 -- -- --
RQR8 0.997 0.009 0.15 -- -- --
RQR9 1.003 0.010 0.13 -- -- --
UP
C
RQR3 1.008 0.012 0.35 -- -- -- Same as non-corrected
RQR5 0.999 0.011 0.06 0.998 -- -- 8.22 1.001 0.012 0.01
RQR6 1.005 0.011 0.25 -- -- -- Same as non-corrected
RQR8 0.998 0.011 0.09 -- -- -- Same as non-corrected
RQR9 1.001 0.011 0.03 -- -- -- Same as non-corrected
SSM
RQR3 1.006 0.014 0.21 -- -- --
Same as non-corrected
RQR5 1.004 0.013 0.15 -- -- --
RQR6 1.003 0.013 0.11 -- -- --
RQR8 1.003 0.013 0.13 -- -- --
RQR9 1.002 0.013 0.07 -- -- --
Fig. 32 presents the corrected comparison results, Rcor for the MAGNA ionization chamber, i.e. the ratio of the corrected calibration coefficient and the respective CRV.
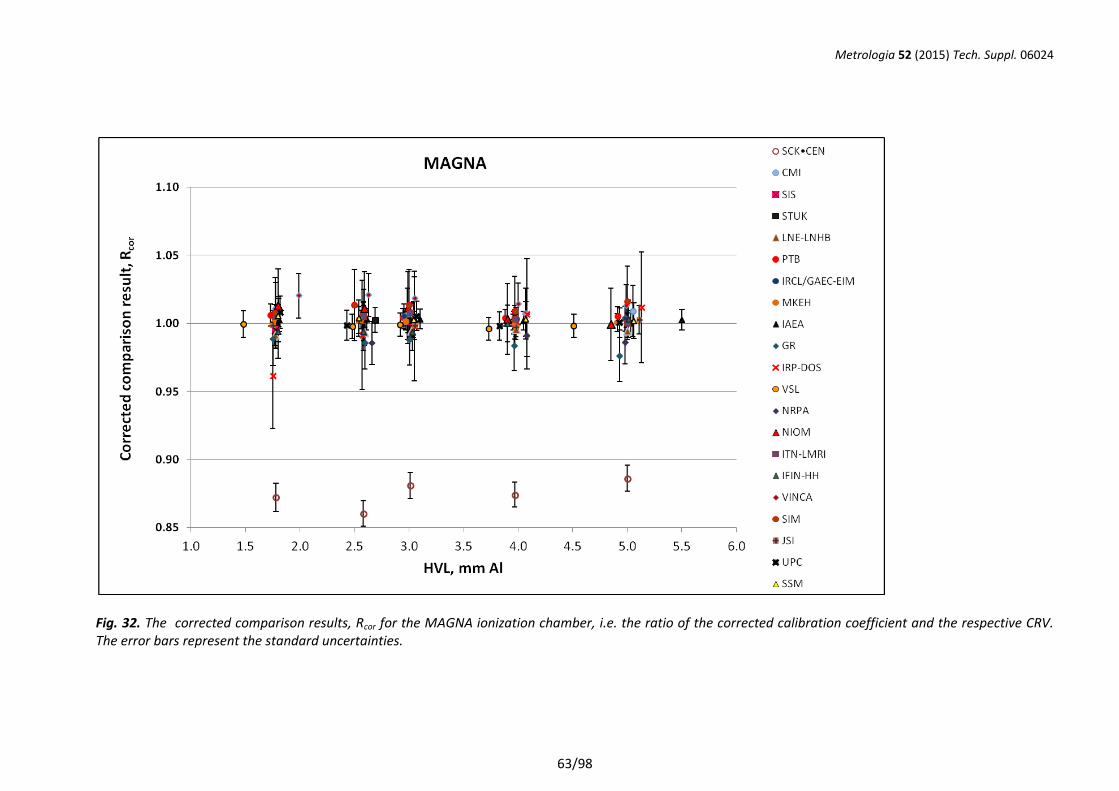
Metrologia 52 (2015) Tech. Suppl. 06024
63/98
Fig. 32. The corrected comparison results, Rcor for the MAGNA ionization chamber, i.e. the ratio of the corrected calibration coefficient and the respective CRV. The error bars represent the standard uncertainties.
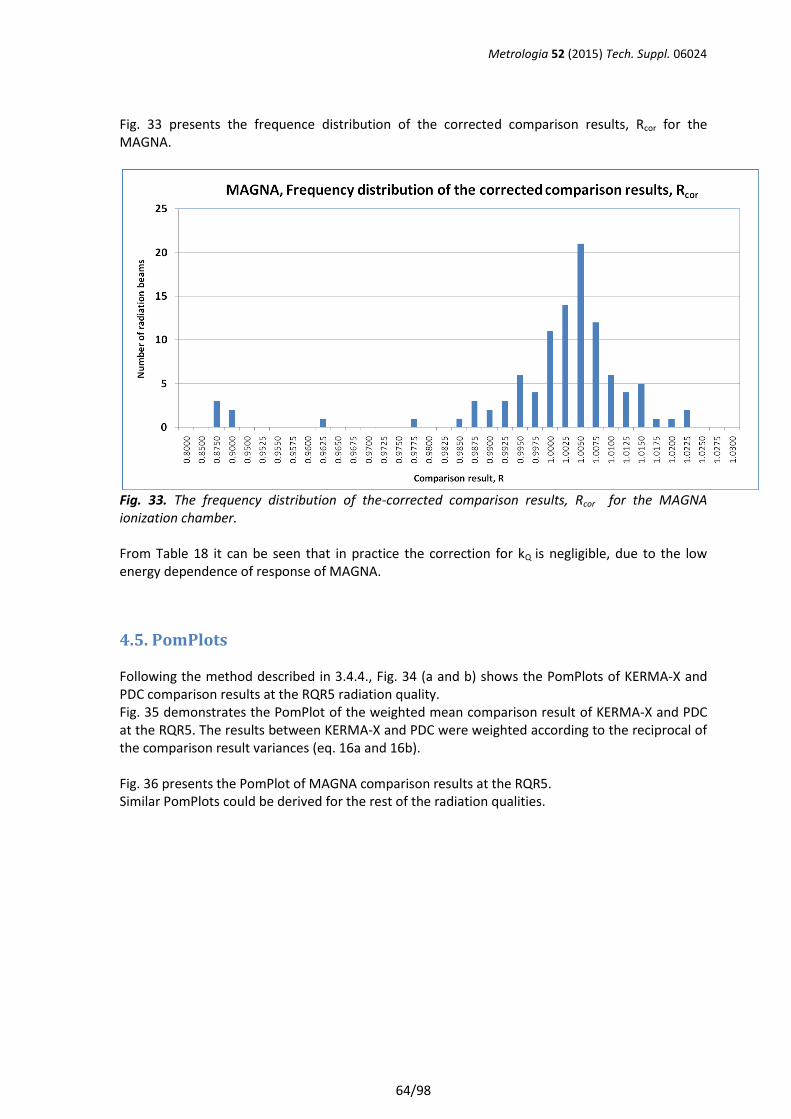
Metrologia 52 (2015) Tech. Suppl. 06024
64/98
Fig. 33 presents the frequence distribution of the corrected comparison results, Rcor for the MAGNA.
Fig. 33. The frequency distribution of the-corrected comparison results, Rcor for the MAGNA ionization chamber. From Table 18 it can be seen that in practice the correction for kQ is negligible, due to the low energy dependence of response of MAGNA.
4.5. PomPlots Following the method described in 3.4.4., Fig. 34 (a and b) shows the PomPlots of KERMA-X and PDC comparison results at the RQR5 radiation quality. Fig. 35 demonstrates the PomPlot of the weighted mean comparison result of KERMA-X and PDC at the RQR5. The results between KERMA-X and PDC were weighted according to the reciprocal of the comparison result variances (eq. 16a and 16b). Fig. 36 presents the PomPlot of MAGNA comparison results at the RQR5. Similar PomPlots could be derived for the rest of the radiation qualities.
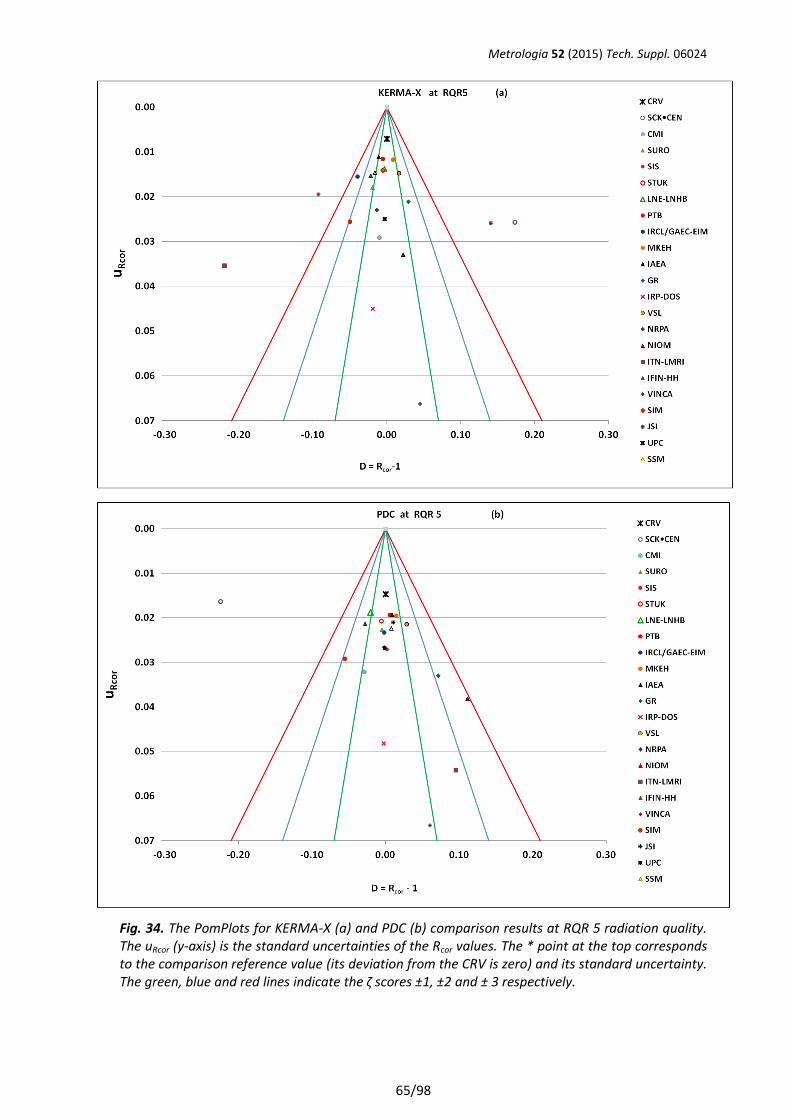
Metrologia 52 (2015) Tech. Suppl. 06024
65/98
Fig. 34. The PomPlots for KERMA-X (a) and PDC (b) comparison results at RQR 5 radiation quality. The uRcor (y-axis) is the standard uncertainties of the Rcor values. The * point at the top corresponds to the comparison reference value (its deviation from the CRV is zero) and its standard uncertainty. The green, blue and red lines indicate the ζ scores ±1, ±2 and ± 3 respectively.
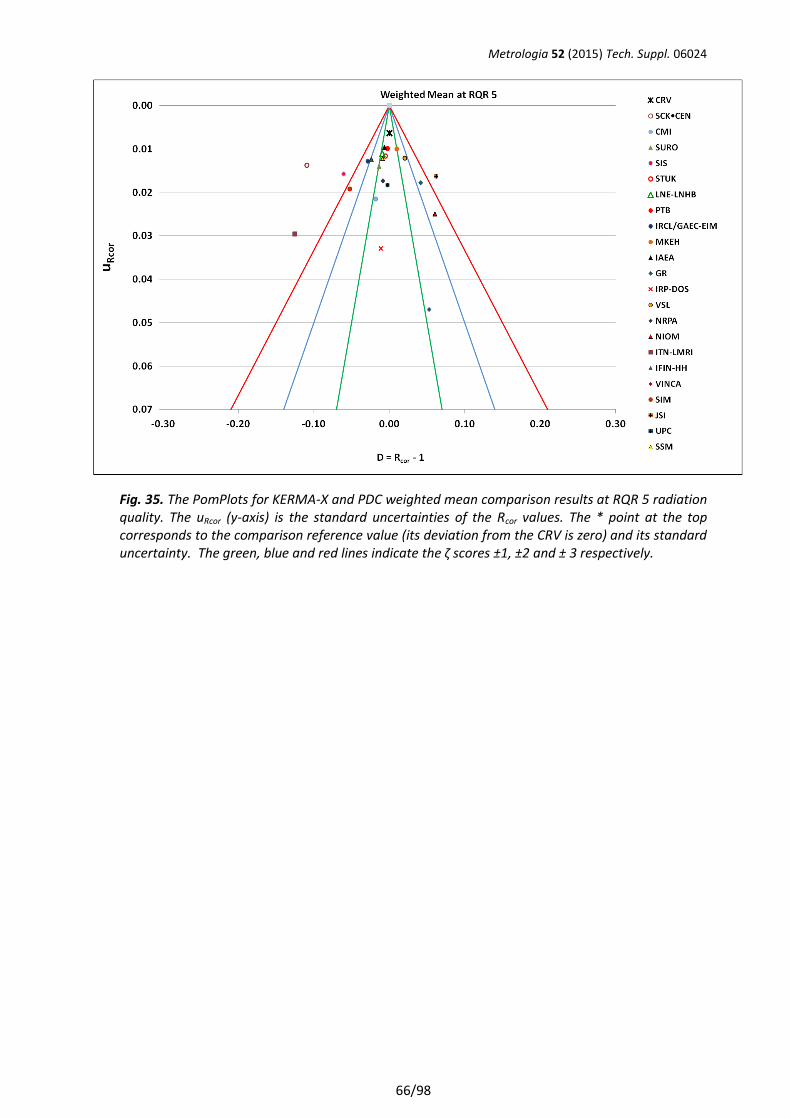
Metrologia 52 (2015) Tech. Suppl. 06024
66/98
Fig. 35. The PomPlots for KERMA-X and PDC weighted mean comparison results at RQR 5 radiation quality. The uRcor (y-axis) is the standard uncertainties of the Rcor values. The * point at the top corresponds to the comparison reference value (its deviation from the CRV is zero) and its standard uncertainty. The green, blue and red lines indicate the ζ scores ±1, ±2 and ± 3 respectively.
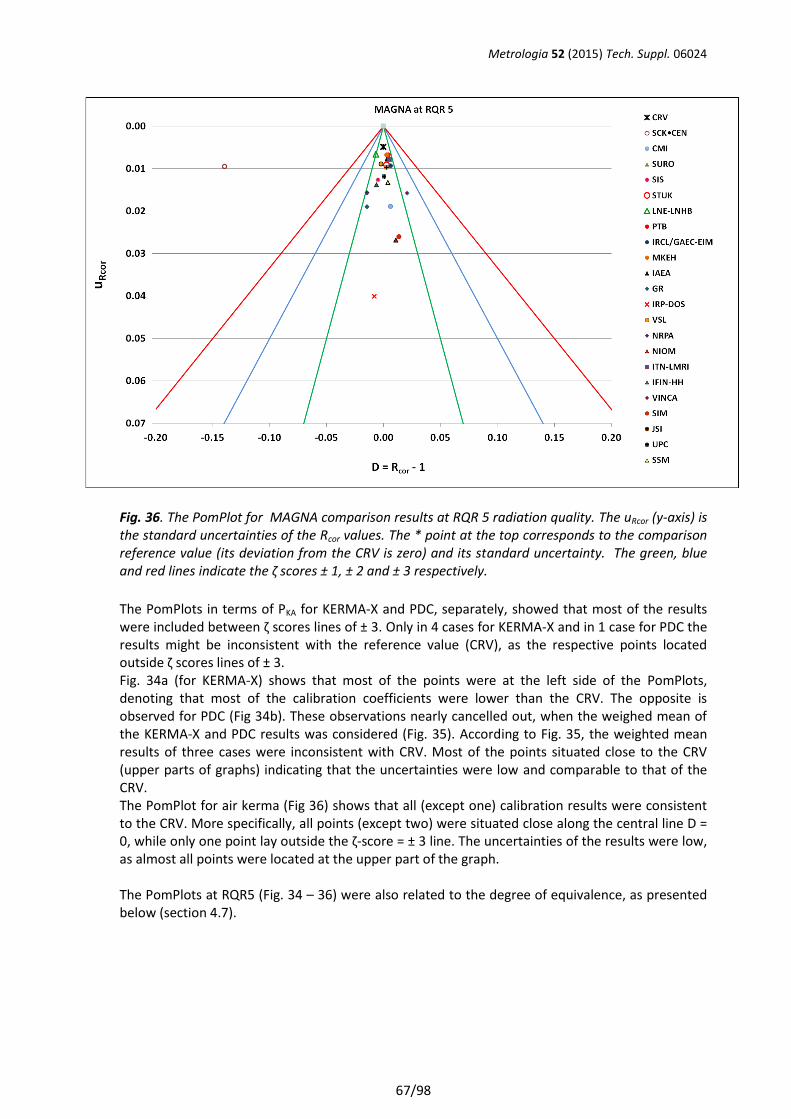
Metrologia 52 (2015) Tech. Suppl. 06024
67/98
Fig. 36. The PomPlot for MAGNA comparison results at RQR 5 radiation quality. The uRcor (y-axis) is the standard uncertainties of the Rcor values. The * point at the top corresponds to the comparison reference value (its deviation from the CRV is zero) and its standard uncertainty. The green, blue and red lines indicate the ζ scores ± 1, ± 2 and ± 3 respectively.
The PomPlots in terms of PKA for KERMA-X and PDC, separately, showed that most of the results were included between ζ scores lines of ± 3. Only in 4 cases for KERMA-X and in 1 case for PDC the results might be inconsistent with the reference value (CRV), as the respective points located outside ζ scores lines of ± 3. Fig. 34a (for KERMA-X) shows that most of the points were at the left side of the PomPlots, denoting that most of the calibration coefficients were lower than the CRV. The opposite is observed for PDC (Fig 34b). These observations nearly cancelled out, when the weighed mean of the KERMA-X and PDC results was considered (Fig. 35). According to Fig. 35, the weighted mean results of three cases were inconsistent with CRV. Most of the points situated close to the CRV (upper parts of graphs) indicating that the uncertainties were low and comparable to that of the CRV. The PomPlot for air kerma (Fig 36) shows that all (except one) calibration results were consistent to the CRV. More specifically, all points (except two) were situated close along the central line D = 0, while only one point lay outside the ζ-score = ± 3 line. The uncertainties of the results were low, as almost all points were located at the upper part of the graph. The PomPlots at RQR5 (Fig. 34 – 36) were also related to the degree of equivalence, as presented below (section 4.7).
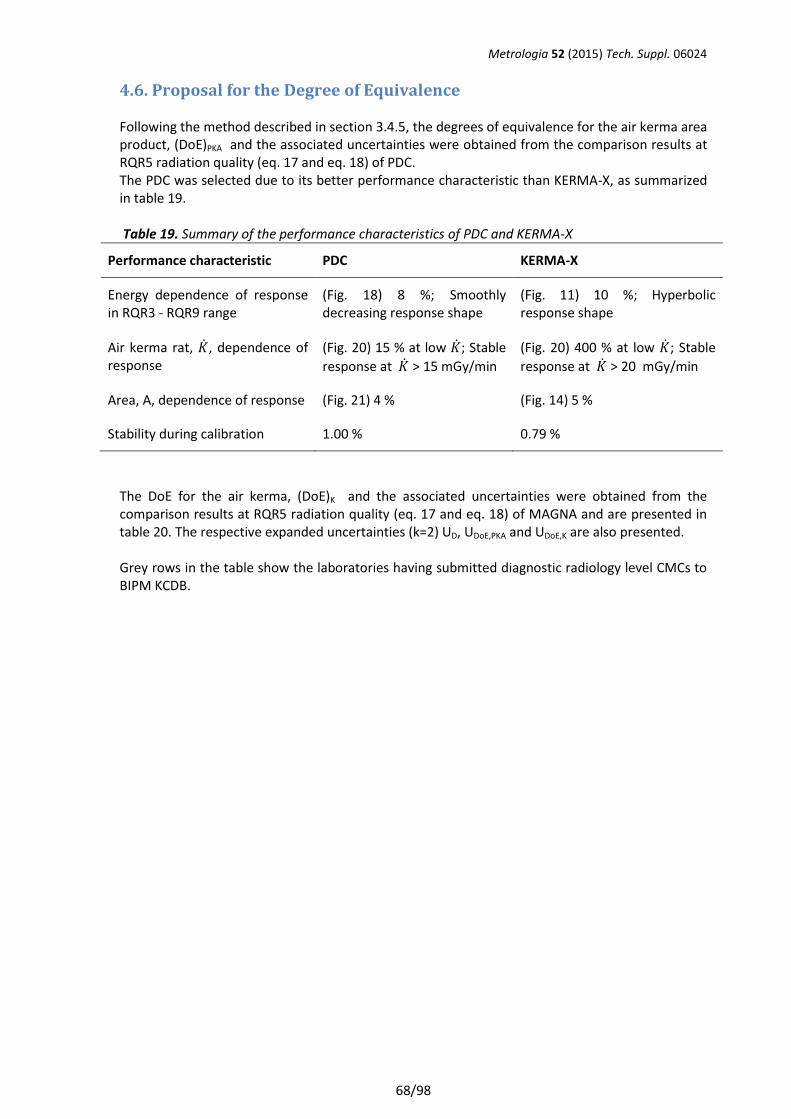
Metrologia 52 (2015) Tech. Suppl. 06024
68/98
4.6. Proposal for the Degree of Equivalence Following the method described in section 3.4.5, the degrees of equivalence for the air kerma area product, (DoE)PKA and the associated uncertainties were obtained from the comparison results at RQR5 radiation quality (eq. 17 and eq. 18) of PDC. The PDC was selected due to its better performance characteristic than KERMA-X, as summarized in table 19. Table 19. Summary of the performance characteristics of PDC and KERMA-X
Performance characteristic PDC KERMA-X
Energy dependence of response in RQR3 - RQR9 range
(Fig. 18) 8 %; Smoothly decreasing response shape
(Fig. 11) 10 %; Hyperbolic response shape
Air kerma rat, �̇�, dependence of response
(Fig. 20) 15 % at low �̇�; Stable
response at �̇� > 15 mGy/min
(Fig. 20) 400 % at low �̇�; Stable
response at �̇� > 20 mGy/min
Area, A, dependence of response (Fig. 21) 4 % (Fig. 14) 5 %
Stability during calibration 1.00 % 0.79 %
The DoE for the air kerma, (DoE)K and the associated uncertainties were obtained from the comparison results at RQR5 radiation quality (eq. 17 and eq. 18) of MAGNA and are presented in table 20. The respective expanded uncertainties (k=2) UD, UDoE,PKA and UDoE,K are also presented. Grey rows in the table show the laboratories having submitted diagnostic radiology level CMCs to BIPM KCDB.
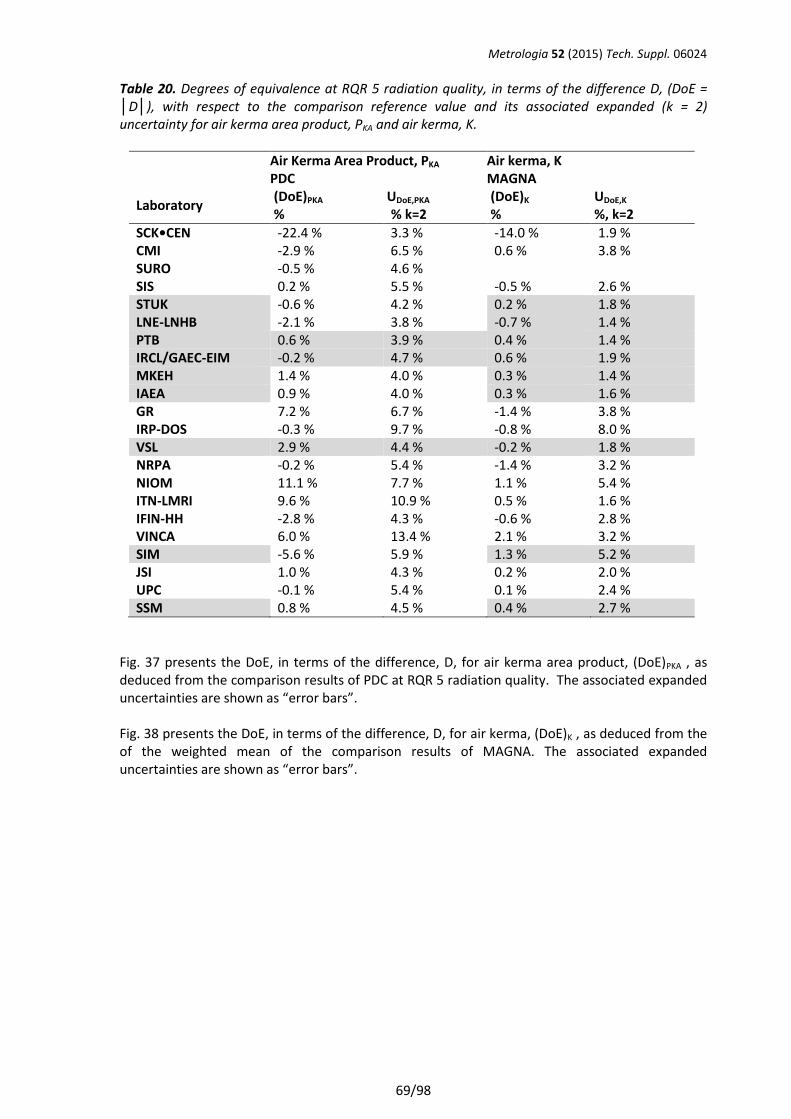
Metrologia 52 (2015) Tech. Suppl. 06024
69/98
Table 20. Degrees of equivalence at RQR 5 radiation quality, in terms of the difference D, (DoE = │D│), with respect to the comparison reference value and its associated expanded (k = 2) uncertainty for air kerma area product, PKA and air kerma, K.
Air Kerma Area Product, PKA PDC
Air kerma, K MAGNA
Laboratory (DoE)PKA %
UDoE,PKA
% k=2 (DoE)K %
UDoE,K
%, k=2
SCK•CEN -22.4 % 3.3 % -14.0 % 1.9 % CMI -2.9 % 6.5 % 0.6 % 3.8 % SURO -0.5 % 4.6 % SIS 0.2 % 5.5 % -0.5 % 2.6 % STUK -0.6 % 4.2 % 0.2 % 1.8 % LNE-LNHB -2.1 % 3.8 % -0.7 % 1.4 % PTB 0.6 % 3.9 % 0.4 % 1.4 % IRCL/GAEC-EIM -0.2 % 4.7 % 0.6 % 1.9 % MKEH 1.4 % 4.0 % 0.3 % 1.4 % IAEA 0.9 % 4.0 % 0.3 % 1.6 % GR 7.2 % 6.7 % -1.4 % 3.8 % IRP-DOS -0.3 % 9.7 % -0.8 % 8.0 % VSL 2.9 % 4.4 % -0.2 % 1.8 % NRPA -0.2 % 5.4 % -1.4 % 3.2 % NIOM 11.1 % 7.7 % 1.1 % 5.4 % ITN-LMRI 9.6 % 10.9 % 0.5 % 1.6 % IFIN-HH -2.8 % 4.3 % -0.6 % 2.8 % VINCA 6.0 % 13.4 % 2.1 % 3.2 % SIM -5.6 % 5.9 % 1.3 % 5.2 % JSI 1.0 % 4.3 % 0.2 % 2.0 % UPC -0.1 % 5.4 % 0.1 % 2.4 % SSM 0.8 % 4.5 % 0.4 % 2.7 %
Fig. 37 presents the DoE, in terms of the difference, D, for air kerma area product, (DoE)PKA , as deduced from the comparison results of PDC at RQR 5 radiation quality. The associated expanded uncertainties are shown as “error bars”. Fig. 38 presents the DoE, in terms of the difference, D, for air kerma, (DoE)K , as deduced from the of the weighted mean of the comparison results of MAGNA. The associated expanded uncertainties are shown as “error bars”.
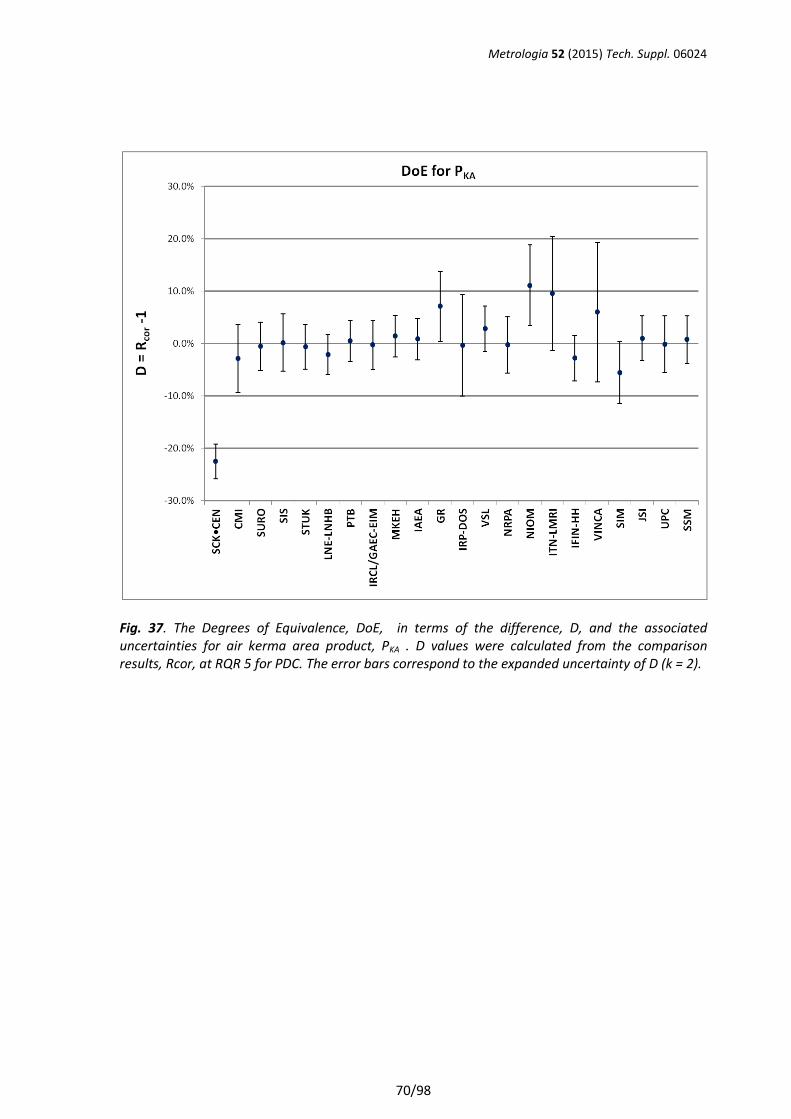
Metrologia 52 (2015) Tech. Suppl. 06024
70/98
Fig. 37. The Degrees of Equivalence, DoE, in terms of the difference, D, and the associated uncertainties for air kerma area product, PKA . D values were calculated from the comparison results, Rcor, at RQR 5 for PDC. The error bars correspond to the expanded uncertainty of D (k = 2).
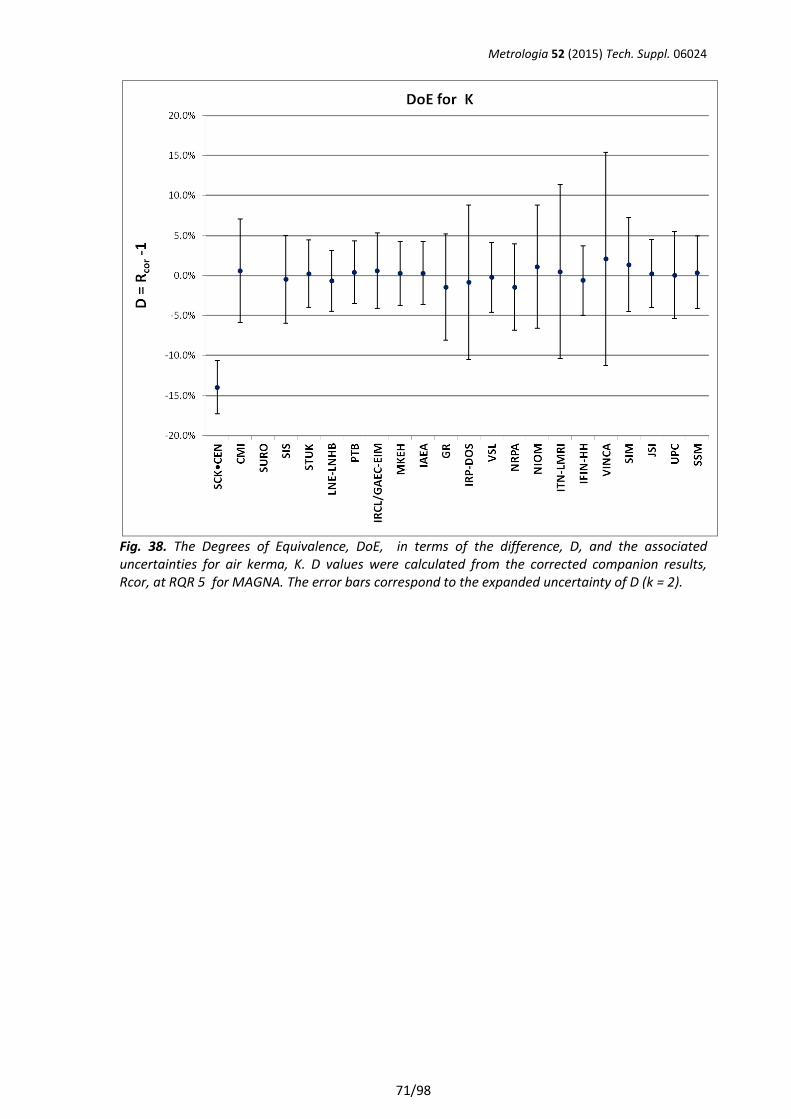
Metrologia 52 (2015) Tech. Suppl. 06024
71/98
Fig. 38. The Degrees of Equivalence, DoE, in terms of the difference, D, and the associated uncertainties for air kerma, K. D values were calculated from the corrected companion results, Rcor, at RQR 5 for MAGNA. The error bars correspond to the expanded uncertainty of D (k = 2).
Metrologia 52 (2015) Tech. Suppl. 06024
72/98
4.7 Comments on laboratories results
The SCK•CEN inconsistencies of the results have been assessed and possible reasons have been identified : KERMA-X was calibrated very close to the X-ray tube focus (at 27 cm distance); PDC was exposed to a beam size much larger than the active area of the PDC and then the readings were adjusted to the nominal area of PDC; PDC calibration was performed at very low air kerma rates (~ 2 mGy/min). Moreover, SCK•CEN has not being performed routine calibrations of KAP meters at RQR beam qualities, yet. In addition, the X-ray unit, used for the measurement in this comparison, was already in process of being replaced with a new dual tube system. The X-ray generator will be removed, soon. SIS, IRCL/GAEC-EIM, VSL, JSI and SSM results for PDC were consistent with the CRV; however that was not the case for the KERMA-X results. IRCL/GAEC-EIM had been identified this discrepancy in advance, after submitting the calibration results to the CCRI Executive Secretary (April 2011). According to IRCL/GAEC-EIM calibration procedures of KAP meters and pencil types ionization chambers, where apertures should be used to define the irradiation area, the measured air kerma had to be corrected for the influence of scattered and extra focal radiation from apertures. The reference correction factor for the 50 mm aperture that is being used is 1.016 [29]. By mistake, this correction factor was not applied to the KERMA-X result evaluation. If such corrections had been applied, the results would be consistent with the reference values; i.e. the D ± UD for KERMA-X would be -2.2 % ± 2.2 % and the (DoE)PKA for the PKA -1.3 % ± 1.6 %. GR and NIOM showed consistent results for KERMA-X, but not for PDC. GR performed the PDC measurements at small irradiation area (~ 10 cm2), which might explain the results. The weighted mean PKA results for GR and NIOM were outside the associated expanded uncertainties. Both laboratories exhibited air kerma results consistent to the CRV. ITN-LMRI, IFIN-HH and SIM results in respect to the PKA for both KERMA-X and PDC may not be consistent with the CRV. Since, the results for air kerma, K, were consistent with the CRV, the PKA inconsistencies might be due to the calibration procedures as well as to the performance characteristics of the transfer instruments. Finally, it should be mentioned that all (except two) participating laboratories exhibited consistent air kerma results with the CRV.
Metrologia 52 (2015) Tech. Suppl. 06024
73/98
5. Conclusion The first EURAMET wide scale supplementary comparison in the field of diagnostic radiology for air kerma area product, PKA, and air kerma, K, (EURAMET project #1177 was performed successfully. The comparison measurements were performed in conjunction with a EURADOS project and an IAEA Coordinated Research Program. For the EURAMET comparison, standard beam qualities (RQR qualities) for incident radiation were applied for measurements and calibrations of the transfer instruments: two KAP meters and two air kerma meters. However, for the analysis of the comparison results within the EURAMET 1177 project both KAP meters (PDC and KERMA-X) but only one air kerma meter (MAGNA) were used. In the frame of the EURADOS and IAEA projects as a feasibility study non-standard and transmitted radiation beam qualities have also been applied. The reproducibility of the measurements carried out with the transfer instruments was established through repeated measurements made at the IRCL/GAEC-EIM (pilot laboratory) over the course of the comparison and it was very satisfactory (ustab ≤ 1 %). The performance of the transfer instruments was tested by the pilot laboratory and a few other laboratories. These test results revealed that the characteristics of the transfer instruments were not optimal for transfer standard propose: the need for a correction for the dependence of the instrument’s response on radiation energy (beam quality correction) was practically negligible, but corrections for the dependence of the instrument’s response on the area and air kerma rate were significant in some cases (up to about 60 % in the worst case). However, the KAP meters used as transfer instruments were selected due to their common use in clinical practices and because better quality KAP meters were not commercially available. Due to these limitations, a pragmatic approach was justified: for a meaningful comparison of the calibration capabilities of different laboratories, the effect of the undesirable instrument’s characteristics were removed by using appropriate correction factors, and the uncertainty of these correction factors were taken into account in the evaluation of the uncertainty of the comparison values. The 216 KAP meter calibrations of the two different transfer KAP meters in terms of air kerma area product were consistent within 5 % except 40 results of 8 participants . The 103 air kerma calibrations were consistent within 1.7 %, except 10 results of 4 participants. The comparison results, based on the DoE values in Table 20, could support the published CMCs of the participants except the 2.0 % uncertainty on KAP meter calibration at the VSL. Note that this evaluation based on the deviation from the reference value calculated for the RQR 5 quality only , without taking into account the increased uncertaities of the DoE values coming from the less robust CRV values and uncertainties of the krate, kQ, karea corrections required.
6. Acknowledgments
Sincere thanks and gratitude are due to all staff members of the laboratories for their participation in this comparison and for their efforts to keep time schedule in an excellent manner. Sincere thanks to the members of the advisory group (Josiane Daures, Hannu Jarvinen and Istvan Csete) for their useful comments, fruitful discussions and support, as well as for the revision of draft A and draft B. Sincere thanks to Dr. Konstantinos Karfopoulos, staff member of Greek Atomic Energy Commission, for his useful comments and discussions on specific issues related to the result evaluation process. Acknowledgments are due to IAEA for kindly providing the PDC KAP meter as well as to EURAMET, IAEA and EURADOS for supporting this project with their respective programs. Finally acknowledgments and gratitude are due to the Greek Atomic Energy Commission for supporting scientifically, financially and practically this project.
Metrologia 52 (2015) Tech. Suppl. 06024
74/98
7. References 1. VAN DIJK, E. AND DE VRIES, W. Results of the comparison of primary air kerma standards for x-
ray qualities used in diagnostic radiology. (NMi Van Swinden Laboratorium) EUROMET 364, CCRI(I)/01-34. Report nr. S-TS-2000-10 (2000).
2. Witzni J., Bjerke H., Bochoud F., Csete I., Denozier M., Devries W., Ennow K., Grinborg J. E., Hourdakis C. J., Kosunen A., Krammer H. M., Pernicka F. and Sander T., Calibration of dosemeters used in mammography with different X ray qualities: EUROMET project no. 526, EURAMET RI(i) – S4, Radiat. Prot. Dosimetry, 108(1), 33-45 (2004).
3. I Csete, L Büermann, I Gomola and R Girzikowsky, Comparison of air kerma measurements between the PTB and the IAEA for x-radiation qualities used in general diagnostic radiology and mammography, EURAMET RI()I)-S10, Metrologia, 50, Tech. Suppl., 06008 (2013)
4. C Kessler, D Burns, L Czap, I Csete, and I Gomola, Comparison of the air kerma standards of the IAEA and the BIPM in mammography x-rays, BIPM RI(I)-S1, Metrologia, 50, Tech. Suppl., 06005 (2013)
5. Kramer H.M., European Intercomparison of Diagnostic Dosemeters: Calibration of the Reference Dosemeters, Radiat Prot Dosimetry 43(1-4): 75-79 (1992)
6. Juran R., Noel A. and Olerud H.M., European Intercomparison of Diagnostic Dosemeters: Performance of the Programme, Radiat Prot Dosimetry 43(1-4): 81-86 (1992)
7. Clark M.J., Delgado A ., Hjardemaal O., Kramer H.M. and Zoetelief J., European Intercomparison of Diagnostic Dosemeters: Results, Radiat Prot Dosimetry 43(1-4): 87-91 (1992).
8. Faulkner K., Busch H.P., COONEY P, MALONE J.F, MARSHALL N.W., AND RAWLINGS D.J., An International Intercomparison of Dose-Area Product Meters, Radiat Prot Dosimetry 43(1-4): 131-134, (1992).
9. JANKOWSKI J., DOMIENIK J., PAPIERZ S.,. PADOVANI R, VANO E.AND FAULKNER K., An international calibration of kerma–area product meters for patient dose optimization study, Radiat. Prot. Dosimetry : 1–5 (2008).
10. INTERNATIONAL ELECTROTECHNICAL COMMISSION, Medical diagnostic X-ray equipment - Radiation Conditions for use in the determination of characteristics, IEC 61267, IEC, Geneva (2005).
11. INTERNATIONAL ATOMIC ENERGY AGENCY, Dosimetry in diagnostic radiology: An international code of practice, Technical report series no. 457, IAEA, Vienna (2007).
12. INTERNATIONAL ATOMIC ENERGY AGENCY, Implementation of the International Code of Practice on Dosimetry in Diagnostic Radiology (TRS 457): Review of Test Results, IAEA human health report no. 4, Vienna (2011).
13. Radcal, PDC, Patient Dose Calibrator instruction manual, Radcal Corporation, Monrovia, CA (2007).
14. Stefaan Pommé, Determination of a reference value associated standard uncertainty and degrees of equivalence, Institute for Reference Materials and Measurements, EC JRC Scientific and Policy Reports EUR 25355 EN, ISBN 978-92-79-25104-7, European Union (2012).
15. Cox M. G., The evaluation of key comparison data, Metrologia, 39, 589-595, (2002). 16. Gilmore G. and Hemingway J.D., Practical gamma-ray spectrometry, Ed. Wisley & Sons Inc,
ISBN 0-471-95150-1, p.p. 110-112, (2000). 17. I. Csete, L. Büermann, B. Alikhani and I. Gomola, Comparison of air kerma-length product
measurements between the PTB and the IAEA for x-radiation qualities used in computed tomography (EURAMET.RI(I)-S12, EURAMET project #1327), Metrologia 52, Tech. Suppl. 06014, (2015).
18. Burns D.T. and Allisy-Roberts P.J, The evaluation of degrees of equivalence in regional dosimetry comparisons, CCRI(I)/07-14 (2007).
19. I. Csete, et al. Comparison of air kerma and absorbed dose to water measurements of 60Co radiation beams for radiotherapy. Report on EUROMET project no. 813, identifiers in the BIPM
Metrologia 52 (2015) Tech. Suppl. 06024
75/98
key comparison database (KCDB) are EUROMET.RI(I)-K1 and EUROMET.RI(I)-K4, Metrologia 47 Tech. Suppl. 06012 (2010).
20. D T Burns, C Kessler, P Roger, I Csete Key comparison BIPM.RI(I)-K2 of the air-kerma standards of the MKEH, Hungary and the BIPM in low-energy x-rays, Metrologia 49 Tech. Suppl. 06010 (2012)
21. D.T. Burns, I Csete, P Roger, Key comparison BIPM.RI(I)-K3 of the air-kerma standards of the MKEH, Hungary and the BIPM in medium-energy x-rays, Metrologia 48 Tech. Suppl. 06017 (2011)
22. István Csete, Ludwig Büermann, Igor Gomola and Reinhard Girzikowsky, Comparison of air kerma measurements between the PTB and the IAEA for x-radiation qualities used in general diagnostic radiology and mammography, Metrologia 50, Tech. Suppl., 06008 (2013).
23. ISO/IEC 17043, Conformity assessment — General requirements for proficiency testing, (2010) 24. P. De Bievre and H. Gunzler, traceability in chemical measurements, 118 – 121, ISBN 3-540-
43989-7, Springer Berlin Heidelberg (2005) 25. Boson J., Johansson L., Ramebäck H., Ågren G. Uncertainty in HPGe detector calibration for in
situ gamma-ray spectrometry, Radiation Protection Dosimetry, Vol. 134, No. 2, pp 122-129 (2009)
26. International Electrotechnical Commission (IEC) Medical Electrical Equipment— Dose Area Product Meters, IEC 60580 2nd ed. (Geneva, Switzerland: IEC) (2000).
27. Pomme´ S, An intuitive visualisation of intercomparison results applied to the KCDB. Appl Radiat Isot 64:1158–1162 (2006)
28. Yana Spasova Ζ Stefaan Pomme´ Ζ Uwe Watjen, Visualisation of interlaboratory comparison results in PomPlots Accred Qual Assur, 12:623–627 (2007).
29. C.J. Hourdakis, A. Boziari, E. Koumpouli, Calibration of pencil type ionization chambers at various irradiation lengths and beam qualities, STANDARDS, APPLICATIONS AND QUALITY ASSURANCE IN MEDICAL RADIATION DOSIMETRY (IDOS) PROCEEDINGS SERIES p 21-33, IAEA, (2011).
30. IBA, KERMA-X Plus C Tin-O, User Manual, IBA Dosimetry GmbH, Schwarzenbruck, Germany (2006).
31. R. B. Dean and W. J. Dixon, "Simplified Statistics for Small Numbers of Observations", Anal. Chem., 1951, 23 (4), 636–638 (1951
Metrologia 52 (2015) Tech. Suppl. 06024
76/98
APPENDIX A : The submitted results of the participating laboratories
Notation HVL : reported HVL in mm Al of the radiation quality A : reported irradiation area, in cm2 at the point of measurement
�̇�: reported value of the air kerma rate at the point of measurement NPKA : reported calibration coefficient in terms of air kerma area product NK : reported calibration coefficient in terms of air kerma U % : reported expanded relative uncertainty of the calibration coefficient, k = 2 u : standard uncertainty (k = 1) of the calibration coefficient calculated from U % and NPKA or NK (three digits are kept for all u values) The results are presented in alphabetic order of the laboratories’ country name.
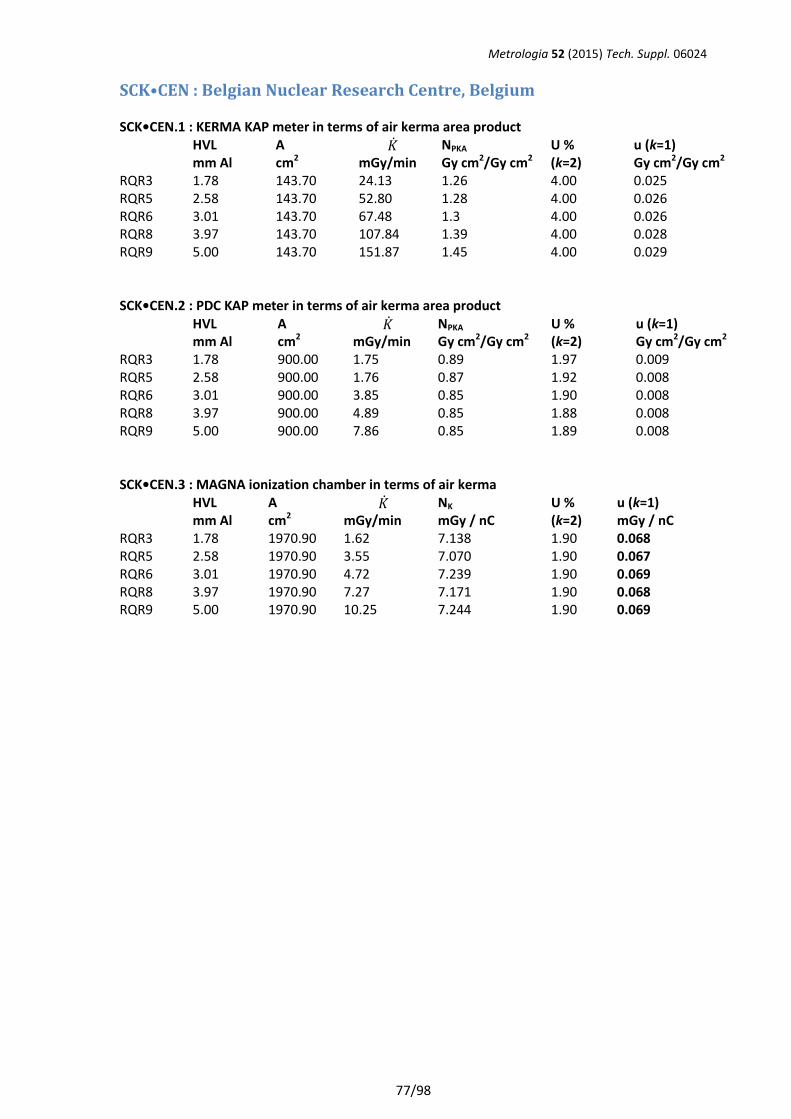
Metrologia 52 (2015) Tech. Suppl. 06024
77/98
SCK•CEN : Belgian Nuclear Research Centre, Belgium SCK•CEN.1 : KERMA KAP meter in terms of air kerma area product HVL
mm Al A cm2
�̇� mGy/min
NPKA Gy cm2/Gy cm2
U % (k=2)
u (k=1) Gy cm2/Gy cm2
RQR3 1.78 143.70 24.13 1.26 4.00 0.025 RQR5 2.58 143.70 52.80 1.28 4.00 0.026 RQR6 3.01 143.70 67.48 1.3 4.00 0.026 RQR8 3.97 143.70 107.84 1.39 4.00 0.028 RQR9 5.00 143.70 151.87 1.45 4.00 0.029 SCK•CEN.2 : PDC KAP meter in terms of air kerma area product HVL
mm Al A cm2
�̇� mGy/min
NPKA Gy cm2/Gy cm2
U % (k=2)
u (k=1) Gy cm2/Gy cm2
RQR3 1.78 900.00 1.75 0.89 1.97 0.009 RQR5 2.58 900.00 1.76 0.87 1.92 0.008 RQR6 3.01 900.00 3.85 0.85 1.90 0.008 RQR8 3.97 900.00 4.89 0.85 1.88 0.008 RQR9 5.00 900.00 7.86 0.85 1.89 0.008 SCK•CEN.3 : MAGNA ionization chamber in terms of air kerma HVL
mm Al A cm2
�̇� mGy/min
NK mGy / nC
U % (k=2)
u (k=1) mGy / nC
RQR3 1.78 1970.90 1.62 7.138 1.90 0.068 RQR5 2.58 1970.90 3.55 7.070 1.90 0.067 RQR6 3.01 1970.90 4.72 7.239 1.90 0.069 RQR8 3.97 1970.90 7.27 7.171 1.90 0.068 RQR9 5.00 1970.90 10.25 7.244 1.90 0.069
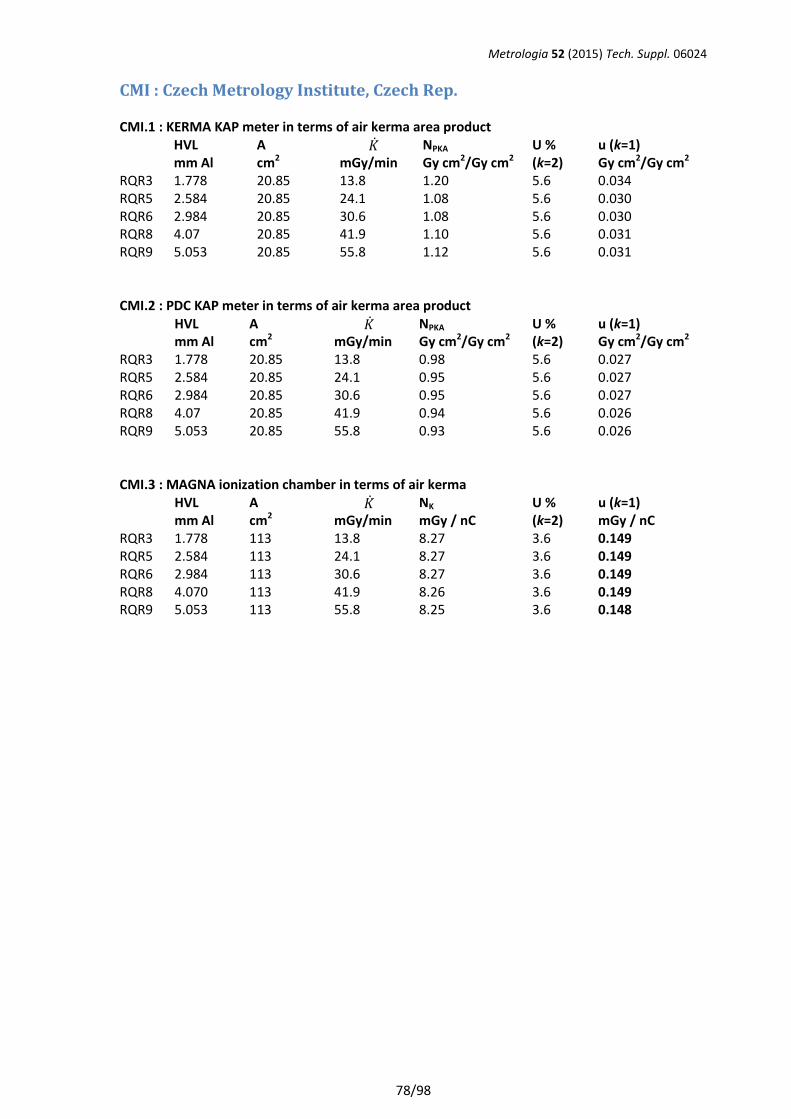
Metrologia 52 (2015) Tech. Suppl. 06024
78/98
CMI : Czech Metrology Institute, Czech Rep. CMI.1 : KERMA KAP meter in terms of air kerma area product HVL
mm Al A cm2
�̇� mGy/min
NPKA Gy cm2/Gy cm2
U % (k=2)
u (k=1) Gy cm2/Gy cm2
RQR3 1.778 20.85 13.8 1.20 5.6 0.034 RQR5 2.584 20.85 24.1 1.08 5.6 0.030 RQR6 2.984 20.85 30.6 1.08 5.6 0.030 RQR8 4.07 20.85 41.9 1.10 5.6 0.031 RQR9 5.053 20.85 55.8 1.12 5.6 0.031 CMI.2 : PDC KAP meter in terms of air kerma area product HVL
mm Al A cm2
�̇� mGy/min
NPKA Gy cm2/Gy cm2
U % (k=2)
u (k=1) Gy cm2/Gy cm2
RQR3 1.778 20.85 13.8 0.98 5.6 0.027 RQR5 2.584 20.85 24.1 0.95 5.6 0.027 RQR6 2.984 20.85 30.6 0.95 5.6 0.027 RQR8 4.07 20.85 41.9 0.94 5.6 0.026 RQR9 5.053 20.85 55.8 0.93 5.6 0.026 CMI.3 : MAGNA ionization chamber in terms of air kerma HVL
mm Al A cm2
�̇� mGy/min
NK mGy / nC
U % (k=2)
u (k=1) mGy / nC
RQR3 1.778 113 13.8 8.27 3.6 0.149 RQR5 2.584 113 24.1 8.27 3.6 0.149 RQR6 2.984 113 30.6 8.27 3.6 0.149 RQR8 4.070 113 41.9 8.26 3.6 0.149 RQR9 5.053 113 55.8 8.25 3.6 0.148
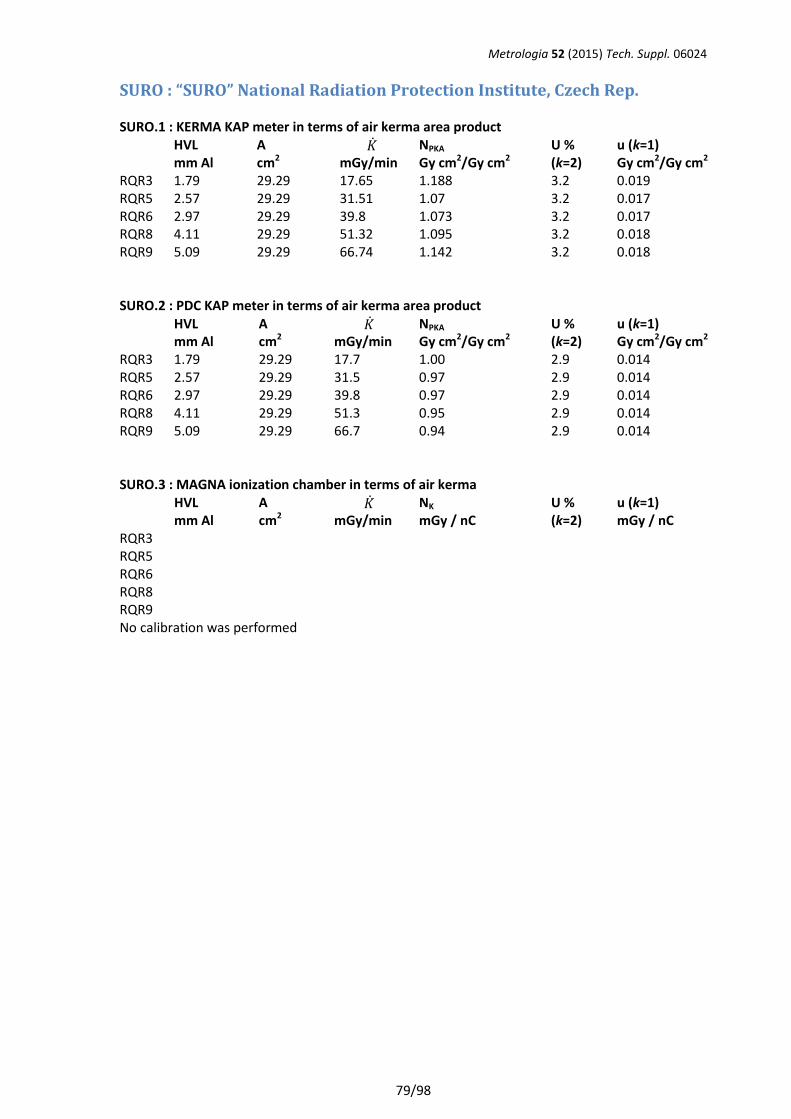
Metrologia 52 (2015) Tech. Suppl. 06024
79/98
SURO : “SURO” National Radiation Protection Institute, Czech Rep. SURO.1 : KERMA KAP meter in terms of air kerma area product HVL
mm Al A cm2
�̇� mGy/min
NPKA Gy cm2/Gy cm2
U % (k=2)
u (k=1) Gy cm2/Gy cm2
RQR3 1.79 29.29 17.65 1.188 3.2 0.019 RQR5 2.57 29.29 31.51 1.07 3.2 0.017 RQR6 2.97 29.29 39.8 1.073 3.2 0.017 RQR8 4.11 29.29 51.32 1.095 3.2 0.018 RQR9 5.09 29.29 66.74 1.142 3.2 0.018 SURO.2 : PDC KAP meter in terms of air kerma area product HVL
mm Al A cm2
�̇� mGy/min
NPKA Gy cm2/Gy cm2
U % (k=2)
u (k=1) Gy cm2/Gy cm2
RQR3 1.79 29.29 17.7 1.00 2.9 0.014 RQR5 2.57 29.29 31.5 0.97 2.9 0.014 RQR6 2.97 29.29 39.8 0.97 2.9 0.014 RQR8 4.11 29.29 51.3 0.95 2.9 0.014 RQR9 5.09 29.29 66.7 0.94 2.9 0.014 SURO.3 : MAGNA ionization chamber in terms of air kerma HVL
mm Al A cm2
�̇� mGy/min
NK mGy / nC
U % (k=2)
u (k=1) mGy / nC
RQR3 RQR5 RQR6 RQR8 RQR9 No calibration was performed
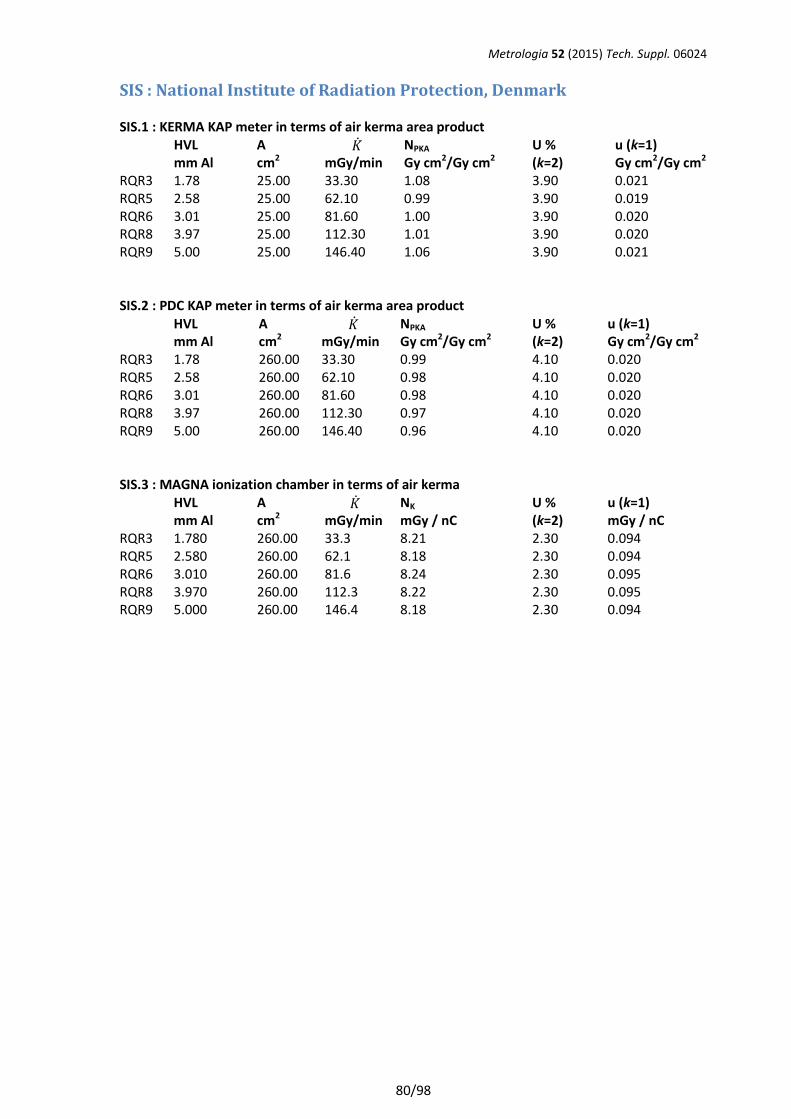
Metrologia 52 (2015) Tech. Suppl. 06024
80/98
SIS : National Institute of Radiation Protection, Denmark SIS.1 : KERMA KAP meter in terms of air kerma area product HVL
mm Al A cm2
�̇� mGy/min
NPKA Gy cm2/Gy cm2
U % (k=2)
u (k=1) Gy cm2/Gy cm2
RQR3 1.78 25.00 33.30 1.08 3.90 0.021 RQR5 2.58 25.00 62.10 0.99 3.90 0.019 RQR6 3.01 25.00 81.60 1.00 3.90 0.020 RQR8 3.97 25.00 112.30 1.01 3.90 0.020 RQR9 5.00 25.00 146.40 1.06 3.90 0.021 SIS.2 : PDC KAP meter in terms of air kerma area product HVL
mm Al A cm2
�̇� mGy/min
NPKA Gy cm2/Gy cm2
U % (k=2)
u (k=1) Gy cm2/Gy cm2
RQR3 1.78 260.00 33.30 0.99 4.10 0.020 RQR5 2.58 260.00 62.10 0.98 4.10 0.020 RQR6 3.01 260.00 81.60 0.98 4.10 0.020 RQR8 3.97 260.00 112.30 0.97 4.10 0.020 RQR9 5.00 260.00 146.40 0.96 4.10 0.020 SIS.3 : MAGNA ionization chamber in terms of air kerma HVL
mm Al A cm2
�̇� mGy/min
NK mGy / nC
U % (k=2)
u (k=1) mGy / nC
RQR3 1.780 260.00 33.3 8.21 2.30 0.094 RQR5 2.580 260.00 62.1 8.18 2.30 0.094 RQR6 3.010 260.00 81.6 8.24 2.30 0.095 RQR8 3.970 260.00 112.3 8.22 2.30 0.095 RQR9 5.000 260.00 146.4 8.18 2.30 0.094
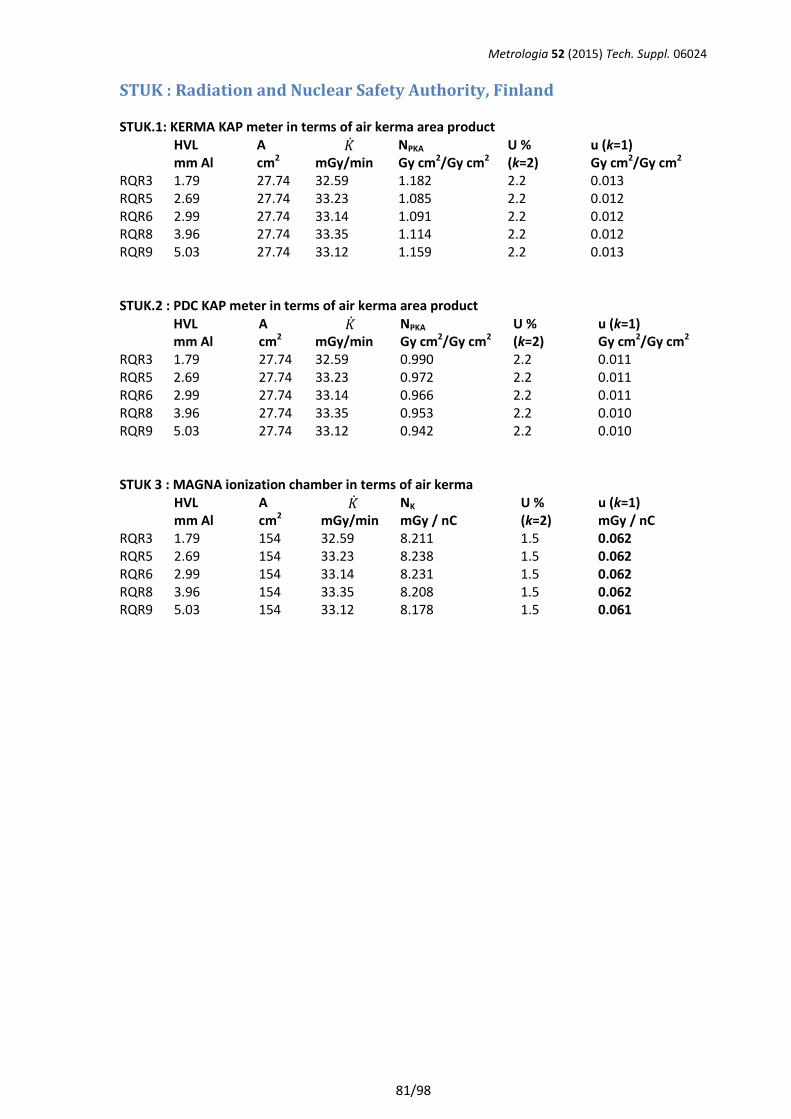
Metrologia 52 (2015) Tech. Suppl. 06024
81/98
STUK : Radiation and Nuclear Safety Authority, Finland STUK.1: KERMA KAP meter in terms of air kerma area product HVL
mm Al A cm2
�̇� mGy/min
NPKA Gy cm2/Gy cm2
U % (k=2)
u (k=1) Gy cm2/Gy cm2
RQR3 1.79 27.74 32.59 1.182 2.2 0.013 RQR5 2.69 27.74 33.23 1.085 2.2 0.012 RQR6 2.99 27.74 33.14 1.091 2.2 0.012 RQR8 3.96 27.74 33.35 1.114 2.2 0.012 RQR9 5.03 27.74 33.12 1.159 2.2 0.013 STUK.2 : PDC KAP meter in terms of air kerma area product HVL
mm Al A cm2
�̇� mGy/min
NPKA Gy cm2/Gy cm2
U % (k=2)
u (k=1) Gy cm2/Gy cm2
RQR3 1.79 27.74 32.59 0.990 2.2 0.011 RQR5 2.69 27.74 33.23 0.972 2.2 0.011 RQR6 2.99 27.74 33.14 0.966 2.2 0.011 RQR8 3.96 27.74 33.35 0.953 2.2 0.010 RQR9 5.03 27.74 33.12 0.942 2.2 0.010 STUK 3 : MAGNA ionization chamber in terms of air kerma HVL
mm Al A cm2
�̇� mGy/min
NK mGy / nC
U % (k=2)
u (k=1) mGy / nC
RQR3 1.79 154 32.59 8.211 1.5 0.062 RQR5 2.69 154 33.23 8.238 1.5 0.062 RQR6 2.99 154 33.14 8.231 1.5 0.062 RQR8 3.96 154 33.35 8.208 1.5 0.062 RQR9 5.03 154 33.12 8.178 1.5 0.061
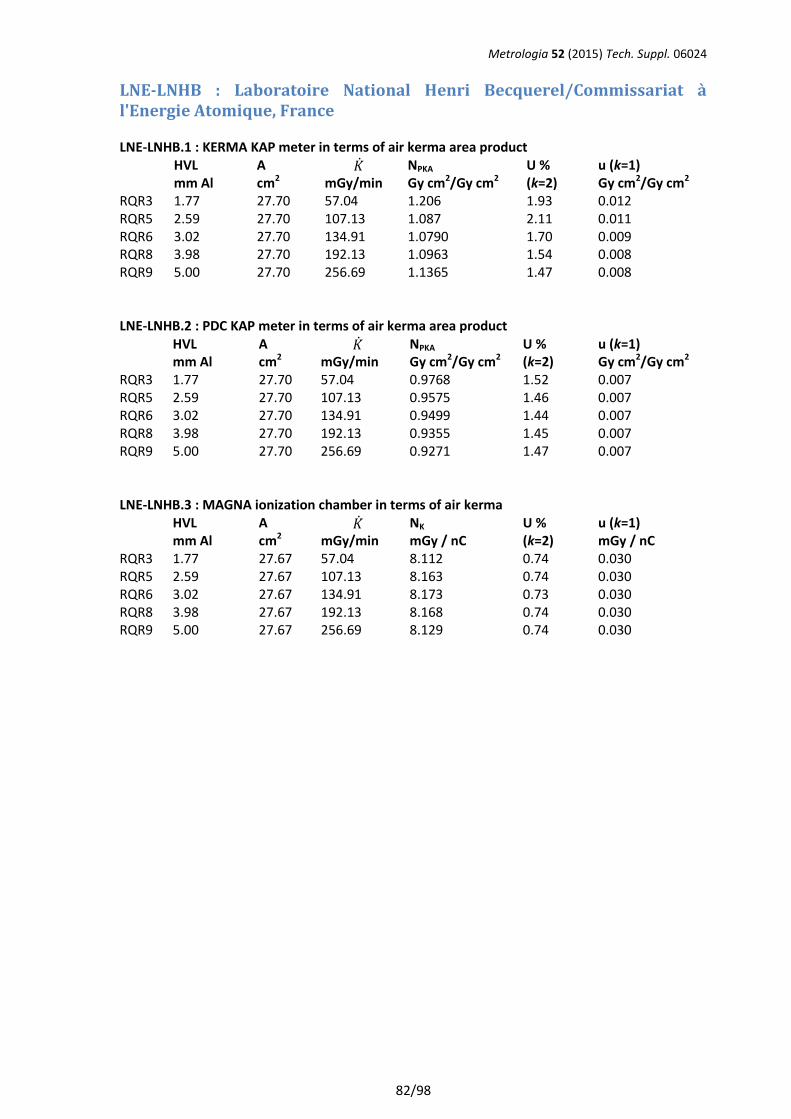
Metrologia 52 (2015) Tech. Suppl. 06024
82/98
LNE-LNHB : Laboratoire National Henri Becquerel/Commissariat à l'Energie Atomique, France LNE-LNHB.1 : KERMA KAP meter in terms of air kerma area product HVL
mm Al A cm2
�̇� mGy/min
NPKA Gy cm2/Gy cm2
U % (k=2)
u (k=1) Gy cm2/Gy cm2
RQR3 1.77 27.70 57.04 1.206 1.93 0.012 RQR5 2.59 27.70 107.13 1.087 2.11 0.011 RQR6 3.02 27.70 134.91 1.0790 1.70 0.009 RQR8 3.98 27.70 192.13 1.0963 1.54 0.008 RQR9 5.00 27.70 256.69 1.1365 1.47 0.008 LNE-LNHB.2 : PDC KAP meter in terms of air kerma area product HVL
mm Al A cm2
�̇� mGy/min
NPKA Gy cm2/Gy cm2
U % (k=2)
u (k=1) Gy cm2/Gy cm2
RQR3 1.77 27.70 57.04 0.9768 1.52 0.007 RQR5 2.59 27.70 107.13 0.9575 1.46 0.007 RQR6 3.02 27.70 134.91 0.9499 1.44 0.007 RQR8 3.98 27.70 192.13 0.9355 1.45 0.007 RQR9 5.00 27.70 256.69 0.9271 1.47 0.007 LNE-LNHB.3 : MAGNA ionization chamber in terms of air kerma HVL
mm Al A cm2
�̇� mGy/min
NK mGy / nC
U % (k=2)
u (k=1) mGy / nC
RQR3 1.77 27.67 57.04 8.112 0.74 0.030 RQR5 2.59 27.67 107.13 8.163 0.74 0.030 RQR6 3.02 27.67 134.91 8.173 0.73 0.030 RQR8 3.98 27.67 192.13 8.168 0.74 0.030 RQR9 5.00 27.67 256.69 8.129 0.74 0.030
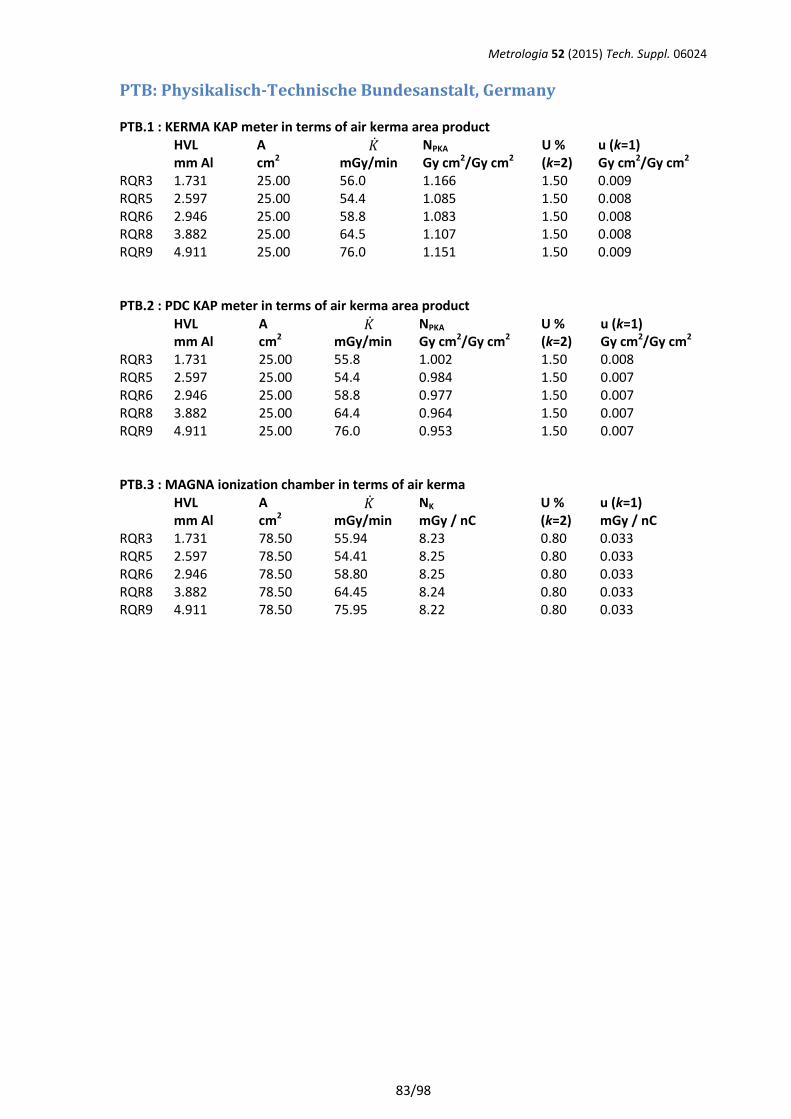
Metrologia 52 (2015) Tech. Suppl. 06024
83/98
PTB: Physikalisch-Technische Bundesanstalt, Germany PTB.1 : KERMA KAP meter in terms of air kerma area product HVL
mm Al A cm2
�̇� mGy/min
NPKA Gy cm2/Gy cm2
U % (k=2)
u (k=1) Gy cm2/Gy cm2
RQR3 1.731 25.00 56.0 1.166 1.50 0.009 RQR5 2.597 25.00 54.4 1.085 1.50 0.008 RQR6 2.946 25.00 58.8 1.083 1.50 0.008 RQR8 3.882 25.00 64.5 1.107 1.50 0.008 RQR9 4.911 25.00 76.0 1.151 1.50 0.009 PTB.2 : PDC KAP meter in terms of air kerma area product HVL
mm Al A cm2
�̇� mGy/min
NPKA Gy cm2/Gy cm2
U % (k=2)
u (k=1) Gy cm2/Gy cm2
RQR3 1.731 25.00 55.8 1.002 1.50 0.008 RQR5 2.597 25.00 54.4 0.984 1.50 0.007 RQR6 2.946 25.00 58.8 0.977 1.50 0.007 RQR8 3.882 25.00 64.4 0.964 1.50 0.007 RQR9 4.911 25.00 76.0 0.953 1.50 0.007 PTB.3 : MAGNA ionization chamber in terms of air kerma HVL
mm Al A cm2
�̇� mGy/min
NK mGy / nC
U % (k=2)
u (k=1) mGy / nC
RQR3 1.731 78.50 55.94 8.23 0.80 0.033 RQR5 2.597 78.50 54.41 8.25 0.80 0.033 RQR6 2.946 78.50 58.80 8.25 0.80 0.033 RQR8 3.882 78.50 64.45 8.24 0.80 0.033 RQR9 4.911 78.50 75.95 8.22 0.80 0.033

Metrologia 52 (2015) Tech. Suppl. 06024
84/98
IRCL/GAEC-EIM : Ionizing Radiation Calibration Laboratory, Greek Atomic Energy Commission, Greece IRCL/GAEC-EIM.1 : KERMA KAP meter in terms of air kerma area product HVL
mm Al A cm2
�̇� mGy/min
NPKA Gy cm2/Gy cm2
U % (k=2)
u (k=1) Gy cm2/Gy cm2
RQR3 1.81 27.83 30.98 1.14 2.69 0.015 RQR5 2.58 27.83 73.35 1.05 2.69 0.014 RQR6 2.96 27.83 74.51 1.04 2.69 0.014 RQR8 3.98 27.83 54.58 1.07 2.69 0.014 RQR9 4.98 27.83 71.24 1.12 2.69 0.015 IRCL/GAEC-EIM.2 : PDC KAP meter in terms of air kerma area product HVL
mm Al A cm2
�̇� mGy/min
NPKA Gy cm2/Gy cm2
U % (k=2)
u (k=1) Gy cm2/Gy cm2
RQR3 1.81 27.36 31.0 0.99 3.0 0.015 RQR5 2.58 27.36 73.3 0.98 3.0 0.015 RQR6 2.95 27.36 74.5 0.97 3.0 0.015 RQR8 3.98 27.36 54.6 0.96 3.0 0.015 RQR9 4.98 27.36 71.2 0.94 3.0 0.014 IRCL/GAEC-EIM.3 : MAGNA ionization chamber in terms of air kerma HVL
mm Al A cm2
�̇� mGy/min
NK mGy / nC
U % (k=2)
u (k=1) mGy / nC
RQR3 1.81 572.27 30.81 8.25 1.5 0.062 RQR5 2.58 572.27 73.04 8.27 1.5 0.062 RQR6 2.95 572.27 74.25 8.26 1.5 0.062 RQR8 3.98 572.27 54.32 8.23 1.5 0.062 RQR9 4.98 572.27 70.93 8.20 1.5 0.062
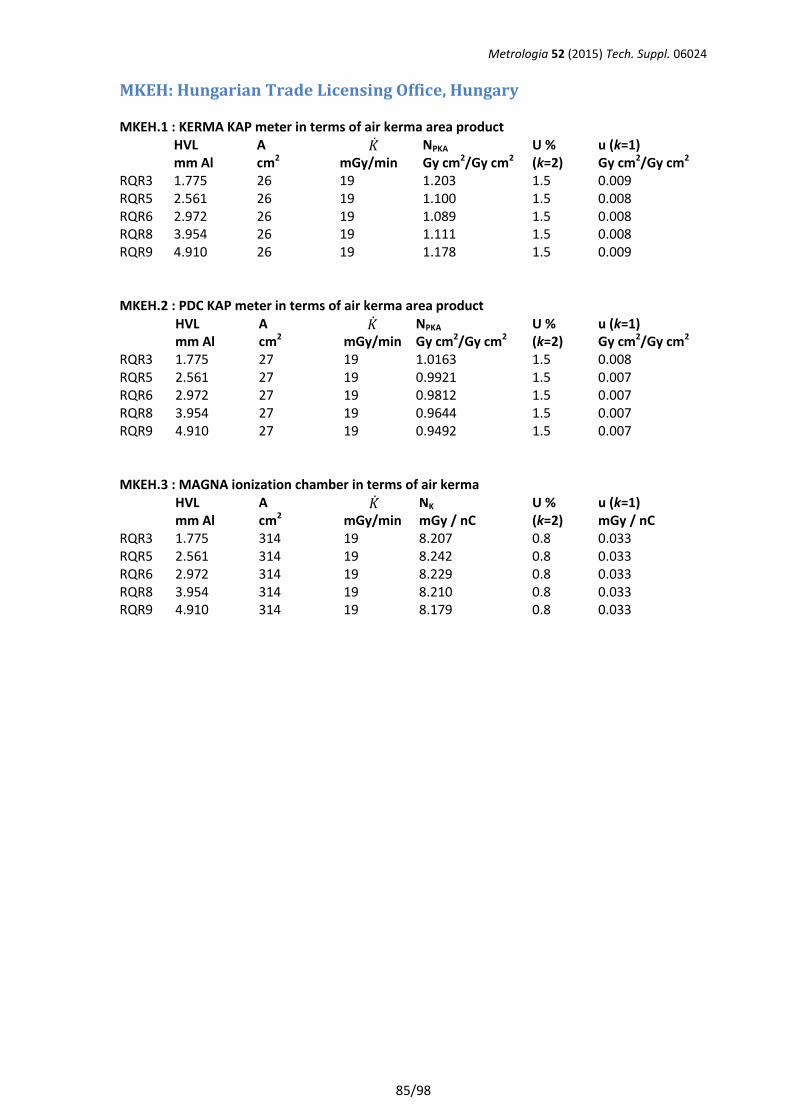
Metrologia 52 (2015) Tech. Suppl. 06024
85/98
MKEH: Hungarian Trade Licensing Office, Hungary MKEH.1 : KERMA KAP meter in terms of air kerma area product HVL
mm Al A cm2
�̇� mGy/min
NPKA Gy cm2/Gy cm2
U % (k=2)
u (k=1) Gy cm2/Gy cm2
RQR3 1.775 26 19 1.203 1.5 0.009 RQR5 2.561 26 19 1.100 1.5 0.008 RQR6 2.972 26 19 1.089 1.5 0.008 RQR8 3.954 26 19 1.111 1.5 0.008 RQR9 4.910 26 19 1.178 1.5 0.009 MKEH.2 : PDC KAP meter in terms of air kerma area product HVL
mm Al A cm2
�̇� mGy/min
NPKA Gy cm2/Gy cm2
U % (k=2)
u (k=1) Gy cm2/Gy cm2
RQR3 1.775 27 19 1.0163 1.5 0.008 RQR5 2.561 27 19 0.9921 1.5 0.007 RQR6 2.972 27 19 0.9812 1.5 0.007 RQR8 3.954 27 19 0.9644 1.5 0.007 RQR9 4.910 27 19 0.9492 1.5 0.007 MKEH.3 : MAGNA ionization chamber in terms of air kerma HVL
mm Al A cm2
�̇� mGy/min
NK mGy / nC
U % (k=2)
u (k=1) mGy / nC
RQR3 1.775 314 19 8.207 0.8 0.033 RQR5 2.561 314 19 8.242 0.8 0.033 RQR6 2.972 314 19 8.229 0.8 0.033 RQR8 3.954 314 19 8.210 0.8 0.033 RQR9 4.910 314 19 8.179 0.8 0.033
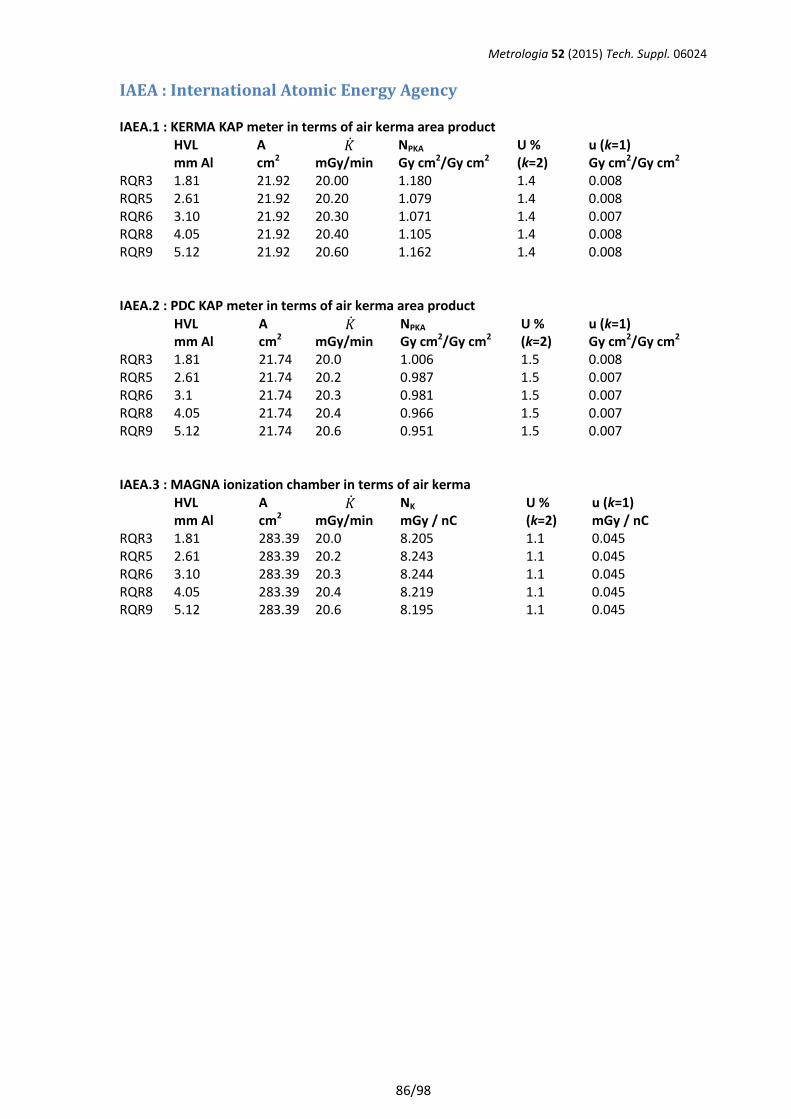
Metrologia 52 (2015) Tech. Suppl. 06024
86/98
IAEA : International Atomic Energy Agency IAEA.1 : KERMA KAP meter in terms of air kerma area product HVL
mm Al A cm2
�̇� mGy/min
NPKA Gy cm2/Gy cm2
U % (k=2)
u (k=1) Gy cm2/Gy cm2
RQR3 1.81 21.92 20.00 1.180 1.4 0.008 RQR5 2.61 21.92 20.20 1.079 1.4 0.008 RQR6 3.10 21.92 20.30 1.071 1.4 0.007 RQR8 4.05 21.92 20.40 1.105 1.4 0.008 RQR9 5.12 21.92 20.60 1.162 1.4 0.008 IAEA.2 : PDC KAP meter in terms of air kerma area product HVL
mm Al A cm2
�̇� mGy/min
NPKA Gy cm2/Gy cm2
U % (k=2)
u (k=1) Gy cm2/Gy cm2
RQR3 1.81 21.74 20.0 1.006 1.5 0.008 RQR5 2.61 21.74 20.2 0.987 1.5 0.007 RQR6 3.1 21.74 20.3 0.981 1.5 0.007 RQR8 4.05 21.74 20.4 0.966 1.5 0.007 RQR9 5.12 21.74 20.6 0.951 1.5 0.007 IAEA.3 : MAGNA ionization chamber in terms of air kerma HVL
mm Al A cm2
�̇� mGy/min
NK mGy / nC
U % (k=2)
u (k=1) mGy / nC
RQR3 1.81 283.39 20.0 8.205 1.1 0.045 RQR5 2.61 283.39 20.2 8.243 1.1 0.045 RQR6 3.10 283.39 20.3 8.244 1.1 0.045 RQR8 4.05 283.39 20.4 8.219 1.1 0.045 RQR9 5.12 283.39 20.6 8.195 1.1 0.045
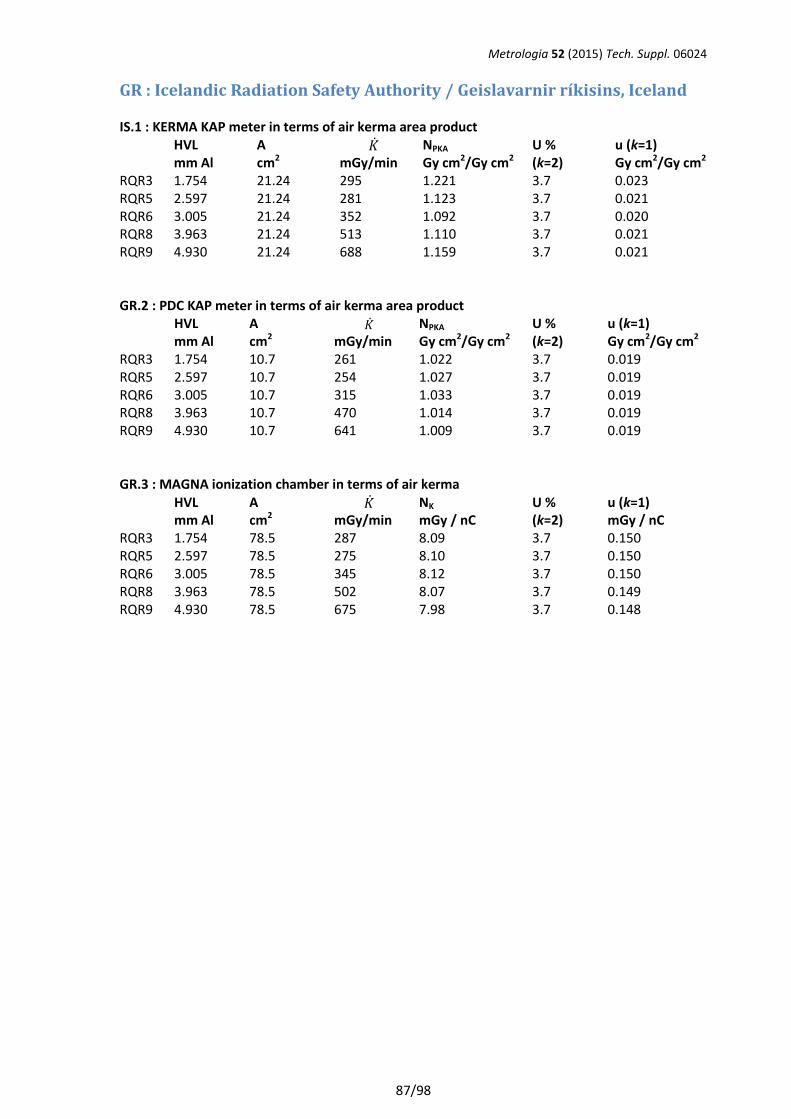
Metrologia 52 (2015) Tech. Suppl. 06024
87/98
GR : Icelandic Radiation Safety Authority / Geislavarnir ríkisins, Iceland IS.1 : KERMA KAP meter in terms of air kerma area product HVL
mm Al A cm2
�̇� mGy/min
NPKA Gy cm2/Gy cm2
U % (k=2)
u (k=1) Gy cm2/Gy cm2
RQR3 1.754 21.24 295 1.221 3.7 0.023 RQR5 2.597 21.24 281 1.123 3.7 0.021 RQR6 3.005 21.24 352 1.092 3.7 0.020 RQR8 3.963 21.24 513 1.110 3.7 0.021 RQR9 4.930 21.24 688 1.159 3.7 0.021 GR.2 : PDC KAP meter in terms of air kerma area product HVL
mm Al A cm2
�̇�
mGy/min NPKA Gy cm2/Gy cm2
U % (k=2)
u (k=1) Gy cm2/Gy cm2
RQR3 1.754 10.7 261 1.022 3.7 0.019 RQR5 2.597 10.7 254 1.027 3.7 0.019 RQR6 3.005 10.7 315 1.033 3.7 0.019 RQR8 3.963 10.7 470 1.014 3.7 0.019 RQR9 4.930 10.7 641 1.009 3.7 0.019 GR.3 : MAGNA ionization chamber in terms of air kerma HVL
mm Al A cm2
�̇� mGy/min
NK mGy / nC
U % (k=2)
u (k=1) mGy / nC
RQR3 1.754 78.5 287 8.09 3.7 0.150 RQR5 2.597 78.5 275 8.10 3.7 0.150 RQR6 3.005 78.5 345 8.12 3.7 0.150 RQR8 3.963 78.5 502 8.07 3.7 0.149 RQR9 4.930 78.5 675 7.98 3.7 0.148
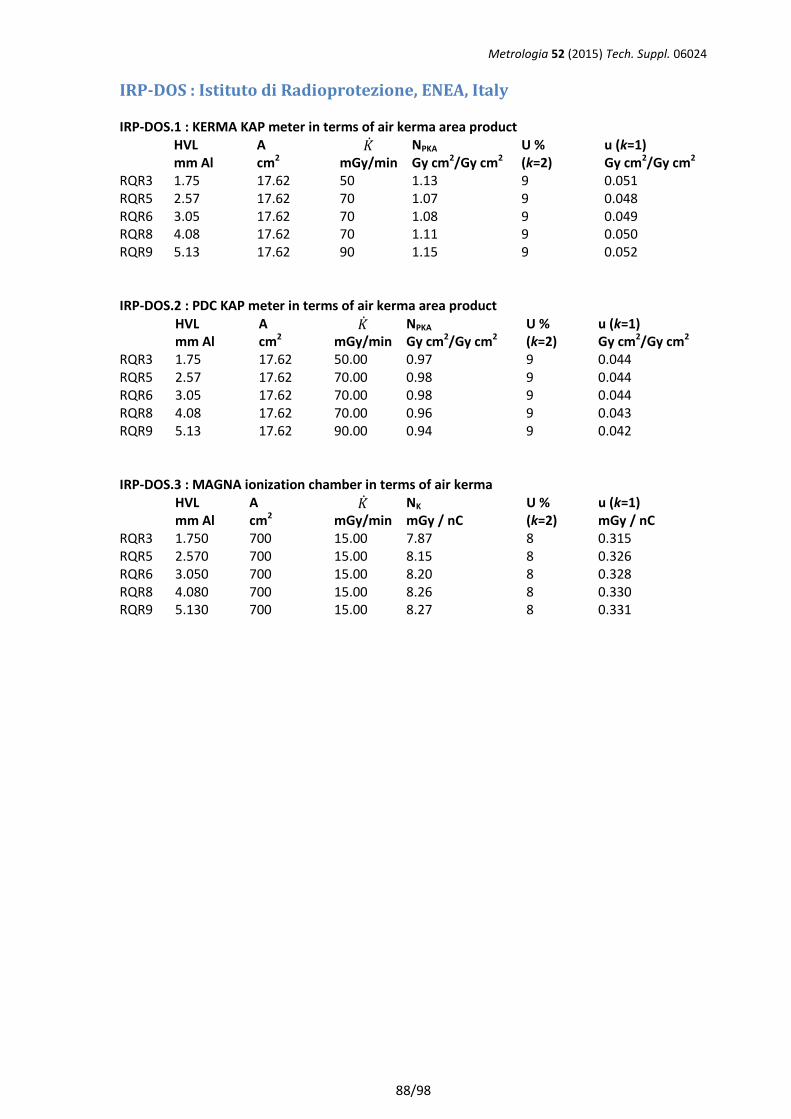
Metrologia 52 (2015) Tech. Suppl. 06024
88/98
IRP-DOS : Istituto di Radioprotezione, ENEA, Italy IRP-DOS.1 : KERMA KAP meter in terms of air kerma area product HVL
mm Al A cm2
�̇� mGy/min
NPKA Gy cm2/Gy cm2
U % (k=2)
u (k=1) Gy cm2/Gy cm2
RQR3 1.75 17.62 50 1.13 9 0.051 RQR5 2.57 17.62 70 1.07 9 0.048 RQR6 3.05 17.62 70 1.08 9 0.049 RQR8 4.08 17.62 70 1.11 9 0.050 RQR9 5.13 17.62 90 1.15 9 0.052 IRP-DOS.2 : PDC KAP meter in terms of air kerma area product HVL
mm Al A cm2
�̇� mGy/min
NPKA Gy cm2/Gy cm2
U % (k=2)
u (k=1) Gy cm2/Gy cm2
RQR3 1.75 17.62 50.00 0.97 9 0.044 RQR5 2.57 17.62 70.00 0.98 9 0.044 RQR6 3.05 17.62 70.00 0.98 9 0.044 RQR8 4.08 17.62 70.00 0.96 9 0.043 RQR9 5.13 17.62 90.00 0.94 9 0.042 IRP-DOS.3 : MAGNA ionization chamber in terms of air kerma HVL
mm Al A cm2
�̇� mGy/min
NK mGy / nC
U % (k=2)
u (k=1) mGy / nC
RQR3 1.750 700 15.00 7.87 8 0.315 RQR5 2.570 700 15.00 8.15 8 0.326 RQR6 3.050 700 15.00 8.20 8 0.328 RQR8 4.080 700 15.00 8.26 8 0.330 RQR9 5.130 700 15.00 8.27 8 0.331
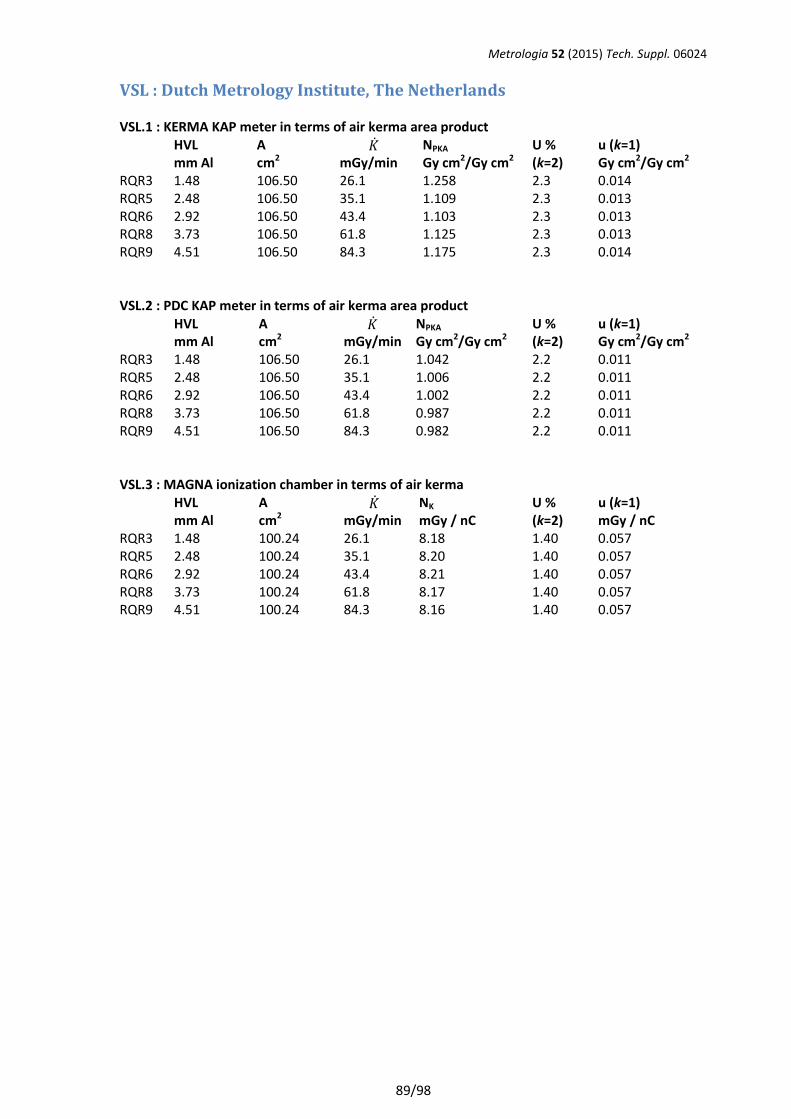
Metrologia 52 (2015) Tech. Suppl. 06024
89/98
VSL : Dutch Metrology Institute, The Netherlands VSL.1 : KERMA KAP meter in terms of air kerma area product HVL
mm Al A cm2
�̇� mGy/min
NPKA Gy cm2/Gy cm2
U % (k=2)
u (k=1) Gy cm2/Gy cm2
RQR3 1.48 106.50 26.1 1.258 2.3 0.014 RQR5 2.48 106.50 35.1 1.109 2.3 0.013 RQR6 2.92 106.50 43.4 1.103 2.3 0.013 RQR8 3.73 106.50 61.8 1.125 2.3 0.013 RQR9 4.51 106.50 84.3 1.175 2.3 0.014 VSL.2 : PDC KAP meter in terms of air kerma area product HVL
mm Al A cm2
�̇� mGy/min
NPKA Gy cm2/Gy cm2
U % (k=2)
u (k=1) Gy cm2/Gy cm2
RQR3 1.48 106.50 26.1 1.042 2.2 0.011 RQR5 2.48 106.50 35.1 1.006 2.2 0.011 RQR6 2.92 106.50 43.4 1.002 2.2 0.011 RQR8 3.73 106.50 61.8 0.987 2.2 0.011 RQR9 4.51 106.50 84.3 0.982 2.2 0.011 VSL.3 : MAGNA ionization chamber in terms of air kerma HVL
mm Al A cm2
�̇� mGy/min
NK mGy / nC
U % (k=2)
u (k=1) mGy / nC
RQR3 1.48 100.24 26.1 8.18 1.40 0.057 RQR5 2.48 100.24 35.1 8.20 1.40 0.057 RQR6 2.92 100.24 43.4 8.21 1.40 0.057 RQR8 3.73 100.24 61.8 8.17 1.40 0.057 RQR9 4.51 100.24 84.3 8.16 1.40 0.057
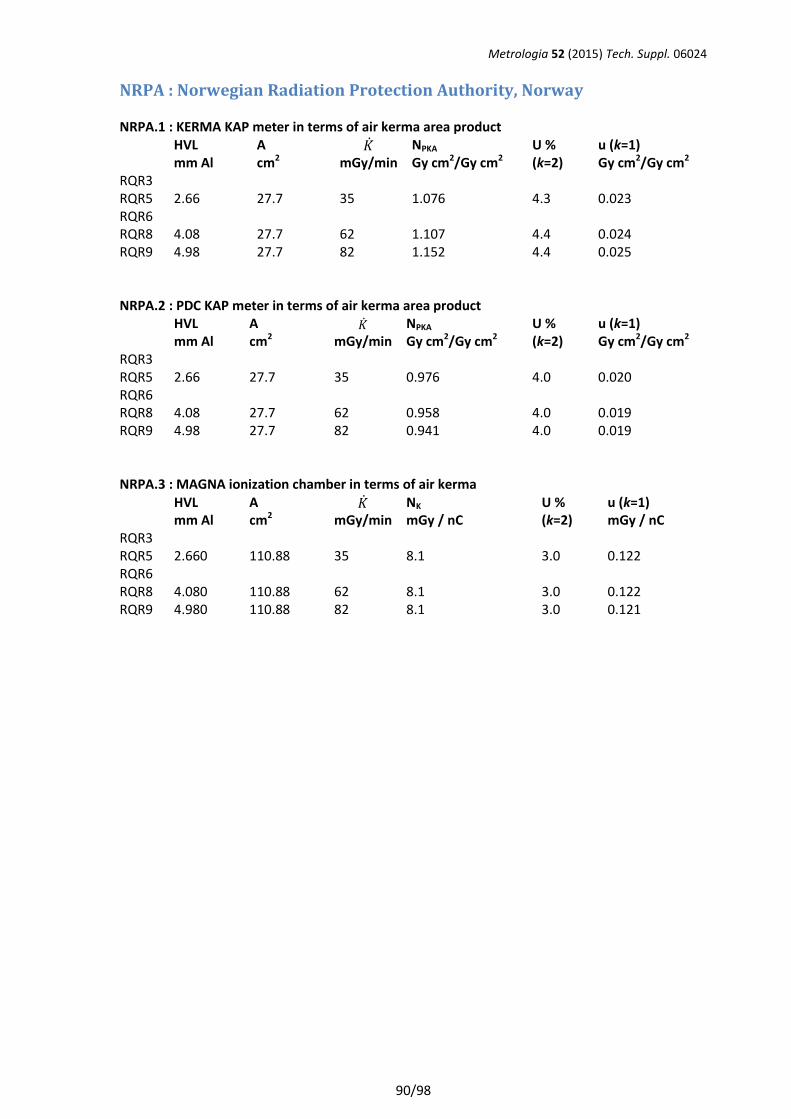
Metrologia 52 (2015) Tech. Suppl. 06024
90/98
NRPA : Norwegian Radiation Protection Authority, Norway NRPA.1 : KERMA KAP meter in terms of air kerma area product HVL
mm Al A cm2
�̇� mGy/min
NPKA Gy cm2/Gy cm2
U % (k=2)
u (k=1) Gy cm2/Gy cm2
RQR3 RQR5 2.66 27.7 35 1.076 4.3 0.023 RQR6 RQR8 4.08 27.7 62 1.107 4.4 0.024 RQR9 4.98 27.7 82 1.152 4.4 0.025 NRPA.2 : PDC KAP meter in terms of air kerma area product HVL
mm Al A cm2
�̇�
mGy/min NPKA Gy cm2/Gy cm2
U % (k=2)
u (k=1) Gy cm2/Gy cm2
RQR3 RQR5 2.66 27.7 35 0.976 4.0 0.020 RQR6 RQR8 4.08 27.7 62 0.958 4.0 0.019 RQR9 4.98 27.7 82 0.941 4.0 0.019 NRPA.3 : MAGNA ionization chamber in terms of air kerma HVL
mm Al A cm2
�̇� mGy/min
NK mGy / nC
U % (k=2)
u (k=1) mGy / nC
RQR3 RQR5 2.660 110.88 35 8.1 3.0 0.122 RQR6 RQR8 4.080 110.88 62 8.1 3.0 0.122 RQR9 4.980 110.88 82 8.1 3.0 0.121
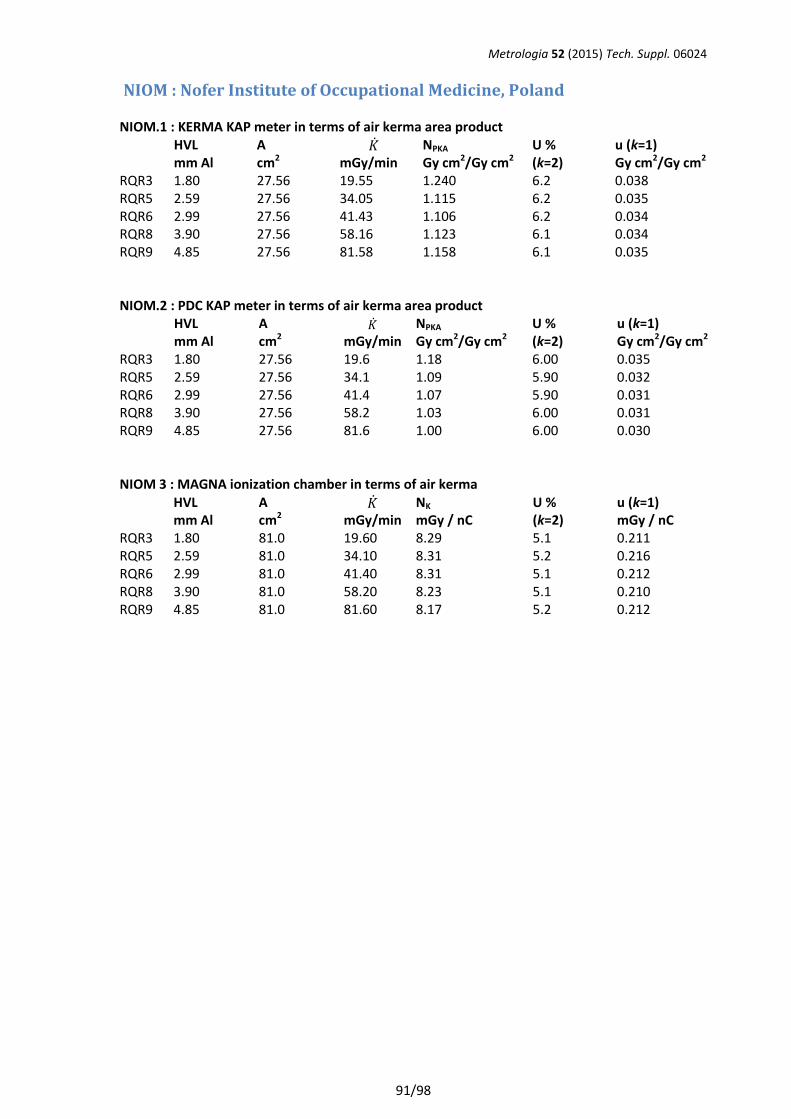
Metrologia 52 (2015) Tech. Suppl. 06024
91/98
NIOM : Nofer Institute of Occupational Medicine, Poland NIOM.1 : KERMA KAP meter in terms of air kerma area product HVL
mm Al A cm2
�̇� mGy/min
NPKA Gy cm2/Gy cm2
U % (k=2)
u (k=1) Gy cm2/Gy cm2
RQR3 1.80 27.56 19.55 1.240 6.2 0.038 RQR5 2.59 27.56 34.05 1.115 6.2 0.035 RQR6 2.99 27.56 41.43 1.106 6.2 0.034 RQR8 3.90 27.56 58.16 1.123 6.1 0.034 RQR9 4.85 27.56 81.58 1.158 6.1 0.035 NIOM.2 : PDC KAP meter in terms of air kerma area product HVL
mm Al A cm2
�̇�
mGy/min NPKA Gy cm2/Gy cm2
U % (k=2)
u (k=1) Gy cm2/Gy cm2
RQR3 1.80 27.56 19.6 1.18 6.00 0.035 RQR5 2.59 27.56 34.1 1.09 5.90 0.032 RQR6 2.99 27.56 41.4 1.07 5.90 0.031 RQR8 3.90 27.56 58.2 1.03 6.00 0.031 RQR9 4.85 27.56 81.6 1.00 6.00 0.030 NIOM 3 : MAGNA ionization chamber in terms of air kerma HVL
mm Al A cm2
�̇� mGy/min
NK mGy / nC
U % (k=2)
u (k=1) mGy / nC
RQR3 1.80 81.0 19.60 8.29 5.1 0.211 RQR5 2.59 81.0 34.10 8.31 5.2 0.216 RQR6 2.99 81.0 41.40 8.31 5.1 0.212 RQR8 3.90 81.0 58.20 8.23 5.1 0.210 RQR9 4.85 81.0 81.60 8.17 5.2 0.212
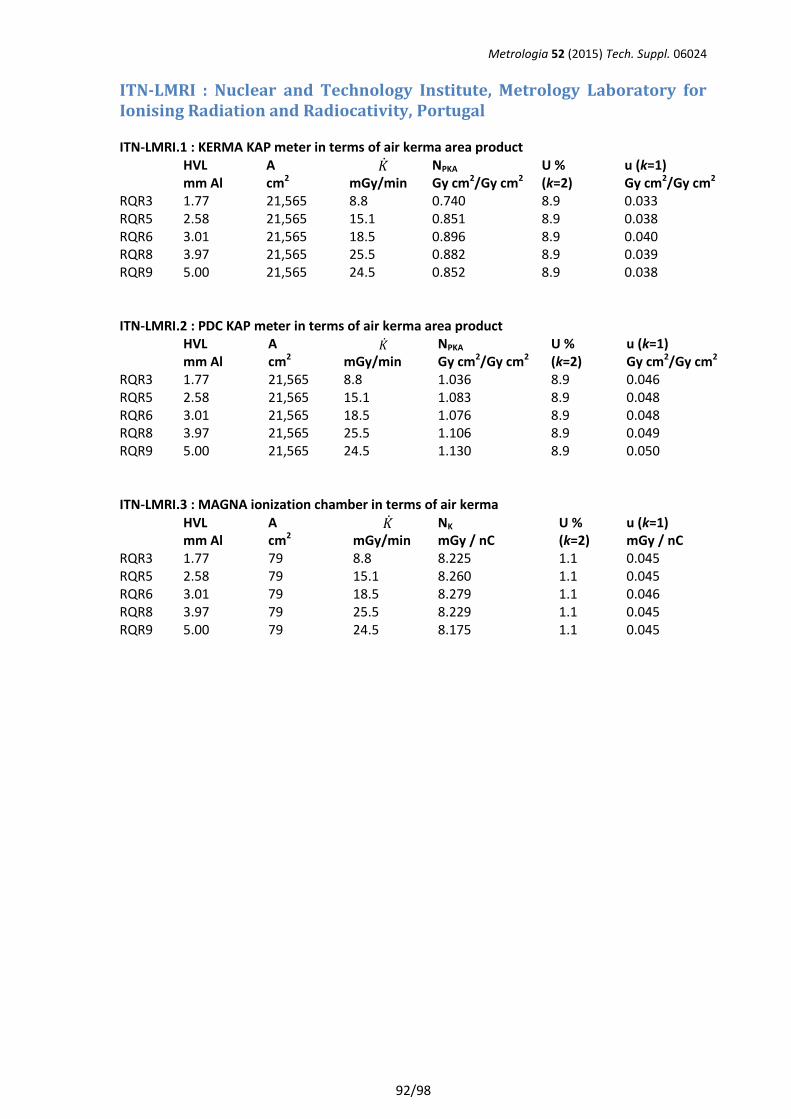
Metrologia 52 (2015) Tech. Suppl. 06024
92/98
ITN-LMRI : Nuclear and Technology Institute, Metrology Laboratory for Ionising Radiation and Radiocativity, Portugal ITN-LMRI.1 : KERMA KAP meter in terms of air kerma area product HVL
mm Al A cm2
�̇� mGy/min
NPKA Gy cm2/Gy cm2
U % (k=2)
u (k=1) Gy cm2/Gy cm2
RQR3 1.77 21,565 8.8 0.740 8.9 0.033 RQR5 2.58 21,565 15.1 0.851 8.9 0.038 RQR6 3.01 21,565 18.5 0.896 8.9 0.040 RQR8 3.97 21,565 25.5 0.882 8.9 0.039 RQR9 5.00 21,565 24.5 0.852 8.9 0.038 ITN-LMRI.2 : PDC KAP meter in terms of air kerma area product HVL
mm Al A cm2
�̇�
mGy/min NPKA Gy cm2/Gy cm2
U % (k=2)
u (k=1) Gy cm2/Gy cm2
RQR3 1.77 21,565 8.8 1.036 8.9 0.046 RQR5 2.58 21,565 15.1 1.083 8.9 0.048 RQR6 3.01 21,565 18.5 1.076 8.9 0.048 RQR8 3.97 21,565 25.5 1.106 8.9 0.049 RQR9 5.00 21,565 24.5 1.130 8.9 0.050 ITN-LMRI.3 : MAGNA ionization chamber in terms of air kerma HVL
mm Al A cm2
�̇� mGy/min
NK mGy / nC
U % (k=2)
u (k=1) mGy / nC
RQR3 1.77 79 8.8 8.225 1.1 0.045 RQR5 2.58 79 15.1 8.260 1.1 0.045 RQR6 3.01 79 18.5 8.279 1.1 0.046 RQR8 3.97 79 25.5 8.229 1.1 0.045 RQR9 5.00 79 24.5 8.175 1.1 0.045
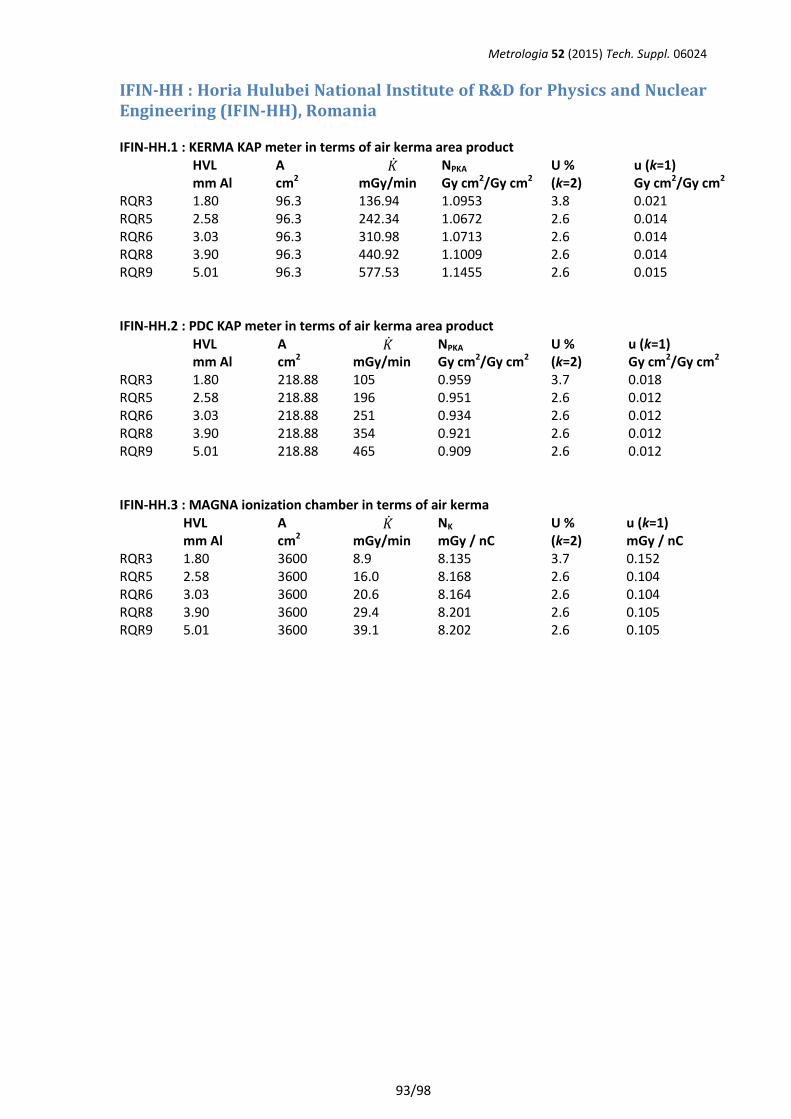
Metrologia 52 (2015) Tech. Suppl. 06024
93/98
IFIN-HH : Horia Hulubei National Institute of R&D for Physics and Nuclear Engineering (IFIN-HH), Romania IFIN-HH.1 : KERMA KAP meter in terms of air kerma area product HVL
mm Al A cm2
�̇� mGy/min
NPKA Gy cm2/Gy cm2
U % (k=2)
u (k=1) Gy cm2/Gy cm2
RQR3 1.80 96.3 136.94 1.0953 3.8 0.021 RQR5 2.58 96.3 242.34 1.0672 2.6 0.014 RQR6 3.03 96.3 310.98 1.0713 2.6 0.014 RQR8 3.90 96.3 440.92 1.1009 2.6 0.014 RQR9 5.01 96.3 577.53 1.1455 2.6 0.015 IFIN-HH.2 : PDC KAP meter in terms of air kerma area product HVL
mm Al A cm2
�̇� mGy/min
NPKA Gy cm2/Gy cm2
U % (k=2)
u (k=1) Gy cm2/Gy cm2
RQR3 1.80 218.88 105 0.959 3.7 0.018 RQR5 2.58 218.88 196 0.951 2.6 0.012 RQR6 3.03 218.88 251 0.934 2.6 0.012 RQR8 3.90 218.88 354 0.921 2.6 0.012 RQR9 5.01 218.88 465 0.909 2.6 0.012 IFIN-HH.3 : MAGNA ionization chamber in terms of air kerma HVL
mm Al A cm2
�̇� mGy/min
NK mGy / nC
U % (k=2)
u (k=1) mGy / nC
RQR3 1.80 3600 8.9 8.135 3.7 0.152 RQR5 2.58 3600 16.0 8.168 2.6 0.104 RQR6 3.03 3600 20.6 8.164 2.6 0.104 RQR8 3.90 3600 29.4 8.201 2.6 0.105 RQR9 5.01 3600 39.1 8.202 2.6 0.105
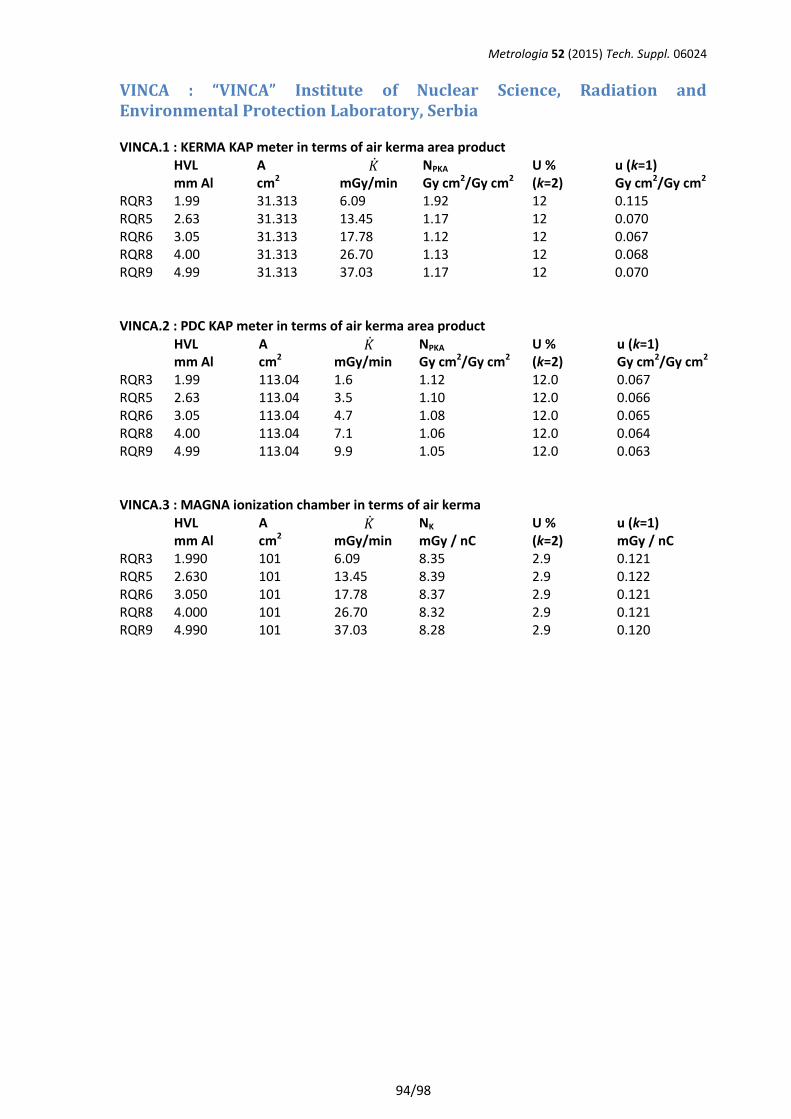
Metrologia 52 (2015) Tech. Suppl. 06024
94/98
VINCA : “VINCA” Institute of Nuclear Science, Radiation and Environmental Protection Laboratory, Serbia VINCA.1 : KERMA KAP meter in terms of air kerma area product HVL
mm Al A cm2
�̇� mGy/min
NPKA Gy cm2/Gy cm2
U % (k=2)
u (k=1) Gy cm2/Gy cm2
RQR3 1.99 31.313 6.09 1.92 12 0.115 RQR5 2.63 31.313 13.45 1.17 12 0.070 RQR6 3.05 31.313 17.78 1.12 12 0.067 RQR8 4.00 31.313 26.70 1.13 12 0.068 RQR9 4.99 31.313 37.03 1.17 12 0.070 VINCA.2 : PDC KAP meter in terms of air kerma area product HVL
mm Al A cm2
�̇� mGy/min
NPKA Gy cm2/Gy cm2
U % (k=2)
u (k=1) Gy cm2/Gy cm2
RQR3 1.99 113.04 1.6 1.12 12.0 0.067 RQR5 2.63 113.04 3.5 1.10 12.0 0.066 RQR6 3.05 113.04 4.7 1.08 12.0 0.065 RQR8 4.00 113.04 7.1 1.06 12.0 0.064 RQR9 4.99 113.04 9.9 1.05 12.0 0.063 VINCA.3 : MAGNA ionization chamber in terms of air kerma HVL
mm Al A cm2
�̇� mGy/min
NK mGy / nC
U % (k=2)
u (k=1) mGy / nC
RQR3 1.990 101 6.09 8.35 2.9 0.121 RQR5 2.630 101 13.45 8.39 2.9 0.122 RQR6 3.050 101 17.78 8.37 2.9 0.121 RQR8 4.000 101 26.70 8.32 2.9 0.121 RQR9 4.990 101 37.03 8.28 2.9 0.120
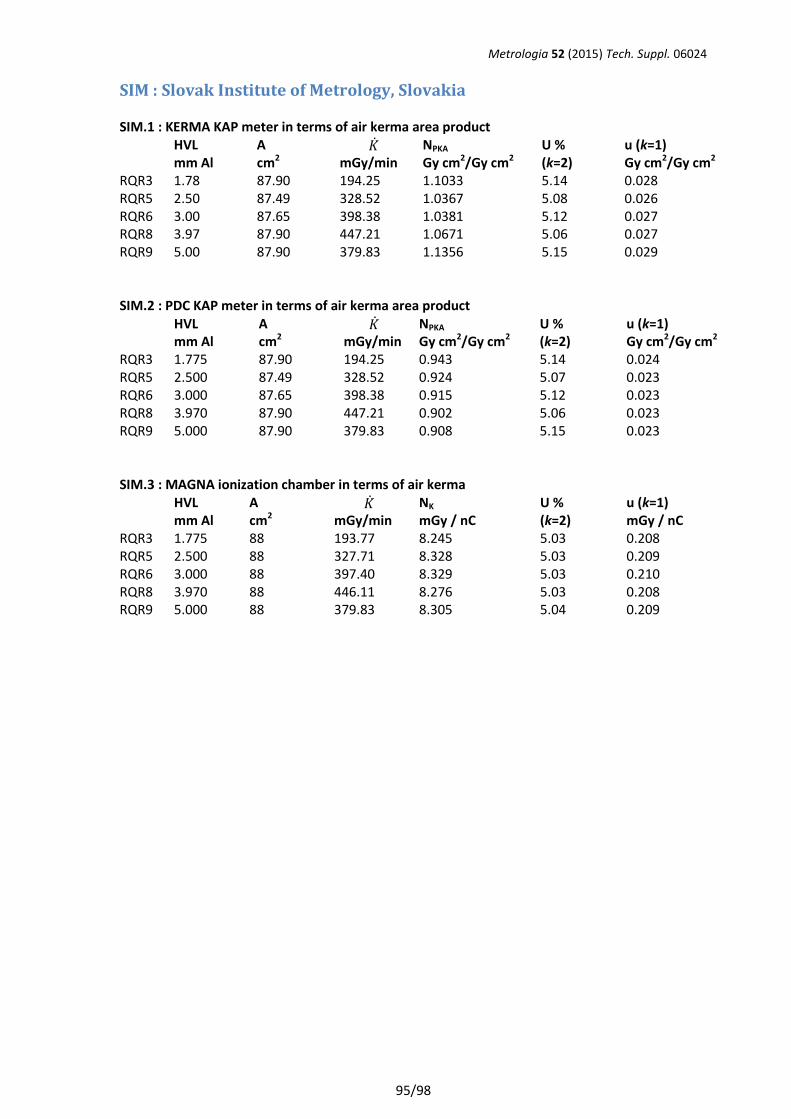
Metrologia 52 (2015) Tech. Suppl. 06024
95/98
SIM : Slovak Institute of Metrology, Slovakia SIM.1 : KERMA KAP meter in terms of air kerma area product HVL
mm Al A cm2
�̇� mGy/min
NPKA Gy cm2/Gy cm2
U % (k=2)
u (k=1) Gy cm2/Gy cm2
RQR3 1.78 87.90 194.25 1.1033 5.14 0.028 RQR5 2.50 87.49 328.52 1.0367 5.08 0.026 RQR6 3.00 87.65 398.38 1.0381 5.12 0.027 RQR8 3.97 87.90 447.21 1.0671 5.06 0.027 RQR9 5.00 87.90 379.83 1.1356 5.15 0.029 SIM.2 : PDC KAP meter in terms of air kerma area product HVL
mm Al A cm2
�̇� mGy/min
NPKA Gy cm2/Gy cm2
U % (k=2)
u (k=1) Gy cm2/Gy cm2
RQR3 1.775 87.90 194.25 0.943 5.14 0.024 RQR5 2.500 87.49 328.52 0.924 5.07 0.023 RQR6 3.000 87.65 398.38 0.915 5.12 0.023 RQR8 3.970 87.90 447.21 0.902 5.06 0.023 RQR9 5.000 87.90 379.83 0.908 5.15 0.023 SIM.3 : MAGNA ionization chamber in terms of air kerma HVL
mm Al A cm2
�̇� mGy/min
NK mGy / nC
U % (k=2)
u (k=1) mGy / nC
RQR3 1.775 88 193.77 8.245 5.03 0.208 RQR5 2.500 88 327.71 8.328 5.03 0.209 RQR6 3.000 88 397.40 8.329 5.03 0.210 RQR8 3.970 88 446.11 8.276 5.03 0.208 RQR9 5.000 88 379.83 8.305 5.04 0.209
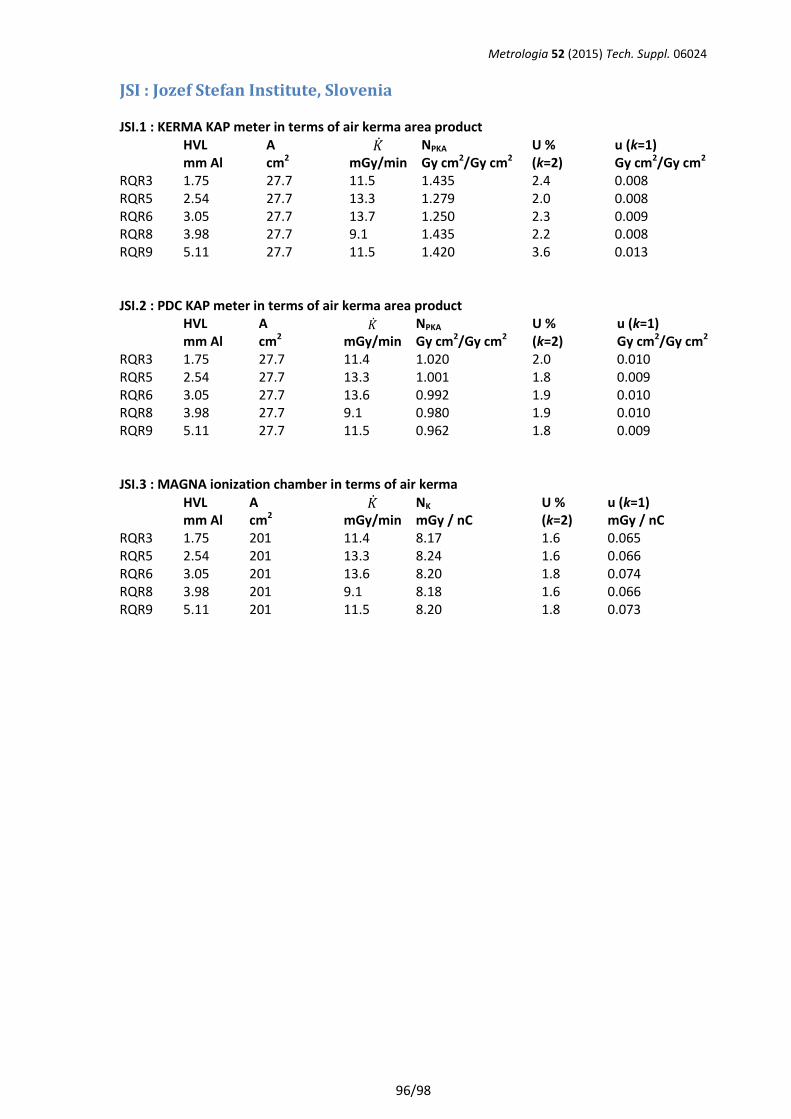
Metrologia 52 (2015) Tech. Suppl. 06024
96/98
JSI : Jozef Stefan Institute, Slovenia JSI.1 : KERMA KAP meter in terms of air kerma area product HVL
mm Al A cm2
�̇� mGy/min
NPKA Gy cm2/Gy cm2
U % (k=2)
u (k=1) Gy cm2/Gy cm2
RQR3 1.75 27.7 11.5 1.435 2.4 0.008 RQR5 2.54 27.7 13.3 1.279 2.0 0.008 RQR6 3.05 27.7 13.7 1.250 2.3 0.009 RQR8 3.98 27.7 9.1 1.435 2.2 0.008 RQR9 5.11 27.7 11.5 1.420 3.6 0.013 JSI.2 : PDC KAP meter in terms of air kerma area product HVL
mm Al A cm2
�̇�
mGy/min NPKA Gy cm2/Gy cm2
U % (k=2)
u (k=1) Gy cm2/Gy cm2
RQR3 1.75 27.7 11.4 1.020 2.0 0.010 RQR5 2.54 27.7 13.3 1.001 1.8 0.009 RQR6 3.05 27.7 13.6 0.992 1.9 0.010 RQR8 3.98 27.7 9.1 0.980 1.9 0.010 RQR9 5.11 27.7 11.5 0.962 1.8 0.009 JSI.3 : MAGNA ionization chamber in terms of air kerma HVL
mm Al A cm2
�̇� mGy/min
NK mGy / nC
U % (k=2)
u (k=1) mGy / nC
RQR3 1.75 201 11.4 8.17 1.6 0.065 RQR5 2.54 201 13.3 8.24 1.6 0.066 RQR6 3.05 201 13.6 8.20 1.8 0.074 RQR8 3.98 201 9.1 8.18 1.6 0.066 RQR9 5.11 201 11.5 8.20 1.8 0.073
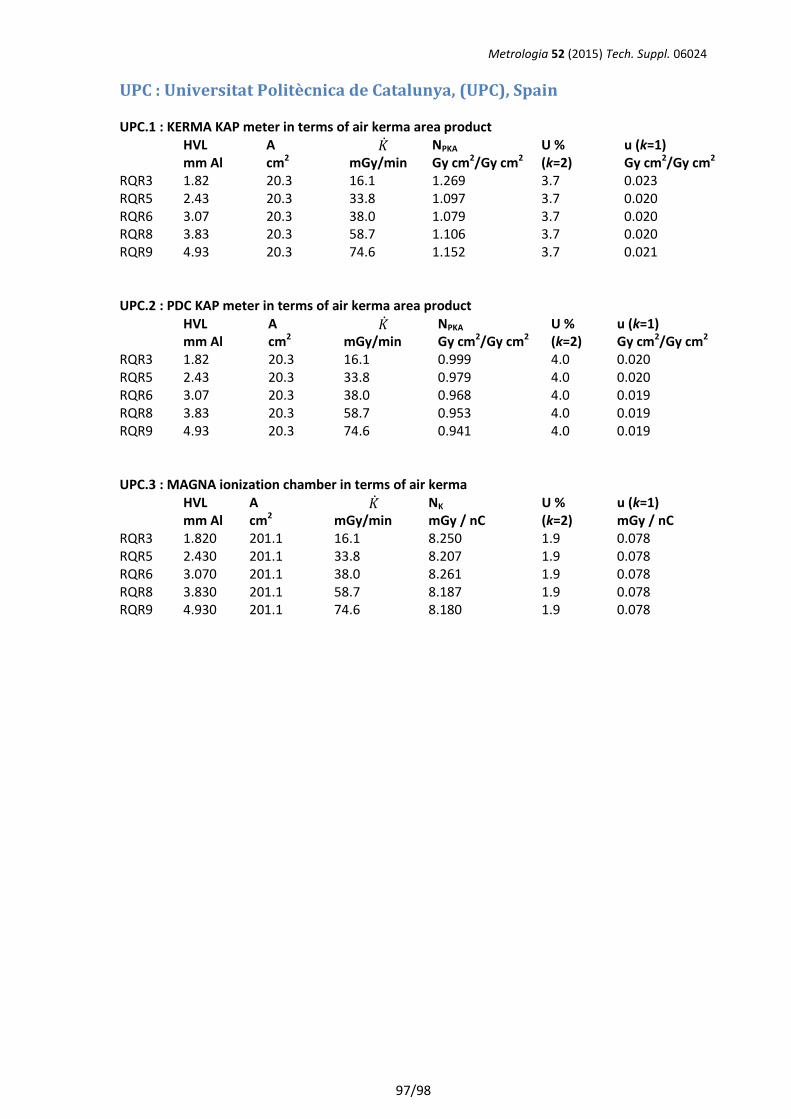
Metrologia 52 (2015) Tech. Suppl. 06024
97/98
UPC : Universitat Politècnica de Catalunya, (UPC), Spain UPC.1 : KERMA KAP meter in terms of air kerma area product HVL
mm Al A cm2
�̇� mGy/min
NPKA Gy cm2/Gy cm2
U % (k=2)
u (k=1) Gy cm2/Gy cm2
RQR3 1.82 20.3 16.1 1.269 3.7 0.023 RQR5 2.43 20.3 33.8 1.097 3.7 0.020 RQR6 3.07 20.3 38.0 1.079 3.7 0.020 RQR8 3.83 20.3 58.7 1.106 3.7 0.020 RQR9 4.93 20.3 74.6 1.152 3.7 0.021 UPC.2 : PDC KAP meter in terms of air kerma area product HVL
mm Al A cm2
�̇� mGy/min
NPKA Gy cm2/Gy cm2
U % (k=2)
u (k=1) Gy cm2/Gy cm2
RQR3 1.82 20.3 16.1 0.999 4.0 0.020 RQR5 2.43 20.3 33.8 0.979 4.0 0.020 RQR6 3.07 20.3 38.0 0.968 4.0 0.019 RQR8 3.83 20.3 58.7 0.953 4.0 0.019 RQR9 4.93 20.3 74.6 0.941 4.0 0.019 UPC.3 : MAGNA ionization chamber in terms of air kerma HVL
mm Al A cm2
�̇� mGy/min
NK mGy / nC
U % (k=2)
u (k=1) mGy / nC
RQR3 1.820 201.1 16.1 8.250 1.9 0.078 RQR5 2.430 201.1 33.8 8.207 1.9 0.078 RQR6 3.070 201.1 38.0 8.261 1.9 0.078 RQR8 3.830 201.1 58.7 8.187 1.9 0.078 RQR9 4.930 201.1 74.6 8.180 1.9 0.078
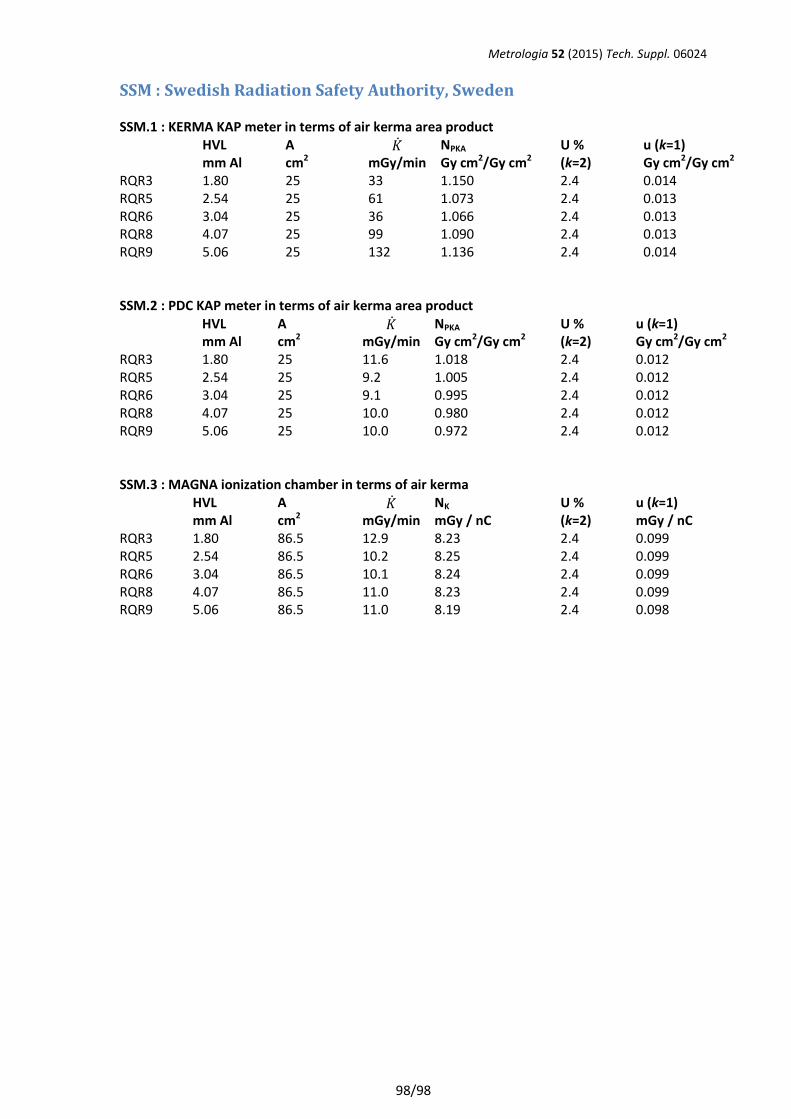
Metrologia 52 (2015) Tech. Suppl. 06024
98/98
SSM : Swedish Radiation Safety Authority, Sweden SSM.1 : KERMA KAP meter in terms of air kerma area product HVL
mm Al A cm2
�̇� mGy/min
NPKA Gy cm2/Gy cm2
U % (k=2)
u (k=1) Gy cm2/Gy cm2
RQR3 1.80 25 33 1.150 2.4 0.014 RQR5 2.54 25 61 1.073 2.4 0.013 RQR6 3.04 25 36 1.066 2.4 0.013 RQR8 4.07 25 99 1.090 2.4 0.013 RQR9 5.06 25 132 1.136 2.4 0.014 SSM.2 : PDC KAP meter in terms of air kerma area product HVL
mm Al A cm2
�̇� mGy/min
NPKA Gy cm2/Gy cm2
U % (k=2)
u (k=1) Gy cm2/Gy cm2
RQR3 1.80 25 11.6 1.018 2.4 0.012 RQR5 2.54 25 9.2 1.005 2.4 0.012 RQR6 3.04 25 9.1 0.995 2.4 0.012 RQR8 4.07 25 10.0 0.980 2.4 0.012 RQR9 5.06 25 10.0 0.972 2.4 0.012 SSM.3 : MAGNA ionization chamber in terms of air kerma HVL
mm Al A cm2
�̇� mGy/min
NK mGy / nC
U % (k=2)
u (k=1) mGy / nC
RQR3 1.80 86.5 12.9 8.23 2.4 0.099 RQR5 2.54 86.5 10.2 8.25 2.4 0.099 RQR6 3.04 86.5 10.1 8.24 2.4 0.099 RQR8 4.07 86.5 11.0 8.23 2.4 0.099 RQR9 5.06 86.5 11.0 8.19 2.4 0.098