Embed Size (px)
Citation preview

Copyright © 2007 by the American Academy of ActuariesThe Year in Review, November 2007 1Copyright © 2009 by the American Academy of ActuariesValuation Table Team Update to LHATFJune 11, 2009 1
Comparison of 1980 CSO Nonsmoker to 2001 Residual Standard
Nonsmoker TableFor LHATF Discussion 6/11/2009
Preferred Mortality POGSociety of Actuaries & American Academy of
Actuaries Joint Project Oversight Group

Copyright © 2007 by the American Academy of ActuariesThe Year in Review, November 2007 2Copyright © 2009 by the American Academy of ActuariesValuation Table Team Update to LHATFJune 11, 2009 2
Compare mortality and reserves for guaranteed issue contracts using the 2001 CSO Residual Standard Table versus 1980 CSO
Objective
Copyright © 2007 by the American Academy of ActuariesThe Year in Review, November 2007 3Copyright © 2009 by the American Academy of ActuariesValuation Table Team Update to LHATFJune 11, 2009 3
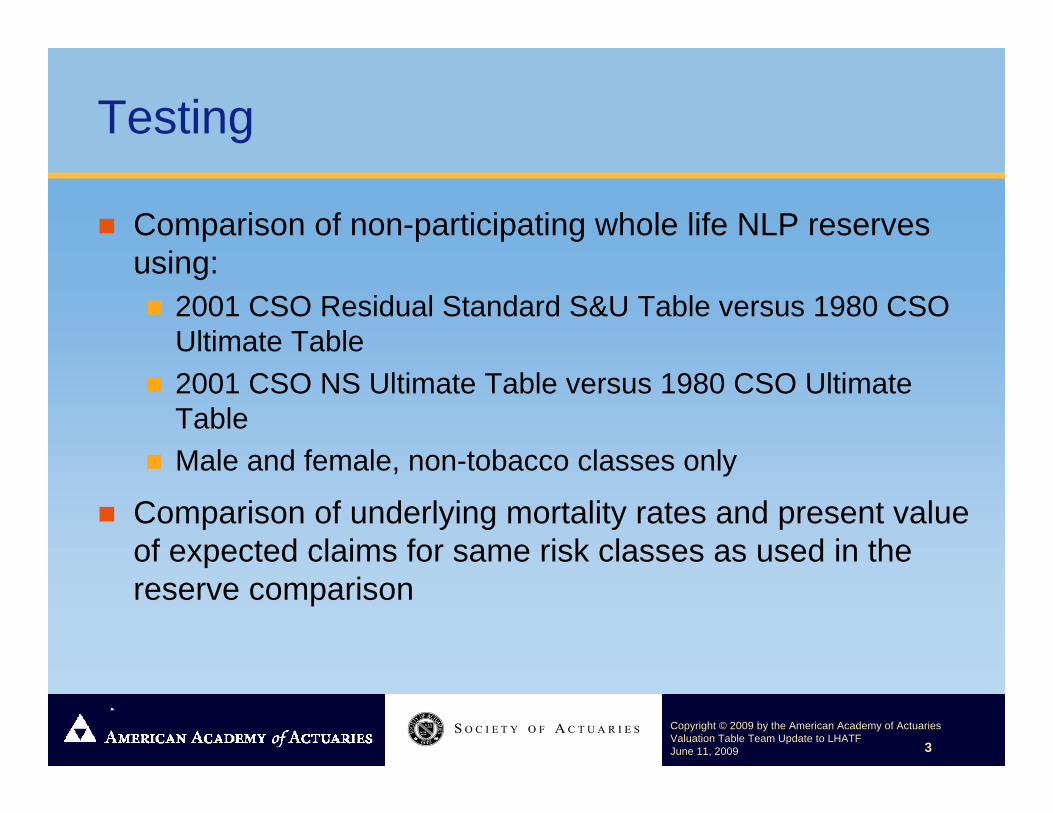
Testing
Comparison of non-participating whole life NLP reserves using:
2001 CSO Residual Standard S&U Table versus 1980 CSO Ultimate Table2001 CSO NS Ultimate Table versus 1980 CSO Ultimate TableMale and female, non-tobacco classes only
Comparison of underlying mortality rates and present value of expected claims for same risk classes as used in the reserve comparison

Copyright © 2007 by the American Academy of ActuariesThe Year in Review, November 2007 4Copyright © 2009 by the American Academy of ActuariesValuation Table Team Update to LHATFJune 11, 2009 4
Comparison of Net Level Premium Reserves using 2001 CSO to those using 1980 CSO
Products Compared:Whole Life – Issue ages 35, 45, 55 and 75Benefits at end of year Premiums at beginning of year Maturity at attained age 100
Reserves ignore deficiency reserves
Calculated using 4% valuation interest rate
Compared using ANB, Nonsmoker tables

Copyright © 2007 by the American Academy of ActuariesThe Year in Review, November 2007 5Copyright © 2009 by the American Academy of ActuariesValuation Table Team Update to LHATFJune 11, 2009 5
Comparison of Mortality Rates per 1,000 under 2001 CSO to 1980 CSO
Present value of claims determined as follows:Over years 1-20 and lifetime (i.e., to age 100)Using 5% discount rateLapse rate = 0% (no significant difference in results if lapses included)

Copyright © 2007 by the American Academy of ActuariesThe Year in Review, November 2007 6Copyright © 2009 by the American Academy of ActuariesValuation Table Team Update to LHATFJune 11, 2009 6
Mortality Comparison
Issue Ages 35, 45, 55 and 752001 CSO Preferred Structure Table, Male, Residual
SNS S&U ANBvs.
2001 CSO NS Ultimate ANBvs.
1980 CSO, NS Ultimate ANB

Copyright © 2007 by the American Academy of ActuariesThe Year in Review, November 2007 7Copyright © 2009 by the American Academy of ActuariesValuation Table Team Update to LHATFJune 11, 2009 7
Comparison of Underlying Mortality2001 CSO Residual SNS vs. 1980 CSO NS
Male Risks
Female Risks
35 45 55 75 35 45 55 751980 CSO MNS Ultimate ANB 38.57 87.90 209.82 653.81 166.50 249.16 364.80 664.712001 CSO Residual MSNS S&U 25.24 58.74 139.45 520.08 144.27 215.07 310.85 548.082001 CSO MNS Ultimate 26.17 63.28 156.27 592.37 141.35 215.38 320.90 611.60
Present Value of Claims, 5% Discount Rate, 0% LapseYears 1-20 Lifetime
35 45 55 75 35 45 55 751980 CSO FNS Ultimate ANB 33.79 67.39 144.72 591.21 145.32 216.16 314.96 612.152001 CSO Residual FSNS S&U 20.09 49.27 103.79 436.63 124.02 187.25 267.41 487.012001 CSO FNS Ultimate 21.37 51.82 119.09 486.74 121.52 185.59 276.55 532.06
Present Value of Claims, 5% Discount Rate, 0% LapseYears 1-20 Lifetime

Copyright © 2007 by the American Academy of ActuariesThe Year in Review, November 2007 8Copyright © 2009 by the American Academy of ActuariesValuation Table Team Update to LHATFJune 11, 2009 8
Male, IA 35, 2001 CSO SNS vs. 1980 NS Ultimate – Mortality
Male Age 35 NS Mortality Comparison
0123456789
101112
1 3 5 7 9 11 13 15 17 19 21 23 25
Duration
Qx
per 1
,000 2001 CSO SNS S&U
2001 CSO NS Ultimate1980 CSO NS Ultimate
Duration 1 5 10 20 AAge 95Ratio 1980 to 2001 S&U 291% 186% 160% 132% 123%Difference p/1,000 1.11 0.99 1.15 1.70 62.77
Ratio 1980 to 2001 Ult 155% 156% 146% 146% 123%Difference p/1,000 0.60 0.77 0.97 2.22 62.77
Comparison of Mortality Rate per 1,000 at Select Durations1980 CSO vs 2001 CSO SNS, Issue Age 35

Copyright © 2007 by the American Academy of ActuariesThe Year in Review, November 2007 9Copyright © 2009 by the American Academy of ActuariesValuation Table Team Update to LHATFJune 11, 2009 9
Female, IA 35, 2001 CSO SNS vs. 1980 NS Ultimate – Mortality
Female Age 35 NS Mortality Comparison
0123456789
1 3 5 7 9 11 13 15 17 19 21 23 25
Duration
Qx
per 1
,000 2001 CSO SNS S&U
2001 CSO NS Ultimate1980 CSO NS Ultimate
Duration 1 5 10 20 AAge 95Ratio 1980 to 2001 S&U 320% 244% 184% 121% 164%Difference p/1,000 1.01 1.14 1.28 1.00 124.40
Ratio 1980 to 2001 Ult 165% 171% 178% 134% 164%Difference p/1,000 0.58 0.80 1.23 1.43 124.40
Comparison of Mortality Rate per 1,000 at Select Durations1980 CSO vs 2001 CSO SNS, Issue Age 35

Copyright © 2007 by the American Academy of ActuariesThe Year in Review, November 2007 10
Copyright © 2009 by the American Academy of ActuariesValuation Table Team Update to LHATFJune 11, 2009 10
Male, IA 45, 2001 CSO SNS vs. 1980 NS Ultimate – Mortality
Male Age 45 NS Mortality Comparison
048
121620242832
1 3 5 7 9 11 13 15 17 19 21 23 25
Duration
Qx
per 1
,000 2001 CSO SNS S&U
2001 CSO NS Ultimate1980 CSO NS Ultimate
Duration 1 5 10 20 AAge 95Ratio 1980 to 2001 S&U 296% 196% 153% 132% 123%Difference p/1,000 2.20 2.22 2.46 4.56 62.77
Ratio 1980 to 2001 Ult 142% 147% 146% 136% 123%Difference p/1,000 0.99 1.45 2.22 5.07 62.77
Comparison of Mortality Rate per 1,000 at Select Durations1980 CSO vs 2001 CSO SNS, Issue Age 45

Copyright © 2007 by the American Academy of ActuariesThe Year in Review, November 2007 11
Copyright © 2009 by the American Academy of ActuariesValuation Table Team Update to LHATFJune 11, 2009 11
Female, IA 45, 2001 CSO SNS vs. 1980 NS Ultimate – Mortality
Female Age 45 NS Mortality Comparison
02468
101214161820
1 3 5 7 9 11 13 15 17 19 21 23 25
Duration
Qx
per 1
,000 2001 CSO SNS S&U
2001 CSO NS Ultimate1980 CSO NS Ultimate
Duration 1 5 10 20 AAge 95Ratio 1980 to 2001 S&U 322% 196% 144% 109% 164%Difference p/1,000 2.06 1.91 1.73 0.97 124.40
Ratio 1980 to 2001 Ult 175% 154% 134% 120% 164%Difference p/1,000 1.28 1.37 1.43 2.03 124.40
Comparison of Mortality Rate per 1,000 at Select Durations1980 CSO vs 2001 CSO SNS, Issue Age 45

Copyright © 2007 by the American Academy of ActuariesThe Year in Review, November 2007 12
Copyright © 2009 by the American Academy of ActuariesValuation Table Team Update to LHATFJune 11, 2009 12
Male, IA 55, 2001 CSO SNS vs. 1980 NS Ultimate – Mortality
Male Age 55 NS Mortality Comparison
0102030405060708090
1 3 5 7 9 11 13 15 17 19 21 23 25
Duration
Qx
per 1
,000 2001 CSO SNS S&U
2001 CSO NS Ultimate1980 CSO NS Ultimate
Duration 1 5 10 20 AAge 95Ratio 1980 to 2001 S&U 355% 224% 156% 136% 123%Difference p/1,000 5.62 6.36 6.85 13.93 62.77
Ratio 1980 to 2001 Ult 142% 142% 136% 146% 123%Difference p/1,000 2.32 3.37 5.07 16.65 62.77
Comparison of Mortality Rate per 1,000 at Select Durations1980 CSO vs 2001 CSO SNS, Issue Age 55

Copyright © 2007 by the American Academy of ActuariesThe Year in Review, November 2007 13
Copyright © 2009 by the American Academy of ActuariesValuation Table Team Update to LHATFJune 11, 2009 13
Female, IA 55, 2001 CSO SNS vs. 1980 NS Ultimate – Mortality
Female Age 55 Class 3 NS Mortality Comparison
0
10
20
30
40
50
60
1 3 5 7 9 11 13 15 17 19 21 23 25
Duration
Qx
per 1
,000 2001 CSO SNS S&U
2001 CSO NS Ultimate1980 CSO NS Ultimate
Duration 1 5 10 20 AAge 95Ratio 1980 to 2001 S&U 341% 195% 149% 123% 164%Difference p/1,000 4.33 3.88 4.01 6.19 124.40
Ratio 1980 to 2001 Ult 131% 117% 120% 136% 164%Difference p/1,000 1.45 1.14 2.03 8.74 124.40
Comparison of Mortality Rate per 1,000 at Select Durations1980 CSO vs 2001 CSO SNS, Issue Age 55

Copyright © 2007 by the American Academy of ActuariesThe Year in Review, November 2007 14
Copyright © 2009 by the American Academy of ActuariesValuation Table Team Update to LHATFJune 11, 2009 14
Male, IA 75, 2001 CSO SNS vs. 1980 NS Ultimate – Mortality
Male Age 75 NS Mortality Comparison
0100200300400500600700800900
1000
1 3 5 7 9 11 13 15 17 19 21 23 25
Duration
Qx
per 1
,000 2001 CSO SNS S&U
2001 CSO NS Ultimate1980 CSO NS Ultimate
Duration 1 5 10 20 AAge 95Ratio 1980 to 2001 S&U 373% 252% 181% 118% 124%Difference p/1,000 43.03 51.69 61.08 45.60 63.04
Ratio 1980 to 2001 Ult 147% 141% 132% 119% 123%Difference p/1,000 18.77 24.85 33.11 46.60 62.77
Comparison of Mortality Rate per 1,000 at Select Durations1980 CSO vs 2001 CSO SNS, Issue Age 75

Copyright © 2007 by the American Academy of ActuariesThe Year in Review, November 2007 15
Copyright © 2009 by the American Academy of ActuariesValuation Table Team Update to LHATFJune 11, 2009 15
Female, IA 75, 2001 CSO SNS vs. 1980 NS Ultimate – Mortality
Female Age 75 Class 3 NS Mortality Comparison
0100200300400500600700800900
1000
1 3 5 7 9 11 13 15 17 19 21 23 25
Duration
Qx
per 1
,000 2001 CSO SNS S&U
2001 CSO NS Ultimate1980 CSO NS Ultimate
Duration 1 5 10 20 AAge 95Ratio 1980 to 2001 S&U 341% 259% 171% 178% 185%Difference p/1,000 26.38 35.90 42.65 122.36 145.83
Ratio 1980 to 2001 Ult 140% 151% 157% 165% 164%Difference p/1,000 10.68 19.82 37.41 109.67 124.40
Comparison of Mortality Rate per 1,000 at Select Durations1980 CSO vs 2001 CSO SNS, Issue Age 75

Copyright © 2007 by the American Academy of ActuariesThe Year in Review, November 2007 16
Copyright © 2009 by the American Academy of ActuariesValuation Table Team Update to LHATFJune 11, 2009 16
Whole Life Reserve Comparison
Issue Ages 35, 45, 55, and 752001 CSO Residual SNS S&U and 2001 CSO NS
Ultimatevs.
1980 CSO NS Ultimate

Copyright © 2007 by the American Academy of ActuariesThe Year in Review, November 2007 17
Copyright © 2009 by the American Academy of ActuariesValuation Table Team Update to LHATFJune 11, 2009 17
Male, IA 35, Non-Smoker2001 CSO vs. 1980 CSO – Whole Life Reserves
NLP Reserves, Issue Age 35
0102030405060708090
100110120130
1 5 9 13 17 21 25 29 33 37 41 45 49 53 57 61 65
Duration
Res
erve 1980 CSO NS Ultimate
2001 CSO Residual SNS S&U2001 CSO NS Ultimate
Duration 1 5 10 20 30 40 50 NLP1980 CSO MNS Ult $0.00 $33.02 $65.49 $106.86 $121.22 $112.46 $86.15 10.72$ 2001 CSO MSNS S&U $0.00 $31.11 $61.58 $99.87 $114.02 $107.56 $85.81 9.26$ 2001 CSO MSNS Ult $0.00 $29.00 $57.99 $95.63 $110.34 $105.54 $85.47 9.04$
Ratio 2001 S&U to 80CSO 94% 94% 93% 94% 96% 100% 86%Ratio 2001 Ult to 80CSO 88% 89% 89% 91% 94% 99% 84%
Comparison of NLP Reserves at Select Durations1980 CSO vs 2001 CSO SNS, Issue Age 35

Copyright © 2007 by the American Academy of ActuariesThe Year in Review, November 2007 18
Copyright © 2009 by the American Academy of ActuariesValuation Table Team Update to LHATFJune 11, 2009 18
Female, IA 35, Non-Smoker2001 CSO vs. 1980 CSO – Whole Life Reserves
NLP Reserves, Issue Age 35
0102030405060708090
100110
1 5 9 13 17 21 25 29 33 37 41 45 49 53 57 61 65
Duration
Res
erve 1980 CSO NS Ultimate
2001 CSO Residual SNS S&U2001 CSO NS Ultimate
Duration 1 5 10 20 30 40 50 NLP1980 CSO FNS Ult $0.00 $28.21 $55.61 $90.55 $105.52 $103.86 $85.03 9.22$ 2001 CSO FSNS S&U $0.00 $27.07 $53.82 $87.08 $98.62 $95.37 $79.66 7.96$ 2001 CSO FSNS Ult $0.00 $24.99 $50.17 $82.98 $95.32 $93.39 $79.11 7.77$
Ratio 2001 S&U to 80CSO 96% 97% 96% 93% 92% 94% 86%Ratio 2001 Ult to 80CSO 89% 90% 92% 90% 90% 93% 84%
Comparison of NLP Reserves at Select Durations1980 CSO vs 2001 CSO SNS, Issue Age 35

Copyright © 2007 by the American Academy of ActuariesThe Year in Review, November 2007 19
Copyright © 2009 by the American Academy of ActuariesValuation Table Team Update to LHATFJune 11, 2009 19
Male, IA 45, Non-Smoker2001 CSO vs. 1980 CSO – Whole Life Reserves
NLP Reserves, Issue Age 45
0153045607590
105120135150165180
1 4 7 10 13 16 19 22 25 28 31 34 37 40 43 46 49 52 55
Duration
Res
erve 1980 CSO NS Ultimate
2001 CSO Residual SNS S&U2001 CSO NS Ultimate
Duration 1 5 10 20 30 40 50 NLP1980 CSO MNS Ult $0.00 $49.64 $96.48 $148.07 $152.56 $122.25 $70.66 16.85$ 2001 CSO MSNS S&U $0.00 $46.87 $90.96 $139.40 $146.47 $122.07 $75.31 14.23$ 2001 CSO MSNS Ult $0.00 $43.34 $85.55 $133.82 $142.47 $121.20 $75.30 14.22$
Ratio 2001 S&U to 80CSO 94% 94% 94% 96% 100% 107% 84%Ratio 2001 Ult to 80CSO 87% 89% 90% 93% 99% 107% 84%
1980 CSO vs 2001 CSO SNS, Issue Age 45Comparison of NLP Reserves at Select Durations
Copyright © 2007 by the American Academy of ActuariesThe Year in Review, November 2007 20
Copyright © 2009 by the American Academy of ActuariesValuation Table Team Update to LHATFJune 11, 2009 20
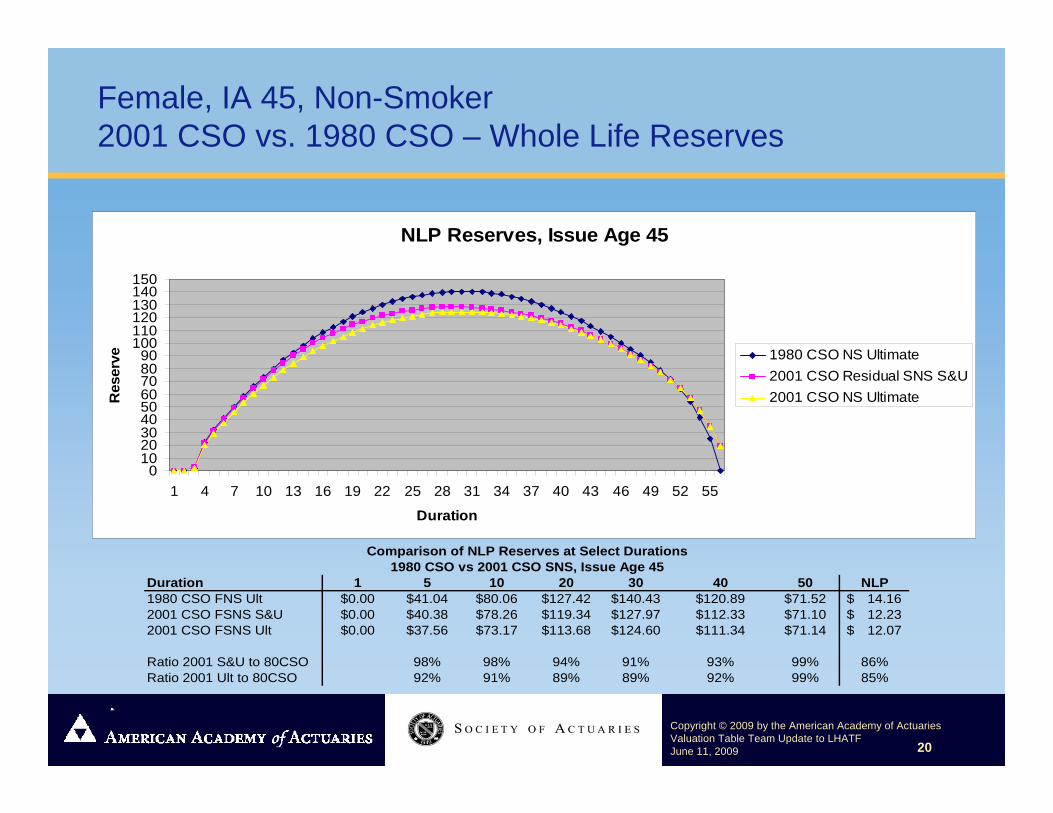
Female, IA 45, Non-Smoker2001 CSO vs. 1980 CSO – Whole Life Reserves
NLP Reserves, Issue Age 45
0102030405060708090
100110120130140150
1 4 7 10 13 16 19 22 25 28 31 34 37 40 43 46 49 52 55
Duration
Res
erve 1980 CSO NS Ultimate
2001 CSO Residual SNS S&U2001 CSO NS Ultimate
Duration 1 5 10 20 30 40 50 NLP1980 CSO FNS Ult $0.00 $41.04 $80.06 $127.42 $140.43 $120.89 $71.52 14.16$ 2001 CSO FSNS S&U $0.00 $40.38 $78.26 $119.34 $127.97 $112.33 $71.10 12.23$ 2001 CSO FSNS Ult $0.00 $37.56 $73.17 $113.68 $124.60 $111.34 $71.14 12.07$
Ratio 2001 S&U to 80CSO 98% 98% 94% 91% 93% 99% 86%Ratio 2001 Ult to 80CSO 92% 91% 89% 89% 92% 99% 85%
1980 CSO vs 2001 CSO SNS, Issue Age 45Comparison of NLP Reserves at Select Durations

Copyright © 2007 by the American Academy of ActuariesThe Year in Review, November 2007 21
Copyright © 2009 by the American Academy of ActuariesValuation Table Team Update to LHATFJune 11, 2009 21
Male, IA 55, Non-Smoker2001 CSO vs. 1980 CSO – Whole Life Reserves
NLP Reserves, Issue Age 55
020406080
100120140160180200220
1 3 5 7 9 11 13 15 17 19 21 23 25 27 29 31 33 35 37 39 41 43 45
Duration
Res
erve 1980 CSO NS Ultimate
2001 CSO Residual SNS S&U2001 CSO NS Ultimate
Duration 1 5 10 20 30 40 NLP1980 CSO MNS Ult $0.00 $74.03 $137.31 $189.54 $167.21 $100.42 27.67$ 2001 CSO MSNS S&U $0.00 $70.96 $133.85 $185.66 $168.91 $107.56 22.24$ 2001 CSO MSNS Ult $0.00 $64.98 $122.47 $175.66 $165.81 $107.06 23.19$
Ratio 2001 S&U to 80CSO 96% 97% 98% 101% 107% 80%Ratio 2001 Ult to 80CSO 88% 89% 93% 99% 107% 84%
Comparison of NLP Reserves at Select Durations1980 CSO vs 2001 CSO SNS, Issue Age 55

Copyright © 2007 by the American Academy of ActuariesThe Year in Review, November 2007 22
Copyright © 2009 by the American Academy of ActuariesValuation Table Team Update to LHATFJune 11, 2009 22
Female, IA 55, Non-Smoker2001 CSO vs. 1980 CSO – Whole Life Reserves
NLP Reserves, Issue Age 55
020406080
100120140160180200
1 3 5 7 9 11 13 15 17 19 21 23 25 27 29 31 33 35 37 39 41 43 45
Duration
Res
erve 1980 CSO NS Ultimate
2001 CSO Residual SNS S&U2001 CSO NS Ultimate
Duration 1 5 10 20 30 40 NLP1980 CSO FNS Ult $0.00 $60.99 $117.40 $174.95 $166.64 $102.51 22.44$ 2001 CSO FSNS S&U $0.00 $58.86 $112.42 $160.79 $154.13 $101.21 18.49$ 2001 CSO FSNS Ult $0.00 $53.27 $100.84 $150.85 $150.64 $100.67 19.23$
Ratio 2001 S&U to 80CSO 97% 96% 92% 92% 99% 82%Ratio 2001 Ult to 80CSO 87% 86% 86% 90% 98% 86%
1980 CSO vs 2001 CSO SNS, Issue Age 55Comparison of NLP Reserves at Select Durations

Copyright © 2007 by the American Academy of ActuariesThe Year in Review, November 2007 23
Copyright © 2009 by the American Academy of ActuariesValuation Table Team Update to LHATFJune 11, 2009 23
Male, IA 75, Non-Smoker2001 CSO vs. 1980 CSO – Whole Life Reserves
NLP Reserves, Issue Age 75
020406080
100120140160180200220240260280
1 2 3 4 5 6 7 8 9 10 11 12 13 14 15 16 17 18 19 20 21 22 23 24 25 26
Duration
Res
erve 1980 CSO NS Ultimate
2001 CSO Residual SNS S&U2001 CSO NS Ultimate
Duration 1 5 10 20 NLP1980 CSO MNS Ult $0.00 $140.71 $206.93 $171.62 84.95$ 2001 CSO MSNS S&U $0.00 $140.26 $233.65 $201.42 54.22$ 2001 CSO MSNS Ult $0.00 $134.56 $208.68 $184.53 69.72$
Ratio 2001 S&U to 80CSO 100% 113% 117% 64%Ratio 2001 Ult to 80CSO 96% 101% 108% 82%
Comparison of NLP Reserves at Select Durations1980 CSO vs 2001 CSO SNS, Issue Age 75

Copyright © 2007 by the American Academy of ActuariesThe Year in Review, November 2007 24
Copyright © 2009 by the American Academy of ActuariesValuation Table Team Update to LHATFJune 11, 2009 24
Female, IA 75, Non-Smoker2001 CSO vs. 1980 CSO – Whole Life Reserves
NLP Reserves, Issue Age 75
020406080
100120140160180200220240
1 2 3 4 5 6 7 8 9 10 11 12 13 14 15 16 17 18 19 20 21 22 23 24 25 26
Duration
Res
erve 1980 CSO NS Ultimate
2001 CSO Residual SNS S&U2001 CSO NS Ultimate
Duration 1 5 10 20 NLP1980 CSO FNS Ult $0.00 $136.37 $214.32 $183.44 68.70$ 2001 CSO FSNS S&U $0.00 $126.35 $211.15 $174.19 45.02$ 2001 CSO FSNS Ult $0.00 $110.62 $183.07 $172.55 53.12$
Ratio 2001 S&U to 80CSO 93% 99% 95% 66%Ratio 2001 Ult to 80CSO 81% 85% 94% 77%
1980 CSO vs 2001 CSO SNS, Issue Age 75Comparison of NLP Reserves at Select Durations