Embed Size (px)
Citation preview

156 Korean J Radiol 7(3), September 2006
Comparison of 1.5T and 3T 1H MRSpectroscopy for Human Brain Tumors
Objective: We wanted to estimate the practical improvements of 3T proton MRspectroscopy (1H MRS) as compared with 1.5T 1H MRS for the evaluation ofhuman brain tumors.
Materials and Methods: Single voxel 1H MRS was performed at both 1.5T and3T in 13 patients suffering with brain tumors. Using the same data acquisitionparameters at both field strengths, the 1H MRS spectra were obtained with a shortecho time (TE) (35 msec) and an intermediate TE (144 msec) with the voxel sizeranging from 2.0 cm3 to 8.7 cm3. The signal to noise ratios (SNRs) of the metabo-lites (myoinositol [MI], choline compounds [Cho], creatine /phosphocreatine [Cr],N-acetyl-aspartate [NAA], lipid and lactate [LL]) and the metabolite ratios ofMI/Cr, Cho/Cr, Cho/NAA and LL/Cr were compared at both TEs between the twofield strengths in each brain tumor. The degrees of spectral resolution betweenthe Cho and Cr peaks were qualitatively compared between the two fieldstrengths in each brain tumor.
Results: The SNRs of the metabolites at 3T demonstrated 49 73% increaseat a short TE (p < 0.01) and only 2 12% increase at an intermediate TE (p >0.05) compared with those of 1.5T. The SNR of inverted lactate at an intermedi-ate TE decreased down to 49% with poorer inversion at 3T (p < 0.05). There wasno significant difference in the metabolite ratios between the two field strengths.The degrees of the spectral resolution at 3T were slightly superior to those of1.5T at a short TE.
Conclusion: As compared with 1.5T, 3T 1H MRS demonstrated 49 73% SNRincrease in the cerebral metabolites and slightly superior spectral resolution onlyat a short TE, but little at an intermediate TE, in the brain tumors. There was nosignificant difference in the metabolite ratios between the two field strengths.
n vivo proton magnetic resonance spectroscopy (1H MRS) providescompletely different information on the basic metabolic processes such ascell proliferation or degradation, energy metabolism, neuronal integrity
and necrotic transformation of the brain tumor tissues, and this stands in contrast tothe methods that provide structural data, such as MRI, CT and angiography (1 3).
The spectroscopic studies on brain tumors have been attempted to characterize thedifferent histologic types and predict the degree of malignancy of the gliomas.Noninvasive grading is especially important for the tumors in the eloquent areas or forthe deeply located tumors. However, despite the expectations of noninvasivelycharacterizing tumor by performing clinical 1H MRS, some of previous studies haveyielded rather disappointing results that there was no reliable indicator for discriminat-ing among the tumor types or among the malignant and benign neoplasms (2, 4, 5).
Ji-hoon Kim, MD1
Kee-Hyun Chang, MD2-4
Dong Gyu Na, MD2
In Chan Song, PhD2,3
Seung Ja Kim, MD2
Bae Ju Kwon, MD2
Moon Hee Han, MD2-4
Index terms:Brain tumors Magnetic resonance (MR) Spectroscopy
Korean J Radiol 2006;7:156-161Received December 3, 2005; accepted after revision February 17, 2006.
1Department of Radiology, SeoulMunicipal Boramae Hospital Affiliated toSeoul National University Hospital, Seoul156-707; 2Department of Radiology,Seoul National University College ofMedicine, Seoul 110-744; 3the Institute ofRadiation Medicine, Seoul 110-744;4Neuroscience Research Institute, SeoulNational University Medical ResearchCenter, Seoul 110-744, Korea
This research was supported by a grant(04-2003-031-0) from the Seoul NationalUniversity Hospital, Korea.
Address reprint requests to:Kee-Hyun Chang, MD, Department ofDiagnostic Radiology, Seoul NationalUniversity Hospital, 28 Yongon-dong,Chongno-gu, Seoul 110-744, KoreaTel. (822) 2072-2584Fax. (822) 743-6385e-mail: [email protected]
I
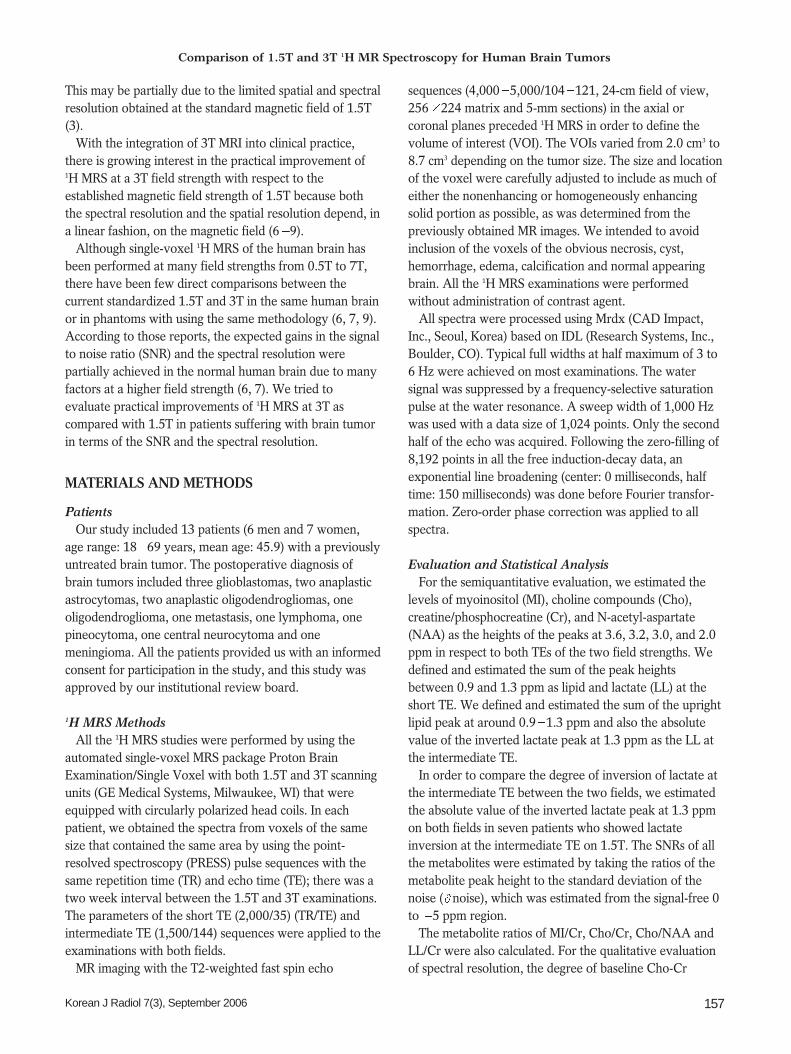
This may be partially due to the limited spatial and spectralresolution obtained at the standard magnetic field of 1.5T(3).
With the integration of 3T MRI into clinical practice,there is growing interest in the practical improvement of1H MRS at a 3T field strength with respect to theestablished magnetic field strength of 1.5T because boththe spectral resolution and the spatial resolution depend, ina linear fashion, on the magnetic field (6 9).
Although single-voxel 1H MRS of the human brain hasbeen performed at many field strengths from 0.5T to 7T,there have been few direct comparisons between thecurrent standardized 1.5T and 3T in the same human brainor in phantoms with using the same methodology (6, 7, 9).According to those reports, the expected gains in the signalto noise ratio (SNR) and the spectral resolution werepartially achieved in the normal human brain due to manyfactors at a higher field strength (6, 7). We tried toevaluate practical improvements of 1H MRS at 3T ascompared with 1.5T in patients suffering with brain tumorin terms of the SNR and the spectral resolution.
MATERIALS AND METHODS
PatientsOur study included 13 patients (6 men and 7 women,
age range: 18 69 years, mean age: 45.9) with a previouslyuntreated brain tumor. The postoperative diagnosis ofbrain tumors included three glioblastomas, two anaplasticastrocytomas, two anaplastic oligodendrogliomas, oneoligodendroglioma, one metastasis, one lymphoma, onepineocytoma, one central neurocytoma and onemeningioma. All the patients provided us with an informedconsent for participation in the study, and this study wasapproved by our institutional review board.
1H MRS MethodsAll the 1H MRS studies were performed by using the
automated single-voxel MRS package Proton BrainExamination/Single Voxel with both 1.5T and 3T scanningunits (GE Medical Systems, Milwaukee, WI) that wereequipped with circularly polarized head coils. In eachpatient, we obtained the spectra from voxels of the samesize that contained the same area by using the point-resolved spectroscopy (PRESS) pulse sequences with thesame repetition time (TR) and echo time (TE); there was atwo week interval between the 1.5T and 3T examinations.The parameters of the short TE (2,000/35) (TR/TE) andintermediate TE (1,500/144) sequences were applied to theexaminations with both fields.
MR imaging with the T2-weighted fast spin echo
sequences (4,000 5,000/104 121, 24-cm field of view,256 224 matrix and 5-mm sections) in the axial orcoronal planes preceded 1H MRS in order to define thevolume of interest (VOI). The VOIs varied from 2.0 cm3 to8.7 cm3 depending on the tumor size. The size and locationof the voxel were carefully adjusted to include as much ofeither the nonenhancing or homogeneously enhancingsolid portion as possible, as was determined from thepreviously obtained MR images. We intended to avoidinclusion of the voxels of the obvious necrosis, cyst,hemorrhage, edema, calcification and normal appearingbrain. All the 1H MRS examinations were performedwithout administration of contrast agent.
All spectra were processed using Mrdx (CAD Impact,Inc., Seoul, Korea) based on IDL (Research Systems, Inc.,Boulder, CO). Typical full widths at half maximum of 3 to6 Hz were achieved on most examinations. The watersignal was suppressed by a frequency-selective saturationpulse at the water resonance. A sweep width of 1,000 Hzwas used with a data size of 1,024 points. Only the secondhalf of the echo was acquired. Following the zero-filling of8,192 points in all the free induction-decay data, anexponential line broadening (center: 0 milliseconds, halftime: 150 milliseconds) was done before Fourier transfor-mation. Zero-order phase correction was applied to allspectra.
Evaluation and Statistical AnalysisFor the semiquantitative evaluation, we estimated the
levels of myoinositol (MI), choline compounds (Cho),creatine/phosphocreatine (Cr), and N-acetyl-aspartate(NAA) as the heights of the peaks at 3.6, 3.2, 3.0, and 2.0ppm in respect to both TEs of the two field strengths. Wedefined and estimated the sum of the peak heightsbetween 0.9 and 1.3 ppm as lipid and lactate (LL) at theshort TE. We defined and estimated the sum of the uprightlipid peak at around 0.9 1.3 ppm and also the absolutevalue of the inverted lactate peak at 1.3 ppm as the LL atthe intermediate TE.
In order to compare the degree of inversion of lactate atthe intermediate TE between the two fields, we estimatedthe absolute value of the inverted lactate peak at 1.3 ppmon both fields in seven patients who showed lactateinversion at the intermediate TE on 1.5T. The SNRs of allthe metabolites were estimated by taking the ratios of themetabolite peak height to the standard deviation of thenoise ( noise), which was estimated from the signal-free 0to 5 ppm region.
The metabolite ratios of MI/Cr, Cho/Cr, Cho/NAA andLL/Cr were also calculated. For the qualitative evaluationof spectral resolution, the degree of baseline Cho-Cr
Comparison of 1.5T and 3T 1H MR Spectroscopy for Human Brain Tumors
Korean J Radiol 7(3), September 2006 157
separation was also visually evaluated. The 3T/1.5T ratiosof each metabolite’s SNR and the metabolite ratios at bothfields were described as means standard deviations (SD).
SPSS (version 11.0; SPSS Inc, Chicago, lL) was used forstatistical analysis.
Nonparametric tests were applied throughout, as thenumber of cases was not sufficiently high to assume anormal distribution. The Wilcoxson signed rank tests formatched pairs were performed to compare the SNRs of themetabolites and the metabolite ratios at both TEs betweenthe 1.5T and 3T. P values less than 0.05 were consideredto indicate a statistically significant difference.
RESULTS
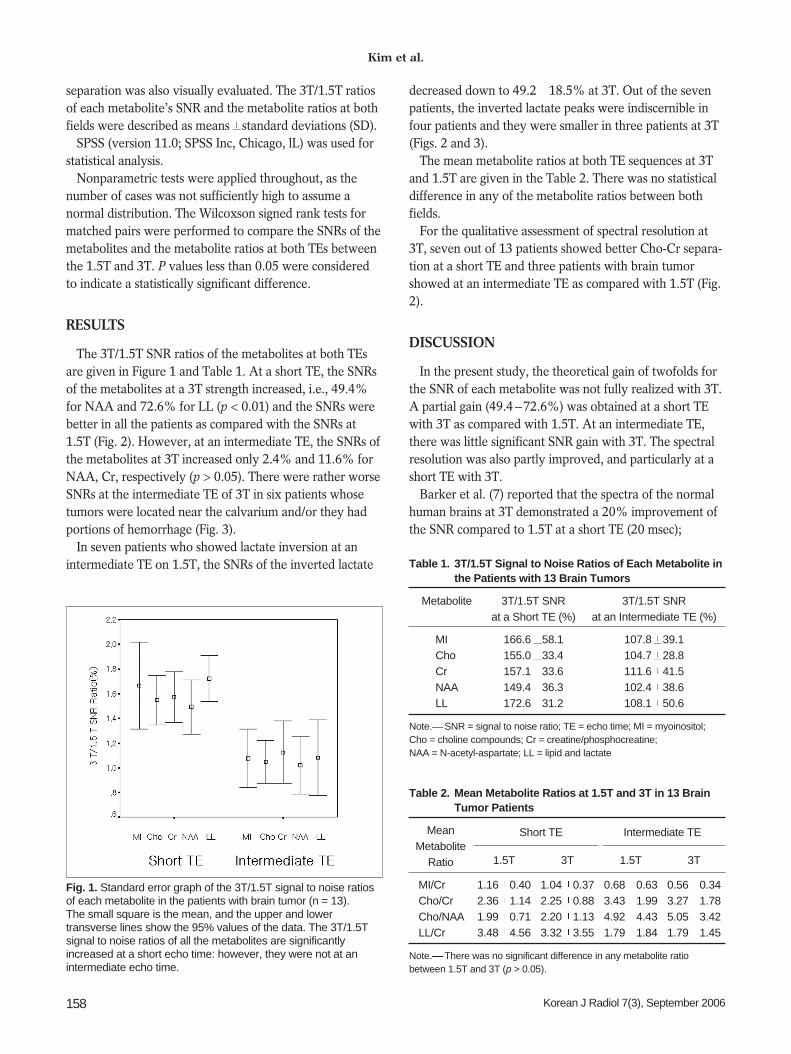
The 3T/1.5T SNR ratios of the metabolites at both TEsare given in Figure 1 and Table 1. At a short TE, the SNRsof the metabolites at a 3T strength increased, i.e., 49.4%for NAA and 72.6% for LL (p < 0.01) and the SNRs werebetter in all the patients as compared with the SNRs at1.5T (Fig. 2). However, at an intermediate TE, the SNRs ofthe metabolites at 3T increased only 2.4% and 11.6% forNAA, Cr, respectively (p > 0.05). There were rather worseSNRs at the intermediate TE of 3T in six patients whosetumors were located near the calvarium and/or they hadportions of hemorrhage (Fig. 3).
In seven patients who showed lactate inversion at anintermediate TE on 1.5T, the SNRs of the inverted lactate
decreased down to 49.2 18.5% at 3T. Out of the sevenpatients, the inverted lactate peaks were indiscernible infour patients and they were smaller in three patients at 3T(Figs. 2 and 3).
The mean metabolite ratios at both TE sequences at 3Tand 1.5T are given in the Table 2. There was no statisticaldifference in any of the metabolite ratios between bothfields.
For the qualitative assessment of spectral resolution at3T, seven out of 13 patients showed better Cho-Cr separa-tion at a short TE and three patients with brain tumorshowed at an intermediate TE as compared with 1.5T (Fig.2).
DISCUSSION
In the present study, the theoretical gain of twofolds forthe SNR of each metabolite was not fully realized with 3T.A partial gain (49.4 72.6%) was obtained at a short TEwith 3T as compared with 1.5T. At an intermediate TE,there was little significant SNR gain with 3T. The spectralresolution was also partly improved, and particularly at ashort TE with 3T.
Barker et al. (7) reported that the spectra of the normalhuman brains at 3T demonstrated a 20% improvement ofthe SNR compared to 1.5T at a short TE (20 msec);
Kim et al.
158 Korean J Radiol 7(3), September 2006
Fig. 1. Standard error graph of the 3T/1.5T signal to noise ratiosof each metabolite in the patients with brain tumor (n = 13).The small square is the mean, and the upper and lowertransverse lines show the 95% values of the data. The 3T/1.5Tsignal to noise ratios of all the metabolites are significantlyincreased at a short echo time: however, they were not at anintermediate echo time.
Table 2. Mean Metabolite Ratios at 1.5T and 3T in 13 BrainTumor Patients
Mean Short TE Intermediate TEMetabolite
Ratio 1.5T 3T 1.5T 3T
MI/Cr 1.16 0.40 1.04 0.37 0.68 0.63 0.56 0.34Cho/Cr 2.36 1.14 2.25 0.88 3.43 1.99 3.27 1.78Cho/NAA 1.99 0.71 2.20 1.13 4.92 4.43 5.05 3.42LL/Cr 3.48 4.56 3.32 3.55 1.79 1.84 1.79 1.45
Note. There was no significant difference in any metabolite ratio between 1.5T and 3T (p > 0.05).
Table 1. 3T/1.5T Signal to Noise Ratios of Each Metabolite inthe Patients with 13 Brain Tumors
Metabolite 3T/1.5T SNR 3T/1.5T SNR at a Short TE (%) at an Intermediate TE (%)
MI 166.6 58.1 107.8 39.1Cho 155.0 33.4 104.7 28.8Cr 157.1 33.6 111.6 41.5NAA 149.4 36.3 102.4 38.6LL 172.6 31.2 108.1 50.6
Note. SNR = signal to noise ratio; TE = echo time; MI = myoinositol; Cho = choline compounds; Cr = creatine/phosphocreatine; NAA = N-acetyl-aspartate; LL = lipid and lactate

however the spectra at a long TE (272 msec) exhibited asimilar SNR at both field strengths with using thestimulated-echo acquisition mode (STEAM) sequences.Despite the expected advantages that should be obtainedwith using high strength fields, the limited SNR improve-ments might be explained by many factors. They includeincreased magnetic field inhomogeneity, poorer radiofre-quency coil efficiency, poorer shimming and differentrelaxation times (6, 7, 9, 10). Therefore, in order to realizethe theoretical improvements, these factors should beovercome and adjusted for at a field strength of 3T.
The T1 relaxation times increase at higher fields, leadingto increased signal saturation for a given TR. To maintainthe same level of saturation, the acquisition TR should belengthened with increasing the total acquisition times ordecreasing the signal averaging in the same total acquisi-tion time. As the T2 relaxation times decrease at higherfields, the TE should be shortened. However the optimal
TR and TE at 3T have not yet been well established. Barker et al. (7) explained that the similar SNR at a long
TE on both fields was because the long TE sequence wasmore influenced by the decreased T2 relaxation time in thehigh field than it being influenced by the short TEsequence.
The SNR gain seen at a short TE in the present study waslarger than that of Barker’s study. This was presumablybecause for PRESS, there was much less signal loss of thecoupled spin signals than for STEAM (11, 12).
Gonen et al. (6) reported that there was a 23 46% SNRgain at a TE of 135 ms with 3T versus 1.5T in the 3Dchemical shift imaging with using the PRESS sequence inthe normal human brain, and this is in contrast to theresults of the small SNR gain at an intermediate TE in thepresent study with brain tumor patients. It is postulatedthat the tumor’s own heterogeneity might offset theexpected gain of the SNR as compared with the normal
Comparison of 1.5T and 3T 1H MR Spectroscopy for Human Brain Tumors
Korean J Radiol 7(3), September 2006 159
Fig. 2. A 40-year-old woman withanaplastic astrocytoma. A. The axial T2-weighted imagereveals a mass of high signal intensitywith a square voxel (7.1 cm3) at theleft high frontal lobe. B. The 1H MR spectrum obtained at ashort TE on 1.5T shows markedlyincreased Cho/Cr, decreased NAA/Crand increased lipid and lactate. C. The 1H MR spectrum obtained atan intermediate TE on 1.5T shows aninverted lactate peak at 1.3 ppm inaddition to increased Cho/Cr. D. The 1H MR spectrum obtained at ashort TE on 3T shows a better SNRand better spectral resolution betweenCho and Cr than on 1.5T (B), and it isotherwise similar to 1.5T (B).
A B C
E. The 1H MR spectrum obtained at an intermediate TE on 3T shows an inverted lactate peak at 1.3 ppm that is significantly smaller thanthat of 1.5T (C).
D E

human brain at the intermediate or long TE sequences.Tumors are inherently heterogeneous and their spectrahave been described as a combination of viable tumor withboth necrotic and cystic tissue, as well as the infiltration ofthe normal brain tissue. The involvement of paramagneticmaterial in tumor tissue such as intratumoral microscopichemorrhage may also cause a susceptibility effect and socause T2 shortening. Blood vessels and cerebrospinal fluidincrease the magnetic susceptibility effect by pulsation aswell (12, 13).
As for the inverted lactate peak at 1.3 ppm of theintermediate TE spectrum, the SNR on 3T was rather muchsmaller than that of 1.5T in the present study. This mightbe related to the increased susceptibility and the T2shortening effect with 3T.
For lactate inversion, the intermediate TE value used at
1.5T might not be appropriate at 3T. Because there was nosignificant difference in the metabolite ratios (MI/Cr,Cho/Cr, Cho/NAA and LL/Cr) between the two fields, wemay well apply the established methods of 1.5T concern-ing the metabolite ratios for the evaluation of brain tumorsat 3T.
CONCLUSION
For the 3T 1H MRS of brain tumors, there were 49 73%SNR increases of the major cerebral metabolites and alsobetter spectral resolution (n = 7/13) at a short TE (35msec): however, little at an intermediate TE (144 msec),compared with 1.5T. The SNR of inverted lactate at anintermediate TE decreased to 49% at 3T. There was nosignificant difference in the metabolite ratios of MI/Cr,
Kim et al.
160 Korean J Radiol 7(3), September 2006
Fig. 3. A 49-year-old man withanaplastic oligodendroglioma.A. The axial T2-weighted imagereveals a heterogenous mass withprobable hemorrhagic portion in theright frontal lobe. A rectangular voxel(2.3 cm3) contains the solid tumorportion, including a small possiblyhemorrhagic area, and it is locatedclose to the calvarium.B. The 1H MR spectrum obtained at ashort TE on 1.5T shows slightlyelevated Cho/Cr and decreasedNAA/Cr with many noisy signals.C. The 1H MR spectrum obtained at anintermediate TE on 1.5T showselevated Cho/Cr, decreased NAA/Crand an inverted lactate peak (1.3 ppm).D. The 1H MR spectrum obtained at a
A B C
short TE on 3T shows slightly elevated Cho/Cr and decreased NAA/Cr with a slightly better SNR and shimming compared with the 1.5T(B).E. The 1H MR spectrum obtained at an intermediate TE on 3T shows much more noise than that of the 1.5T (C) and there is nodiscernible inverted lactate peak at 1.3 ppm, and this is presumably due to the high susceptibility effect secondary to probable intratu-moral hemorrhage and the close proximity to the calvarium.
D E

Comparison of 1.5T and 3T 1H MR Spectroscopy for Human Brain Tumors
Korean J Radiol 7(3), September 2006 161
Cho/Cr, Cho/NAA and LL/Cr between 1.5T and 3T.
References1. Moller-Hartmann W, Herminghaus S, Krings T, Marquardt G,
Lanfermann H, Pilatus U, et al. Clinical application of protonmagnetic resonance spectroscopy in the diagnosis of intracranialmass lesions. Neuroradiology 2002;44:371-81
2. Shimizu H, Kumabe T, Tominaga T, Kayama T, Hara K, Ono Y,et al. Noninvasive evaluation of malignancy of brain tumorswith proton MR spectroscopy. AJNR Am J Neuroradiol1996;17:737-747
3. Rabinov JD, Lee PL, Barker FG, Louis DN, Harsh GR,Cosgrove GR, et al. In vivo 3-T MR spectroscopy in the distinc-tion of recurrent glioma versus radiation effects: initial experi-ence. Radiology 2002;225:871-879
4. Ott D, Hennig J, Ernst T. Human brain tumor: assessment within vivo proton MR spectroscopy. Radiology 1993;186:745-752
5. Barker PB, Glickson JD, Bryan RN. In vivo magnetic resonancespectroscopy of human brain tumors. Top Magn Reson Imaging1993;5:32-45
6. Gonen O, Gruber S, Li BS, Mlynarik V, Moser E. Multivoxel 3Dproton spectroscopy in the brain at 1.5 versus 3.0T: signal-to-noise ratio and resolution comparison. AJNR Am J Neuroradiol2001;22:1727-1731
7. Barker PB, Hearshen DO, Boska MD. Single-voxel proton MRSof the human brain at 1.5T and 3.0T. Magn Reson Med 2001;
45:765-7698. Gruber S, Mlynarik V, Moser E. High-resolution 3D proton
spectroscopic imaging of the human brain at 3T: SNR issues andapplication for anatomy-matched voxel sizes. Magn Reson Med2003;49:299-306
9. Kantarci K, Reynolds G, Petersen RC, Boeve BF, Knopman DS,Edland SD, et al. Proton MR spectroscopy in mild cognitiveimpairment and Alzheimer disease: comparison of 1.5 and 3T.AJNR Am J Neuroradiol 2003;24:843-849
10. Bartha R, Drost DJ, Menon RS, Williamson PC. Comparison ofthe quantification precision of human short echo time 1Hspectroscopy at 1.5 and 4.0 tesla. Magn Reson Med2000;44:185-192
11. Kaminogo M, Ishimaru H, Morikawa M, Ochi M, Ushijima R,Tani M, et al. Diagnostic potential of short echo time MRspectroscopy of gliomas with single-voxel and point-resolvedspatially localised proton spectroscopy of brain. Neuroradiology2001;43:353-363
12. Howe FA, Barton SJ, Cudlip SA, Stubbs M, Saunders DE,Murphy M, et al. Metabolic profiles of human brain tumorsusing quantitative in vivo 1H magnetic resonance spectroscopy.Magn Reson Med 2003;49:223-232
13. Isobe T, Matsumura A, Anno I, Yoshizawa T, Nagatomo Y, ItaiY, et al. Quantification of cerebral metabolites in glioma patientswith proton MR spectroscopy using T2 relaxation time correc-tion. Magn Reson Imaging 2002;20:343-349


![3T]caP[[h ]Tgc [TeT[ 3T[TQaPcT - Novotel Sydney Central · 3t[tqapct 3t]cap[[h 5if(spwf$pdlubjm1bdlbhf qfsqfstpo ipvsdbobqft ipvstpgcfwfsbhft $pdlubjm1bdlbhf qfsqfstpo ipvstpgefmjdjpvt{dbobqft{](https://img.pdfslide.us/doc/110x75/5f6aa72c2199805f6a1a97e5/3tcaph-tgc-tet-3ttqapct-novotel-sydney-central-3ttqapct-3tcaph-5ifspwfpdlubjm1bdlbhf.jpg)