Embed Size (px)
Citation preview
Mechanics & Industry 16, 609 (2015)c© AFM, EDP Sciences 2015DOI: 10.1051/meca/2015036www.mechanics-industry.org
Mechanics&Industry
Comparison between mixed ceramic and reinforced ceramic toolsin terms of cutting force components modelling and optimizationwhen machining hardened steel AISI 4140 (60 HRC)
B. Fnides1,2,a, H. Aouici3, M. Elbah4, S. Boutabba2 and L. Boulanouar5
1 Departement de Construction Mecanique et Productique (CMP), FGM&GP, Universite des Sciences et de laTechnologie Houari Boumediene (USTHB), BP 32 El-Alia, Bab-Ezzouar, 16111 Alger, Algerie
2 Laboratoire Mecanique Appliquee des Nouveaux Materiaux (LMANM), Universite 08 mai 1945-Guelma, BP 401,24000 Guelma, Algerie
3 Ecole Nationale Superieure de Technologie (ENST) – ex CT siege DG. SNVI, R. N◦ 5 Z.I. Rouiba, Alger, Algerie4 Laboratoire Mecanique et Structures (LMS), Universite 08 mai 1945-Guelma, BP 401 Guelma,
24000, Algerie5 LRTAPM, Universite Badji-Moukhtar, BP 12, 23000 Annaba, Algerie
Received 23 June 2014, Accepted 17 Mai 2015
Abstract – This paper describes a comparison between mixed ceramic [Al2O3 (70%) + TiC (30%)] andreinforced ceramic [Al2O3 (75%) + SiC (25%)] tools in terms of cutting force components when machiningin dry hard turning AISI 4140 steel, hardened to 60 HRC. The response surface methodology (RSM) andthe analysis of variance (ANOVA) are applied to investigate effects of cutting speed, feed rate and depth ofcut on cutting force components in order to model and optimize these technological parameters. Results ofthis study indicate that the machining with the mixed ceramic insert generates lower values of cutting forcecomponents than reinforced ceramic insert. Consequently, the mixed ceramic CC650 is the most powerfultool. The developed models can be used in the metal machining industries and would be helpful in selectingcutting variables for optimization of hard cutting process.
Key words: Ceramic / hard turning / AISI 4140 / cutting force / ANOVA / RSM
1 Introduction
Hard turning is a turning operation which is appliedon high resistance alloy steels (45 < HRC < 70) to ob-tain surface roughness values that are close to those ob-tained in grinding (Ra ≈ 0.1 μm). The workpiece mate-rials involved include various hardened alloy steels, toolsteels, case-hardened steels, super alloys, nitride irons andhard-chrome-coated steels, and heat-treated powder met-allurgical parts. Although this production method is anew subject, there are quite a few studies by several re-searchers in the literature. These studies mostly concernthe turning of AISI 52100 bearing steel, H11–H13 hotwork tool steel, and AISI 4130–4340 low alloy steel usingCBN, ceramic, and coated carbide tools [1–4].
Alumina (Al2O3) based ceramics are considered tobe one of the most suitable tool materials for machin-ing hardened steels because of their high hot hardness,wear resistance and chemical inertness. However, the ce-ramic tools possess a high degree of brittleness and lowthermal shock resistance which may result in excessive
a Corresponding author: [email protected]
chipping or fracture thereby reducing tool life. In order toimprove their toughness, alumina (Al2O3) based ceram-ics are usually reinforced with TiC, TiN, Ti(C, N), SiC,or TiB2 additions. Alumina reinforced with SiC whiskersis the toughest and most resistant to thermal shock ofthe Al2O3-based ceramics. This whisker reinforcementimproves the notch resistance of the insert. The end re-sult is a ceramic insert that can run at speeds five to sixtimes that of conventional carbide insert in nickel-basedmaterials. As an added benefit, the toughness of the SiCwhiskers also makes this category of ceramic available formachining harder materials with interruptions [5].
The productivity in terms of volume chip carved ofsix cutting tools was investigated for two different cut-ting conditions in straight hard turning of X38CrMoV5-1 (50 HRC). The authors found that for the first cut-ting regime (V c = 120 m.min−1, ap = 0.15 mm, andf = 0.08 mm.rev−1), the productivity of the uncoatedcermets CT5015, the coated cermets GC1525, the un-coated carbide H13A, the reinforced ceramic CC670, thecoated carbide GC3015 and the mixed ceramic CC650are 2160; 1440; 6480; 11 520; 23 040 and 70 560 mm3,
Article published by EDP Sciences
B. Fnides et al.: Mechanics & Industry 16, 609 (2015)
Table 1. Factors affecting machinability and major investigators.
Investigators Major factors Materials studied Tools MethodologyC. Fetecau and F. Stan [15] cutting speed, feed AISI1045 Coated Taguchi method
rate and side cutting steel carbideedge angle (SCEA) insert
K. Bouacha et al. [16] cutting speed, feed AISI 52100 CBN Response surface methodologyrate and depth of cut bearing steel
R. Suresh et al. [17] cutting speed, AISI 4340 Coated Taguchi method and ANOVAfeed rate and depth of cut steel carbide
insertM.W. Azizi et al. [18] cutting speed, feed AISI 52100 coated Taguchi method and ANOVA
rate, depth of cut and steel mixedworkpiece hardness ceramic
H. Aouici et al. [19] cutting speed, feed AISI CBN7020 Response surface methodologyrate and depth of cut H11steel insert
A.K. Sahoo and B. Sahoo [20] cutting speed, feed AISI 4340 coated carbide /rate, depth of cut and steel inserts
machining timeM.H. Cetin et al. [21] cutting speed, feed AISI 304L carbide insert Taguchi method
rate, depth of cut and steelType of cutting fluid
S.R. Das et al. [22] cutting speed, feed AISI 4140 coated Taguchi method, RSMrate and depth of cut steel mixed ceramic and ANOVA
respectively. The productivity of these three selectedtools, i.e., mixed ceramic CC650, reinforced ceramicCC670, and coated carbide GC3015, for the second cut-ting regime (f = 0.08 mm.rev−1, ap = 0.15 mm andV c = 90 m.min−1) are 85 860; 12 960 and 30 780 mm3,respectively. Their results prove that the mixed ceramicAl2O3 + TiC (CC650) is more efficient than other toolsused in terms of productivity [6].
The response surface methodology (RSM) is a familyof statistical techniques for the design, empirical mod-elling and optimization of processes, where the responsesof interest are influenced by several process variables(termed factors) [7,8]. RSM comprises the following threemajor components: (i) experimental design to determinethe process factors’ values based on which the experi-ments are conducted and data are collected; (ii) empir-ical modelling to approximate the relationship (i.e. theresponse surface) between responses and factor; (iii) op-timization to find the best response value based on theempirical model. In addition, the above three stage pro-cedure is typically operated in an iterative manner, wherethe information attained from previous iterations is uti-lized to guide the search for better response variables.
Dureja et al. applied the response surface methodology(RSM) to investigate the effect of cutting parameters onflank wear and surface roughness in hard turning of AISIH11 steel with a coated-mixed ceramic tool. The studyindicated that the flank wear is influenced principally byfeed rate, depth of cut and workpiece hardness [9]. Neseliet al. [10] applied response surface methodology (RSM) tooptimize the effect of tool geometry parameters on sur-face roughness in hard turning of AISI 1040 with P25tool. Aouici et al. [11] applied response surface method-ology (RSM) to investigate the effect of cutting param-eters on surface roughness in hard turning of AISI H11
with CBN tool. Recently, Aouici et al. [7] have applied re-sponse surface methodology (RSM) to optimize the effectof cutting parameters at the different levels of hardnessworkpiece on surface roughness in the case of the hardturning of AISI H11 with CBN tool. Elbah et al. [12] ap-plied response surface methodology (RSM) and ANOVAto investigate the machinability of hardened AISI 4140cold work tool steel using a range of cutting tools. Theresults indicated that surface roughness of 4140 steel wasimproved as cutting speed was elevated and deterioratedwith feed rate. However, the surface quality obtained withthe wiper ceramic insert allowed a surface finish as goodwhen compared with conventional ceramic insert is 2.5.Lalwani et al. [13] studied the effect of cutting parametersin turning on cutting forces and surface roughness. To thisend, a number of experiments based on RSM have beencarried out and linear and quadratic models have beenformed to explain the relation between the parameters.
Lima et al. [14] published the results of an investiga-tion concerning the effect of cutting speed, feed rate anddepth of cut on cutting forces in hardened AISI 4340 highstrength low alloy steel and AISI D2 cold work tool steelmaterials.
Cutting force components influence the deformationof the machined workpiece, its dimensional accuracy, theformation of chip and the tool nose. Previously publishedstudies show the tendency to seek effect of cutting condi-tions (like cutting speed, feed rate and depth of cut) oncutting force components (Tab. 1).
2 Experimental procedure
Turning experiments were performed in dry conditionsusing an universal lathe type SN 40C with 6.6 kW spindle
609-page 2
B. Fnides et al.: Mechanics & Industry 16, 609 (2015)
(aa) (b) Fig. 1. Ceramic cutting tools: (a) CC650 and (b) CC670.
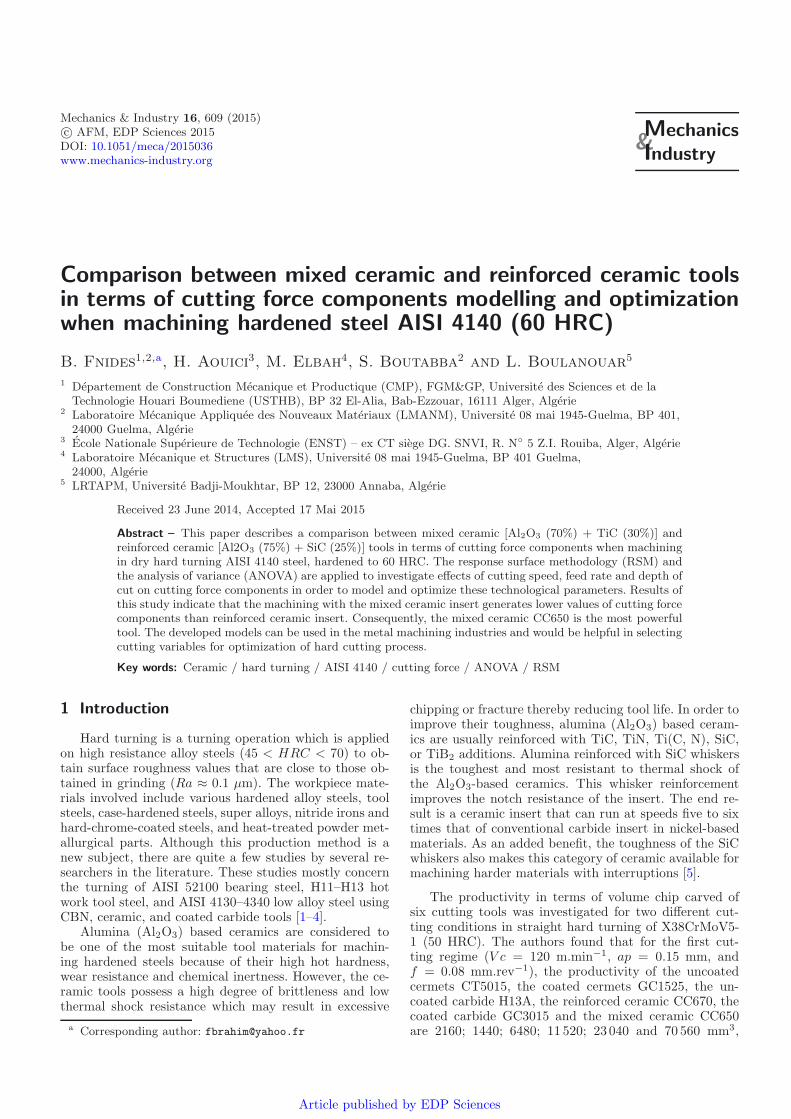
Fig. 2. Components of cutting force.
power. The workpiece material was AISI 4140 steel withan initial grain size of about 120 μm, used as the samplesfor hot compression; torsion test and ability for polishingenable it to answer the most severe requests in spindles,logging parts and pump shafts. It is hardened to 60 HRC.Its hardness was measured by a digital durometer DM2D.Its chemical composition (in wt.%) is given as: C 0.43; Cr1.10; Mo 0.19; V 0.005; Si 0.24; Mn 0.79; S 0.024; Ni0.022; Fe 96.315 and other components 0.884. The insertsused were mixed ceramic CC650 and reinforced ceramicCC670, removable, of square form with eight cuttingedges and having designation SNGA 120408T01020 andSNGN 120408T01020, respectively (Fig. 1). Its nose ra-dius is rε = 0.8 mm. These inserts were mounted on com-mercial toolholders of designation PSBNR2525M12 andCSBNR2525M12 with the geometry of active part char-acterized by the following angles:major cutting edge an-gle χ = 75◦; clearance angle α = 6◦; rake angle γ = −6◦;inclination angle λ = −6◦. Short duration tests were per-formed (machining length is 18 mm). Each test is realizedthree times with a new cutting edge. In order to carryout this experimental study, these measurements were re-peated three times and the considered result is an averageof the three values given by the three trials.
The three components of the cutting force; feed forceor axial force (Fx:Fa), thrust force or radial force (Fy:Fr)and tangential force (Fz:Ft), schematically shown in Fig-ure 2, were measured in real time with a Kistler threecomponent dynamometer model 9257 B linked via amultichannel charge amplifier (type 5011 B) to highimpedance cable.Before each test this dynamometer is re-set for calibration.
Table 2. Cutting parameters and their levels for turning.
Symbol Control factor UnitLevels
Level 1 Level 2
Vc Cutting speed m.min−1 90 180f Feed rate mm.rev−1 0.08 0.16ap Depth of cut mm 0.25 0.50
Since there are a large number of variables control-ling the cutting process, some mathematical models arerequired to represent this process. However, these modelshave to be developed using only the significant parame-ters influencing the process rather than including all theparameters.
In order to achieve this, statistical analysis of the ex-perimental results will have to be processed using theanalysis of variance (ANOVA). The latter is a compu-tational technique that enables the estimation of the rel-ative contributions of each of the control factors to theoverall measured response. In this work, only the signif-icant parameters will be used to develop mathematicalmodels using response surface methodology (RSM). RSMis a collection of mathematical and statistical techniquesthat are useful for the modeling and analysis of problemsin which response of interest is influenced by several vari-ables and the objective is to optimize the response [7, 8].
Two levels were defined for each cutting variable asgiven in Table 2. The variable levels were chosen withinthe intervals recommended by the cutting tool manufac-turer. Three cutting variables at two levels led to a totalof 8 tests.
3 Results and discussion
3.1 Evolution of the cutting force components
3.1.1 Influence of the cutting parameters on the feed force(axial force Fx:Fa)
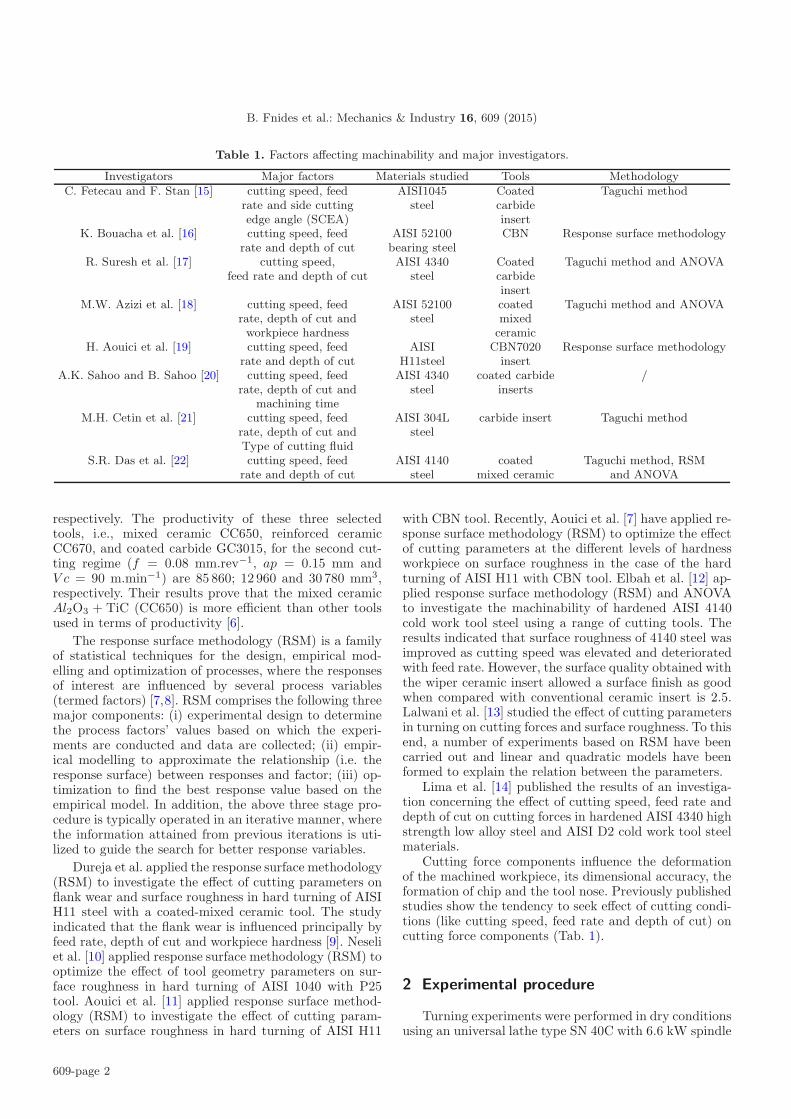
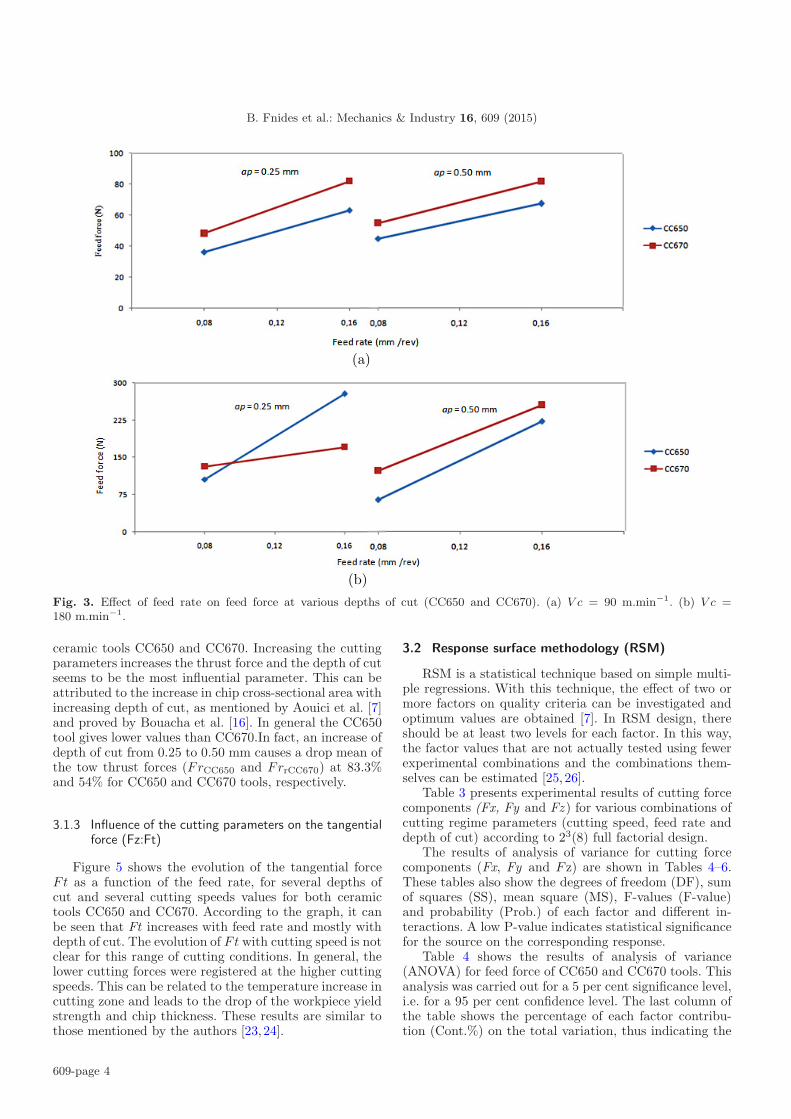
It can be seen in Figure 3 that all components ofthe feed force (axial force Fa) increased as the feed ratewas increased, for both ceramic tools CC650 and CC670.For the reason that as the feed rate increases, the chipcross-sectional area increases. In this case, more plasticdeformation energy is required for chip formation whichleads to increase in main cutting force. However, the in-sert CC650 provides lower values than the CC670 ceramictool. As seen in Figure 3, both mixed and reinforcedcutting tools have approximately the same grades. Theratio of FaCC670/FaCC650 is 1.06 for a cutting speed of180 m.min−1 whereas it is about 1.3 for a cutting speedof 90 m.min−1.
3.1.2 Influence of the cutting parameters on the thrust force(radial force Fy:Fr)
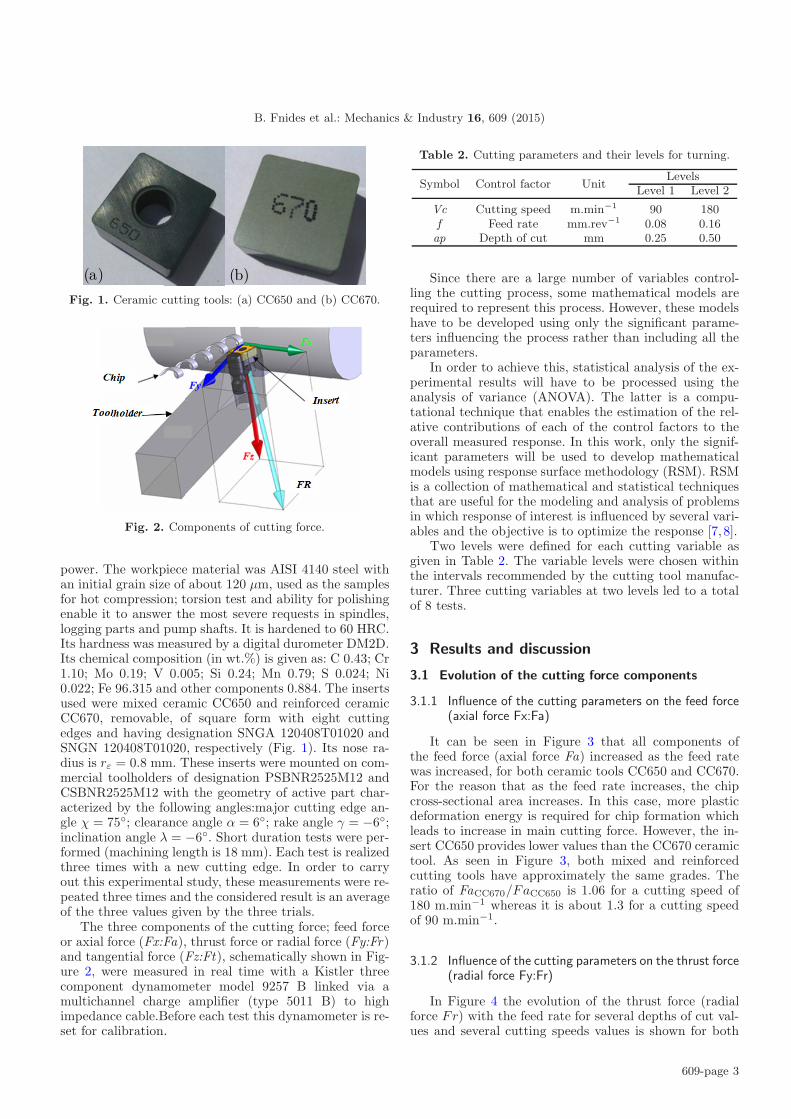
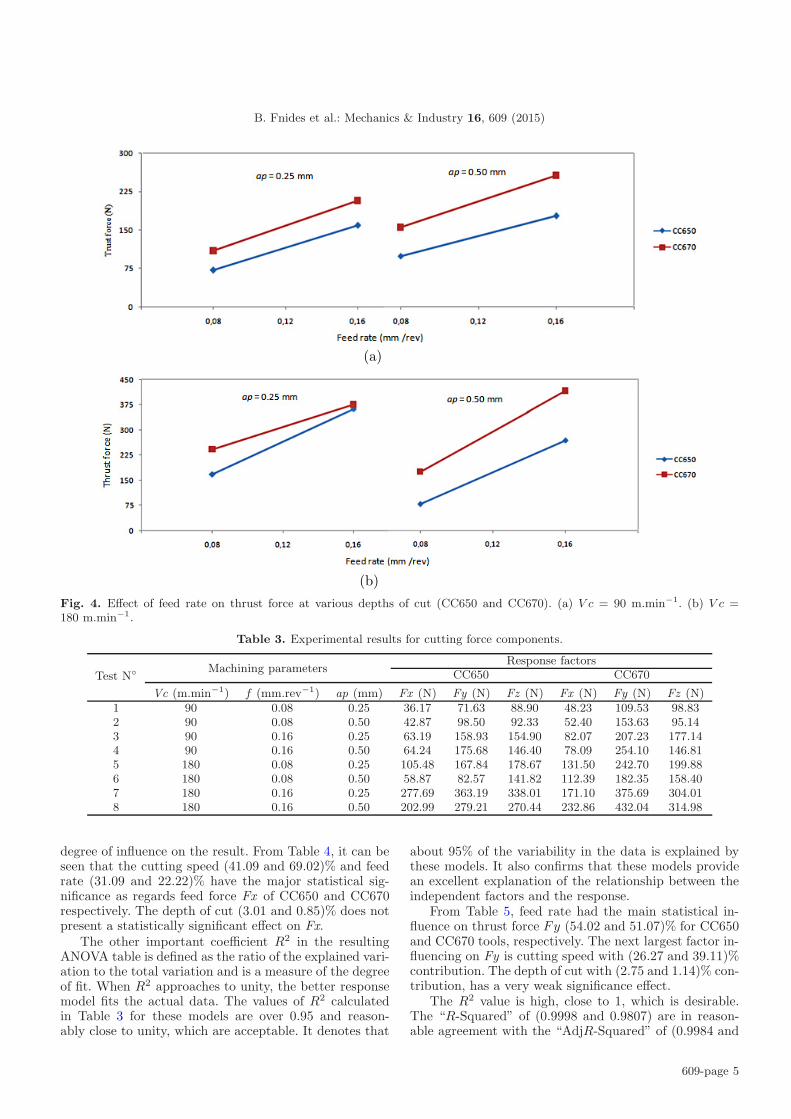
In Figure 4 the evolution of the thrust force (radialforce Fr) with the feed rate for several depths of cut val-ues and several cutting speeds values is shown for both
609-page 3
B. Fnides et al.: Mechanics & Industry 16, 609 (2015)
(a)
(b) Fig. 3. Effect of feed rate on feed force at various depths of cut (CC650 and CC670). (a) V c = 90 m.min−1. (b) V c =180 m.min−1.
ceramic tools CC650 and CC670. Increasing the cuttingparameters increases the thrust force and the depth of cutseems to be the most influential parameter. This can beattributed to the increase in chip cross-sectional area withincreasing depth of cut, as mentioned by Aouici et al. [7]and proved by Bouacha et al. [16]. In general the CC650tool gives lower values than CC670.In fact, an increase ofdepth of cut from 0.25 to 0.50 mm causes a drop mean ofthe tow thrust forces (FrCC650 and FrrCC670) at 83.3%and 54% for CC650 and CC670 tools, respectively.
3.1.3 Influence of the cutting parameters on the tangentialforce (Fz:Ft)
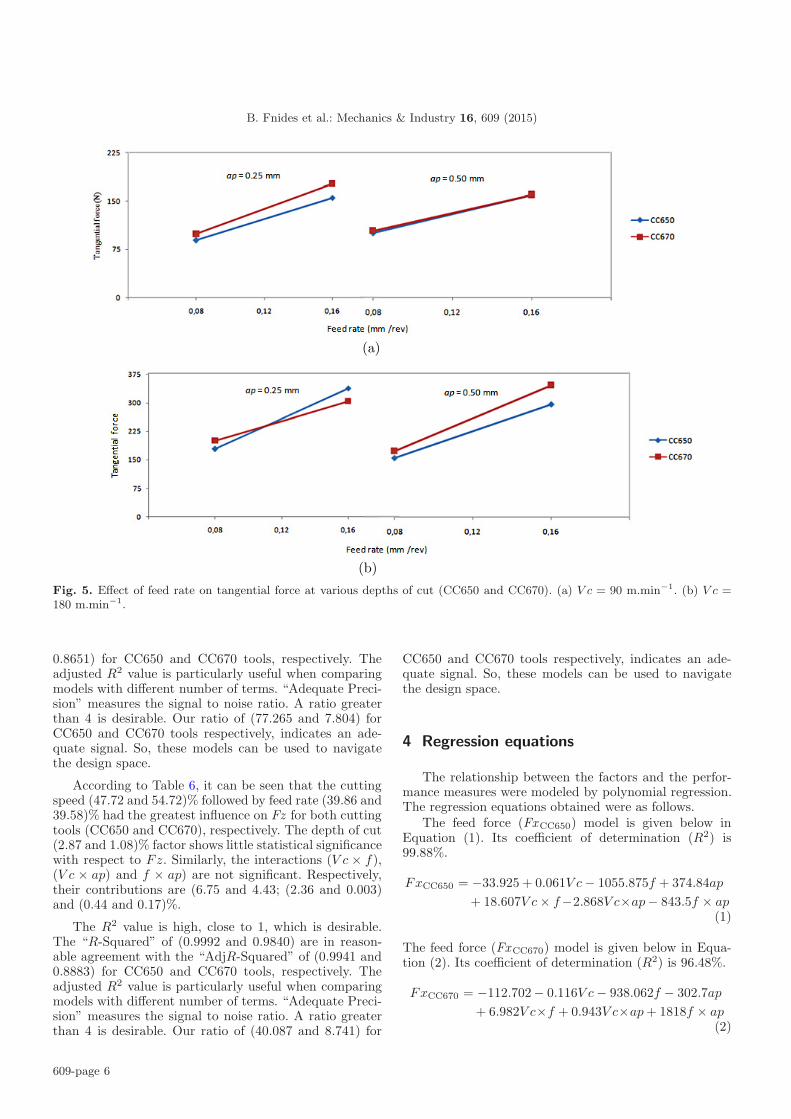
Figure 5 shows the evolution of the tangential forceFt as a function of the feed rate, for several depths ofcut and several cutting speeds values for both ceramictools CC650 and CC670. According to the graph, it canbe seen that Ft increases with feed rate and mostly withdepth of cut. The evolution of Ft with cutting speed is notclear for this range of cutting conditions. In general, thelower cutting forces were registered at the higher cuttingspeeds. This can be related to the temperature increase incutting zone and leads to the drop of the workpiece yieldstrength and chip thickness. These results are similar tothose mentioned by the authors [23, 24].
3.2 Response surface methodology (RSM)
RSM is a statistical technique based on simple multi-ple regressions. With this technique, the effect of two ormore factors on quality criteria can be investigated andoptimum values are obtained [7]. In RSM design, thereshould be at least two levels for each factor. In this way,the factor values that are not actually tested using fewerexperimental combinations and the combinations them-selves can be estimated [25, 26].
Table 3 presents experimental results of cutting forcecomponents (Fx, Fy and Fz ) for various combinations ofcutting regime parameters (cutting speed, feed rate anddepth of cut) according to 23(8) full factorial design.
The results of analysis of variance for cutting forcecomponents (Fx, Fy and F z) are shown in Tables 4–6.These tables also show the degrees of freedom (DF), sumof squares (SS), mean square (MS), F-values (F-value)and probability (Prob.) of each factor and different in-teractions. A low P-value indicates statistical significancefor the source on the corresponding response.
Table 4 shows the results of analysis of variance(ANOVA) for feed force of CC650 and CC670 tools. Thisanalysis was carried out for a 5 per cent significance level,i.e. for a 95 per cent confidence level. The last column ofthe table shows the percentage of each factor contribu-tion (Cont.%) on the total variation, thus indicating the
609-page 4
B. Fnides et al.: Mechanics & Industry 16, 609 (2015)
(a)
(b) Fig. 4. Effect of feed rate on thrust force at various depths of cut (CC650 and CC670). (a) V c = 90 m.min−1. (b) V c =180 m.min−1.
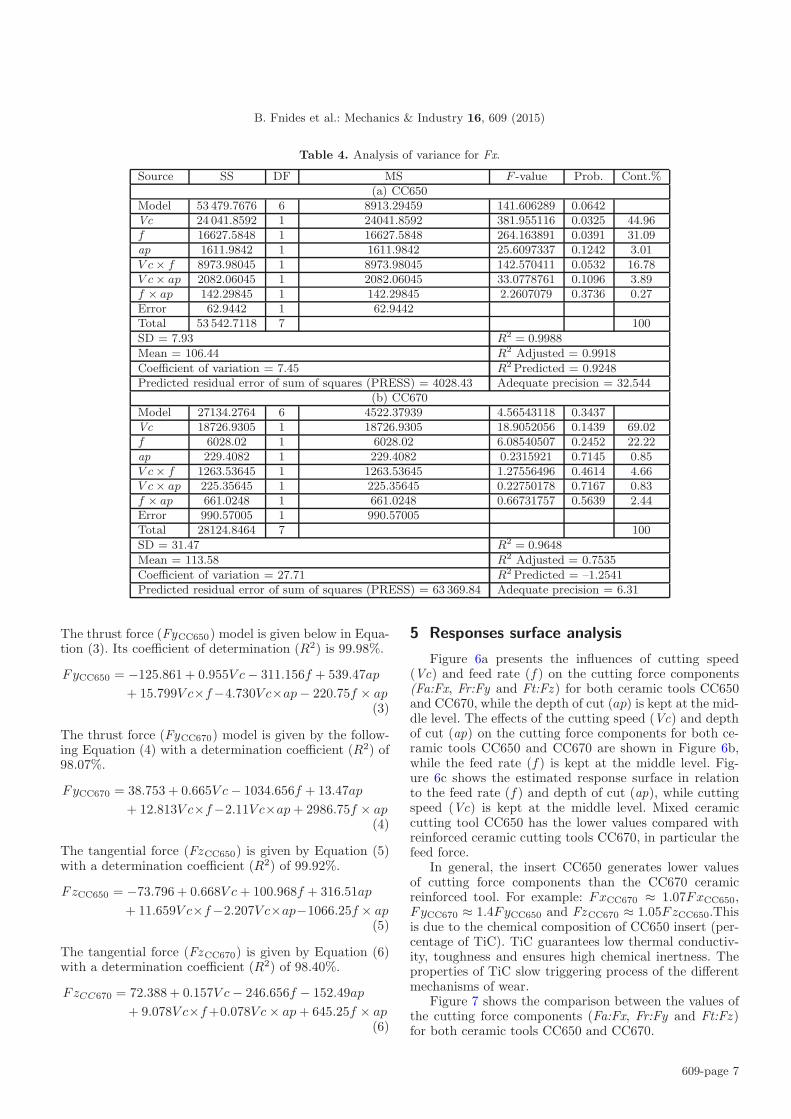
Table 3. Experimental results for cutting force components.
Test N◦ Machining parametersResponse factors
CC650 CC670
Vc (m.min−1) f (mm.rev−1) ap (mm) Fx (N) Fy (N) Fz (N) Fx (N) Fy (N) Fz (N)1 90 0.08 0.25 36.17 71.63 88.90 48.23 109.53 98.832 90 0.08 0.50 42.87 98.50 92.33 52.40 153.63 95.143 90 0.16 0.25 63.19 158.93 154.90 82.07 207.23 177.144 90 0.16 0.50 64.24 175.68 146.40 78.09 254.10 146.815 180 0.08 0.25 105.48 167.84 178.67 131.50 242.70 199.886 180 0.08 0.50 58.87 82.57 141.82 112.39 182.35 158.407 180 0.16 0.25 277.69 363.19 338.01 171.10 375.69 304.018 180 0.16 0.50 202.99 279.21 270.44 232.86 432.04 314.98
degree of influence on the result. From Table 4, it can beseen that the cutting speed (41.09 and 69.02)% and feedrate (31.09 and 22.22)% have the major statistical sig-nificance as regards feed force Fx of CC650 and CC670respectively. The depth of cut (3.01 and 0.85)% does notpresent a statistically significant effect on Fx.
The other important coefficient R2 in the resultingANOVA table is defined as the ratio of the explained vari-ation to the total variation and is a measure of the degreeof fit. When R2 approaches to unity, the better responsemodel fits the actual data. The values of R2 calculatedin Table 3 for these models are over 0.95 and reason-ably close to unity, which are acceptable. It denotes that
about 95% of the variability in the data is explained bythese models. It also confirms that these models providean excellent explanation of the relationship between theindependent factors and the response.
From Table 5, feed rate had the main statistical in-fluence on thrust force Fy (54.02 and 51.07)% for CC650and CC670 tools, respectively. The next largest factor in-fluencing on Fy is cutting speed with (26.27 and 39.11)%contribution. The depth of cut with (2.75 and 1.14)% con-tribution, has a very weak significance effect.
The R2 value is high, close to 1, which is desirable.The “R-Squared” of (0.9998 and 0.9807) are in reason-able agreement with the “AdjR-Squared” of (0.9984 and
609-page 5
B. Fnides et al.: Mechanics & Industry 16, 609 (2015)
(a)
(b)
Fig. 5. Effect of feed rate on tangential force at various depths of cut (CC650 and CC670). (a) V c = 90 m.min−1. (b) V c =180 m.min−1.
0.8651) for CC650 and CC670 tools, respectively. Theadjusted R2 value is particularly useful when comparingmodels with different number of terms. “Adequate Preci-sion” measures the signal to noise ratio. A ratio greaterthan 4 is desirable. Our ratio of (77.265 and 7.804) forCC650 and CC670 tools respectively, indicates an ade-quate signal. So, these models can be used to navigatethe design space.
According to Table 6, it can be seen that the cuttingspeed (47.72 and 54.72)% followed by feed rate (39.86 and39.58)% had the greatest influence on Fz for both cuttingtools (CC650 and CC670), respectively. The depth of cut(2.87 and 1.08)% factor shows little statistical significancewith respect to Fz. Similarly, the interactions (V c × f),(V c × ap) and f × ap) are not significant. Respectively,their contributions are (6.75 and 4.43; (2.36 and 0.003)and (0.44 and 0.17)%.
The R2 value is high, close to 1, which is desirable.The “R-Squared” of (0.9992 and 0.9840) are in reason-able agreement with the “AdjR-Squared” of (0.9941 and0.8883) for CC650 and CC670 tools, respectively. Theadjusted R2 value is particularly useful when comparingmodels with different number of terms. “Adequate Preci-sion” measures the signal to noise ratio. A ratio greaterthan 4 is desirable. Our ratio of (40.087 and 8.741) for
CC650 and CC670 tools respectively, indicates an ade-quate signal. So, these models can be used to navigatethe design space.
4 Regression equations
The relationship between the factors and the perfor-mance measures were modeled by polynomial regression.The regression equations obtained were as follows.
The feed force (FxCC650) model is given below inEquation (1). Its coefficient of determination (R2) is99.88%.
FxCC650 = −33.925 + 0.061V c − 1055.875f + 374.84ap
+ 18.607V c × f−2.868V c×ap− 843.5f × ap(1)
The feed force (FxCC670) model is given below in Equa-tion (2). Its coefficient of determination (R2) is 96.48%.
FxCC670 = −112.702− 0.116V c − 938.062f − 302.7ap
+ 6.982V c×f + 0.943V c×ap + 1818f × ap(2)
609-page 6
B. Fnides et al.: Mechanics & Industry 16, 609 (2015)
Table 4. Analysis of variance for Fx.
Source SS DF MS F -value Prob. Cont.%(a) CC650
Model 53 479.7676 6 8913.29459 141.606289 0.0642Vc 24 041.8592 1 24041.8592 381.955116 0.0325 44.96f 16627.5848 1 16627.5848 264.163891 0.0391 31.09ap 1611.9842 1 1611.9842 25.6097337 0.1242 3.01V c × f 8973.98045 1 8973.98045 142.570411 0.0532 16.78V c × ap 2082.06045 1 2082.06045 33.0778761 0.1096 3.89f × ap 142.29845 1 142.29845 2.2607079 0.3736 0.27Error 62.9442 1 62.9442Total 53 542.7118 7 100
SD = 7.93 R2 = 0.9988
Mean = 106.44 R2 Adjusted = 0.9918
Coefficient of variation = 7.45 R2 Predicted = 0.9248Predicted residual error of sum of squares (PRESS) = 4028.43 Adequate precision = 32.544
(b) CC670Model 27134.2764 6 4522.37939 4.56543118 0.3437Vc 18726.9305 1 18726.9305 18.9052056 0.1439 69.02f 6028.02 1 6028.02 6.08540507 0.2452 22.22ap 229.4082 1 229.4082 0.2315921 0.7145 0.85V c × f 1263.53645 1 1263.53645 1.27556496 0.4614 4.66V c × ap 225.35645 1 225.35645 0.22750178 0.7167 0.83f × ap 661.0248 1 661.0248 0.66731757 0.5639 2.44Error 990.57005 1 990.57005Total 28124.8464 7 100
SD = 31.47 R2 = 0.9648
Mean = 113.58 R2 Adjusted = 0.7535
Coefficient of variation = 27.71 R2 Predicted = –1.2541Predicted residual error of sum of squares (PRESS) = 63 369.84 Adequate precision = 6.31
The thrust force (FyCC650) model is given below in Equa-tion (3). Its coefficient of determination (R2) is 99.98%.
FyCC650 = −125.861 + 0.955V c − 311.156f + 539.47ap
+ 15.799V c×f−4.730V c×ap− 220.75f × ap(3)
The thrust force (FyCC670) model is given by the follow-ing Equation (4) with a determination coefficient (R2) of98.07%.
FyCC670 = 38.753 + 0.665V c − 1034.656f + 13.47ap
+ 12.813V c×f−2.11V c×ap + 2986.75f × ap(4)
The tangential force (FzCC650) is given by Equation (5)with a determination coefficient (R2) of 99.92%.
FzCC650 = −73.796 + 0.668V c + 100.968f + 316.51ap
+ 11.659V c×f−2.207V c×ap−1066.25f × ap(5)
The tangential force (FzCC670) is given by Equation (6)with a determination coefficient (R2) of 98.40%.
FzCC670 = 72.388 + 0.157V c − 246.656f − 152.49ap
+ 9.078V c×f +0.078V c × ap + 645.25f × ap(6)
5 Responses surface analysis
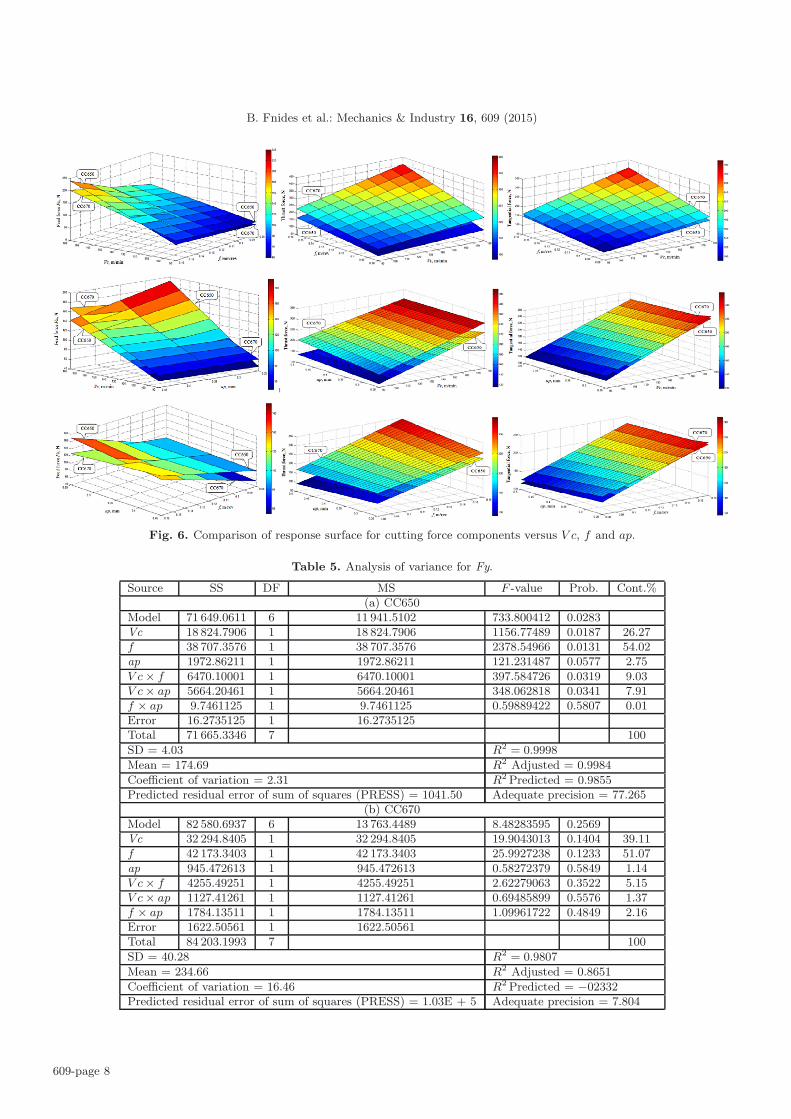
Figure 6a presents the influences of cutting speed(Vc) and feed rate (f) on the cutting force components(Fa:Fx, Fr:Fy and Ft:Fz ) for both ceramic tools CC650and CC670, while the depth of cut (ap) is kept at the mid-dle level. The effects of the cutting speed (Vc) and depthof cut (ap) on the cutting force components for both ce-ramic tools CC650 and CC670 are shown in Figure 6b,while the feed rate (f) is kept at the middle level. Fig-ure 6c shows the estimated response surface in relationto the feed rate (f) and depth of cut (ap), while cuttingspeed (Vc) is kept at the middle level. Mixed ceramiccutting tool CC650 has the lower values compared withreinforced ceramic cutting tools CC670, in particular thefeed force.
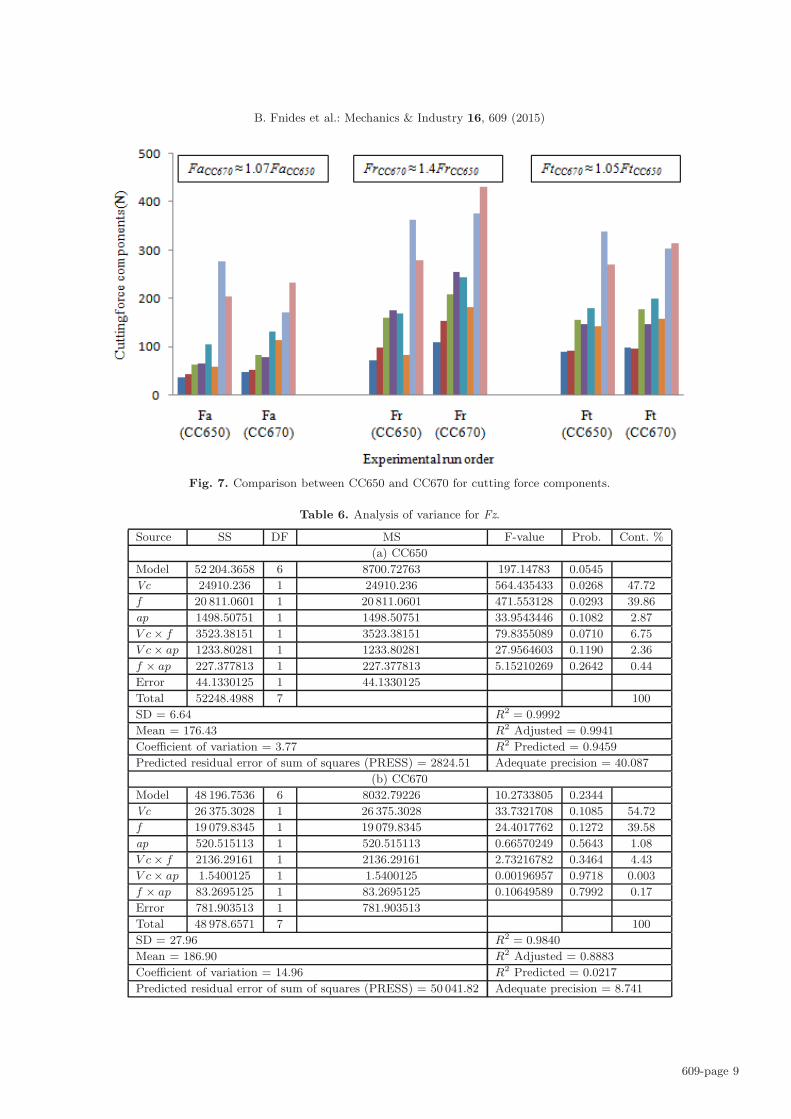
In general, the insert CC650 generates lower valuesof cutting force components than the CC670 ceramicreinforced tool. For example: FxCC670 ≈ 1.07FxCC650,FyCC670 ≈ 1.4FyCC650 and FzCC670 ≈ 1.05FzCC650.Thisis due to the chemical composition of CC650 insert (per-centage of TiC). TiC guarantees low thermal conductiv-ity, toughness and ensures high chemical inertness. Theproperties of TiC slow triggering process of the differentmechanisms of wear.
Figure 7 shows the comparison between the values ofthe cutting force components (Fa:Fx, Fr:Fy and Ft:Fz )for both ceramic tools CC650 and CC670.
609-page 7
B. Fnides et al.: Mechanics & Industry 16, 609 (2015)
Fig. 6. Comparison of response surface for cutting force components versus V c, f and ap.
Table 5. Analysis of variance for Fy.
Source SS DF MS F -value Prob. Cont.%(a) CC650
Model 71 649.0611 6 11 941.5102 733.800412 0.0283Vc 18 824.7906 1 18 824.7906 1156.77489 0.0187 26.27f 38 707.3576 1 38 707.3576 2378.54966 0.0131 54.02ap 1972.86211 1 1972.86211 121.231487 0.0577 2.75V c × f 6470.10001 1 6470.10001 397.584726 0.0319 9.03V c × ap 5664.20461 1 5664.20461 348.062818 0.0341 7.91f × ap 9.7461125 1 9.7461125 0.59889422 0.5807 0.01Error 16.2735125 1 16.2735125Total 71 665.3346 7 100
SD = 4.03 R2 = 0.9998
Mean = 174.69 R2 Adjusted = 0.9984
Coefficient of variation = 2.31 R2 Predicted = 0.9855Predicted residual error of sum of squares (PRESS) = 1041.50 Adequate precision = 77.265
(b) CC670Model 82 580.6937 6 13 763.4489 8.48283595 0.2569Vc 32 294.8405 1 32 294.8405 19.9043013 0.1404 39.11f 42 173.3403 1 42 173.3403 25.9927238 0.1233 51.07ap 945.472613 1 945.472613 0.58272379 0.5849 1.14V c × f 4255.49251 1 4255.49251 2.62279063 0.3522 5.15V c × ap 1127.41261 1 1127.41261 0.69485899 0.5576 1.37f × ap 1784.13511 1 1784.13511 1.09961722 0.4849 2.16Error 1622.50561 1 1622.50561Total 84 203.1993 7 100
SD = 40.28 R2 = 0.9807
Mean = 234.66 R2 Adjusted = 0.8651
Coefficient of variation = 16.46 R2 Predicted = −02332Predicted residual error of sum of squares (PRESS) = 1.03E + 5 Adequate precision = 7.804
609-page 8
B. Fnides et al.: Mechanics & Industry 16, 609 (2015)
Fig. 7. Comparison between CC650 and CC670 for cutting force components.
Table 6. Analysis of variance for Fz.
Source SS DF MS F-value Prob. Cont. %
(a) CC650
Model 52 204.3658 6 8700.72763 197.14783 0.0545
Vc 24910.236 1 24910.236 564.435433 0.0268 47.72
f 20 811.0601 1 20 811.0601 471.553128 0.0293 39.86
ap 1498.50751 1 1498.50751 33.9543446 0.1082 2.87
V c × f 3523.38151 1 3523.38151 79.8355089 0.0710 6.75
V c × ap 1233.80281 1 1233.80281 27.9564603 0.1190 2.36
f × ap 227.377813 1 227.377813 5.15210269 0.2642 0.44
Error 44.1330125 1 44.1330125
Total 52248.4988 7 100
SD = 6.64 R2 = 0.9992
Mean = 176.43 R2 Adjusted = 0.9941
Coefficient of variation = 3.77 R2 Predicted = 0.9459
Predicted residual error of sum of squares (PRESS) = 2824.51 Adequate precision = 40.087
(b) CC670
Model 48 196.7536 6 8032.79226 10.2733805 0.2344
Vc 26 375.3028 1 26 375.3028 33.7321708 0.1085 54.72
f 19 079.8345 1 19 079.8345 24.4017762 0.1272 39.58
ap 520.515113 1 520.515113 0.66570249 0.5643 1.08
V c × f 2136.29161 1 2136.29161 2.73216782 0.3464 4.43
V c × ap 1.5400125 1 1.5400125 0.00196957 0.9718 0.003
f × ap 83.2695125 1 83.2695125 0.10649589 0.7992 0.17
Error 781.903513 1 781.903513
Total 48 978.6571 7 100
SD = 27.96 R2 = 0.9840
Mean = 186.90 R2 Adjusted = 0.8883
Coefficient of variation = 14.96 R2 Predicted = 0.0217
Predicted residual error of sum of squares (PRESS) = 50 041.82 Adequate precision = 8.741
609-page 9
B. Fnides et al.: Mechanics & Industry 16, 609 (2015)
Table 7. Constraints for optimization of cutting conditions.
Condition GoalLower limit Upper limit
CC650 CC670 CC650 CC670Cutting speed (m.min−1) Is in rang 90 180
Feed rate (mm.rev−1) Is in rang 0.08 0.16Depth of cut (mm) Is in rang 0.25 0.50Feed force (Fx:Fa) Minimize 36.17 48.23 277.69 232.86Thrust force (Fy:Fr) Minimize 71.63 109.53 363.19 432.04Tangential force (Fz:Ft) Minimize 88.90 95.14 338.01 314.98
6 Optimization of cutting conditions
The optimal manufacturing conditions for hard turn-ing of AISI 4140 with the constraints of cutting paramet-ric range is that corresponding to lower values of feed force(Fa:Fx ), thrust force (Fr:Fy) and tangential force (Ft:Fz )during the dry turning process. The constraints used dur-ing the optimization process are summarized in Table 7Whereas the optimal solutions are reported in Table 8in a decreasing desirability level order. This same Tableshows the RSM optimization results for feed force, thrustforce and tangential force. The optimum cutting param-eters were obtained in Table 8 with cutting speed of (90to 92.42) m.min−1, feed rate of 0.08 mm.rev−1 and depthof cut (0.25 to 0.31) for CC650 and CC670 tools respec-tively The optimization was based on the Least SquaresMethod, i.e. the derived variables according to the mini-mum. The statistical software called Design-Expert 8 wasused.
Desirability function approach has been used for mul-tiple response factors (Fx:Fa, Fy:Fr and Fz:Ft) optimiza-tion. The optimization module searches for a combinationof factor levels that simultaneously satisfies the require-ments placed on each of the responses and factors in anattempt to establish the appropriate model. During theoptimization process the aim was to find the optimal val-ues of machining parameters in order to produce the low-est values of cutting force components. To resolve thistype of parameter design problem, an objective function,F (x), is defined as follows:
DF =
(n∏
i=1
dwi
) 1∑nj−1 wi
(7)
F (x) = −DF
where di is the desirability defined for the ith targetedoutput and wi is the weighting of di. For various goalsof each targeted output, the desirability, di, is defined indifferent forms. If a goal is to reach a specific value of Ti,the desirability di is:
di = 0 if Υi � Lowi
di =[Y i − Lowi
Ti − Lowi
]if Lowi � Yi � Ti (8)
di =[Y i − Highi
Ti − Highi
]if Ti � Yi � Highi (9)
di = 0 if Υi � Highi (10)
For a goal to find a maximum, the desirability is shownas follows:
di = 0 if Υi � Lowi (11)
di =[
Y i − Lowi
Highi − Lowi
]if Lowi � Yi � Highi (12)
di = 1 if Υi � Highi (13)
For a goal to search for a minimum, the desirability canbe defined by the following formulas:
di = 1 if Υi � Lowi (14)
di =[
Highii − Yi
Highi − Lowi
]if Lowi � Yi � Highi (15)
di = 0 if Υi � Highi (16)
where the Yi is the found value of the ith output duringoptimization processes; the Low i and the Highi are, re-spectively, the minimum and the maximum values of theexperimental data for the ith output. In Equation (7), wi
is set to one since the di is equally important in this study.The DF is a combined desirability function, and the ob-jective is to choose an optimal setting that maximizes acombined desirability function DF, i.e., minimizes F (x).
7 Conclusions
The research work presents the application of RSMmodels which influences the machining variables of feedforce, thrust force and tangential force. The relationshipbetween the factors and the performance measures weremodeled by polynomial regression. Three process param-eters (cutting speed, feed rate and depth of cut) are con-sidered for the development of the models. The developedRSM models are tested through ANOVA and found to beadequate at 95% confidence interval. The following con-clusions are drawn from the present investigation.
(1) The statistical analysis of the cutting force compo-nents indicates that the feed rate and cutting speedare the most significant factors on the cutting forcecomponents (Fa:Fx, Fr:Fy and Ft:Fz ) with the re-spective contribution of (31.09; 54.02 and 39.58) and44.96; 26.27 and 47.72)] % for CC650 insert by againsta respective contribution (22.22; 51.07 and 39.58) and69.02; 39.11 and 54.72)) % for CC670 insert.
609-page 10
B. Fnides et al.: Mechanics & Industry 16, 609 (2015)
Table 8. Optimization results.
Test No. Vc (m.min−1) f (mm.rev−1) ap (mm)Cutting force components
DesirabilityFa:Fx (N) Fr:Fy (N) Ft:Fz (N)
CC6501 90 0.08 0.25 33.376 73.076 86.559 0.9982 91.43 0.08 0.25 34.558 74.544 88.055 0.9963 92.1 0.08 0.25 35.111 75.233 88.753 0.9954 92.42 0.08 0.25 35.382 75.570 89.094 0.9955 90 0.08 0.31 36.322 78.826 88.504 0.991
CC6701 90 0.08 0.4 48.229 133.380 94.280 0.9742 91.67 0.08 0.42 48.220 135.938 93.978 0.9713 92.79 0.08 0.44 48.218 137.593 93.733 0.9704 95.63 0.08 0.45 49.783 140.420 95.140 0.9645 91.63 0.08 0.33 54.530 130.611 102.336 0.955
(2) The statistical models deduced define the degree of in-fluence of each cutting regime element on cutting forcecomponents (Fa:Fx, Fr:Fy and Ft:Fz ). They can alsobe used for optimization of the hard cutting process.
(3) The models developed for different forces using regres-sion analysis are also proved good where predicted val-ues of forces are very close to the experimental valuesand desirability is also very high (96.48–99.98)%.
(4) The ranges of best cutting conditions adopted, are:cutting speed (90 to 92.42) m.min−1, feed rate of 0.08mm.rev−1 and depth of cut (0.25 to 0.31) for CC650and CC670 tools respectively.
(5) In general, ceramic cutting insert CC650 has the bet-ter performance compared with ceramic cutting insertCC670, in particular for the cutting force componentsof the machining. Ratios mean value (8 tests) for cut-ting force components (Fa:Fx, Fr:Fy and Ft:Fz ) is of(1.07; 1.4 and 1.05) respectively.
References
[1] K. Bouacha, M.A. Yallese, T. Mabrouki, J-F. Rigal,Statistical analysis of surface roughness and cutting forcesusing response surface methodology in hard turning ofAISI 52100 bearing steel with CBN tool. Int. J. Refract.Metals Hard Mater. 28 (2010) 349–361
[2] I. Asilturk, S. Neseli, Multi response optimization of CNCturning parameters via Taguchi method-based responsesurface analysis, Measurement 45 (2012) 785–794
[3] Z. Hessainia, A. Belbah, M.A. Yallese, T. Mabrouki, J-F.Rigal, On the prediction of surface roughness in the hardturning based on cutting parameters and tool vibrations,Measurement 6 (2013) 1671–1678
[4] B. Fnides, M.A. Yallese, T. Mabrouki, J-F. Rigal,Application of response surface methodology for deter-mining cutting force model in turning hardened AISI H11hot work tool steel, Sadhana 36 (2011) 109–123
[5] R.C. Dewes, D.K. Aspinwall, A review of ultra high speedmilling of hardened steels, J. Mater. Process. Technol. 69(1997) 1–17
[6] B. Fnides, S. Boutabba, M. Fnides, H. Aouici, M.A.Yallese, Cutting tools flank wear and productivity inves-tigation in straight turning of X38CrMoV5-1 (50 HRC),J. Appl. Eng. Technol. 3 (2013) 1–10
[7] H. Aouici, M.A. Yallese, K. Chaoui, T. Mabrouki, J.-F.Rigal, Analysis of surface roughness and cutting forcecomponents in hard turning with CBN tool: Predictionmodel and cutting conditions optimization, Measurement45 (2012) 344–353
[8] H. Oktem, T. Erzurumluand H. Kurtaran, Application ofresponse surface methodology in the optimization of cut-ting conditions for surface roughness, J. Mater. Process.Technol. 170 (2005) 11–16
[9] J.S. Dureja, V.K. Gupta, M. Dogra, Design optimiza-tion of cutting conditions and analysis of their effect ontool wear and surface roughness during hard turning ofAISI-H11 steel with a coated mixed ceramic tool, J. Eng.Manuf. 223 (2009) 1441–1453
[10] S. Neseli, S. Yaldiz, E. Turkes, Optimization of tool ge-ometry parameters for turning operations based on theresponse surface methodology, Measurement 44 (2011)580–587
[11] H. Aouici, M.A. Yallese, B. Fnides, K. Chaoui, T.Mabrouki, Modeling, optimization of hard turning ofX38CrMoV5-1 steel with CBN tool, J. Mech. Sci.Technol. 25 (2011) 2843–2851
[12] M. Elbah, M.A. Yallese, H. Aouici, T. Mabrouki, J.-F.Rigal, Comparative assessment of wiper and conventionalceramic tools on surface roughness in hard turning AISI4140 steel, Measurement 46 (2013) 3041–3056
[13] D.I. Lalwani, N.K. Mehta, P.K. Jain, Experimental inves-tigations of cutting parameters influence on cutting forcesand surface roughness in finish hard turning of MDN250steel, J. Mater. Process. Technol. 206 (2008) 167–179
[14] J.G. Lima, R.F. Avila, A.M. Abrao, M. Faustino, J.P.Davim. Hard turning AISI 4340 high strength low alloysteel and AISI D2 cold work steel, J. Mater. Process.Technol. 169 (2005) 388–395
[15] C. Fetecau, F. Stan, Study of cutting force and surfaceroughness in the turning of polytetrafluoroethylene com-posites with a polycrystalline diamond tool, Measurement45 (2012) 1367–1379
[16] K. Bouacha, M.A. Yallese, T. Mabrouki, J.F. Rigal,Statistical analysis of surface roughness and cutting forcesusing response surface methodology in hard turning ofAISI 52100 bearing steel with CBN tool, Int. J. Refract.Metals Hard Mater. 28 (2010) 349–361
609-page 11
B. Fnides et al.: Mechanics & Industry 16, 609 (2015)
[17] R. Suresh, S. Basavarajappa, G.L. Samuel, Some studieson hard turning of AISI 4340 steel using multilayer coatedcarbide tool, Measurement 45 (2012) 1367–1379
[18] M.W. Azizi, S. Belhadi, M.A. Yallese, T. Mabrouki, J.-F.Rigal, Surface roughness and cutting forces modeling foroptimization of machining condition in finish hard turn-ing of AISI 52100 steel, J. Mech. Sci. Technol. 26 (2012)4105–4114
[19] H. Aouici, M.A. Yallese, A. Belbah, M.F. Ameur, M.Elbah, Experimental investigation of cutting parametersinfluence on surface roughness and cutting forces in hardturning of X38CrMoV5-1 with CBN tool, Sadhana 38(2013) 429–445
[20] A. Kumar Sahoo, B. Sahoo, Experimental investigationson machinability aspects in finish hard turning of AISI4340 steel using uncoated and multilayer coated carbideinserts, Measurement 45 (2012) 2153–2165
[21] M.H. Cetin, B. Ozcelik, E. Kuram, E. Demirban,Evaluation of vegetable based cutting fluids with extremepressure and cutting parameters in turning of AISI 304Lby Taguchi method, J. Clean. Prod. 19 (2011) 2049–2056
[22] S.R. Das, D. Dhupal, A. Kumar, Experimental investiga-tion into machinability of hardened AISI 4140 steel usingTiN coated ceramic tool, Measurement, 62 (2015) 108–126
[23] V.N. Gaitonde, S.R. Karnik, L. Figueira, J.P. Davim,Machinability investigations in hard turning of AISI D2cold work tool steel with conventional and wiper ceramicinserts, Int. J. Refract. Metals. Hard Mater. 27 (2009)754–763
[24] B. Fnides, Comportement des outils de coupe en tournagedur a sec - Modelisation des parametres technologiques,Presses Academiques Francophones, 2014, ISBN: 978-3-8381-7843-1
[25] J.S. Kwak, Application of Taguchi and response surfacemethodologies for geometric error in surface grinding pro-cess, Int. J. Mach. Tools Manuf. 45 (2005) 327–334
[26] C.E. Walker, A.M. Parkhurst, Response surface analysisof bake-lab data with a personal computer, Cereal FoodsWorld 29 (1984) 662
609-page 12