Embed Size (px)
Citation preview
Copyright © Lippincott Williams & Wilkins. Unauthorized reproduction of this article is prohibited.
Comparison between human and porcinethromboelastograph parameters in response to ex-vivochanges to platelets, plasma, and red blood cellsJill L. Sondeen, Rodolfo de Guzman, Irene Amy Polykratis,Malcolm Dale Prince, Orlando Hernandez, Andrew P. Cap andMichael A. Dubick
In the acute care setting, both the tracings and numeric
outputs (R time, angle, and MA) of thrombelastography
(TEG) may be used to inform treatment decisions. The
objective was to determine the sensitivity of TEG to isolated
changes in platelet count, hematocrit and fibrinogen
concentration in human blood. As pigs have a similar
coagulation system, we also compared the responses of the
pig blood. Eight volunteers (>18 years of age, no
anticoagulation or nonsteroidal anti-inflammatory therapy,
not pregnant) were enrolled into this study. Four female
anesthetized donor pigs were instrumented percutaneously
with a catheter for blood collection. All blood was collected
into sodium citrate. The concentration of each component
(platelets, fibrinogen, and red blood cells) was changed
while keeping the other components constant by use of
centrifugation or preparation of each individual’s plasma
into platelet poor plasma, platelet rich plasma,
cryoprecipitate, purified washed platelets, and packed red
blood cells as appropriate. TEG (Haemoscope) analysis was
performed and compared with the patients’ whole blood
diluted with lactated Ringer’s solution. We demonstrated
that the major factor affecting the MA and angle was the
platelet count. In fact, reducing platelets alone resulted in
TEG profiles and parameters that were similar to
lactated Ringer’s dilution profiles. Swine blood responses
were parallel to that of human blood, although there were
offsets especially of TEG-R and angle that confirmed that
the swine are hypercoagulable compared with humans.
Superficially similar TEG tracing patterns can be produced
by divergent mechanisms associated with altered
concentrations of blood components. Blood Coagul
Fibrinolysis 24:818–829 � 2013 Wolters Kluwer Health |
Lippincott Williams & Wilkins.
Blood Coagulation and Fibrinolysis 2013, 24:818–829
Keywords: blood platelets, fibrinogen, hematocrit, humans, pigs,thrombelastography
US Army Institute of Surgical Research, Fort Sam Houston, Texas, USA
Correspondence to Dr Jill L. Sondeen, US Army Institute of Surgical Research,3698 Chambers Pass,JBSA Ft. Sam Houston, TX 78234-7767, USATel: +210 539 4331; fax: +210 539 6244; e-mail: [email protected]
Received 10 October 2012 Revised 16 April 2013Accepted 20 April 2013
IntroductionHemorrhage remains the major cause of death in poten-
tially survivable injuries, yet mortality has not improved
significantly over the past 30 years [1]. Strategies of
hypotensive resuscitation [2], restriction of crystalloids
[3], and more balanced administration of blood com-
ponents – adding plasma and platelets to red blood cells
(RBCs) [4,5] – as well as resuscitation algorithms [6],
have recently been implemented for the severely injured.
The use of thromboelastography (TEG) in the trauma
bay has been proposed as a technique that can be used to
develop goal-directed resuscitation therapy with blood
components [7,8]. The TEG is a whole blood assay that
measures the changes in viscoelasticity as the blood clots
after activation of coagulation with an accelerant, either
kaolin or tissue factor or both as in the case of ‘rapid’
TEG. The TEG tracing represents the cell-based theory
of coagulation: clot initiation (R-time), clot propagation
(a-angle), and clot strength (MA) [9]. In addition, the first
derivative of the upper trace has been correlated to
thrombin generation and the area under the curve reflects
the final clot strength [10]. The developers of the TEG
state that the shape of the clotting curve gives an indica-
tion of hypocoagulation or hypercoagulation and status of
fibrinolysis, either normal, primary or secondary [11].
There are claims in the trauma literature that the pro-
longation of the R-time reflects clotting factor deficiency
or dilution, prolongation of K-time and a smaller a-angle
reflects low fibrinogen and platelets, and low MA reflects
the platelet and fibrinogen contribution to clot strength
[12–15].
However, recent publications describing manipulations
of various blood components made in vitro have not borne
out the claims that specific deficits can be determined by
the TEG. For example, a study by Nielsen et al. [16]
measured the TEG response of various plasmas, which
were deficient in only one factor each. For example,
R-time was affected by deficiencies of each one of
the factors except FXIII. a-Angle was reduced with
deficiencies of FII, FVII, FX, and FXII. The MA was
818 Original article
0957-5235 � 2013 Wolters Kluwer Health | Lippincott Williams & Wilkins DOI:10.1097/MBC.0b013e3283646600
Report Documentation Page Form ApprovedOMB No. 0704-0188
Public reporting burden for the collection of information is estimated to average 1 hour per response, including the time for reviewing instructions, searching existing data sources, gathering andmaintaining the data needed, and completing and reviewing the collection of information. Send comments regarding this burden estimate or any other aspect of this collection of information,including suggestions for reducing this burden, to Washington Headquarters Services, Directorate for Information Operations and Reports, 1215 Jefferson Davis Highway, Suite 1204, ArlingtonVA 22202-4302. Respondents should be aware that notwithstanding any other provision of law, no person shall be subject to a penalty for failing to comply with a collection of information if itdoes not display a currently valid OMB control number.
1. REPORT DATE 01 SEP 2013
2. REPORT TYPE N/A
3. DATES COVERED -
4. TITLE AND SUBTITLE Comparison between human and porcine thromboelastographparameters in response to ex-vivo changes to platelets, plasma, and redblood cells
5a. CONTRACT NUMBER
5b. GRANT NUMBER
5c. PROGRAM ELEMENT NUMBER
6. AUTHOR(S) Sondeen J. L., de Guzman R., Polykratis A., Prince D., Hernandez O.,Cap A. P., Dubick M. A.,
5d. PROJECT NUMBER
5e. TASK NUMBER
5f. WORK UNIT NUMBER
7. PERFORMING ORGANIZATION NAME(S) AND ADDRESS(ES) United States Army Institute of Surgical Research, JBSA Fort SamHouston, TX
8. PERFORMING ORGANIZATIONREPORT NUMBER
9. SPONSORING/MONITORING AGENCY NAME(S) AND ADDRESS(ES) 10. SPONSOR/MONITOR’S ACRONYM(S)
11. SPONSOR/MONITOR’S REPORT NUMBER(S)
12. DISTRIBUTION/AVAILABILITY STATEMENT Approved for public release, distribution unlimited
13. SUPPLEMENTARY NOTES
14. ABSTRACT
15. SUBJECT TERMS
16. SECURITY CLASSIFICATION OF: 17. LIMITATION OF ABSTRACT
UU
18. NUMBEROF PAGES
12
19a. NAME OFRESPONSIBLE PERSON
a. REPORT unclassified
b. ABSTRACT unclassified
c. THIS PAGE unclassified
Standard Form 298 (Rev. 8-98) Prescribed by ANSI Std Z39-18
Copyright © Lippincott Williams & Wilkins. Unauthorized reproduction of this article is prohibited.
reduced with deficiencies of FII, FVII, FX, FXII, and
FXIII. The authors also showed that fibrinogen affects all
three: R-time, a-angle, and MA. A limitation of this study
was that platelets and red blood cells were not present as
they would be in whole blood.
Bochsen et al. [17] compared TEG responses with two
levels of platelets, 0 and 200� 109 per l, as well as three
levels of hematocrit (0, 15, and 29%) and plasma con-
centration (0, 25, and 50%). They found that increasing
hematocrit reduced the a-angle and MA both with and
without platelets. The presence of platelets increased the
a-angle and MA compared with no platelets. Their
results are difficult to interpret because they altered
hematocrit and plasma concentration at the same time.
In an in-vitro model of thrombocytopenia, Larsen et al.studied the effect of isolated changes in platelet
count on the rotational thromboelastometry (ROTEM)
parameters using platelet-rich plasma and platelet-poor
plasma recombined with red blood cells at a normal
hematocrit [18]. They reported a logarithmic reduction
in maximum velocity with the reduction in platelet count
from 307 to 16� 109 per l.
To mimic the dilution that occurs in resuscitated trauma
patients, Darlington et al. [19] measured changes in TEG
parameters using tissue factor as an accelerant in response
to 0–90% dilution with physiological saline (0.9% NaCl).
The TEG parameters showed logarithmic changes with
dilution in all of the parameters. As all three components
of the blood was equally diluted (i.e. hematocrit, fibrino-
gen, and platelets), it is not possible to determine how
the changes in the TEG parameters were affected by
each component.
Using human blood from eight healthy individuals, our
goal was to manipulate each blood component (hemato-
crit, fibrinogen, and platelets) independently while
keeping the other two components constant. In this
way, we were able to determine which TEG parameter
was affected the most by each component, with the idea
that if the TEG can be used to reflect which blood
component should be administered to a trauma patient,
specific predictable changes should be able to be
detected for each component. As pigs have been used
to develop models of trauma [20] and have a similar
coagulation system [21] we set out to compare the
responses of the pig blood as well.
MethodsThe methodology for these in-vitro studies was devel-
oped for the human samples and then applied to pig
samples. The four groups were lactated Ringer’s-diluted
blood (LR DIL), platelet-adjusted whole blood (PAWB),
hematocrit-adjusted whole blood (HAWB), and fibrino-
gen-adjusted whole blood (FAWB) (Table 1).
Human blood collection procedureThis study was conducted under a protocol reviewed
and approved by the US Army Medical Research and
Materiel Command Institutional Review Board and in
accordance with the approved protocol. Whole blood was
collected from eight normal healthy volunteers (four
men, four women; age 33� 2 years; range: 26–42) after
signing an informed consent. Exclusion criteria were:
ongoing therapeutic anticoagulation therapy, use of
over-the-counter drugs such as aspirin, ibuprofen, herbal
products, or nonsteroidal anti-inflammatory drugs within
7 days, and pregnancy. Each participant was sampled four
times. Blood was collected by venipuncture of the medial
cubital vein using a 21 ga.� 0.75 in. needle winged blood
collection set (Becton–Dickinson, Franklin Lakes, New
Jersey, USA). Ten to 15 tubes (4.5 ml blue top 3.2% Na
citrate, Becton-Dickinson) of blood were collected,
depending on which procedure was performed on that
Man vs. pig: platelet, fibrinogen, RBC on TEG Sondeen et al. 819
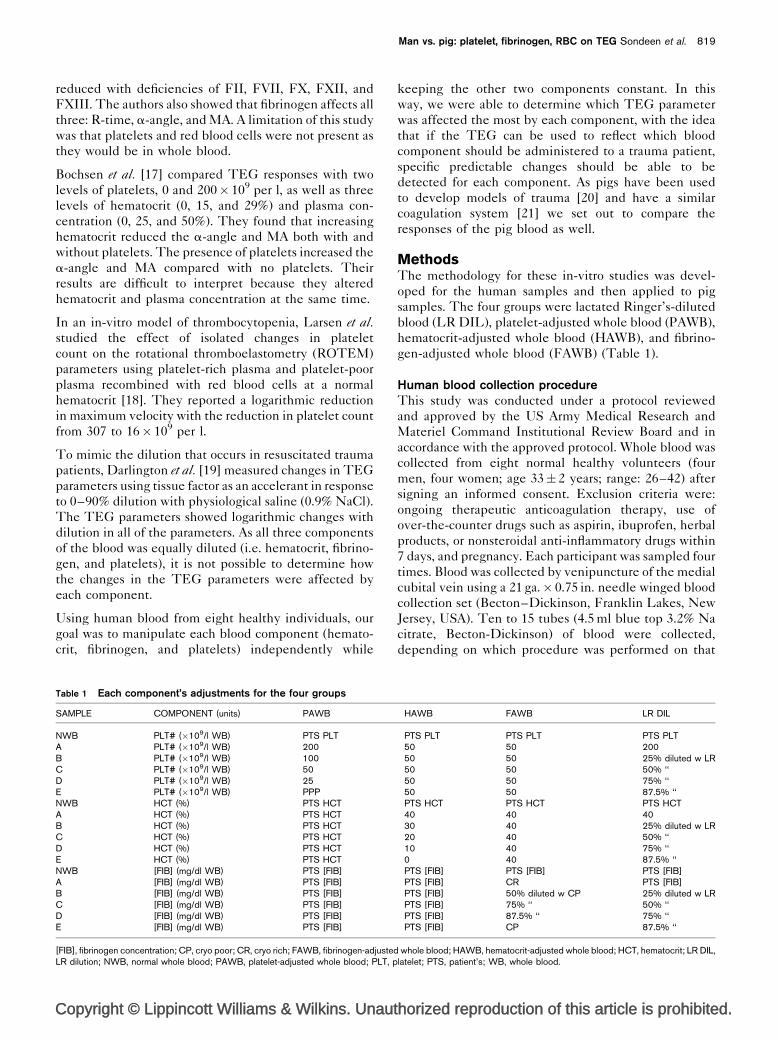
Table 1 Each component’s adjustments for the four groups
SAMPLE COMPONENT (units) PAWB HAWB FAWB LR DIL
NWB PLT# (�109/l WB) PTS PLT PTS PLT PTS PLT PTS PLTA PLT# (�109/l WB) 200 50 50 200B PLT# (�109/l WB) 100 50 50 25% diluted w LRC PLT# (�109/l WB) 50 50 50 50% ‘‘D PLT# (�109/l WB) 25 50 50 75% ‘‘E PLT# (�109/l WB) PPP 50 50 87.5% ‘‘NWB HCT (%) PTS HCT PTS HCT PTS HCT PTS HCTA HCT (%) PTS HCT 40 40 40B HCT (%) PTS HCT 30 40 25% diluted w LRC HCT (%) PTS HCT 20 40 50% ‘‘D HCT (%) PTS HCT 10 40 75% ‘‘E HCT (%) PTS HCT 0 40 87.5% ‘‘NWB [FIB] (mg/dl WB) PTS [FIB] PTS [FIB] PTS [FIB] PTS [FIB]A [FIB] (mg/dl WB) PTS [FIB] PTS [FIB] CR PTS [FIB]B [FIB] (mg/dl WB) PTS [FIB] PTS [FIB] 50% diluted w CP 25% diluted w LRC [FIB] (mg/dl WB) PTS [FIB] PTS [FIB] 75% ‘‘ 50% ‘‘D [FIB] (mg/dl WB) PTS [FIB] PTS [FIB] 87.5% ‘‘ 75% ‘‘E [FIB] (mg/dl WB) PTS [FIB] PTS [FIB] CP 87.5% ‘‘
[FIB], fibrinogen concentration; CP, cryo poor; CR, cryo rich; FAWB, fibrinogen-adjusted whole blood; HAWB, hematocrit-adjusted whole blood; HCT, hematocrit; LR DIL,LR dilution; NWB, normal whole blood; PAWB, platelet-adjusted whole blood; PLT, platelet; PTS, patient’s; WB, whole blood.
Copyright © Lippincott Williams & Wilkins. Unauthorized reproduction of this article is prohibited.
day, and allowed to rest upright in a test tube rack for
30 min at room temperature. A baseline sample was also
collected for hematocrit and platelet count determina-
tion.
Pig blood collection procedureThis study was conducted in a facility accredited by the
Association for the Assessment and Accreditation of
Laboratory Animal Care, International. This study has
been conducted in compliance with the Animal Welfare
Act, the implementing Animal Welfare Regulations, and
the principles of the Guide for the Care and Use of
Laboratory Animals.
Yorkshire-cross female pigs weighing 53.7� 1.5 kg
were obtained from Midwest Swine Research (Gibbon,
Minnesota, USA). Each pig was fasted approximately
12–18 h prior to the blood draw procedure with water
available ad lib. On the day of the procedure, the pigs
were injected with glycopyrrolate (0.01 mg/kg) and tile-
tamine–zolazepam (8 mg/kg) intramuscular, for secretion
control and sedation, respectively. Anesthesia was
induced via a facemask with �5% isoflurane in 100%
oxygen and the animals were intubated. During the
percutaneous procedure, anesthesia was maintained with
1–3% isoflurane in 100% oxygen using a ventilator and
monitor (Draeger Medical Apollo Gas anesthesia system
w/ isoflurane vaporizer and Infinity Explorer Monitoring
System; Telford, Pennsylvania, USA). Sterile procedure
was followed using ultrasound (Sonocite 180; SonoCite,
Inc., Bothell, Washington, USA) to guide access to the
femoral vein. The vein was cannulated (SI-09700, 7 Fr.
Side-port/ Percutaneous Sheath Catheter Introducer Set;
Arrow International, Reading, Pennsylvania, USA).
Blood (150 ml) was collected in syringes (30 ml capacity,
Becton–Dickinson) and transferred into 33 tubes (4.5 ml
blue top 3.2% Na citrate) and the tubes were allowed to
rest upright in a test tube rack for 30 min at room
temperature. A baseline sample was also collected for
hematocrit and platelet count determination.
As the results had such small standard deviations for the
humans, a power analysis demonstrated that only n¼ 4
were needed to be able to detect significant changes with
the pig data.
Blood component procedureFrom this point forward, the same procedures were used
on both human and pig blood. An overview of each
component’s target adjustments is shown in Table 1.
The resulting levels of each of the blood components
(hematocrit, platelets, and fibrinogen) in the four treat-
ments (lactated Ringer’s, HAWB, PAWB, and FAWB)
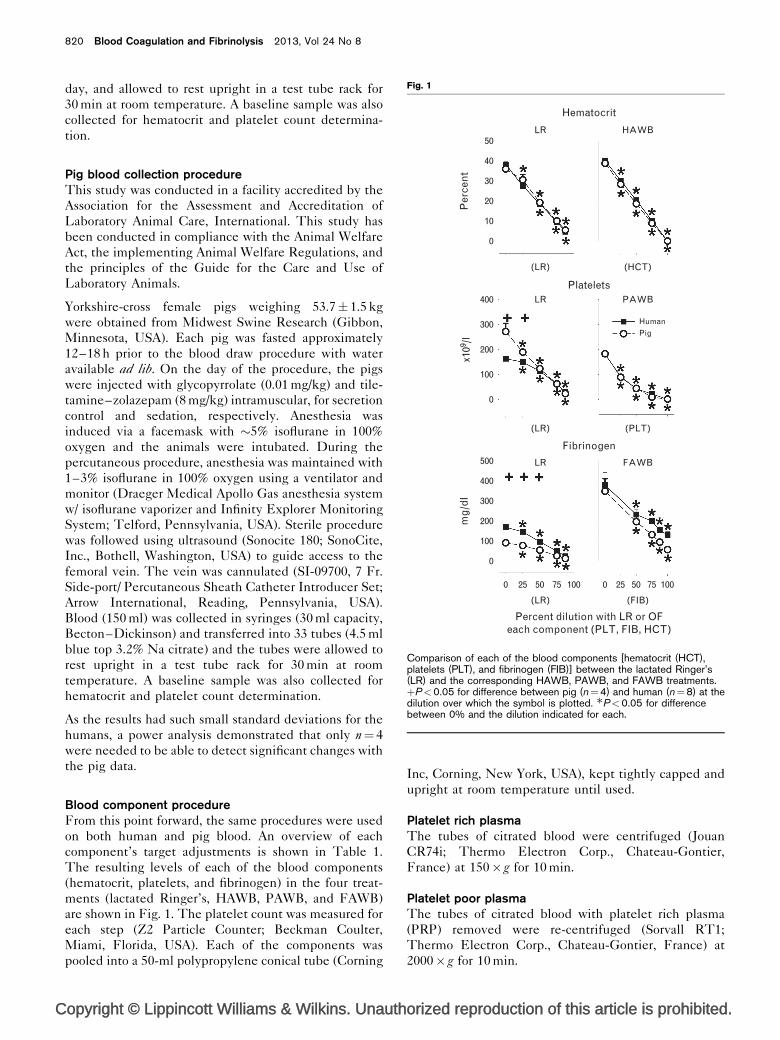
are shown in Fig. 1. The platelet count was measured for
each step (Z2 Particle Counter; Beckman Coulter,
Miami, Florida, USA). Each of the components was
pooled into a 50-ml polypropylene conical tube (Corning
Inc, Corning, New York, USA), kept tightly capped and
upright at room temperature until used.
Platelet rich plasmaThe tubes of citrated blood were centrifuged (Jouan
CR74i; Thermo Electron Corp., Chateau-Gontier,
France) at 150� g for 10 min.
Platelet poor plasmaThe tubes of citrated blood with platelet rich plasma
(PRP) removed were re-centrifuged (Sorvall RT1;
Thermo Electron Corp., Chateau-Gontier, France) at
2000� g for 10 min.
820 Blood Coagulation and Fibrinolysis 2013, Vol 24 No 8
Fig. 1
50
40
LR HAWB
(LR) (HCT)
(LR) (PLT)
LR PAWB
HumanPig
LR FAWB
(LR)
0 25 50 75 100 0 25 50 75 100
(FIB)
Percent dilution with LR or OFeach component (PLT, FIB, HCT)
Hematocrit
Per
cen
tx1
09 /lm
g/d
l
Platelets
Fibrinogen
30
20
10
0
400
300
200
100
0
500
400
300
200
100
0
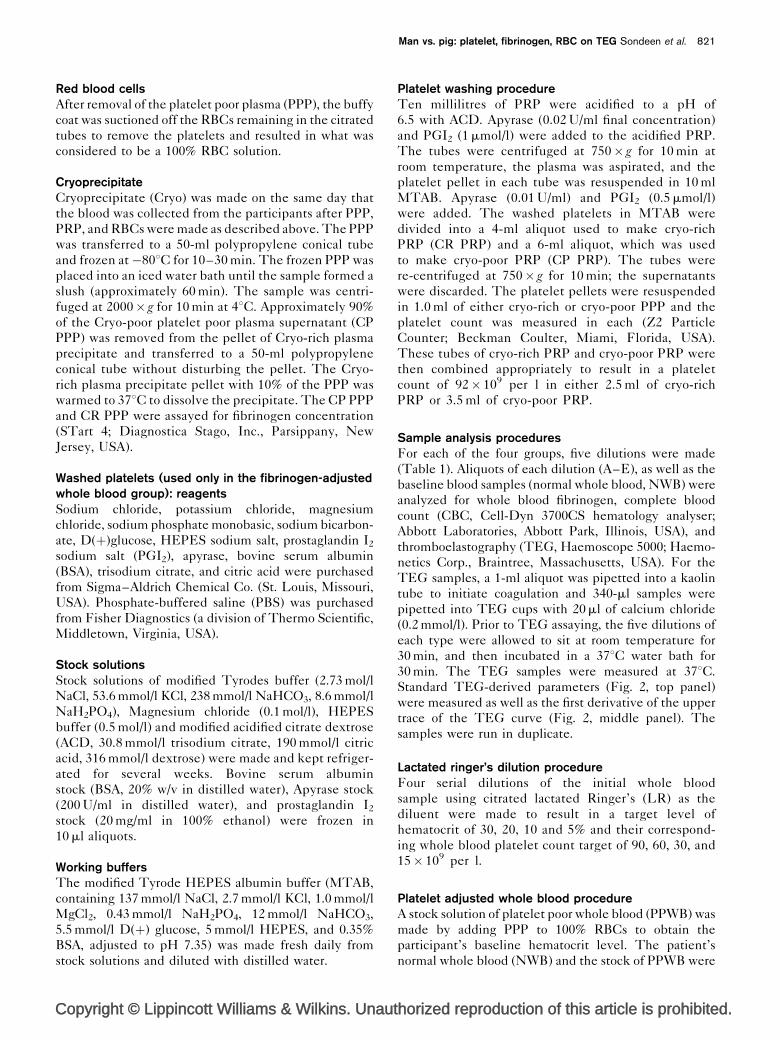
Comparison of each of the blood components [hematocrit (HCT),platelets (PLT), and fibrinogen (FIB)] between the lactated Ringer’s(LR) and the corresponding HAWB, PAWB, and FAWB treatments.þP<0.05 for difference between pig (n¼4) and human (n¼8) at thedilution over which the symbol is plotted. �P<0.05 for differencebetween 0% and the dilution indicated for each.
Copyright © Lippincott Williams & Wilkins. Unauthorized reproduction of this article is prohibited.
Red blood cellsAfter removal of the platelet poor plasma (PPP), the buffy
coat was suctioned off the RBCs remaining in the citrated
tubes to remove the platelets and resulted in what was
considered to be a 100% RBC solution.
CryoprecipitateCryoprecipitate (Cryo) was made on the same day that
the blood was collected from the participants after PPP,
PRP, and RBCs were made as described above. The PPP
was transferred to a 50-ml polypropylene conical tube
and frozen at�808C for 10–30 min. The frozen PPP was
placed into an iced water bath until the sample formed a
slush (approximately 60 min). The sample was centri-
fuged at 2000� g for 10 min at 48C. Approximately 90%
of the Cryo-poor platelet poor plasma supernatant (CP
PPP) was removed from the pellet of Cryo-rich plasma
precipitate and transferred to a 50-ml polypropylene
conical tube without disturbing the pellet. The Cryo-
rich plasma precipitate pellet with 10% of the PPP was
warmed to 378C to dissolve the precipitate. The CP PPP
and CR PPP were assayed for fibrinogen concentration
(STart 4; Diagnostica Stago, Inc., Parsippany, New
Jersey, USA).
Washed platelets (used only in the fibrinogen-adjustedwhole blood group): reagentsSodium chloride, potassium chloride, magnesium
chloride, sodium phosphate monobasic, sodium bicarbon-
ate, D(þ)glucose, HEPES sodium salt, prostaglandin I2
sodium salt (PGI2), apyrase, bovine serum albumin
(BSA), trisodium citrate, and citric acid were purchased
from Sigma–Aldrich Chemical Co. (St. Louis, Missouri,
USA). Phosphate-buffered saline (PBS) was purchased
from Fisher Diagnostics (a division of Thermo Scientific,
Middletown, Virginia, USA).
Stock solutionsStock solutions of modified Tyrodes buffer (2.73 mol/l
NaCl, 53.6 mmol/l KCl, 238 mmol/l NaHCO3, 8.6 mmol/l
NaH2PO4), Magnesium chloride (0.1 mol/l), HEPES
buffer (0.5 mol/l) and modified acidified citrate dextrose
(ACD, 30.8 mmol/l trisodium citrate, 190 mmol/l citric
acid, 316 mmol/l dextrose) were made and kept refriger-
ated for several weeks. Bovine serum albumin
stock (BSA, 20% w/v in distilled water), Apyrase stock
(200 U/ml in distilled water), and prostaglandin I2
stock (20 mg/ml in 100% ethanol) were frozen in
10 ml aliquots.
Working buffersThe modified Tyrode HEPES albumin buffer (MTAB,
containing 137 mmol/l NaCl, 2.7 mmol/l KCl, 1.0 mmol/l
MgCl2, 0.43 mmol/l NaH2PO4, 12 mmol/l NaHCO3,
5.5 mmol/l D(þ) glucose, 5 mmol/l HEPES, and 0.35%
BSA, adjusted to pH 7.35) was made fresh daily from
stock solutions and diluted with distilled water.
Platelet washing procedureTen millilitres of PRP were acidified to a pH of
6.5 with ACD. Apyrase (0.02 U/ml final concentration)
and PGI2 (1 mmol/l) were added to the acidified PRP.
The tubes were centrifuged at 750� g for 10 min at
room temperature, the plasma was aspirated, and the
platelet pellet in each tube was resuspended in 10 ml
MTAB. Apyrase (0.01 U/ml) and PGI2 (0.5 mmol/l)
were added. The washed platelets in MTAB were
divided into a 4-ml aliquot used to make cryo-rich
PRP (CR PRP) and a 6-ml aliquot, which was used
to make cryo-poor PRP (CP PRP). The tubes were
re-centrifuged at 750� g for 10 min; the supernatants
were discarded. The platelet pellets were resuspended
in 1.0 ml of either cryo-rich or cryo-poor PPP and the
platelet count was measured in each (Z2 Particle
Counter; Beckman Coulter, Miami, Florida, USA).
These tubes of cryo-rich PRP and cryo-poor PRP were
then combined appropriately to result in a platelet
count of 92� 109 per l in either 2.5 ml of cryo-rich
PRP or 3.5 ml of cryo-poor PRP.
Sample analysis proceduresFor each of the four groups, five dilutions were made
(Table 1). Aliquots of each dilution (A–E), as well as the
baseline blood samples (normal whole blood, NWB) were
analyzed for whole blood fibrinogen, complete blood
count (CBC, Cell-Dyn 3700CS hematology analyser;
Abbott Laboratories, Abbott Park, Illinois, USA), and
thromboelastography (TEG, Haemoscope 5000; Haemo-
netics Corp., Braintree, Massachusetts, USA). For the
TEG samples, a 1-ml aliquot was pipetted into a kaolin
tube to initiate coagulation and 340-ml samples were
pipetted into TEG cups with 20 ml of calcium chloride
(0.2 mmol/l). Prior to TEG assaying, the five dilutions of
each type were allowed to sit at room temperature for
30 min, and then incubated in a 378C water bath for
30 min. The TEG samples were measured at 378C.
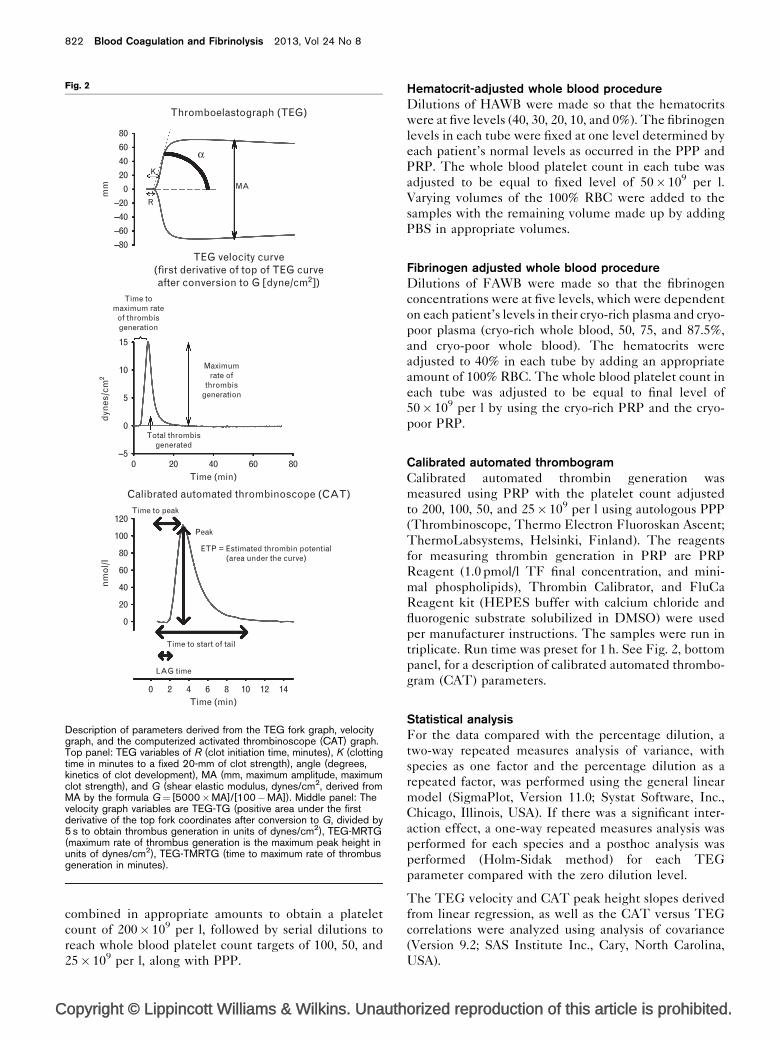
Standard TEG-derived parameters (Fig. 2, top panel)
were measured as well as the first derivative of the upper
trace of the TEG curve (Fig. 2, middle panel). The
samples were run in duplicate.
Lactated ringer’s dilution procedureFour serial dilutions of the initial whole blood
sample using citrated lactated Ringer’s (LR) as the
diluent were made to result in a target level of
hematocrit of 30, 20, 10 and 5% and their correspond-
ing whole blood platelet count target of 90, 60, 30, and
15� 109 per l.
Platelet adjusted whole blood procedureA stock solution of platelet poor whole blood (PPWB) was
made by adding PPP to 100% RBCs to obtain the
participant’s baseline hematocrit level. The patient’s
normal whole blood (NWB) and the stock of PPWB were
Man vs. pig: platelet, fibrinogen, RBC on TEG Sondeen et al. 821
Copyright © Lippincott Williams & Wilkins. Unauthorized reproduction of this article is prohibited.
combined in appropriate amounts to obtain a platelet
count of 200� 109 per l, followed by serial dilutions to
reach whole blood platelet count targets of 100, 50, and
25� 109 per l, along with PPP.
Hematocrit-adjusted whole blood procedureDilutions of HAWB were made so that the hematocrits
were at five levels (40, 30, 20, 10, and 0%). The fibrinogen
levels in each tube were fixed at one level determined by
each patient’s normal levels as occurred in the PPP and
PRP. The whole blood platelet count in each tube was
adjusted to be equal to fixed level of 50� 109 per l.
Varying volumes of the 100% RBC were added to the
samples with the remaining volume made up by adding
PBS in appropriate volumes.
Fibrinogen adjusted whole blood procedureDilutions of FAWB were made so that the fibrinogen
concentrations were at five levels, which were dependent
on each patient’s levels in their cryo-rich plasma and cryo-
poor plasma (cryo-rich whole blood, 50, 75, and 87.5%,
and cryo-poor whole blood). The hematocrits were
adjusted to 40% in each tube by adding an appropriate
amount of 100% RBC. The whole blood platelet count in
each tube was adjusted to be equal to final level of
50� 109 per l by using the cryo-rich PRP and the cryo-
poor PRP.
Calibrated automated thrombogramCalibrated automated thrombin generation was
measured using PRP with the platelet count adjusted
to 200, 100, 50, and 25� 109 per l using autologous PPP
(Thrombinoscope, Thermo Electron Fluoroskan Ascent;
ThermoLabsystems, Helsinki, Finland). The reagents
for measuring thrombin generation in PRP are PRP
Reagent (1.0 pmol/l TF final concentration, and mini-
mal phospholipids), Thrombin Calibrator, and FluCa
Reagent kit (HEPES buffer with calcium chloride and
fluorogenic substrate solubilized in DMSO) were used
per manufacturer instructions. The samples were run in
triplicate. Run time was preset for 1 h. See Fig. 2, bottom
panel, for a description of calibrated automated thrombo-
gram (CAT) parameters.
Statistical analysisFor the data compared with the percentage dilution, a
two-way repeated measures analysis of variance, with
species as one factor and the percentage dilution as a
repeated factor, was performed using the general linear
model (SigmaPlot, Version 11.0; Systat Software, Inc.,
Chicago, Illinois, USA). If there was a significant inter-
action effect, a one-way repeated measures analysis was
performed for each species and a posthoc analysis was
performed (Holm-Sidak method) for each TEG
parameter compared with the zero dilution level.
The TEG velocity and CAT peak height slopes derived
from linear regression, as well as the CAT versus TEG
correlations were analyzed using analysis of covariance
(Version 9.2; SAS Institute Inc., Cary, North Carolina,
USA).
822 Blood Coagulation and Fibrinolysis 2013, Vol 24 No 8
Fig. 2
80
α
MA
mm
dyn
es/c
m2
nm
ol/
l
Time tomaximum rate
of thrombisgeneration
Time to peak
Peak
ETP = Estimated thrombin potential(area under the curve)
Time to start of tail
LAG time
Maximumrate of
thrombisgeneration
Total thrombisgenerated
TEG velocity curve(first derivative of top of TEG curveafter conversion to G [dyne/cm2])
Calibrated automated thrombinoscope (CAT)
Thromboelastograph (TEG)
R
K
60
40
20
0
–20
–40
–60
–80
15
10
5
0
–5
0
20
40
60
80
100
120
0
0 2 4 6 8 10 12 14
20 40Time (min)
Time (min)
60 80
Description of parameters derived from the TEG fork graph, velocitygraph, and the computerized activated thrombinoscope (CAT) graph.Top panel: TEG variables of R (clot initiation time, minutes), K (clottingtime in minutes to a fixed 20-mm of clot strength), angle (degrees,kinetics of clot development), MA (mm, maximum amplitude, maximumclot strength), and G (shear elastic modulus, dynes/cm2, derived fromMA by the formula G¼ [5000�MA]/[100�MA]). Middle panel: Thevelocity graph variables are TEG-TG (positive area under the firstderivative of the top fork coordinates after conversion to G, divided by5 s to obtain thrombus generation in units of dynes/cm2), TEG-MRTG(maximum rate of thrombus generation is the maximum peak height inunits of dynes/cm2), TEG-TMRTG (time to maximum rate of thrombusgeneration in minutes).
Copyright © Lippincott Williams & Wilkins. Unauthorized reproduction of this article is prohibited.
The TEG parameter data were log10 transformed and a
regression analysis using a two-order polynomial was used
to fit the TEG parameters against levels of platelets,
hematocrit, or fibrinogen. Interaction effects associated
with species (human versus pig) were tested for the
quadratic, linear and intercept components of the model.
P-values less than 0.05 were considered significant. (JMP,
Version 9.0; SAS Institute Inc.) The statistical signifi-
cance is given in table form adjacent to the graphical
results of each of the comparisons. Results are presented
as means�SD.
ResultsAs shown in Fig. 1 for the lactated Ringer’s group, the
dilution of the platelets and fibrinogen levels were
determined by each of the patient’s endogenous base-
line levels, while the starting hematocrit was set at
40% for both the human and pig. Thus, while there
were significant reductions from baseline, there were
also significant differences between humans and pigs
in the platelet count and fibrinogen concentration for
the lactated Ringer’s treatment at baseline (Fig. 1).
There was no difference between human and pig for
the PAWB, HAWB, and FAWB treatments since the
platelets and hematocrit were targeted at specific
levels for both the human and pig, while the fibrino-
gen levels were determined by each of the patient’s
endogenous baseline levels or for the cryo-rich level
in FAWB.
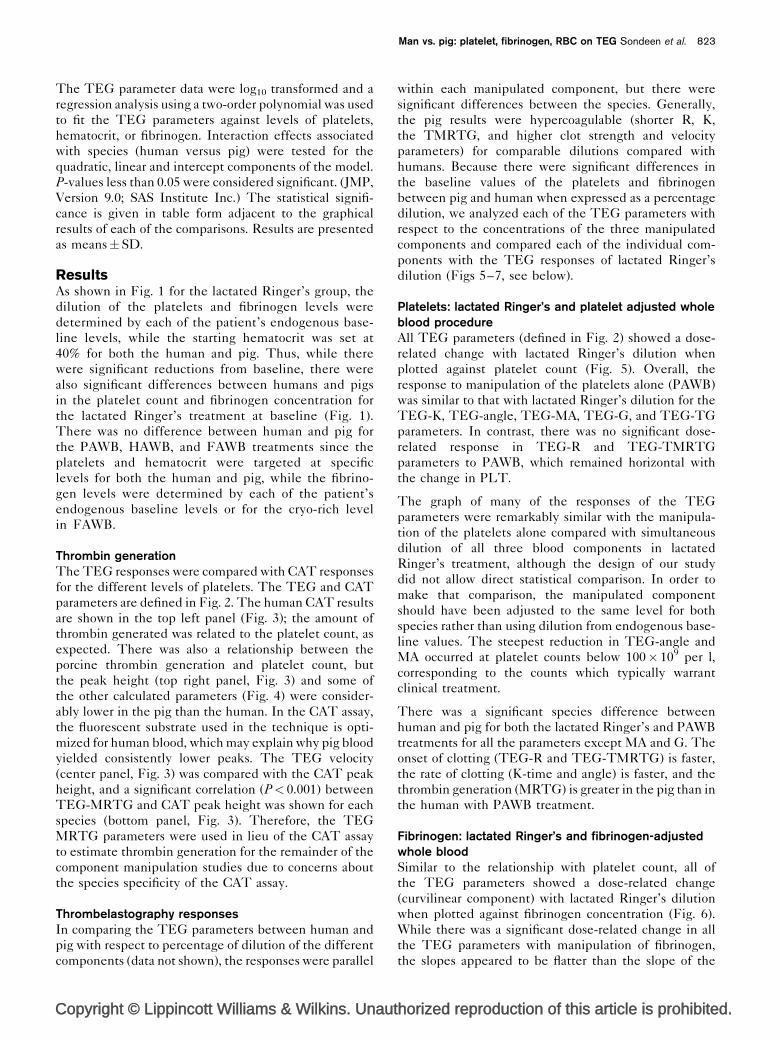
Thrombin generationThe TEG responses were compared with CAT responses
for the different levels of platelets. The TEG and CAT
parameters are defined in Fig. 2. The human CAT results
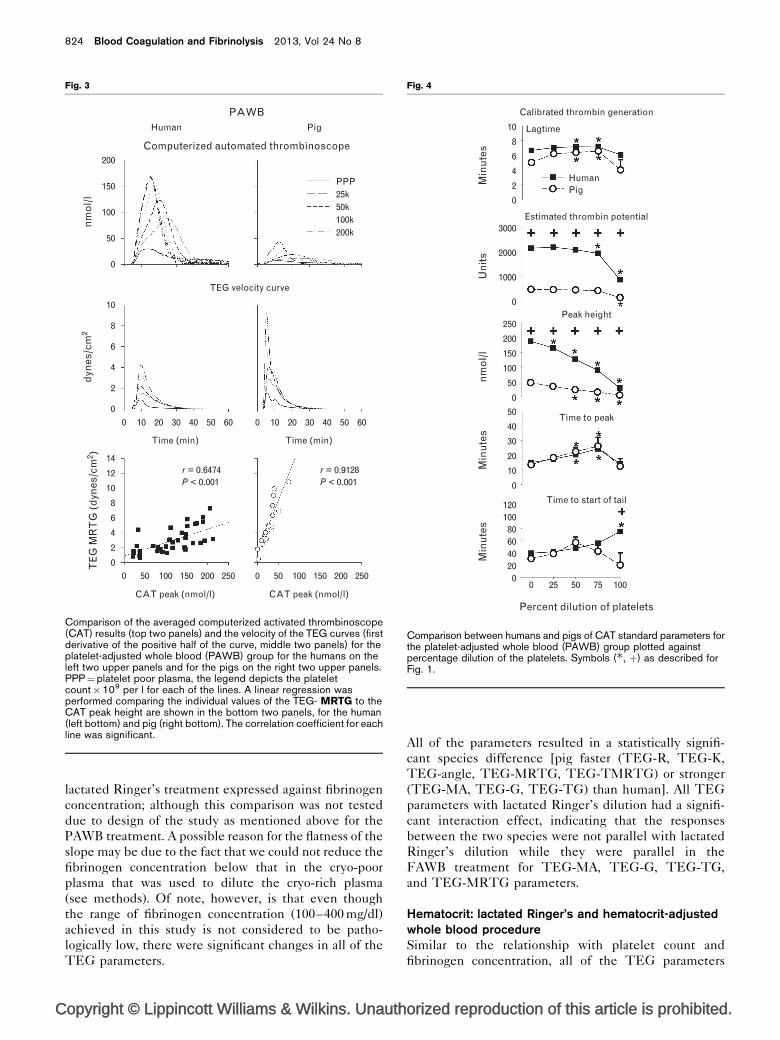
are shown in the top left panel (Fig. 3); the amount of
thrombin generated was related to the platelet count, as
expected. There was also a relationship between the
porcine thrombin generation and platelet count, but
the peak height (top right panel, Fig. 3) and some of
the other calculated parameters (Fig. 4) were consider-
ably lower in the pig than the human. In the CAT assay,
the fluorescent substrate used in the technique is opti-
mized for human blood, which may explain why pig blood
yielded consistently lower peaks. The TEG velocity
(center panel, Fig. 3) was compared with the CAT peak
height, and a significant correlation (P< 0.001) between
TEG-MRTG and CAT peak height was shown for each
species (bottom panel, Fig. 3). Therefore, the TEG
MRTG parameters were used in lieu of the CAT assay
to estimate thrombin generation for the remainder of the
component manipulation studies due to concerns about
the species specificity of the CAT assay.
Thrombelastography responsesIn comparing the TEG parameters between human and
pig with respect to percentage of dilution of the different
components (data not shown), the responses were parallel
within each manipulated component, but there were
significant differences between the species. Generally,
the pig results were hypercoagulable (shorter R, K,
the TMRTG, and higher clot strength and velocity
parameters) for comparable dilutions compared with
humans. Because there were significant differences in
the baseline values of the platelets and fibrinogen
between pig and human when expressed as a percentage
dilution, we analyzed each of the TEG parameters with
respect to the concentrations of the three manipulated
components and compared each of the individual com-
ponents with the TEG responses of lactated Ringer’s
dilution (Figs 5–7, see below).
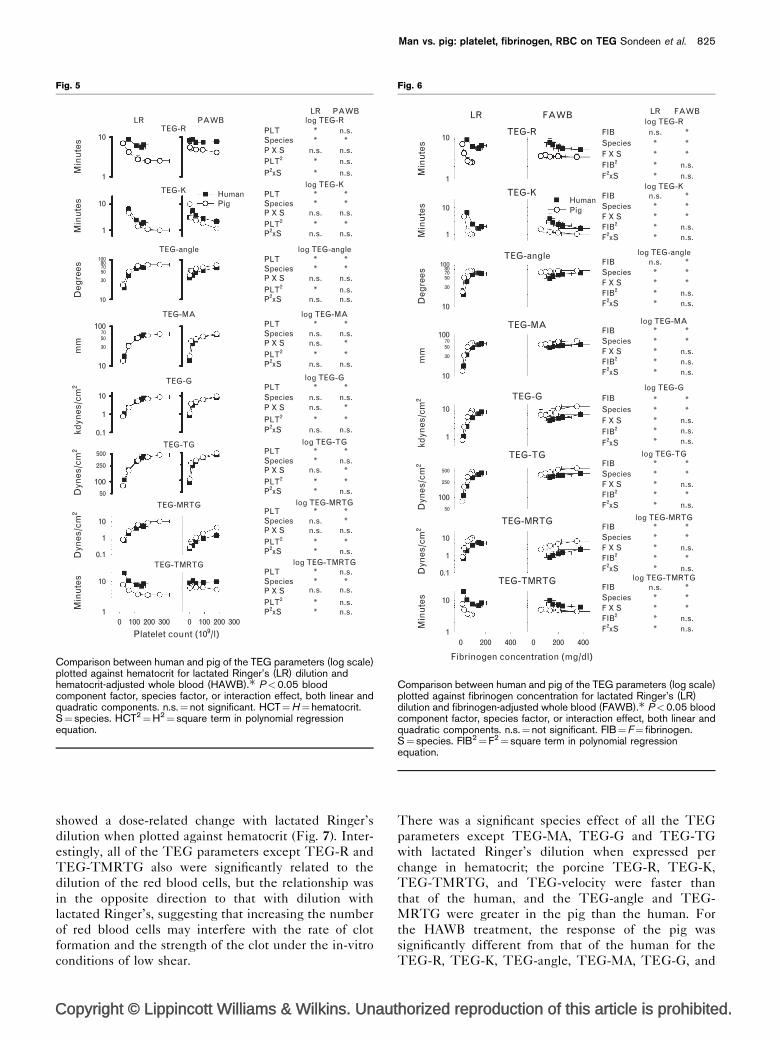
Platelets: lactated Ringer’s and platelet adjusted wholeblood procedureAll TEG parameters (defined in Fig. 2) showed a dose-
related change with lactated Ringer’s dilution when
plotted against platelet count (Fig. 5). Overall, the
response to manipulation of the platelets alone (PAWB)
was similar to that with lactated Ringer’s dilution for the
TEG-K, TEG-angle, TEG-MA, TEG-G, and TEG-TG
parameters. In contrast, there was no significant dose-
related response in TEG-R and TEG-TMRTG
parameters to PAWB, which remained horizontal with
the change in PLT.
The graph of many of the responses of the TEG
parameters were remarkably similar with the manipula-
tion of the platelets alone compared with simultaneous
dilution of all three blood components in lactated
Ringer’s treatment, although the design of our study
did not allow direct statistical comparison. In order to
make that comparison, the manipulated component
should have been adjusted to the same level for both
species rather than using dilution from endogenous base-
line values. The steepest reduction in TEG-angle and
MA occurred at platelet counts below 100� 109 per l,
corresponding to the counts which typically warrant
clinical treatment.
There was a significant species difference between
human and pig for both the lactated Ringer’s and PAWB
treatments for all the parameters except MA and G. The
onset of clotting (TEG-R and TEG-TMRTG) is faster,
the rate of clotting (K-time and angle) is faster, and the
thrombin generation (MRTG) is greater in the pig than in
the human with PAWB treatment.
Fibrinogen: lactated Ringer’s and fibrinogen-adjustedwhole bloodSimilar to the relationship with platelet count, all of
the TEG parameters showed a dose-related change
(curvilinear component) with lactated Ringer’s dilution
when plotted against fibrinogen concentration (Fig. 6).
While there was a significant dose-related change in all
the TEG parameters with manipulation of fibrinogen,
the slopes appeared to be flatter than the slope of the
Man vs. pig: platelet, fibrinogen, RBC on TEG Sondeen et al. 823
Copyright © Lippincott Williams & Wilkins. Unauthorized reproduction of this article is prohibited.
lactated Ringer’s treatment expressed against fibrinogen
concentration; although this comparison was not tested
due to design of the study as mentioned above for the
PAWB treatment. A possible reason for the flatness of the
slope may be due to the fact that we could not reduce the
fibrinogen concentration below that in the cryo-poor
plasma that was used to dilute the cryo-rich plasma
(see methods). Of note, however, is that even though
the range of fibrinogen concentration (100–400 mg/dl)
achieved in this study is not considered to be patho-
logically low, there were significant changes in all of the
TEG parameters.
All of the parameters resulted in a statistically signifi-
cant species difference [pig faster (TEG-R, TEG-K,
TEG-angle, TEG-MRTG, TEG-TMRTG) or stronger
(TEG-MA, TEG-G, TEG-TG) than human]. All TEG
parameters with lactated Ringer’s dilution had a signifi-
cant interaction effect, indicating that the responses
between the two species were not parallel with lactated
Ringer’s dilution while they were parallel in the
FAWB treatment for TEG-MA, TEG-G, TEG-TG,
and TEG-MRTG parameters.
Hematocrit: lactated Ringer’s and hematocrit-adjustedwhole blood procedureSimilar to the relationship with platelet count and
fibrinogen concentration, all of the TEG parameters
824 Blood Coagulation and Fibrinolysis 2013, Vol 24 No 8
Fig. 3
PAWBHuman
200
PPP25k50k100k200k
150
100
50
0
10
8
6
4
2
0
0
2
4
6
8
10
12
14
0
0 50 100 150 200 250 0 50 100 150 200 250
10 20 30 40 50 60 0 10 20 30 40 50 60
Pig
Computerized automated thrombinoscope
nm
ol/
ld
ynes
/cm
2T
EG
MR
TG
(d
ynes
/cm
2 )
TEG velocity curve
Time (min)
r = 0.6474P < 0.001
r = 0.9128P < 0.001
CAT peak (nmol/l)
Time (min)
CAT peak (nmol/l)
Comparison of the averaged computerized activated thrombinoscope(CAT) results (top two panels) and the velocity of the TEG curves (firstderivative of the positive half of the curve, middle two panels) for theplatelet-adjusted whole blood (PAWB) group for the humans on theleft two upper panels and for the pigs on the right two upper panels.PPP¼platelet poor plasma, the legend depicts the plateletcount�109 per l for each of the lines. A linear regression wasperformed comparing the individual values of the TEG- MRTG to theCAT peak height are shown in the bottom two panels, for the human(left bottom) and pig (right bottom). The correlation coefficient for eachline was significant.
Fig. 4
Calibrated thrombin generation
Estimated thrombin potential
Peak height
Time to peak
Time to start of tail
Percent dilution of platelets
Lagtime
HumanMin
ute
sU
nit
sn
mo
l/l
Min
ute
sM
inu
tes
Pig0
0
0
0
00 25 50 75 100
20406080
100120
10
20
30
40
50
50
100
150
200
250
1000
2000
3000
2
4
6
8
10
Comparison between humans and pigs of CAT standard parameters forthe platelet-adjusted whole blood (PAWB) group plotted againstpercentage dilution of the platelets. Symbols (�, þ) as described forFig. 1.
Copyright © Lippincott Williams & Wilkins. Unauthorized reproduction of this article is prohibited.
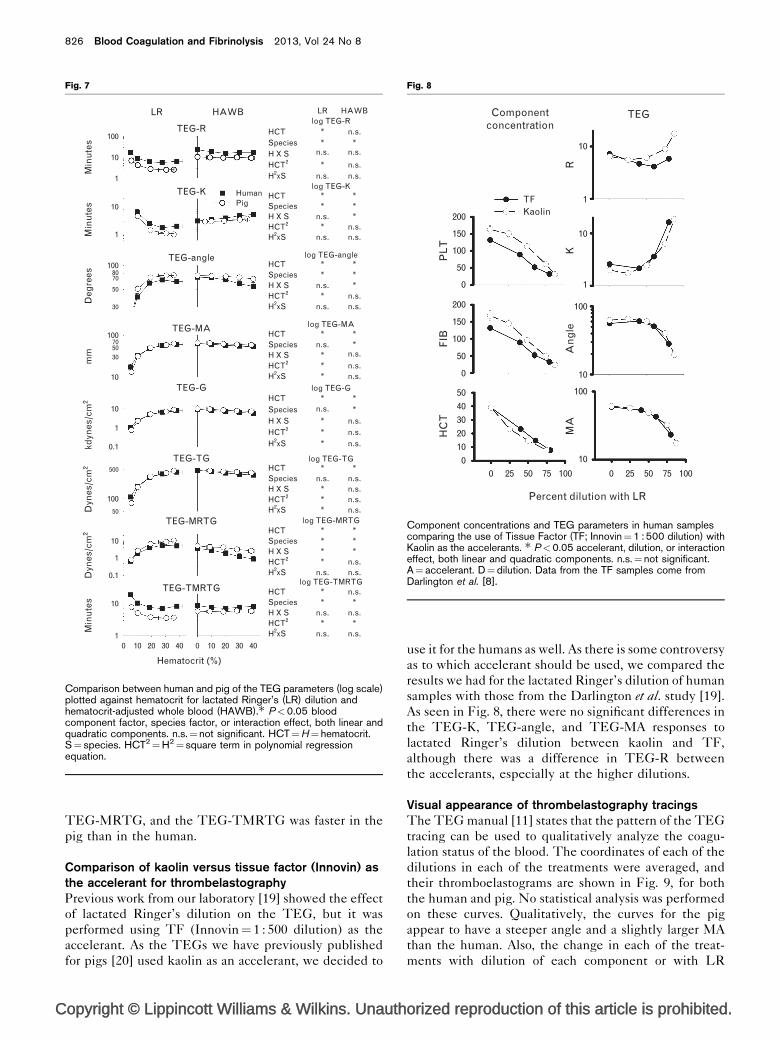
showed a dose-related change with lactated Ringer’s
dilution when plotted against hematocrit (Fig. 7). Inter-
estingly, all of the TEG parameters except TEG-R and
TEG-TMRTG also were significantly related to the
dilution of the red blood cells, but the relationship was
in the opposite direction to that with dilution with
lactated Ringer’s, suggesting that increasing the number
of red blood cells may interfere with the rate of clot
formation and the strength of the clot under the in-vitro
conditions of low shear.
There was a significant species effect of all the TEG
parameters except TEG-MA, TEG-G and TEG-TG
with lactated Ringer’s dilution when expressed per
change in hematocrit; the porcine TEG-R, TEG-K,
TEG-TMRTG, and TEG-velocity were faster than
that of the human, and the TEG-angle and TEG-
MRTG were greater in the pig than the human. For
the HAWB treatment, the response of the pig was
significantly different from that of the human for the
TEG-R, TEG-K, TEG-angle, TEG-MA, TEG-G, and
Man vs. pig: platelet, fibrinogen, RBC on TEG Sondeen et al. 825
Fig. 5
LRLR
log TEG-R
log TEG-K
log TEG-angle
log TEG-MA
log TEG-G
log TEG-TG
log TEG-MRTG
log TEG-TMRTG
PLT *
*
*
*
*
*
* **
**
** *
**
*
*
**
*
*
*
**
*
*
*
***
** *
*
** *
* *
* *
**
n.s.
n.s.
n.s.
n.s. n.s.
n.s.
n.s.
n.s. n.s.
n.s.
n.s.
n.s.
n.s.n.s.
n.s.
n.s.
n.s.
n.s.n.s.
n.s.
n.s.
n.s.
n.s.
n.s.
n.s.
n.s.n.s.n.s.n.s.
n.s.
n.s. n.s.
n.s.n.s.n.s.
n.s.SpeciesP X SPLT2
P2xS
PLTSpeciesP X SPLT2
P2xS
PLTSpeciesP X SPLT2
P2xS
PLTSpeciesP X SPLT2
P2xS
PLTSpeciesP X S
PLT2
P2xS
PLTSpeciesP X SPLT2
P2xS
PLTSpeciesP X SPLT2
P2xS
PLTSpeciesP X SPLT2
P2xS
Min
ute
sM
inu
tes
Deg
rees
mm
kdyn
es/c
m2
Dyn
es/c
m2
Dyn
es/c
m2
Min
ute
s
10
1
10
100
10
10
1
0.1
100
10
1
0.1
10
10 100 200 300 0 100
Platelet count (109/l)200 300
500
250
50
1008070
7050
30
50
30
10
1
PAWBPAWB
HumanPig
TEG-R
TEG-K
TEG-angle
TEG-MA
TEG-G
TEG-TG
TEG-MRTG
TEG-TMRTG
Comparison between human and pig of the TEG parameters (log scale)plotted against hematocrit for lactated Ringer’s (LR) dilution andhematocrit-adjusted whole blood (HAWB).� P<0.05 bloodcomponent factor, species factor, or interaction effect, both linear andquadratic components. n.s.¼not significant. HCT¼H¼hematocrit.S¼ species. HCT2¼H2¼ square term in polynomial regressionequation.
Fig. 6
LR LR
FIB n.s.
n.s.
n.s.
n.s.n.s.
n.s.
***
***
****
*
***
n.s.
n.s.n.s.
n.s.n.s.n.s.
****
* **
n.s.n.s.n.s.
**
****
*****
n.s.*
n.s.
**
*****
n.s.*
n.s.
**
*****
*n.s.n.s.
**
n.s.****
***
SpeciesF X SFIB2
F2xS
FIBSpeciesF X SFIB2
F2xS
FIBSpeciesF X SFIB2
F2xS
FIBSpeciesF X SFIB2
F2xS
FIBSpeciesF X SFIB2
F2xS
FIBSpeciesF X SFIB2
F2xS
FIBSpeciesF X SFIB2
F2xS
FIBSpeciesF X SFIB2
F2xS
log TEG-R
log TEG-K
log TEG-angle
log TEG-MA
log TEG-G
log TEG-TG
log TEG-MRTG
log TEG-TMRTG
Min
ute
sM
inu
tes
Deg
rees
mm
kdyn
es/c
m2
Dyn
es/c
m2
Dyn
es/c
m2
Min
ute
s
10
10
100
10
100
10
10
1
100
10
10
1
10 200 400 0 200 400
0.1
8070
70
50
50
30
30
500
250
50
1
1
FAWB FAWB
TEG-R
TEG-KHumanPig
TEG-angle
TEG-MA
TEG-G
TEG-TG
TEG-MRTG
TEG-TMRTG
Fibrinogen concentration (mg/dl)
Comparison between human and pig of the TEG parameters (log scale)plotted against fibrinogen concentration for lactated Ringer’s (LR)dilution and fibrinogen-adjusted whole blood (FAWB).� P<0.05 bloodcomponent factor, species factor, or interaction effect, both linear andquadratic components. n.s.¼not significant. FIB¼F¼ fibrinogen.S¼ species. FIB2¼F2¼ square term in polynomial regressionequation.
Copyright © Lippincott Williams & Wilkins. Unauthorized reproduction of this article is prohibited.
TEG-MRTG, and the TEG-TMRTG was faster in the
pig than in the human.
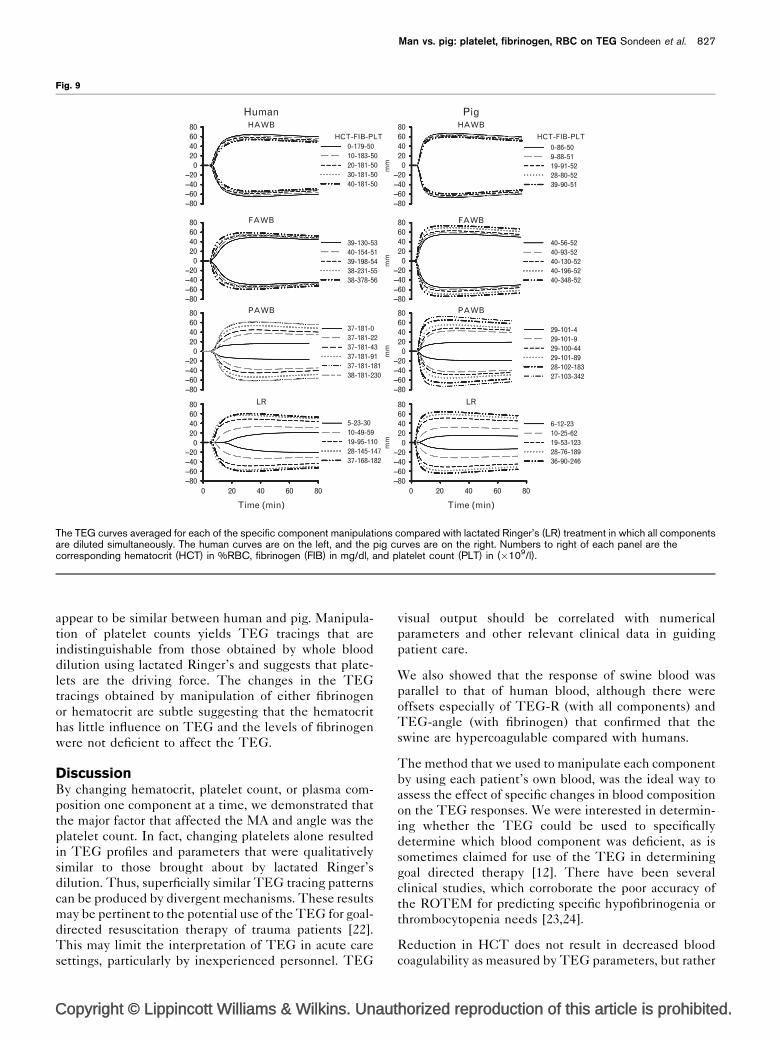
Comparison of kaolin versus tissue factor (Innovin) asthe accelerant for thrombelastographyPrevious work from our laboratory [19] showed the effect
of lactated Ringer’s dilution on the TEG, but it was
performed using TF (Innovin¼ 1 : 500 dilution) as the
accelerant. As the TEGs we have previously published
for pigs [20] used kaolin as an accelerant, we decided to
use it for the humans as well. As there is some controversy
as to which accelerant should be used, we compared the
results we had for the lactated Ringer’s dilution of human
samples with those from the Darlington et al. study [19].
As seen in Fig. 8, there were no significant differences in
the TEG-K, TEG-angle, and TEG-MA responses to
lactated Ringer’s dilution between kaolin and TF,
although there was a difference in TEG-R between
the accelerants, especially at the higher dilutions.
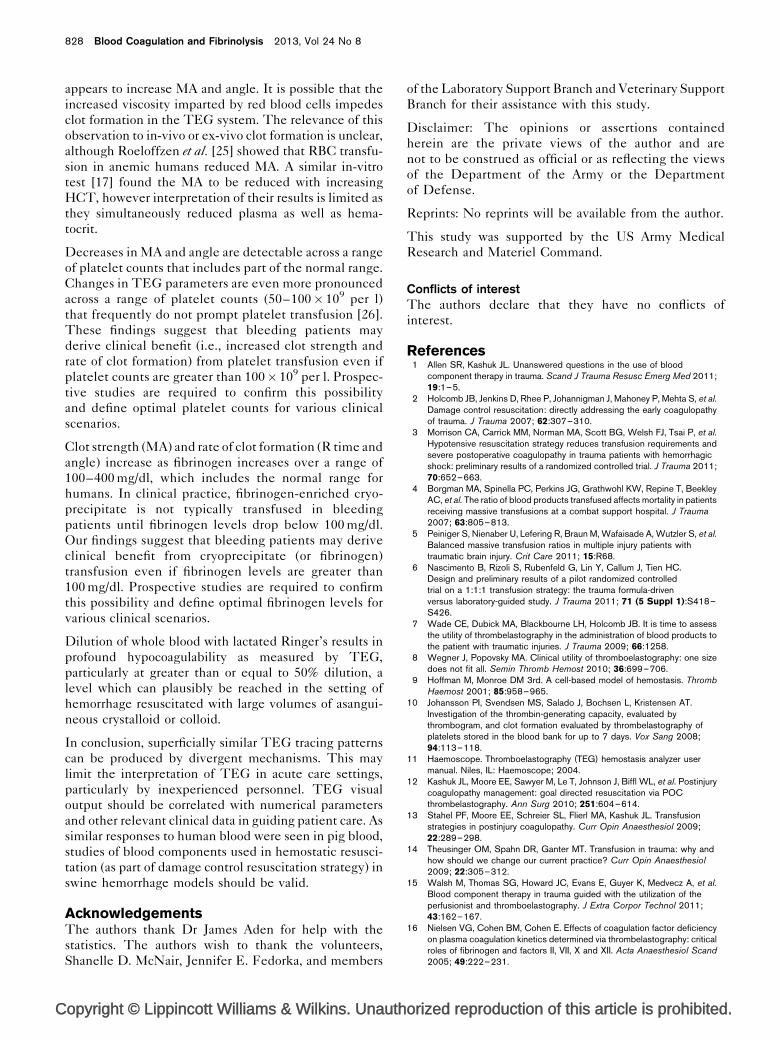
Visual appearance of thrombelastography tracingsThe TEG manual [11] states that the pattern of the TEG
tracing can be used to qualitatively analyze the coagu-
lation status of the blood. The coordinates of each of the
dilutions in each of the treatments were averaged, and
their thromboelastograms are shown in Fig. 9, for both
the human and pig. No statistical analysis was performed
on these curves. Qualitatively, the curves for the pig
appear to have a steeper angle and a slightly larger MA
than the human. Also, the change in each of the treat-
ments with dilution of each component or with LR
826 Blood Coagulation and Fibrinolysis 2013, Vol 24 No 8
Fig. 7
LR
100
10
10
100
100
10
10
100
10
10
10 10 20 30 40 0 10 20 30 40
1
0.1
1
0.1
8070
70
50
50
30
30
500
50
1
1
TEG-R
Min
ute
sM
inu
tes
Deg
rees
mm
kdyn
es/c
m2
Dyn
es/c
m2
Dyn
es/c
m2
Min
ute
s
TEG-K
TEG-angle
TEG-MA
TEG-G
TEG-TG
TEG-MRTG
TEG-TMRTG
Hematocrit (%)
HumanPig
HAWB LR HAWBlog TEG-R
log TEG-K
log TEG-angle
log TEG-MA
log TEG-G
log TEG-TG
log TEG-MRTG
log TEG-TMRTG
HCT *
*
*
* **
**
*
***
*
***
*
**
**
*
*
***
*
*
*n.s.
n.s.
n.s.
n.s.
n.s.n.s.
n.s.n.s.
***
** *
**
*
*n.s.
n.s.
n.s.
n.s.
n.s.
n.s.n.s.
n.s.
n.s.n.s.
n.s.n.s.n.s.
n.s.n.s.n.s.n.s.
n.s.
n.s.
**
n.s.*
n.s.
* *
*
n.s.
n.s. n.s.
n.s.n.s.n.s.
SpeciesH X SHCT2
H2xS
HCTSpeciesH X SHCT2
H2xS
HCTSpeciesH X SHCT2
H2xS
HCTSpeciesH X SHCT2
H2xS
HCTSpeciesH X SHCT2
H2xS
HCTSpeciesH X SHCT2
H2xS
HCTSpeciesH X SHCT2
H2xS
HCTSpeciesH X SHCT2
H2xS
Comparison between human and pig of the TEG parameters (log scale)plotted against hematocrit for lactated Ringer’s (LR) dilution andhematocrit-adjusted whole blood (HAWB).� P<0.05 bloodcomponent factor, species factor, or interaction effect, both linear andquadratic components. n.s.¼not significant. HCT¼H¼ hematocrit.S¼ species. HCT2¼H2¼ square term in polynomial regressionequation.
Fig. 8
Componentconcentration
TFKaolin
PL
T
RK
An
gle
MA
FIB
HC
T
200
10
10
100
100
10
10
1
1
150
100
50
0
200
150
100
50
50403020100
0 25 50 75 100
Percent dilution with LR
0 25 50 75 100
0
TEG
Component concentrations and TEG parameters in human samplescomparing the use of Tissue Factor (TF; Innovin¼1 : 500 dilution) withKaolin as the accelerants. � P<0.05 accelerant, dilution, or interactioneffect, both linear and quadratic components. n.s.¼not significant.A¼ accelerant. D¼dilution. Data from the TF samples come fromDarlington et al. [8].
Copyright © Lippincott Williams & Wilkins. Unauthorized reproduction of this article is prohibited.
appear to be similar between human and pig. Manipula-
tion of platelet counts yields TEG tracings that are
indistinguishable from those obtained by whole blood
dilution using lactated Ringer’s and suggests that plate-
lets are the driving force. The changes in the TEG
tracings obtained by manipulation of either fibrinogen
or hematocrit are subtle suggesting that the hematocrit
has little influence on TEG and the levels of fibrinogen
were not deficient to affect the TEG.
DiscussionBy changing hematocrit, platelet count, or plasma com-
position one component at a time, we demonstrated that
the major factor that affected the MA and angle was the
platelet count. In fact, changing platelets alone resulted
in TEG profiles and parameters that were qualitatively
similar to those brought about by lactated Ringer’s
dilution. Thus, superficially similar TEG tracing patterns
can be produced by divergent mechanisms. These results
may be pertinent to the potential use of the TEG for goal-
directed resuscitation therapy of trauma patients [22].
This may limit the interpretation of TEG in acute care
settings, particularly by inexperienced personnel. TEG
visual output should be correlated with numerical
parameters and other relevant clinical data in guiding
patient care.
We also showed that the response of swine blood was
parallel to that of human blood, although there were
offsets especially of TEG-R (with all components) and
TEG-angle (with fibrinogen) that confirmed that the
swine are hypercoagulable compared with humans.
The method that we used to manipulate each component
by using each patient’s own blood, was the ideal way to
assess the effect of specific changes in blood composition
on the TEG responses. We were interested in determin-
ing whether the TEG could be used to specifically
determine which blood component was deficient, as is
sometimes claimed for use of the TEG in determining
goal directed therapy [12]. There have been several
clinical studies, which corroborate the poor accuracy of
the ROTEM for predicting specific hypofibrinogenia or
thrombocytopenia needs [23,24].
Reduction in HCT does not result in decreased blood
coagulability as measured by TEG parameters, but rather
Man vs. pig: platelet, fibrinogen, RBC on TEG Sondeen et al. 827
Fig. 9
HumanHAWB
HCT-FIB-PLT
mm
mm
mm
mm
0-179-50HCT-FIB-PLT
0-86-509-88-5119-91-5228-80-5239-90-51
40-56-5240-93-5240-130-5240-196-5240-348-52
29-101-429-101-929-100-4429-101-8928-102-18327-103-342
6-12-2310-25-6219-53-12328-76-18936-90-246
10-183-5020-181-5030-181-5040-181-50
39-130-5340-154-5139-198-5438-231-5538-378-56
37-181-037-181-2237-181-4337-181-9137-181-18138-181-230
5-23-3010-49-5919-95-11028-145-14737-168-182
806040200
–20–40–60–80
806040200
–20–40–60–80
806040200
–20–40–60–80
806040200
–20–40–60–80
0 20 40 60 80 0 20 40 60 80
806040200
–20–40–60–80
806040200
–20–40–60–80
806040200
–20–40–60–80
806040200
–20–40–60–80
FAWB
PAWB
LR
Time (min) Time (min)
LR
PAWB
FAWB
PigHAWB
The TEG curves averaged for each of the specific component manipulations compared with lactated Ringer’s (LR) treatment in which all componentsare diluted simultaneously. The human curves are on the left, and the pig curves are on the right. Numbers to right of each panel are thecorresponding hematocrit (HCT) in %RBC, fibrinogen (FIB) in mg/dl, and platelet count (PLT) in (�109/l).
Copyright © Lippincott Williams & Wilkins. Unauthorized reproduction of this article is prohibited.
appears to increase MA and angle. It is possible that the
increased viscosity imparted by red blood cells impedes
clot formation in the TEG system. The relevance of this
observation to in-vivo or ex-vivo clot formation is unclear,
although Roeloffzen et al. [25] showed that RBC transfu-
sion in anemic humans reduced MA. A similar in-vitro
test [17] found the MA to be reduced with increasing
HCT, however interpretation of their results is limited as
they simultaneously reduced plasma as well as hema-
tocrit.
Decreases in MA and angle are detectable across a range
of platelet counts that includes part of the normal range.
Changes in TEG parameters are even more pronounced
across a range of platelet counts (50–100� 109 per l)
that frequently do not prompt platelet transfusion [26].
These findings suggest that bleeding patients may
derive clinical benefit (i.e., increased clot strength and
rate of clot formation) from platelet transfusion even if
platelet counts are greater than 100� 109 per l. Prospec-
tive studies are required to confirm this possibility
and define optimal platelet counts for various clinical
scenarios.
Clot strength (MA) and rate of clot formation (R time and
angle) increase as fibrinogen increases over a range of
100–400 mg/dl, which includes the normal range for
humans. In clinical practice, fibrinogen-enriched cryo-
precipitate is not typically transfused in bleeding
patients until fibrinogen levels drop below 100 mg/dl.
Our findings suggest that bleeding patients may derive
clinical benefit from cryoprecipitate (or fibrinogen)
transfusion even if fibrinogen levels are greater than
100 mg/dl. Prospective studies are required to confirm
this possibility and define optimal fibrinogen levels for
various clinical scenarios.
Dilution of whole blood with lactated Ringer’s results in
profound hypocoagulability as measured by TEG,
particularly at greater than or equal to 50% dilution, a
level which can plausibly be reached in the setting of
hemorrhage resuscitated with large volumes of asangui-
neous crystalloid or colloid.
In conclusion, superficially similar TEG tracing patterns
can be produced by divergent mechanisms. This may
limit the interpretation of TEG in acute care settings,
particularly by inexperienced personnel. TEG visual
output should be correlated with numerical parameters
and other relevant clinical data in guiding patient care. As
similar responses to human blood were seen in pig blood,
studies of blood components used in hemostatic resusci-
tation (as part of damage control resuscitation strategy) in
swine hemorrhage models should be valid.
AcknowledgementsThe authors thank Dr James Aden for help with the
statistics. The authors wish to thank the volunteers,
Shanelle D. McNair, Jennifer E. Fedorka, and members
of the Laboratory Support Branch and Veterinary Support
Branch for their assistance with this study.
Disclaimer: The opinions or assertions contained
herein are the private views of the author and are
not to be construed as official or as reflecting the views
of the Department of the Army or the Department
of Defense.
Reprints: No reprints will be available from the author.
This study was supported by the US Army Medical
Research and Materiel Command.
Conflicts of interestThe authors declare that they have no conflicts of
interest.
References1 Allen SR, Kashuk JL. Unanswered questions in the use of blood
component therapy in trauma. Scand J Trauma Resusc Emerg Med 2011;19:1–5.
2 Holcomb JB, Jenkins D, Rhee P, Johannigman J, Mahoney P, Mehta S, et al.Damage control resuscitation: directly addressing the early coagulopathyof trauma. J Trauma 2007; 62:307–310.
3 Morrison CA, Carrick MM, Norman MA, Scott BG, Welsh FJ, Tsai P, et al.Hypotensive resuscitation strategy reduces transfusion requirements andsevere postoperative coagulopathy in trauma patients with hemorrhagicshock: preliminary results of a randomized controlled trial. J Trauma 2011;70:652–663.
4 Borgman MA, Spinella PC, Perkins JG, Grathwohl KW, Repine T, BeekleyAC, et al. The ratio of blood products transfused affects mortality in patientsreceiving massive transfusions at a combat support hospital. J Trauma2007; 63:805–813.
5 Peiniger S, Nienaber U, Lefering R, Braun M, Wafaisade A, Wutzler S, et al.Balanced massive transfusion ratios in multiple injury patients withtraumatic brain injury. Crit Care 2011; 15:R68.
6 Nascimento B, Rizoli S, Rubenfeld G, Lin Y, Callum J, Tien HC.Design and preliminary results of a pilot randomized controlledtrial on a 1:1:1 transfusion strategy: the trauma formula-drivenversus laboratory-guided study. J Trauma 2011; 71 (5 Suppl 1):S418–S426.
7 Wade CE, Dubick MA, Blackbourne LH, Holcomb JB. It is time to assessthe utility of thrombelastography in the administration of blood products tothe patient with traumatic injuries. J Trauma 2009; 66:1258.
8 Wegner J, Popovsky MA. Clinical utility of thromboelastography: one sizedoes not fit all. Semin Thromb Hemost 2010; 36:699–706.
9 Hoffman M, Monroe DM 3rd. A cell-based model of hemostasis. ThrombHaemost 2001; 85:958–965.
10 Johansson PI, Svendsen MS, Salado J, Bochsen L, Kristensen AT.Investigation of the thrombin-generating capacity, evaluated bythrombogram, and clot formation evaluated by thrombelastography ofplatelets stored in the blood bank for up to 7 days. Vox Sang 2008;94:113–118.
11 Haemoscope. Thromboelastography (TEG) hemostasis analyzer usermanual. Niles, IL: Haemoscope; 2004.
12 Kashuk JL, Moore EE, Sawyer M, Le T, Johnson J, Biffl WL, et al. Postinjurycoagulopathy management: goal directed resuscitation via POCthrombelastography. Ann Surg 2010; 251:604–614.
13 Stahel PF, Moore EE, Schreier SL, Flierl MA, Kashuk JL. Transfusionstrategies in postinjury coagulopathy. Curr Opin Anaesthesiol 2009;22:289–298.
14 Theusinger OM, Spahn DR, Ganter MT. Transfusion in trauma: why andhow should we change our current practice? Curr Opin Anaesthesiol2009; 22:305–312.
15 Walsh M, Thomas SG, Howard JC, Evans E, Guyer K, Medvecz A, et al.Blood component therapy in trauma guided with the utilization of theperfusionist and thromboelastography. J Extra Corpor Technol 2011;43:162–167.
16 Nielsen VG, Cohen BM, Cohen E. Effects of coagulation factor deficiencyon plasma coagulation kinetics determined via thrombelastography: criticalroles of fibrinogen and factors II, VII, X and XII. Acta Anaesthesiol Scand2005; 49:222–231.
828 Blood Coagulation and Fibrinolysis 2013, Vol 24 No 8
Copyright © Lippincott Williams & Wilkins. Unauthorized reproduction of this article is prohibited.
17 Bochsen L, Johansson PI, Kristensen AT, Daugaard G, Ostrowski SR. Theinfluence of platelets, plasma and red blood cells on functional haemostaticassays. Blood Coagul Fibrinolysis 2011; 22:167–175.
18 Larsen OH, Ingerslev J, Sorensen B. Whole blood laboratory model ofthrombocytopenia for use in evaluation of hemostatic interventions. AnnHematol 2007; 86:217–221.
19 Darlington DN, Delgado AV, Kheirabadi BS, Fedyk CG, Scherer MR,Pusateri AE, et al. Effect of hemodilution on coagulation and recombinantfactor VIIa efficacy in human blood in vitro. J Trauma 2011; 71:1152–1163.
20 Sondeen JL, Prince MD, Kheirabadi BS, Wade CE, Polykratis IA, deGuzman R, et al. Initial resuscitation with plasma and other bloodcomponents reduced bleeding compared to hetastarch in anesthetizedswine with uncontrolled splenic hemorrhage. Transfusion 2011; 51:779–792.
21 Olsen AK, Marckmann P, Bladbjerg EM. The pig as a model in bloodcoagulation and fibrinolysis research. Scand J Lab Anim Sci 1999;26:214–224.
22 Bolliger D, Seeberger MD, Tanaka KA. Principles and practice ofthromboelastography in clinical coagulation management and transfusionpractice. Transfus Med Rev 2012; 26:1–13.
23 Blasi A, Beltran J, Pereira A, Martinez-Palli G, Torrents A, Balust J, et al.An assessment of thromboelastometry to monitor blood coagulation andguide transfusion support in liver transplantation. Transfusion 2012;52:1989–1998.
24 Rugeri L, Levrat A, David JS, Delecroix E, Floccard B, Gros A, et al.Diagnosis of early coagulation abnormalities in trauma patients by rotationthrombelastography. J Thromb Haemost 2007; 5:289–295.
25 Roeloffzen WW, Kluin-Nelemans HC, Bosman L, de Wolf JT.Effects of red blood cells on hemostasis. Transfusion 2010; 50:1536–1544.
26 Brown LM, Call MS, Margaret Knudson M, Cohen MJ, Holcomb JB, WadeCE, et al. A normal platelet count may not be enough: the impact ofadmission platelet count on mortality and transfusion in severely injuredtrauma patients. J Trauma 2011; 71 (2 Suppl 3):S337–S342.
Man vs. pig: platelet, fibrinogen, RBC on TEG Sondeen et al. 829


![CharacterizationoftheDeNovoBiosynthetic ...downloads.hindawi.com/journals/mi/2007/027683.pdf · 2 Mediators of Inflammation porcine spleen [11], as well as human neutrophils, human](https://img.pdfslide.us/doc/110x75/5ebcc167411abf034b14f909/characterizationofthedenovobiosynthetic-2-mediators-of-iniammation-porcine.jpg)


![Porcine Epidemic Diarrhea [Autosaved]](https://img.pdfslide.us/doc/110x75/577c808c1a28abe054a92a69/porcine-epidemic-diarrhea-autosaved.jpg)
