Embed Size (px)
Citation preview

Comparing Two Measures of Electoral Integrity in the American States0F
∗
Patrick Flavin Associate Professor
Department of Political Science Baylor University
One Bear Place #97276 Waco, TX 76798 (254) 710-7418
Gregory Shufeldt Assistant Professor
Department of Political Science Butler University
4600 Sunset Avenue 345 Jordan Hall
Indianapolis, IN 46208 (317) 940-9571
∗ Authors’ names are listed alphabetically to reflect equal contributions to the research. Earlier versions of
this paper were presented at the 2017 State Politics and Policy Conference in St. Louis, MO; and at the
2017 meeting of the American Political Science Association in San Francisco, CA. We thank Shaun
Bowler, Todd Donovan, Carl Klarner, Martha Kropf, and Daniel Smith for helpful comments.

Abstract
We compare two widely publicized measures of state electoral integrity in the United States: the
Electoral Integrity Project’s 2016 U.S. Perceptions of Electoral Integrity Survey and the Pew
2014 Elections Performance Index. First, we review the theoretical and empirical differences
between the two measures and find that they correlate at a surprisingly low level across the
states. Second, given this low correlation, we examine the component parts of these indices and
find that both are capturing multiple dimensions. Third, we examine how the components and the
individual indicators that comprise each measure are linked to citizens’ stated perceptions about
electoral integrity. Throughout the paper, we articulate a set of preemptive recommendations that
urge researchers to be cautious and deliberate when choosing among measures of electoral
integrity to use in future empirical studies.
Keywords: U.S. state politics, electoral integrity, election administration, public opinion

1
A Gallup public opinion poll conducted immediately before the November 2016 election
reported that only 35% of respondents were “very confident” that votes would be accurately cast
and counted in the election, while 21% were “not too confident” and fully 12% were “not
confident at all.” After his victory, Donald J. Trump repeatedly referenced that millions of votes
were fraudulently cast and that he, not Hillary Clinton, won the national popular vote. While
embroiled in an election-related scandal due to an uncertain level of Russian intervention,
President Trump called for a Presidential Commission on Election Integrity to investigate his
allegations of widespread voter fraud.
At its most basic level, votes being cast with confidence is a fundamental prerequisite for
the legitimacy of democracy (Norris 2014; Alvarez et al. 2008; Birch 2008; Hibbing and Theiss-
Morse 2001; Hill 1994). Whether one feels that their vote is accurately counted has important
consequences for overall support of democratic principles (Dalton 1999), democratic institutions
(Bowler et al. 2015; Bowler and Donovan 2002; Dalton 1999), and democratic processes (Price
and Romantan 2004; Rahn et al. 1999). It also has consequences for whether people vote and
participate through institutional means (Birch 2010; Alvarez et al. 2008; Highton 2004) or
through engaging in protest and other extra-institutional avenues (Norris et al. 2015).
The 2016 election is not the first to raise questions about the level of confidence
Americans have in our elections or whether the broader system is broken and in need of reform.
After the contested 2000 presidential election, Congress passed the Help America Vote Act
(HAVA) to establish federal standards and provide administrative support to states. Similarly,
after the 2012 election, President Obama called for a bipartisan Presidential Commission on
Election Administration. Despite these two pushes for a more active role for the federal
government, election administration still rests largely at the hands of the state where there exists

2
significant variation in legislation to make voting more accessible and to promote the integrity of
the election process (Alvarez and Grofman 2014; Stewart 2014). For example, recent court cases
have blocked partisan/racial gerrymandering redistricting efforts in Wisconsin, North Carolina,
and Pennsylvania. The U.S. Supreme Court recently refused to hear a case regarding North
Carolina’s photo identification law - which the Federal Appeals Court argued “target[ed]
African-Americans with almost surgical precision.”
Moreover, a report (based on one of the datasets we examine in this paper) that argued
the state of North Carolina can no longer rightly be considered a democracy after passing a
variety of legislation aimed at electoral administration gave rise to considerable public debate
(Reynolds 2016; Gelman 2017). This eye-catching argument attracted national media coverage
in outlets as diverse as GQ and The Huffington Post before being sharply criticized by Andrew
Gelman in an article for Slate. In addition, scholars associated with the Electoral Integrity Project
have widely promoted their work across a variety of outlets including The Washington Post, Vox,
and The Conversation. The increasing attention, both popular and scholarly, to questions of
electoral integrity makes comparing empirical measures of the concept across the American
states a worthwhile and necessary task.
In light of this increasing attention, we systematically compare two prominent and widely
publicized measures of state electoral integrity: the Electoral Integrity Project’s 2016 U.S.
Perceptions of Electoral Integrity Survey and the Pew 2014 Elections Performance Index. First,
we review the theoretical and empirical differences between the two measures and find that they
correlate at a surprisingly low level across the states. Second, given this low correlation, we
examine the component parts of these indices and find that both are capturing multi-dimensional
concepts. Third, we examine how the components and the individual indicators that comprise

3
each measure are linked to citizens’ stated perceptions about electoral integrity. Throughout the
paper, we articulate a set of preemptive recommendations (rather than punitive appraisals of
previous studies) that urge researchers to be cautious and deliberate when choosing among
measures of electoral integrity to use in future empirical studies.
Comparing the Two Measures
We focus our investigation on two measures.1F
1 First, we examine recently released data on
state elections for 2016 compiled by the Electoral Integrity Project and led by Pippa Norris,
Alessandro Nai, Holly Ann Garnett, and Max Grömping (hereafter “EIP”). While the EIP
measure touches on the specifics of election administration, it also takes a broader approach. For
example, Norris defines electoral integrity as the “agreed upon international conventions and
universal standards about elections reflecting global norms applying to all countries worldwide
throughout the electoral cycle, including during the pre-electoral period, the campaign, on
polling day, and its aftermath” (2014, 21). According to the EIP measure’s “Perceptions of
Electoral Integrity” codebook, state electoral integrity is measured by asking 726 political
experts to evaluate elections in their state using 49 items, grouped into 11 categories that reflect
the whole electoral cycle. The 11 categories include electoral laws, electoral procedures,
1 Since the 2000 election, several studies have sought to engage the specific aspects of election
administration. For example, see the edited volumes from Burden and Stewart (2014) and Alvarez and
Grofman (2014). Likewise, see Hale, Montjoy, and Brown (2015) for a useful descriptive overview and
Alvarez, Atkeson, and Hall (2013) for a sound overview of how data and oversight can improve how
elections function.

4
boundaries, voter registration, party registration, campaign media, campaign finance, voting
processes, vote counting, post-election procedures, and electoral authorities.2F
2
Second, we examine the 2014 Elections Performance Index from the Pew Charitable
Trust (hereafter “Pew”). Pew, in partnership with the Massachusetts Institute of Technology,
created an advisory panel of state election officials and academics to develop an objective
measure of the quality of state election administration. To construct this objective measure, the
advisory panel selected 17 categories to measure electoral performance. The categories include
data completeness, disability or illness-related voting problems, the percentage of mail ballots
rejected, the percentage of mail ballots unreturned, the percentage of military and overseas
ballots rejected, the percentage of military and overseas ballots unreturned, whether online
registration is available, whether a postelection audit is required, the percentage of provisional
ballots cast, the percentage of provisional ballots rejected, registration or absentee ballot
problems, the percentage of registrations rejected, the residual vote rate, voter registration rate,
the availability of voting information online lookup tools, voting wait time, and voter turnout. In
identifying the appropriate standards, the advisory panel of academics and election officials
prioritized that data ought to come from a reliable source, be available and consistent over time,
be available and consistent for all states, reflect salient outcomes or measures of good elections,
be easily understood by the public with a relatively unambiguous interpretation, and should be
able to be replicated in the near future (Pew 2016).3F
3
2 Detailed information on the individual items that make up these 11 categories is available online at:
https://www.electoralintegrityproject.com/pei-core-survey-items.
3 Detailed information on the individual items that make up these 17 categories is available at
http://www.pewtrusts.org/~/media/assets/2016/08/epi_methodology.pdf. We use state scores from the

5
Both measures include an overall composite score that allows for initial comparisons.
The EIP measure (that imputes values for states when and where necessary) scores the states in
terms of the overall integrity of elections on 0-100 scale, ranging from a low of 53.0 in Arizona
to a high of 75.2 in Vermont. The Pew measure also aggregates state election administration
performance by averaging across all 17 categories on a 0-100 scale, ranging from a low of 49 in
Alabama to a high of 84 in North Dakota. Figure 1 displays a scatterplot of the two measures and
suggests that there is little linear relationship between them.
[Figure 1 about here]
A close inspection of the calculated difference in rank ordering for the two measures in
the rightmost column of Table 1 reveals substantial disagreement in state evaluations. In rare
occasions, states fare similarly across the EIP and Pew measures. For example, Colorado
performs well according to both while Oklahoma performs poorly. Far more often, however, the
two measures come to markedly different conclusions. For example, Idaho is the second highest
ranked state according to the EIP measure but the 48th highest according to the Pew measure.
This works in the other direction as well. Wisconsin is the 50th highest ranked state (or next to
2014 election because they are the most recent data available from Pew. The residual vote rate category is
only calculated during presidential election years, so (since we use data for 2014) we exclude this variable
from our analyses below. Additionally, the availability of voting information online lookup tools category
is comprised of five separate indicators: (1) registration status, (2) location of polling place, (3) voter-
specific ballot information, and tracking the status of (4) absentee ballots and (5) provisional ballots. All
states in 2014 allowed for online lookup of the location of one’s polling place, so it is excluded from our
analyses below. Including the remaining four online lookup tools as separate indicators gives us a total of
19 indicators for our analyses below.

6
lowest) according to the EIP measure but the 4th highest according to Pew. Indeed, the average
overall difference in state ranking between the two measures is fully 16 states and the median
difference is 12 states. Perhaps it is not surprising, then, that across the states the two measures
correlate only modestly at .13. Given this low correlation, our first recommendation is that
scholars should not utilize these two measures interchangeably or use them to serve as a
robustness check for one another in future statistical analysis.
[Table 1 about here]
Unpacking the Two Measures
Why are these two prominent measures of state electoral integrity only modestly
correlated? The first notable difference between the two measures is their conceptual scope. The
Pew measure is restrained to specific mechanics of election performance or administration and
the 17 categories are largely targeted to the registration process and the ballot. In contrast, the
EIP measure relies on 11 categories that cover a much broader terrain including the drawing of
legislative district lines, media coverage, and campaign finance laws.
The second notable difference is in the details of how the two measures are calculated.
The Pew measure is based on objective indicators that are selected for inclusion by a panel of
experts. The EIP measure, by contrast, is based on expert evaluations of various political and
electoral conditions in each state (see Norris 2014, Chapter 3). Although valid criticisms have
been raised regarding how the EIP scores of U.S. states compare with notoriously undemocratic
countries around the world (see Gelman 2017), those concerns are not directly relevant here
since our goal is only to evaluate how these measures fare when comparing U.S. states to one

7
another in a relative sense.4F
4 In other words, in this paper we offer no appraisal of the validity of
making cross-national comparisons with the EIP measure and instead confine our evaluation to
the utility of comparisons across the states within the United States.
Since the composite scores are only modestly related to one another, it is prudent to take
a closer look at the underlying indicators that comprise each index. The internal reliability of the
different indicators, 19 in the case of the Pew measure (see Footnote #3) and 11 in the case of the
EIP measure, should give scholars pause before utilizing the composite score. Specifically, the
EIP measure has a Cronbach’s alpha of .89,5F
5 while the alpha for the Pew measure is only .30.
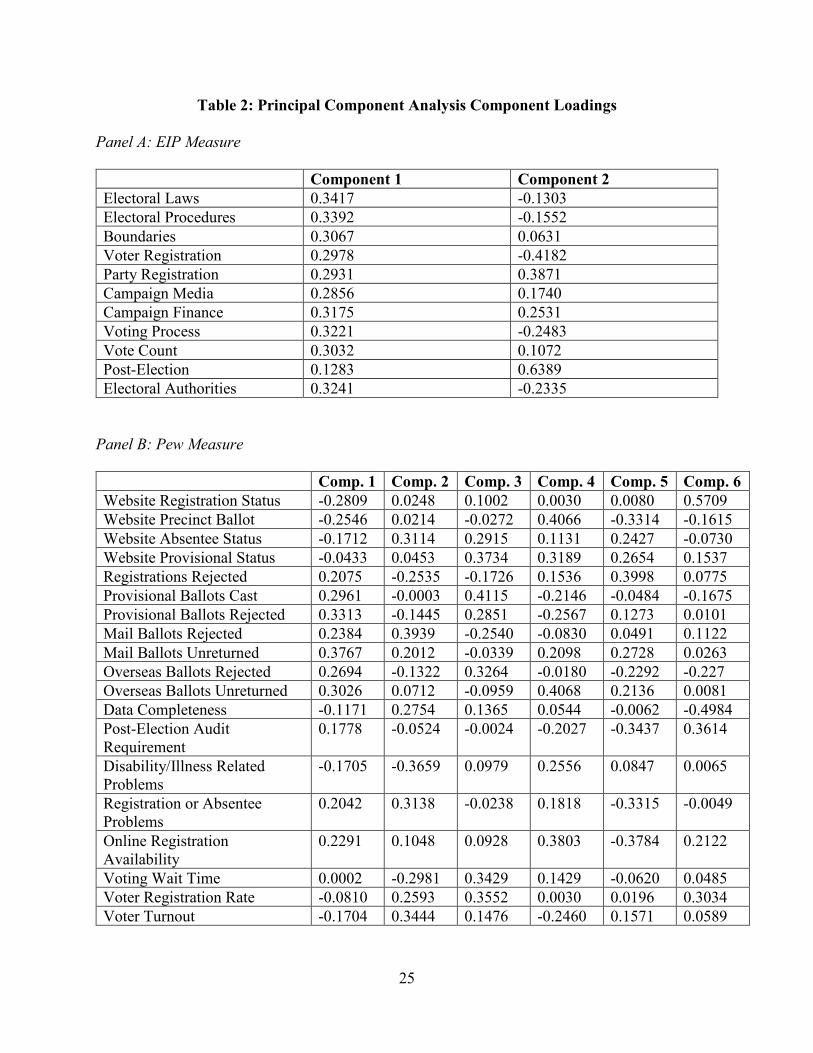
A principal component analysis of the EIP measure retains two components with
eigenvalues greater than one that explain 65% of the variance (see Table 2, Panel A). Party
registration and post-election procedures load more strongly on the second component while the
remainder of the indicators load on the first. The fact that these two indicators are theoretically
4 However, one important concern with the EIP that requires further exploration is the number of experts
who responded in each state. For instance, fully 28 of the states had fewer than 10 experts respond to the
survey. The average number of responses per state was 14.23 and the median was eight. It is important to
note that the low correlation between the two measures persists regardless of the number of experts a state
has for the EIP measure. For example, across the 23 states with 10 or more expert responses, the Pew and
EIP measure correlate at .12.
5 One likely reason that the EIP measure has a high degree of internal consistency is that the individual
state experts who filled out the survey on political and election conditions aimed to be consistent across
their answers. Likewise, high profile recent events, like court challenges to gerrymandered district
boundaries or implementation of photo identification requirements, could uniformly lead experts in a state
to anchor responses in a particularly positive or negative direction.

8
connected is sensible, as both are targeted toward whether the opposition was denied the
opportunity to run for office or disputed/challenged the election results.
A principal component analysis of the Pew measure retains fully six components with
eigenvalues greater than one. Together, they explain 73% of the variance. When examining
Panel B of Table 2, it is less clear that theoretical connections can be made across the
components. However, some make intuitive sense. For example, the fifth component clearly
speaks to voter registration issues – the number of registrations rejected loads most strongly on
this component while registration problems and the availability of online registration load most
negatively on this component. On the other hand, some have less clear overlap. For example,
both the number of provisional ballots rejected and the number of mail ballots unreturned load
most strongly on the first component.
To echo our first recommendation above, these measures should not be treated as
complementary rivals. Instead, given the low correlation between the two measures, we feel
confident suggesting they are capturing distinct concepts or, perhaps, different dimensions of the
same concept. Moreover, both the EIP and Pew measures have distinct components within each
measure. Taken together, these two measures are conceptually and empirically different – which
raises the question of which one (if either) is more fully capturing electoral integrity. Our
purpose here is not to adjudicate between the two measures but to provide scholars tangible
recommendations on how to use each. The increased media attention for the EIP makes this a
more timely and fruitful line of inquiry. While some studies (i.e. Bowler et al. 2015) have used
the composite Pew measure, we urge caution before proceeding. Indeed, we think there are
strong reasons to believe both indices are tapping into multiple conceptual dimensions and,

9
therefore, our second recommendation is that scholars should proceed with caution and avoid
use of the overall composite measures in future empirical studies.
[Table 2 about here]
Citizens’ Perceptions of Electoral Integrity
Given (1) the weak statistical relationship between two indices that aim to measure the
same underlying concept of electoral integrity, (2) the mixed reliability of the composite scales,
and (3) the multi-dimensionality of each measure, we believe one straightforward way to
compare their validity is to investigate how aspects of each measure relate to citizens’ stated
perceptions of electoral integrity. Accordingly, our goal in this section is to further our
understanding about electoral integrity and its link to citizens’ attitudes by empirically evaluating
the relationship between the EIP and Pew measures and citizens’ perceptions of electoral
integrity. By doing so, we hope to provide preemptive guidance to scholars who plan to use one
of the measures in future studies of state electoral integrity.
Recent research has examined the link between election-related policy reforms and voter
confidence (Bowler and Donovan 2016; Bowler et al. 2015; Berinsky 2005; Ansolabehere and
Persily 2008; Ansolabehere 2009). The most prominent and recent example of a state policy
reform that engages the perceived integrity of the election is photo identification laws. In
general, research has found that the public is more likely to believe that these types of reforms
prevent voter fraud rather than restrict participation (Atkeson et al. 2014).6F
6 However,
6 These types of laws are not implemented at random. Since the passage of the Help America Vote Act,
states have chosen divergent paths to make voting more accessible – for example, some state work to
make voter registration automatic --- while others have passed legislation to protect the integrity of

10
partisanship plays an integral role in explaining support for photo identification (Stewart et al.
2016; Hicks et al. 2015; Gronke et al. 2015) – Republicans are more homogeneously in favor
while Democrats experience more disagreement within their camp.
But do laws, like photo identification, have an effect on citizens’ perceptions of electoral
integrity in their state? Previous studies have examined the relationship between voting
technology and voter attitudes (Atkeson and Saunders 2007; Bullock et al. 2005) and between
poll workers (as “street-level bureaucrats”) and voter attitudes (Atkeson and Saunders 2007; Hall
et al. 2009, 2007; Claasen et al. 2008) and found that they have at least a small effect on citizens’
perceptions of electoral integrity. Most closely related to the focus of our current study, Bowler
and Donovan (2016) find little evidence of a general relationship between voter photo
identification laws and confidence in state elections. However, they do find a relationship
conditioned by partisanship: Republicans living in states with strict identification laws report
more confidence while Democrats report less confidence. Furthermore, in related research,
Bowler et al. (2015) examine the relationship between election administration more broadly
(using the 2012 version of the Pew measure) and citizens’ perceptions of election fairness and
find that citizens are more likely to report that the electoral process and elected officials are
“fair” in the World Values Survey in states with higher electoral integrity scores. However, from
a substantive standpoint, they note that the effect of state electoral integrity on perceptions of
fairness is rather modest relative to partisanship and demographic explanations.
elections – for example, by passing more restrictive photo identification laws (Biggers and Hanmer 2017;
2015; Hicks et al. 2015; Alvarez and Grofman 2014; Stewart 2014; Hanmer 2009).

11
To investigate the possible relationship between the two measures of state electoral
integrity and citizens’ perceptions, we use data from the 2016 wave of the American National
Election Studies (ANES) to measure citizens’ perceptions about the integrity of elections. In
particular, we focus on respondents’ answer to the following question from the post-election
survey: “In your view, how often do the following things occur in this country's elections? Votes
are counted fairly.” The response categories are: “all of the time, most of the time, about half of
the time, some of the time, or never.” The dependent variable is scaled 1-5, recoded such that
higher values indicate greater confidence in electoral integrity (i.e. more likely to think votes are
counted fairly).
We select this dependent variable in particular because we believe it is the ANES item
that most directly queries respondents about their perceptions of the integrity and fairness of
elections.7F
7 The overall health of a democracy rests on the consent of the governed and the ability
7 Importantly, we also ran the same series of models discussed below but with a different dependent
variable to examine the relationship between the EIP and Pew measures of electoral integrity and citizens’
political attitudes more broadly (the full regression results are reported in the Online Appendix). These
four additional dependent variables include (1) whether respondents think politicians are trustworthy, (2)
whether they trust the federal government to do what is right, (3) whether they believe public officials
care what people like them think, and (4) whether they think people like them have a say in what
government does. Surveying all of these additional regression estimations in their totality, we find little
evidence that the components or the individual indicators that make up each measure are linked to these
additional measures of citizens’ political attitudes. The fact that neither of the two measures of electoral
integrity are linked to more general attitudes about democracy suggests that our narrower focus on
citizens’ perceptions of votes being counted fairly is an appropriate empirical strategy.
12
to cast a meaningful vote, and trust that it is counted fairly is paramount to this consent.
Moreover, confidence that votes are counted fairly is associated with other positive outcomes
like higher rates of participation (Alvarez, Hall, and Llewellyn 2008) and is conceptually
different from other diffuse measures of system support (Atkeson, Alvarez, and Hall 2015).
Our estimation strategy is to model citizens’ survey responses as a function of electoral
integrity in their state. To do this we run a series of separate regression models. We examine the
relationship between the components of the EIP and Pew measures and whether respondents
believe their votes were counted fairly. In all models, we include a series of individual and state
level control variables to account for possible confounding factors that either our theoretical
expectations suggest or previous studies have documented are important in predicting citizens’
attitudes about electoral integrity. At the individual level, we include covariates for the intensity
of a respondent’s political partisanship,8F
8 their self-reported attention to government and politics,
their level of education, income, gender, age, as well as dummy variables for whether a
respondent is African American or Hispanic (Atkeson and Saunders 2007; Bowler et al. 2015;
8 Intensity of partisanship is constructed by folding the ANES seven point partisanship scale with strong
Democrats/Republicans coded as a four, weak Democrats/Republicans coded as a three, leaning
Democrats/Republicans coded as a two, and independent respondents coded as a one. We also ran models
with the standard seven-point strong Democrat to strong Republican partisanship variable (instead of the
folded strength of partisanship scale) and its coefficient was not statistically different from zero in any of
the regression estimations (i.e. Republicans are no more or less likely than Democrats to think votes are
counted fairly). Similarly, when including (separately) a dummy variable for Democrat and for
Republican, we do not find any partisan differences in respondents’ beliefs about votes being counted
fairly.

13
Bowler and Donovan 2016). We include measures of intensity of partisanship and attentiveness
to politics with the expectation that more politically involved and interested citizens will be more
likely to expect fair elections (compared to non-partisans and those who pay little attention to
politics). Similarly, we expect people who are wealthier and more educated (and, by extension,
have more political resources) to report a greater belief in electoral fairness. Following Bowler et
al. (2015, 5), we include gender because “Although women are not a demographic minority, they
do constitute a minority in terms of their descriptive representation. The enduring
underrepresentation of women in American politics may cause women to view elections as
unfair on multiple dimensions.” We include age with expectation that citizens will be more
trusting of the electoral process (and government in general) as they grow older. Because of
historical disenfranchisement and generally lower levels of political efficacy and trust in
government, we expect both African American and Hispanic respondents to be less likely to
think votes are counted fairly.
At the state level, we include covariates for the percentage of a state’s residents who are
non-white, the percentage of a state’s residents who were born outside the United States, and the
closeness of the 2016 presidential election in a respondent’s state.9F
9 The first two variables are
included based on the expectation that a state’s citizens (especially its white citizens) might
9 Data on state racial composition are five year averages from the American Community Survey
administered by the U.S. Census. Data on the percentage of state residents who are foreign born is from
the Migration Policy Institute. Data on 2016 presidential election vote totals by state are from Daily Kos
Elections. The presidential election closeness variable is computed by taking the absolute value of the
difference in the vote share of Donald J. Trump and Hillary Clinton in a state and then multiplying by
negative one so larger values indicate a closer presidential contest in that state.

14
perceive a greater likelihood of voter fraud if there is a larger proportion of racial minority or
immigrant residents. We include the closeness of the 2016 election variable with the expectation
that citizens may think voter fraud is more likely when the presidential race in their state is close
and campaigns and supporters have more to gain by possibly tipping the outcome.
We use OLS regression for all models and report standard errors that are clustered by
respondents’ state of residence to account for the fact that respondents nested within the same
state are not statistically independent from one another (Primo, Jacobsmeier, and Milyo 2007;
Arceneaux and Nickerson 2009). Importantly, however, we find substantively identical results to
those presented below if we instead use an ordered probit estimator or if we use a multi-level
(individuals nested within states) linear model that includes random intercepts for each state.
Table 3 displays the results from our first series of regression estimations, with each row
reporting a separate model. The table only reports the coefficient and corresponding standard
error for the principal components (identified in Table 2) of each electoral integrity measure in
the model, and omits the coefficients for the battery of control variables that we include and are
discussed above.
[Table 3 about here]
Of the two components from the EIP measure, only the first component has any
meaningful relationship with citizens’ perceptions. As a reminder, nine of the eleven indicators
loaded more strongly on this component – including electoral laws, electoral procedures,
boundaries, voter registration, campaign media, campaign finance, voting process, vote count,
and electoral authorities.
Moving to the Pew components, only the sixth component is positively associated with
whether citizens believe votes are counted fairly. Two of the 19 individual indicators load most
15
strongly on this sixth component – whether registration status can be looked up online and
whether the state has a post-election audit requirement.
Next, we turn our attention to a series of regressions using the individual indicators that
make up each composite measure as separate independent variables using the same model
specifications as described above. We uncover results that partially conform to theoretical
expectations set forth in the literature. Specifically, we find that the coefficients for three of the
EIP indicators are positive and statistically different from zero, including expert evaluations of
(1) the voter registration process, (2) the voting process itself, and (3) state electoral authorities.
[Table 4 about here]
The regression results for the individual indicators from the Pew composite measure are
less encouraging. Specifically, we find that only one individual indicator – requiring a
postelection audit – is linked to citizens’ evaluations of electoral integrity at conventional levels
of statistical significance. This finding echoes previous research (Alvarez, Atkeson, and Hall
2012). By contrast, for the remaining 18 indicators – many of which assess aspects of election
administration that impact the electoral process – we find no meaningful relationship.
In sum, across the component parts and the individual indicators of both the EIP and Pew
measures, our findings are theoretically intuitive and largely consistent with previous studies on
citizens’ perceptions of electoral fairness. Of the overall component parts or the individual
indicators used to create each composite measure, only ones that are theoretically likely to
impact voters’ experience at the polls relate to citizens’ perceptions of electoral fairness, which is
consistent with findings in previous studies (Atkeson and Saunders 2007; Bullock et al. 2005;
Hall et al. 2007, 2009; Claasen et al. 2008). More plainly, aspects of electoral integrity or
election administration that, behind the scenes, impact the overall quality of elections have little

16
direct impact on citizen perceptions. Only those components or indicators that the individual
voter visibly experiences firsthand impacts whether they believe their votes are counted fairly.
Given these findings, our third recommendation is that scholars should let their theoretical
expectations about the relationship between electoral integrity and a given dependent variable
guide their selection of relevant indicators (rather than using a flawed composite measure).
Summary of Practical Recommendations
In this paper, we first reviewed the theoretical and empirical differences between two
prominent measures of electoral integrity: the Electoral Integrity Project’s 2016 U.S. Perceptions
of Electoral Integrity Survey and the Pew 2014 Elections Performance Index. The two measures
correlate at a notably low .13, which is particularly modest if the two are thought to be
measuring the same underlying concept of state electoral integrity.
Next, due to the fact that each composite measure is an aggregation of individual
indicators, we engaged in additional analysis of the composition of each. The EIP measure has a
Cronbach’s alpha of .89 while the Pew measure’s alpha is a much noticeably lower .30. By
examining the principal components of each index, we also demonstrated that each measure is
capturing multiple dimensions. The EIP measure retains two distinct components while the Pew
measure captures fully six different components.
Given the weak relationship between the two composite measures as well as the multi-
dimensional nature of each measure, we then evaluated the relationship between the components
and individual indicators that make up each measure of state electoral integrity and citizens’
perceptions that votes are counted fairly and observed that some factors play a more pronounced
role than others. In particular, the component parts and individual indicators that are theoretically

17
intuitive and reflect causal mechanisms from previous studies generally have a clearer
relationship with citizens’ perceptions of whether votes are counted fairly.
From this series of analyses, it is our judgment that scholars should adhere to the
following recommendations when using measures of state electoral integrity in future studies:
1. Scholars should not utilize these two measures interchangeably or use them to serve as a
robustness check for one another in a statistical analysis.
2. Scholars should proceed with caution and generally avoid use of the overall composite
measures in future studies.
3. Scholars should let their theoretical expectations about the relationship between electoral
integrity and a given dependent variable guide the selection of relevant individual
indicators to include in their analysis.
Perhaps most importantly, this paper underscores the potential utility of generating new ways to
measure and quantify the concept of electoral integrity at the state level. We do see value in
creating a composite measure that scholars and practitioners could use to assess the overall
electoral integrity across states and municipalities (Gerken 2009). Moreover, we see value in
adapting lessons from the Variety of Democracies (V-Dem) project to identify composite
measures, components parts, and individual indicators (Coppedge et al. 2017).
To do so, scholars should first look to the EIP and Pew measures to generate ideas about
appropriate indicators of electoral integrity. While we have identified areas for improvement and
urged caution against theoretically and empirically inappropriate usage, each measure does have
virtues that are worthy of emulation. For example, a notable feature of the Pew measure is its
reliance on objective, quantifiable criteria that allows for relatively easy comparisons across
states and across time. Likewise, one virtue of the EIP measure is that it takes a broader approach

18
rather than just focusing on the internal mechanisms of election administration. Using these as a
starting point, identifying additional relevant characteristics and indicators that are part of
electoral integrity is worth pursuing. For instance, researchers may seek to incorporate
documented incidents of voter impersonation at the polls as well as documented incidents of
voter intimidation into future measures. Additionally, researchers may want to quantify the
administrative procedures in place in each state to ensure an accurate and timely counting of
ballots. These are but two examples of the various types of relevant indicators that are not
currently incorporated into either measure. Because of the fundamental importance of free and
fair elections for the health of American democracy, our final recommendation is that scholars
should continue to improve and refine the measurement of electoral integrity in the states for
future empirical studies.

19
References
Alvarez, R. M., and B. Grofman. 2014. Election Administration in the United States: The State of Reform after Bush v. Gore. New York: Cambridge University Press.
Alvarez, R. M., T. E. Hall, and M. H. Llewellyn. 2008. “Are Americans Confident Their Ballots
Are Counted?” Journal of Politics, 70(3): 754–66. Alvarez, R.M., L.R. Atkeson, and T.E. Hall. 2012. Confirming Elections: Creating Confidence
and Integrity through Election Auditing. New York: Palgrave Macmillian. Alvarez, R.M., L.R. Atkeson, and T.E. Hall. 2013. Evaluating Elections: A Handbook of
Methods and Standards. New York: Cambridge University Press. Ansolabehere, S. 2009. “Effects of Identification Requirements on Voting: Evidence from the
Experiences of Voters on Election Day.” Political Science & Politics, 42(1): 127–30. Ansolabehere, S. and N. Persily. 2008. “Vote Fraud is in the Eye of the Beholder: The Role of
Public Opinion in the Challenge to Voter Identification Requirements.” Harvard Law Review, 121(7): 1737–74.
Arceneaux, K. and D.W. Nickerson. 2009. “Modeling Certainty with Clustered Data: A Comparison of Methods. Political Analysis, 17(2): 177-190. Atkeson, L.R., Alvarez, R.M. and Hall, T.E. 2015. “Voter Confidence: How to Measure It and
How It Differences from Government Support.” Election Law Journal, 14(3): 207-219. Atkeson, L.R., Alvarez, R.M., Hall, T.E., Sinclair, J.A., 2014. “Balancing Fraud Prevention and
Electoral Participation: Attitudes Toward Voter Identification.” Social Science Quarterly, 95(5), 1381-1398.
Atkeson, L, and K. Saunders. 2007. “Election Administration and Voter Confidence: A Local
Matter?” Political Science & Politics, 40(4): 655–60. Berinsky, A. 2005. “The perverse consequences of electoral reform in the United States.”
American Politics Research, 33:471-491. Biggers, D. and M. Hanmer. 2017. “Understanding the Adoption of Voter Identification Laws in
the American States.” American Politics Research, Online first at https://doi.org/10.1177/1532673X16687266
Biggers, D. and M. Hanmer. 2015. “Who Makes Voting Convenient? Explaining the Adoption of
Early and No-Excuse Absentee Voting in the American States.” State Politics & Policy Quarterly, 15(2): 192-210.

20
Birch, S., 2010. “Perceptions of Electoral Fairness and Voter Turnout.” Comparative Political Studies, 42(12), 1601-1622.
Birch, S. 2008. “Electoral Institutions and Popular Confidence in Electoral Processes: A Cross-
National Analysis.” Electoral Studies, 27(2): 305–20. Bowler, S., T. Brunell, T. Donovan, and P. Gronke. 2015. “Election Administration and
Perceptions of Fair Elections.” Electoral Studies, 38:1-9. Bowler, S. and T. Donovan. 2016. “A Partisan Model of Electoral Reform: Voter Identification
Laws and Confidence in State Elections.” State Politics & Policy Quarterly, 16(3): 340- 361.
Bowler, S. and T. Donovan. 2002. “Democracy, Institutions, and Attitudes about Citizen Influence on Government.” British Journal of Political Science, 32(2): 371-390. Bullock, C., M. V. Hood, and R. Clark. 2005. “Punch Cards, Jim Crow and Al
Gore: Explaining Voter Trust in the Electoral System in Georgia, 2000.” State Politics & Policy Quarterly, 5(3): 283–94.
Burden, B. and C. Stewart. 2014. The Measure of American Elections. New York: Cambridge
University Press. Claassen, R., D. B. Magleby, J. Q. Monson, and K. D. Patterson. 2008. “Voter Evaluations of
Poll Worker Performance.” American Politics Research, 36(4): 612–34. Coppedge, Michael, John Gerring, Staffan I. Lindberg, Svend-Erik Skaaning, Jan Teorell, Joshua
Krusell, Kyle L. Marquardt, Valeriya Mechkova, Daniel Pemstein, Josefine Pernes, Laura Saxer, Natalia Stepanova, Eitan Tzelgov, Yi-ting Wang, and Steven Wilson. 2017. “V-Dem Methodology v7.1.” Varieties of Democracy (V-Dem) Project.
Dalton, R. 1999. “Political Support in Advanced Industrial Democracies.” In Norris, P (ed.)
Critical Citizens: Global Support for Democratic Government. Oxford: Oxford University Press, 57 – 77.
Darby, L. 2017. “The Professor Who Said That North Carolina Isn’t a Democracy Won’t Back
Down.” GQ, Accessed on 30 May 2018 from https://www.gq.com/story/north-carolina-andrew-reynolds-political-science-interview.
Gelman, A. 2017. “The Bad Research Behind the Bogus Claim That North Carolina is no longer
a democracy.” Slate, Accessed on 19 May 2017 from http://www.slate.com/articles/news_and_politics/politics/2017/01/the_bogus_claim_that_north_carolina_is_no_longer_a_democracy.html
Gerken, H. 2009. The Democracy Index: Why Our Election System is Failing and How to Fix It.
Princeton: Princeton University Press.

21
Gronke, P., W. D. Hicks, S. C. McKee, C. Stewart., and J. Dunham. 2015. “Voter ID Laws: A
View from the Public.” MIT Political Science Department Research Paper No 2015–13. http://papers.ssrn.com/sol3/papers.cfm?abstract_id=2594290
Hale, K., R. Montjoy, and M. Brown. 2015. Administering Elections: How American Elections
Work. New York: Palgrave Macmillan Hall, T., J. Q. Monson, and K. Patterson. 2007. “Poll Workers and the Vitality of Democracy:
An Early Assessment.” Political Science & Politics, 40(4): 647–54. Hall, T., J. Q. Monson, and K. Patterson. 2009. “The Human Dimension of Elections: How Poll
Workers Shape Public Confidence in Elections.” Political Research Quarterly, 62(2): 507–22.
Hamze, A. 2016. “North Carolina’s Democracy Ranked On Par With Cuba.” The Huffington
Post, Accessed on 30 May 2018 from: https://www.huffingtonpost.com/entry/north-carolina-no-longer-democracy_us_585db3e7e4b0de3a08f5699f
Hanmer, M. 2009. Discount Voting: Voter Registration Reforms and Their Effects. New York:
Cambridge University Press. Hibbing, J., and E. Theiss-Morse. 2001. “Process Preferences and American
Politics: What the People Want Government to Be.” American Political Science Review, 95(1): 145–53.
Hicks, W. D., S. C. McKee, M.D. Sellers, and D. A. Smith. 2015. “A Principle or a Strategy?
Voter Identification Laws and Partisan Competition in the American States.” Political Research Quarterly, 68(1):18–33.
Highton, B. 2004. “Voter Registration and Turnout in the United States.” Perspectives on
Politics, 2(3): 507-515. Hill, K.Q. 1994. Democracy in the Fifty States. Lincoln: University of Nebraska Press. Norris, Pippa; Nai, Alessandro; Grömping, Max, 2016, "Perceptions of Electoral Integrity - US
2016 (PEI_US_1.0)", doi:10.7910/DVN/YXUV3W, Harvard Dataverse, V1, UNF:6:1cMrtJfvUs9uBoNewfUKqA==
Norris, P., Frank, R.W., Coma, F.M.i., 2015. Contentious Elections: From Ballots to Barricades.
Routledge, New York, NY. Norris, Pippa. 2014. Why Electoral Integrity Matters. New York: Cambridge University Press.

22
Norris, P. 2016. “American elections ranked worst among Western democracies. Here’s why.” The Conversation, Accessed on 30 May 2018 from https://theconversation.com/american-elections-ranked-worst-among-western-democracies-heres-why-56485.
Norris, P., H. Garnett, and M. Grömping. 2016. “Why don’t more Americans vote? Maybe
because they don’t trust U.S. elections.” The Washington Post, Accessed on 30 May 2018 from https://www.washingtonpost.com/news/monkey-cage/wp/2016/12/26/why-dont-more-americans-vote-maybe-because-they-dont-trust-u-s-elections/?noredirect=on&utm_term=.730616e77a65.
Norris, P., H. Garnett, and M. Grömping. 2016. “Electoral integrity in all 50 US states, ranked by
experts.” Vox, Accessed 30 May 2018 from https://www.vox.com/the-big-idea/2016/12/24/14074762/electoral-integrity-states-gerrymandering-voter-id
The Pew Charitable Trusts. 2016. “Elections Performance Index: Methodology.” Accessed 7
July 2016 from http://www.pewtrusts.org/~/media/assets/2016/08/epi_methodology.pdf. Price, V., and A. Romantan. 2004. "Confidence in Situations Before, During and After
Indecision 2000.” Journal of Politics, 66(3): 939-56. Primo, D.M., M.L. Jacobsmeier, and J. Milyo. 2007. “Estimating the Impact of State Policies and Institutions with Mixed-Level Data.” State Politics & Policy Quarterly, 7(4):446-459. Rahn, W. M, J. Brehm, and N. Carlson. 1999. "National Elections as Institutions for Generating
Social Capital." In Civic Engagement in American Democracies, eds. T. Skocpol and M. P. Fiorina. Washington, D.C.: Brookings Institution Press.
Reynolds, A. 2016. “North Carolina is no longer classified as a democracy.” The News &
Observer, Accessed on 19 May 2017 from http://www.newsobserver.com/opinion/op-ed/article122593759.html
Stewart, C. 2014. “What Hath HAVA Wrought? Consequences, Intended and Not, of the Post-
Bush v. Gore Reforms.” In Election Administration in the United States: The State of Reform after Bush v. Gore, eds. R. Michael Alvarez and Bernard Grofman. New York, NY: Cambridge University Press, 79–101.
Stewart, C., S. Ansolabehere, and N. Persily. 2016. “Revisiting Public Opinion on Voter
Identification and Voter Fraud in an Era of Increasing Partisan Polarization.” Stanford Law Review, 68:1455-1489.

23
AL
CA
OK
ID
MS
AR
HI
KY
TXNY
WYDC
NJKS
NM
TNAZ
UT
RI
LA
IN
AK
NH
FLGA
WV
NC
MA
PA
SD
WAIA
OH
NEIL
SC
VT
NV
MT
ME
MI
ORMD
MO
DE
CO
CT
VA
WI
MN
ND
5060
7080
90E
IP In
dex
(201
6)
50 60 70 80 90Pew Index (2014)
Figure 1: Correlation between Pew and EIP Measures

24
Table 1: Comparing the Two State Electoral Integrity Measures
STATE PEW SCORE
ELECTORAL INTEGRITY
PROJECT SCORE
PEW RANK EIP RANK DIFFERENCE
IN RANK
Wisconsin 82 54 4 50 46 Idaho 57 73 48 2 46
Hawaii 59 72 47 8 39 New Mexico 63 73 38 5 33
Virginia 82 60 3 36 33 Michigan 76 57 11 41 30
South Carolina 74 56 14 46 30 North Dakota 84 63 1 30 29
California 54 65 50 23 27 New Hampshire 66 73 30 3 27
Louisiana 65 71 33 9 24 Wyoming 61 67 42 18 24
Ohio 71 57 19 42 23 Pennsylvania 70 56 23 45 22
Washington, DC 61 67 40 19 21 Nevada 74 62 15 34 19
Arkansas 59 63 46 28 18 Iowa 71 73 22 4 18
Missouri 78 64 8 26 18 Arizona 64 53 35 51 16 Georgia 67 57 27 43 16
North Carolina 69 58 24 39 15 Tennessee 64 55 34 49 15 Vermont 74 75 16 1 15
Washington 71 72 20 7 13 Kentucky 60 62 43 31 12
New Jersey 62 63 39 27 12 Rhode Island 65 57 32 44 12
Utah 64 65 36 24 12 Alabama 49 58 51 40 11
Minnesota 83 69 2 13 11 South Dakota 71 62 21 32 11 Connecticut 81 68 5 15 10
Florida 67 58 28 38 10 Alaska 66 66 29 21 8
Massachusetts 69 67 25 17 8 Delaware 80 68 7 14 7
Illinois 73 64 18 25 7 Maine 75 72 13 6 7 Texas 60 59 44 37 7
New York 61 61 41 35 6 West Virginia 68 66 26 20 6
Nebraska 73 66 17 22 5 Colorado 80 71 6 10 4 Kansas 63 62 37 33 4
Montana 75 67 12 16 4 Maryland 77 70 9 11 2
Oregon 77 69 10 12 2 Indiana 66 63 31 29 2
Mississippi 59 56 45 47 2 Oklahoma 57 55 49 48 1
Note: See text for description of each measure of state electoral integrity. States are ordered by difference in rank (from largest difference to smallest).
25
Table 2: Principal Component Analysis Component Loadings Panel A: EIP Measure Component 1 Component 2 Electoral Laws 0.3417 -0.1303 Electoral Procedures 0.3392 -0.1552 Boundaries 0.3067 0.0631 Voter Registration 0.2978 -0.4182 Party Registration 0.2931 0.3871 Campaign Media 0.2856 0.1740 Campaign Finance 0.3175 0.2531 Voting Process 0.3221 -0.2483 Vote Count 0.3032 0.1072 Post-Election 0.1283 0.6389 Electoral Authorities 0.3241 -0.2335
Panel B: Pew Measure Comp. 1 Comp. 2 Comp. 3 Comp. 4 Comp. 5 Comp. 6 Website Registration Status -0.2809 0.0248 0.1002 0.0030 0.0080 0.5709 Website Precinct Ballot -0.2546 0.0214 -0.0272 0.4066 -0.3314 -0.1615 Website Absentee Status -0.1712 0.3114 0.2915 0.1131 0.2427 -0.0730 Website Provisional Status -0.0433 0.0453 0.3734 0.3189 0.2654 0.1537 Registrations Rejected 0.2075 -0.2535 -0.1726 0.1536 0.3998 0.0775 Provisional Ballots Cast 0.2961 -0.0003 0.4115 -0.2146 -0.0484 -0.1675 Provisional Ballots Rejected 0.3313 -0.1445 0.2851 -0.2567 0.1273 0.0101 Mail Ballots Rejected 0.2384 0.3939 -0.2540 -0.0830 0.0491 0.1122 Mail Ballots Unreturned 0.3767 0.2012 -0.0339 0.2098 0.2728 0.0263 Overseas Ballots Rejected 0.2694 -0.1322 0.3264 -0.0180 -0.2292 -0.227 Overseas Ballots Unreturned 0.3026 0.0712 -0.0959 0.4068 0.2136 0.0081 Data Completeness -0.1171 0.2754 0.1365 0.0544 -0.0062 -0.4984 Post-Election Audit Requirement
0.1778 -0.0524 -0.0024 -0.2027 -0.3437 0.3614
Disability/Illness Related Problems
-0.1705 -0.3659 0.0979 0.2556 0.0847 0.0065
Registration or Absentee Problems
0.2042 0.3138 -0.0238 0.1818 -0.3315 -0.0049
Online Registration Availability
0.2291 0.1048 0.0928 0.3803 -0.3784 0.2122
Voting Wait Time 0.0002 -0.2981 0.3429 0.1429 -0.0620 0.0485 Voter Registration Rate -0.0810 0.2593 0.3552 0.0030 0.0196 0.3034 Voter Turnout -0.1704 0.3444 0.1476 -0.2460 0.1571 0.0589

26
Table 3: The Relationship between Principal Components and Citizens’ Attitudes About Votes Being Counted Fairly
EIP Component #1 0.0561*
(0.0178) EIP Component #2 -0.0184
(0.0175) Pew Component #1 0.0038
(0.0098) Pew Component #2 0.0049
(0.0109) Pew Component #3 0.0062
(0.0189) Pew Component #4 -0.0164
(0.0189) Pew Component #5 -0.0118
(0.0150) Pew Component #6 0.0292*
(0.0092) Each row in the table is a separate regression model. Dependent variable for all models is individual 2016 ANES respondent’s belief that “votes are counted fairly” (1-5, more confidence coded higher). Cell entries are the OLS regression coefficient for the indicated independent variable (with standard errors clustered by state reported below in parentheses). All models control for intensity of partisanship, attention to politics, education, income, gender, age, race, and the % non-white, % foreign born, and closeness of the 2016 presidential election in a respondent’s state. * denotes p<.05 using a two-tailed test.

27
Table 4: The Relationship between Individual Indicators and Citizens’ Attitudes About Votes Being Counted Fairly
EIP Electoral Laws Indicator 0.0024 (0.0012) EIP Electoral Procedures Indicator 0.0038 (0.0021) EIP Boundaries Indicator 0.0008 (0.0014) EIP Voter Registration Indicator 0.0066 (0.0023)* EIP Party Registration Indicator 0.0006 (0.0020) EIP Campaign Media Indicator 0.0041 (0.0024) EIP Campaign Finance Indicator 0.0027 (0.0030) EIP Voting Process Indicator 0.0075 (0.0028)* EIP Vote Count Indicator 0.0046 (0.0033) EIP Post-Election Indicator -0.0017 (0.0026) EIP Electoral Authorities Indicator 0.0051 (0.0018)* Pew Registration Status Website Lookup Indicator 0.0503 (0.0570) Pew Precinct Ballot Website Lookup Indicator 0.0522 (0.0344) Pew Absentee Status Website Lookup Indicator 0.0266 (0.0351) Pew Provisional Ballot Status Website Lookup Indicator -0.0003 (0.0341) Pew Registrations Rejected Indicator 0.4070 (0.5766) Pew Provisional Ballots Cast Indicator -0.2141 (1.0100) Pew Percentage of Provisional Ballots Rejected Indicator -2.6775 (11.9750) Pew Percentage of Mail Ballots Rejected Indicator 9.9173 (6.4046) Pew Percentage of Mail Ballots Unreturned Indicator 0.1260 (0.1733) Pew Percentage of Military and Overseas Ballots Rejected Indicator -0.2161 (0.5404) Pew Percentage of Military and Overseas Ballots Unreturned Indicator 0.0190 (0.0985) Pew Data Completeness Indicator 0.2635 (0.2151) Pew Post-Election Audit Requirement Indicator 0.0909 (0.0364)* Pew Disability or Illness Related Voting Problems Indicator -1.6505 (0.9255) Pew Registration or Absentee Problems Indicator 0.5281 (1.0996) Pew Availability of Online Registration Indicator 0.0541 (0.0407) Pew Voting Wait Time Indicator -0.0076 (0.0071) Pew Voter Registration Rate Indicator 0.7445 (0.4008) Pew Voter Turnout Rate Indicator 0.3262 (0.2289)
Each row in the table is a separate regression model. Dependent variable for all models is individual 2016 ANES respondent’s belief that “votes are counted fairly” (1-5, more confidence coded higher). Cell entries are the OLS regression coefficient for the indicated independent variable (with standard errors clustered by state reported to the right in parentheses). All models control for intensity of partisanship, attention to politics, education, income, gender, age, race, and the % non-white, % foreign born, and closeness of the 2016 presidential election in a respondent’s state. * denotes p<.05 using a two-tailed test.