Embed Size (px)
Citation preview

1vu.edu/tera | 615.322.5538 | [email protected] | @TNEdResAlliance
A Research Brief on Strengthening Tennessee’s Education Labor Market February 2019
IntroductionPolicymakers in Tennessee have prioritized efforts in recent years to foster high-quality learning environments for students in the early elementary grades. Research shows that when students have access to high-quality early learning opportunities, they are more likely to succeed academically in later years (Deming, 2009; Duncan & Magnuson, 2013). These foundational early experiences can pay dividends even into adulthood (Cunha & Heckman, 2007; Chetty et al., 2011).
Given research consensus on the importance of early learning, Tennessee has an interest in ensuring that its youngest students have access to strong teachers. Yet, research conducted in other states suggests that elementary schools face pressures to place more effective teachers in upper grades where students are tested for accountability purposes (Chingos & West, 2011; Grissom, Kalogrides, & Loeb, 2017). In those studies, schools tended to reassign less effective upper-grades teachers to untested K–2 classrooms. Second graders taught by one of these reassigned teachers not only had lower second grade achievement, but lower achievement in later years when they moved into tested grades (Grissom, Kalogrides, & Loeb, 2017), suggesting schools had taken on a counterproductive strategy.
In this brief, we examine whether Tennessee elementary schools are distributing teacher quality equitably across the Pre-K and elementary (K–5) grades. Leveraging the Tennessee Education Research Alliance’s (TERA)
Sy Doan and Laura K. Rogers
longitudinal data on teachers and students, we focus on the differences between the lower (Pre-K–2) and upper (3–5) elementary grades to study patterns in teacher reassignment and the development of teacher effectiveness throughout their careers across these two groups.
We find four key patterns regarding the distribution of teacher effectiveness between lower elementary grades and upper elementary grades in Tennessee:
Lower elementary teachers are significantly more likely than upper elementary teachers to hold early elementary endorsement. Both groups of teachers have similar levels of teaching experience and master’s degree attainment.
Average observation scores across elementary school grades have increased over time, yet upper elementary school teachers have consistently earned higher scores than lower elementary school teachers.
With few exceptions, upper elementary teachers tend to score higher, on average, than similarly experienced lower elementary teachers.
Low-performing upper elementary teachers are significantly more likely to be reassigned to a lower elementary grade the following year than their more effective peers, though the overall impact is small.
Comparing the Effectiveness of Early and Upper Elementary Teachers in Tennessee
1
2
3
4

2
We compare the effectiveness of lower and upper elementary school teachers using longitudinal Tennessee data on Pre-K to Grade 5 students and teachers between 2005-06 to 2015-16. Analyses using teachers’ TEAM evaluation scores are restricted to 2011-12 (the first year of TEAM implementation) to 2015-16.
The TEAM evaluation system monitors teacher performance using classroom observation scores, teacher value-added estimates, and a composite “Level of Effectiveness” (LOE) rating that combines teachers’ scores on the latter two measures. Throughout this brief, we use both teachers’ observation scores and LOE ratings as measures of teacher performance. Our findings are broadly consistent regardless of the specific measure used.
In analyses focusing on “teacher reassignment,” we define a reassigned, or “switched,” teacher as one who stays in the same school but teaches in a different grade between two adjacent years. Several studies find that reassignment can affect teachers’ ability to acquire grade-specific skills, and as a consequence, harm student achievement (Atteberry, Loeb, & Wyckoff, 2017; Blazar, 2015; Ost, 2014).
Lastly, we look at whether gaps in effectiveness between lower elementary and upper elementary teachers appear to persist throughout the course of a teacher’s career. An ideal method for conducting this analysis would be to examine the growth of individual teachers on a consistent effectiveness measure across the course of their careers. However, no such consistent measure is available for teachers in all elementary grades because observation scores have been available through TEAM only since 2012. Therefore, we are limited to making “cross-sectional” comparisons, which map patterns of improvement largely using the differences between teachers of varying levels of experience.1
HOW WE EXAMINE DIFFERENCES IN TEACHER EFFECTIVENESS
1 Despite these limitations, the cross-sectional patterns we show in this brief are largely consistent with those patterns by Papay and Laski (2018), who estimate returns of teacher experience in Tennessee in greater detail.

3
KEY FINDINGS
First, when comparing lower grade (Pre-K to Grade 2) and upper grade (Grade 3 – Grade 5) elementary teachers on several key observable characteristics (i.e., teacher experience, degrees, and credentials), we find few differences between these groups. Upper elementary teachers, on average, have one fewer year of teaching experience than lower elementary teachers though are slightly more likely to have earned a master’s degree. Unsurprisingly, while a majority of all elementary teachers hold a general elementary (Grades K–5) endorsement, a greater percentage of lower elementary teachers hold�BO early elementary (Grades K–3) endorsement than upper elementary teachers.
14
12
10
8
6
4
2
0
Years of Experience % Master’s Degree % Early Elementary Endorsement
13
Pre-K–Grade 2 Grades 3–5
12100%
80%
60%
40%
20%
0
53%
Pre-K–Grade 2 Grades 3–5
55%
100%
80%
60%
40%
20%
0
33%
Pre-K–Grade 2 Grades 3–5
12%
UPPER ELEMENTARY TEACHERS ARE MORE LIKELY TO HAVE A MASTER’S DEGREE BUT LESS LIKELYTO HOLD EARLY ELEMENTARY ENDORSEMENT THAN LOWER ELEMENTARY SCHOOL TEACHERS.
LOWER AND UPPER ELEMENTARY TEACHERS DIFFER ON POSSESSION OF EARLY ELEMENTARY ENDORSEMENT BUT HAVE SIMILAR LEVELS OF TEACHING EXPERIENCE AND MASTER’S DEGREE ATTAINMENT. 1

4
Disparities between upper and lower elementary teachers grow starker when comparing their classroom observation scores. We use observation scores for this analysis, as they are both a direct measure of educator effectiveness and are available for teachers across all grades. As the graph below shows, average observation scores of Tennessee teachers have gradually increased since 2012. Yet, apart from Pre-K teachers, lower elementary teachers have consistently earned lower average observation scores than their peers teaching in upper elementary grades.
Importantly, however, because of the way in which we measure teacher effectiveness, we should also exercise caution when interpreting these findings because observation scores are subjective. We primarily use teachers’ overall evaluation ratings and observation scores in this analysis as these scores are available for teachers in all elementary grades, regardless of whether students take the TNReady exams in those grades. Because observation scores are subjective measures, it may be possible that lower observation scores among Pre-K-2 teachers are due to differences in how observers perceive or how observation rubrics capture teaching in the lower elementary grades. Future research investigating the validity of the observation process for teachers in all grades is necessary to better support policy recommendations made on the basis of these scores.
3.6
3.7
3.8
3.9
4
4.1
4.2
2012 2013 2014 2015 2016
Pre-K
K
G1
G2
G3
G4
G5
ON AVERAGE, TEACHER OBSERVATION SCORES INCREASE OVER TIME, BUT ARE CONSISTENTLYHIGHER FOR UPPER ELEMENTARY TEACHERS THAN LOWER ELEMENTARY TEACHERS.
Ave
rage
Obs
erva
tion
Scor
es
OBSERVATION SCORES ACROSS ELEMENTARY SCHOOL GRADES HAVE INCREASED OVER TIME, YET UPPER ELEMENTARY SCHOOL
TEACHERS HAVE CONSISTENTLY EARNED HIGHER SCORES THAN LOWER ELEMENTARY SCHOOL TEACHERS.
2
5
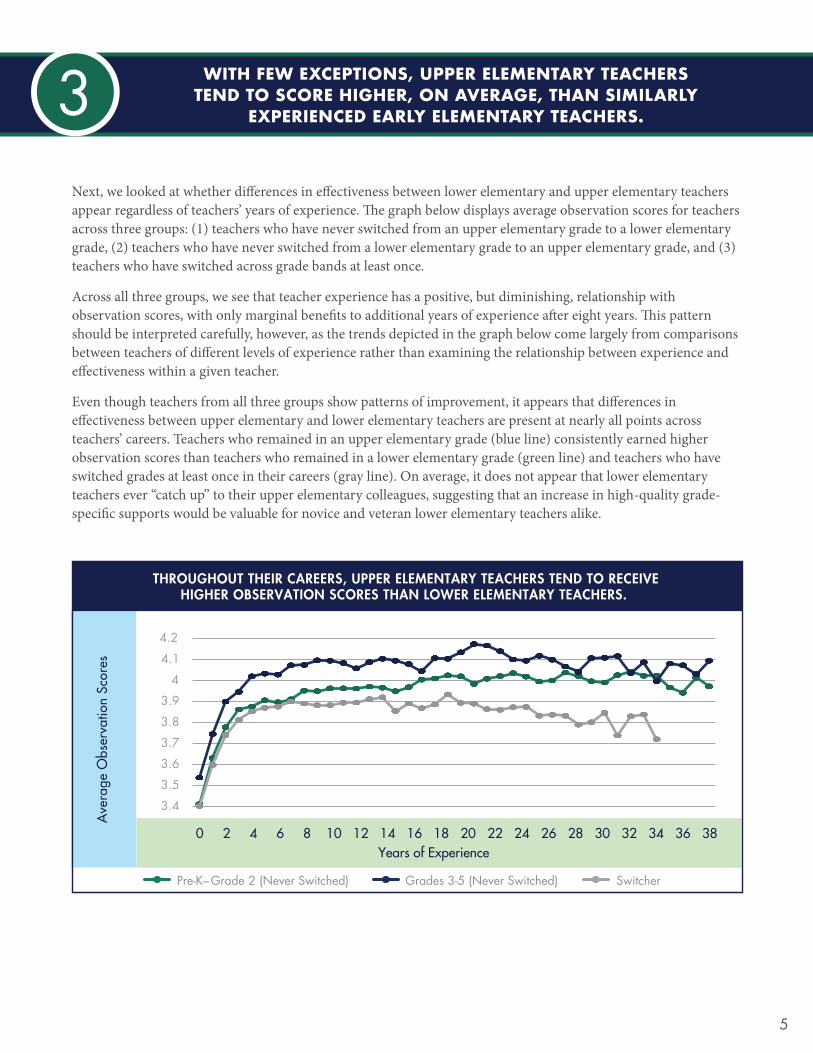
Next, we looked at whether differences in effectiveness between lower elementary and upper elementary teachers appear regardless of teachers’ years of experience. The graph below displays average observation scores for teachers across three groups: (1) teachers who have never switched from an upper elementary grade to a lower elementary grade, (2) teachers who have never switched from a lower elementary grade to an upper elementary grade, and (3) teachers who have switched across grade bands at least once.
Across all three groups, we see that teacher experience has a positive, but diminishing, relationship with observation scores, with only marginal benefits to additional years of experience after eight years. This pattern should be interpreted carefully, however, as the trends depicted in the graph below come largely from comparisons between teachers of different levels of experience rather than examining the relationship between experience and effectiveness within a given teacher.
Even though teachers from all three groups show patterns of improvement, it appears that differences in effectiveness between upper elementary and lower elementary teachers are present at nearly all points across teachers’ careers. Teachers who remained in an upper elementary grade (blue line) consistently earned higher observation scores than teachers who remained in a lower elementary grade (green line) and teachers who have switched grades at least once in their careers (gray line). On average, it does not appear that lower elementary teachers ever “catch up” to their upper elementary colleagues, suggesting that an increase in high-quality grade-specific supports would be valuable for novice and veteran lower elementary teachers alike.
3.4 3.5 3.6 3.7 3.8 3.9
4 4.1 4.2
0 2 4 6 8 10 12 14 16 18 20 22 24 26 28 30 32 34 36 38 Years of Experience
Pre-K–Grade 2 (Never Switched) Grades 3-5 (Never Switched) Switcher
THROUGHOUT THEIR CAREERS, UPPER ELEMENTARY TEACHERS TEND TO RECEIVEHIGHER OBSERVATION SCORES THAN LOWER ELEMENTARY TEACHERS.
Ave
rage
Obs
erva
tion
Scor
es
WITH FEW EXCEPTIONS, UPPER ELEMENTARY TEACHERS TEND TO SCORE HIGHER, ON AVERAGE, THAN SIMILARLY
EXPERIENCED EARLY ELEMENTARY TEACHERS. 3

6
Accounting for a number of teacher and school characteristics, we find that less effective upper elementary teachers are substantially more likely to be reassigned to a lower elementary grade. This pattern is most apparent for teachers at the poles of the effectiveness scale. Specifically, upper elementary teachers with an overall evaluation score of 1 are 10 times more likely to be reassigned to lower, non-tested grades than teachers who earned a top score of 5 on their overall evaluation. Similar patterns exist when we replace teachers’ overall evaluation scores with their observation or TVAAS scores only.
The differences between the probability of reassignment for upper elementary teachers with the highest and lowest overall evaluation scores are stark but likely account for only a small portion of the total effectiveness divide. Fewer than 10% of upper elementary teachers reassigned to a lower elementary grade the following year received an overall evaluation score of 1 or 2, a percentage which equates to roughly 100 teachers in any given year.2
Probability of Upper Elementary to Lower Elementary Reassignment
50%
40%
30%
20%
10%
0
30%
1
17%
2
10%
3
7%
4
3%
5
Probability of Lower Elementary to Upper Elementary Reassignment
Level of Effectiveness (Overall Evaluation Score)
Level of Effectiveness (Overall Evaluation Score)
50%
40%
30%
20%
10%
0
5%
1
4%
2
4% 4% 4%
3 4 5
THE CHANCE OF A LOW-PERFORMING UPPER ELEMENTARY TEACHER GETTING REASSIGNEDTO A LOWER GRADE IS MUCH HIGHER THAN THE CHANCE OF A LOW-PERFORMING
EARLY ELEMENTARY TEACHER GETTING REASSIGNED TO A HIGHER GRADE.
Prob
abili
ty o
f Rea
ssig
nmen
tPr
obab
ility
of R
eass
ignm
ent
2 The small number of low-performing upper elementary to lower elementary teachers is driven, in part, by the small percentage of all elementary teachers earning an overall effectiveness score of 1 or 2 (9%). When we use alternative definitions of low performance (e.g., bottom 20th percentile of observation scores or bottom 20th percentile of value-added scores), the total number of switchers identified as low performing increases slightly, but never amounts to more than approximately 150 teachers per year.
Notably, we do not observe this pattern in reverse: there appears to be no relationship between a lower elementary teacher’s overall evaluation score and the probability she is reassigned to an upper elementary grade the following year.
LOW-PERFORMING UPPER ELEMENTARY TEACHERS ARE SIGNIFICANTLY MORE LIKELY TO BE REASSIGNED TO A LOWER
ELEMENTARY GRADE THE FOLLOWING YEAR THAN THEIR MORE EFFECTIVE PEERS, THOUGH THE OVERALL IMPACT IS SMALL.
4

7
CONCLUSION AND IMPLICATIONS
In Tennessee, teacher effectiveness is not distributed equally throughout elementary school grades. We find that lower elementary teachers, with the exception of Pre-K, earn lower evaluation scores than teachers in upper elementary grades, and that this difference is present among both novice and veteran teachers. These trends matter because having effective teachers in the early grades helps establish a foundation for success as students progress into later grades.
Teacher reassignment is one contributing factor to these differences in effectiveness. Less effective upper elementary teachers are more likely to be reassigned to a lower elementary grade than more effective upper elementary teachers. While the total number of the lowest-performing upper elementary teachers being reassigned is small—fewer than 10% of upper elementary teachers reassigned to a lower elementary grade the following year received an overall evaluation score of 1 or 2—our findings suggest that schools may be moving less effective teachers into these critical earliest grades.
What we’ve found in Tennessee is consistent with studies conducted in other states that have also found patterns of “strategic” reassignment of teachers (Cohen-Vogel, 2011; Grissom, Kalogrides, & Loeb, 2017). Because student test scores are factored into school and district accountability ratings, administrators potentially have an incentive to “staff to the test,” reassigning the school’s strongest teachers in the tested grades and shifting relatively low-performing teachers to non-tested grades.
The reassignment of teachers from upper grades to lower grades of elementary school could lead to unintended consequences for teachers and students in these early grades. For example, reassignment may disrupt teachers’ ability to acquire grade-specific skills and knowledge that are central to their effectiveness in the classroom (Blazar, 2015; Ost, 2014). Less effective upper elementary teachers moved into lower elementary grades must undertake the double duty of trying to improve their overall teaching while also learning to teach younger children content and skills at a specific developmental level. Policymakers should monitor these trends because teacher reassignment may exacerbate the gap we see in effectiveness between lower elementary and upper elementary teachers, which could also impact student achievement.
Our findings suggest that schools may be moving less effective teachers into these critical earliest grades. Policymakers should monitor these trends because teacher reassignment may exacerbate the gap we see in effectiveness between lower elementary and upper elementary teachers.

8
REFERENCES
vu.edu/tera | 615.322.5538 | [email protected] | @TNEdResAlliance
Atteberry, A., Loeb, S., & Wyckoff, J. (2016). Teacher churning reassignment rates and implications for student achievement. Educational Evaluation and Policy Analysis, 39�, 3-30.
Blazar, D. (2015). Grade assignments and the teacher pipeline� " low-cost lever to improve student achievement? Educational Researcher, 44(4), 213–227.
Chetty, R., Friedman, J. N., Hilger, N., Saez, E., Schanzenbach, D. W., & Yagan, D. (2011). How does your kindergarten classroom affect your earnings? Evidence from Project STAR. The Quarterly Journal of Economics, 126(4), 1593–1660.
Chingos, M. M. & West, M. (2011). Promotion and reassignment in public school districts: How do schools respond to differences in teacher effectiveness? Economics of Education Review, 30(3), 419-433.
Cohen-Vogel, L. (2011). “Staffing to the test”: Are today’s school personnel practices evidence based? Educational Evaluation and Policy Analysis, 33(4), 483–505.
Cunha, F., & Heckman, J. (2007). The technology of skill formation. National Bureau of Economic Research. Retrieved from http://www.nber.org/papers/w12840.ack.
Deming, D. (2009). Early childhood intervention and life-cycle skill development: Evidence from Head Start. American Economic Journal: Applied Economics, 1(3), 111–134.
Duncan, G. J., & Magnuson, K. (2013). Investing in preschool programs. Journal of Economic Perspectives, 27(2), 109–132.
Grissom, J. A., Kalogrides, D., & Loeb, S. (2017). Strategic staffing? How performance pressures affect the distribution of teachers within schools and resulting student achievement. American Educational Research Journal, 54(6), 1079-1116.
Ost, B. (2014). How do teachers improve? The relative importance of specific and general human capital. American Economic Journal: Applied Economics, 6(2), 127–151.
Papay, J.P. & Laski, M.E. (2018) Exploring teacher improvement in Tennessee: A brief on reimagining state support for professional learning. Nashville, TN: Tennessee Education Research Alliance. Retrieved from: https://peabody.vanderbilt.edu/TERA/files/Exploring_Teacher_Improvement.pdf.