Embed Size (px)
Citation preview

EPRI Project Manager R. Graham
EPRI • 3412 Hillview Avenue, Palo Alto, California 94304 • PO Box 10412, Palo Alto, California 94303 • USA 800.313.3774 • 650.855.2121 • [email protected] • www.epri.com
Comparing the Benefits and Impacts of Hybrid Electric Vehicle Options 1000349
Final Report, July 2001

DISCLAIMER OF WARRANTIES AND LIMITATION OF LIABILITIES
THIS DOCUMENT WAS PREPARED BY THE ORGANIZATION(S) NAMED BELOW AS AN ACCOUNT OF WORK SPONSORED OR COSPONSORED BY THE ELECTRIC POWER RESEARCH INSTITUTE, INC. (EPRI). NEITHER EPRI, ANY MEMBER OF EPRI, ANY COSPONSOR, THE ORGANIZATION(S) BELOW, NOR ANY PERSON ACTING ON BEHALF OF ANY OF THEM:
(A) MAKES ANY WARRANTY OR REPRESENTATION WHATSOEVER, EXPRESS OR IMPLIED, (I) WITH RESPECT TO THE USE OF ANY INFORMATION, APPARATUS, METHOD, PROCESS, OR SIMILAR ITEM DISCLOSED IN THIS DOCUMENT, INCLUDING MERCHANTABILITY AND FITNESS FOR A PARTICULAR PURPOSE, OR (II) THAT SUCH USE DOES NOT INFRINGE ON OR INTERFERE WITH PRIVATELY OWNED RIGHTS, INCLUDING ANY PARTY'S INTELLECTUAL PROPERTY, OR (III) THAT THIS DOCUMENT IS SUITABLE TO ANY PARTICULAR USER'S CIRCUMSTANCE; OR
(B) ASSUMES RESPONSIBILITY FOR ANY DAMAGES OR OTHER LIABILITY WHATSOEVER (INCLUDING ANY CONSEQUENTIAL DAMAGES, EVEN IF EPRI OR ANY EPRI REPRESENTATIVE HAS BEEN ADVISED OF THE POSSIBILITY OF SUCH DAMAGES) RESULTING FROM YOUR SELECTION OR USE OF THIS DOCUMENT OR ANY INFORMATION, APPARATUS, METHOD, PROCESS, OR SIMILAR ITEM DISCLOSED IN THIS DOCUMENT.
ORGANIZATION(S) THAT PREPARED THIS DOCUMENT
Arthur D. Little, Inc.
Southern California Edison
Electric Power Research Institute
University of California Davis Hybrid Electric Vehicle Center
General Motors Corporation
Argonne National Laboratory
National Renewable Energy Laboratory
Applied Decision Analysis
Ford Motor Company
U.S. Department of Energy
Sacramento Municipal Utility District
ORDERING INFORMATION
Requests for copies of this report should be directed to EPRI Customer Fulfillment, 1355 Willow Way, Suite 278, Concord, CA 94520, (800) 313-3774, press 2.
Electric Power Research Institute and EPRI are registered service marks of the Electric Power Research Institute, Inc. EPRI. ELECTRIFY THE WORLD is a service mark of the Electric Power Research Institute, Inc.
Copyright © 2001 Electric Power Research Institute, Inc. All rights reserved.

iii
CITATIONS
This report was prepared by
Arthur D. Little, Inc.
Principal Investigator S. Unnasch, E. Kassoy, R. Counts, C. Powars, and L. Browning
Southern California Edison
Principal Investigators D. Taylor and J. Smith
Electric Power Research Institute
Principal Investigators F. Kalhammer and R. Graham
University of California Davis
Principal Investigators A. Frank, R. Schurhoff and M. Duvall
General Motors Corporation
Principal Investigators M. Kosowski and R. Bush
Argonne National Laboratory
Principal Investigators D. Santini and A. Vyas
National Renewable Energy Laboratory
Principal Investigator T. Markel
Applied Decision Analysis
Principal Investigator A. Miller
Ford Motor Company
Principal Investigator S. Reisen
U.S. Department of Energy
Sacramento Municipal Utility District
Principal Investigator W. Warf
This report describes research sponsored by EPRI.
The report is a corporate document that should be cited in the literature in the following manner:
Comparing the Benefits and Impacts of Hybrid Electric Vehicle Options, EPRI, Palo Alto, CA: 2001. 1000349.


v
REPORT SUMMARY
This project continues the Hybrid Electric Vehicle Working Group (WG) study in which EPRI has brought together representatives from the utility and automotive industries, the U.S. Department of Energy (DOE), other regulatory agencies, and university research organizations. The first study, Assessment of Current Knowledge of Hybrid Vehicle Characteristics and Impacts (EPRI report TR-113201), defined some of the ground rules for studying HEV technology. This study, Comparing the Benefits and Impacts of Hybrid Electric Vehicle Options, focuses on the key attributes of HEV performance, energy economy, fuel-cycle emissions, costs, consumer acceptance, and commercialization issues.
Background Several automobile companies are introducing hybrid electric vehicles (HEV), with others expected to follow soon. These early HEVs vary in many ways: vehicle platform, engine size, electric motors and batteries, and operational control algorithms, to name a few. How these various components are sized, packaged, and controlled will substantially impact benefits the vehicle system is likely to provide in fuel savings, environmental impact, performance, and customer acceptance. Many early HEV designs run exclusively on fossil fuels. Other HEV designs could provide a portion of the vehicle’s range using grid-supplied electricity if the vehicle design accommodated more on-board energy storage. More on-board storage also would allow manufacturers to offer additional benefits of electric vehicles, such as quiet operation and the convenience of home charging. HEVs with “all electric range” could have different impacts and benefits than their “fuel only” counterparts, but this remains to be proven. Additionally, the cost differential for achieving benefits anticipated for each possible option is largely unknown.
Objective To scientifically compare several potential HEV design options with input from automakers and other stakeholders.
Approach The WG defined HEV configuration with the Department of Energy National Renewable Energy Laboratory’s hybrid electric vehicle simulation model, ADVISOR, to meet specified performance goals. Once these designs were defined, the WG used ADVISOR to estimate fuel economy for HEVs and conventional vehicles. Environmental benefits were studied using both ANL’s Greenhouse Gas Emission Model (GREET) and Arthur D. Little’s fuel-cycle emissions model. Vehicle and operating costs were investigated using a retail price equivalence model starting with component costs and applying mark-ups to predict the price paid by consumers for these vehicles. The WG determined operating costs for both energy costs and maintenance costs. Customer preference for HEVs was determined using focus groups and a choice-based market

vi
model. The WG then examined commercialization issues, including policies and incentives, technology barriers and opportunities, and public outreach and marketing.
Results This report indicates that HEVs, including grid-connected (plug-in) models, can probably be designed for a wide variety of vehicle platforms meeting performance characteristics customers are familiar with. Plug-in hybrids provide significantly improved fuel economy over conventional vehicles, reductions in greenhouse and smog precursor emissions, and petroleum use. However, HEVs, especially plug-in HEVs with an all-electric capability, cost more than conventional vehicles. HEVs are expensive due to complex motors and chargers and the energy storage required. Battery life and costs are challenges that need to be addressed. Potential battery replacements can significantly increase the vehicle's life-cycle cost.
The Customer Survey indicated that people preferred plugging in a vehicle instead of going to the gas station. The study also indicated a large market potential for all HEVs—if cost equivalence with conventional vehicles can be achieved and significant even when priced 25% more than a conventional vehicle counterpart.
EPRI Perspective This reports summarizes results from the first-ever public domain multi-variant study comparing benefits and impacts of conventional vehicles and HEVs (gasoline-only and dual-fuel). It provides evidence that grid-connected hybrid electric vehicles are technologically feasible and can offer significant benefits. The study was produced under EPRI’s direction with considerable participant input on approach, methodology, and results. Represented organizations and, in particular, individual participants are to be commended for their interest, enthusiasm, and input in making this document possible.
WG participants include the California Air Resources Board (ARB), the Department of Energy and two of its national labs (National Renewable Energy Laboratory, or NREL, and Argonne National Laboratory , or ANL), General Motors Corporation, Ford Motor Company, South Coast Air Quality Management District (SCAQMD), and University of California Davis Hybrid Vehicle Center as well as EPRI participants Southern California Edison, New York Power Authority, and Southern Company.
Keywords Hybrid electric vehicles Grid connected HEVs ADVISOR Customer preference

ABSTRACT
This study examines which types of hybrid electric vehicles (HEVs) offer the best combination of environmental and efficiency benefits while meeting the driving needs and economic constraints of automobile owners. Since 1999, the Hybrid Electric Vehicle Working Group (WG), a consortium of key environmental regulatory agencies, DOE and its national laboratories, major automobile manufacturers, an university HEV center, and EPRI, have been collaborating to systematically compare various HEV designs with each other and with comparable conventional vehicles (CVs). This study included vehicle modeling, cost modeling, consumer acceptance modeling, and an examination of commercialization issues. The study found that gasoline-fueled HEVs, including those with all-electric range (AER) could be designed to be comparable to and operate like current conventional vehicles. These vehicles offer improved efficiency, reduced emissions (both criteria pollutants and greenhouse gas emissions), and reduced petroleum dependency. Several hurdles still exist, however. HEVs tend to cost more than conventional vehicles, particularly with increasing AER. Battery costs and lifetimes are still uncertain, although much progress has been made on this front. Consumer preference studies show a definite market potential for all HEVs and that potential is large if cost equivalence with CVs could be achieved. Even at higher costs, the Customer Preference Survey indicates that there is still significant market potential for HEVs. Current interest in HEV offerings (Honda Insight and Toyota Prius) indicate the technology is viable and that with the possible exception of the batteries, plug-in HEVs require only evolutionary engineering advances over current HEVs.
vii

CONTENTS
EXECUTIVE SUMMARY ........................................................................................................XXI
1 INTRODUCTION ................................................................................................................. 1-1 1.1 Background............................................................................................................... 1-1 1.2 Study Organization.................................................................................................... 1-3 1.3 Road Map to Report.................................................................................................. 1-4
2 MID-SIZE CAR SUMMARY AND CONCLUSIONS.............................................................. 2-1 2.1 Introduction ............................................................................................................... 2-1 2.2 Vehicle Designs ........................................................................................................ 2-1 2.3 Vehicle Performance................................................................................................. 2-1
2.3.1 Design Methodology and Performance............................................................. 2-2 2.3.2 Design Issues................................................................................................... 2-3
2.4 Vehicle Efficiency (Fuel Economy) ............................................................................ 2-4 2.5 Emissions.................................................................................................................. 2-6
2.5.1 Methodology..................................................................................................... 2-6 2.5.2 Results ............................................................................................................. 2-7
2.6 Vehicle Retail Price Equivalent and Operating Costs ................................................ 2-9 2.6.1 Vehicle Retail Price Equivalent ......................................................................... 2-9
2.6.1.1 Methodology.................................................................................................. 2-9 2.6.1.2 Discussion of Results ...................................................................................2-11
2.6.2 Operating Costs...............................................................................................2-13 2.6.2.1 Methodology.................................................................................................2-13 2.6.2.2 Discussion of Results ...................................................................................2-14 2.6.2.3 Battery Replacement and its Costs...............................................................2-14
2.7 Customer Preference ...............................................................................................2-15 2.7.1 Focus Groups..................................................................................................2-15 2.7.2 Choice Based Market Model............................................................................2-15
ix
2.7.3 Direct Assessment...........................................................................................2-17 2.8 Commercialization Issues ........................................................................................2-18
2.8.1 Technology Barriers and Opportunities............................................................2-18 2.8.2 Policies and Incentives ....................................................................................2-19
2.9 Conclusions .............................................................................................................2-20
3 HEV PERFORMANCE, EFFICIENCY, AND EMISSIONS.................................................... 3-1 3.1 Overview................................................................................................................... 3-1 3.2 Vehicle Configurations .............................................................................................. 3-2
3.2.1 HEV Configurations .......................................................................................... 3-2 3.2.2 Design Parameters, Performance Targets, and Trade-offs............................... 3-4 3.2.3 Components ..................................................................................................... 3-7 3.2.4 HEV Control Strategies..................................................................................... 3-8
3.3 Vehicle Performance Specifications and Efficiencies ................................................ 3-8 3.3.1 Simulation Approach .......................................................................................3-10
3.3.1.1 ADVISOR Model ..........................................................................................3-10 3.3.1.2 Driving Cycles ..............................................................................................3-11 3.3.1.3 All-Electric Usage Estimation for Plug-in Hybrids..........................................3-12 3.3.1.4 Charging Frequency.....................................................................................3-14 3.3.1.5 SAE J1711 Recommended Practice for Efficiency Determination ................3-14 3.3.1.6 Control System Simulation ...........................................................................3-16 3.3.1.7 Component Sizing Sensitivities ....................................................................3-19
3.3.2 Base Case Results ..........................................................................................3-20 3.3.2.1 General ........................................................................................................3-20 3.3.2.2 Vehicle Mass................................................................................................3-22 3.3.2.3 Performance.................................................................................................3-23 3.3.2.4 Fuel Economy (Fuel Efficiency) ....................................................................3-27
3.3.3 Additional Vehicle Configurations ....................................................................3-29 3.3.4 Issues for Future Consideration.......................................................................3-30
3.3.4.1 Additional HEV 0 Control Strategy Options...................................................3-31 3.3.4.2 Additional Control Options for Plug-in HEVs.................................................3-31
3.4 Emissions.................................................................................................................3-33 3.4.1 Tailpipe Emissions...........................................................................................3-33 3.4.2 Vehicle Evaporative Emissions........................................................................3-35 3.4.3 Fuel-Cycle Emissions ......................................................................................3-36
x

3.4.4 Emission Results .............................................................................................3-39 3.5 Other Vehicle and Component Issues ......................................................................3-41
3.5.1 Number of Drive/Traction Motors.....................................................................3-41 3.5.2 Engine Durability .............................................................................................3-42 3.5.3 Engine Selection..............................................................................................3-42 3.5.4 Continuously Variable Transmission (CVT) .....................................................3-42 3.5.5 Cabin Heating..................................................................................................3-43 3.5.6 Battery Pack Placement/Location ....................................................................3-43 3.5.7 “Turtle” Light (Battery Reserve Capacity).........................................................3-43 3.5.8 Battery Life Requirement .................................................................................3-44 3.5.9 Battery Selection .............................................................................................3-44 3.5.10 Battery Cooling.............................................................................................3-45
4 HEV COSTS ........................................................................................................................ 4-1 4.1 Overview................................................................................................................... 4-1 4.2 Methodology ............................................................................................................. 4-1
4.2.1 Vehicle RPE ..................................................................................................... 4-2 4.2.1.1 Representative Costs: Conventional Vehicle ................................................. 4-2 4.2.1.2 Component-Based Cost Analysis .................................................................. 4-2
4.2.1.2.1 Glider Costs........................................................................................... 4-3 4.2.1.2.2 Engine Costs ......................................................................................... 4-3 4.2.1.2.3 Transmission Costs ............................................................................... 4-4 4.2.1.2.4 Electric Traction Costs ........................................................................... 4-4 4.2.1.2.5 Accessory Costs .................................................................................... 4-7 4.2.1.2.6 Storage System Costs ........................................................................... 4-7 4.2.1.2.6.1 Battery Module Cost ........................................................................... 4-8 4.2.1.2.6.2 Other Battery Component Costs ......................................................... 4-9 4.2.1.2.7 Charger Costs........................................................................................ 4-9
4.2.1.3 Mark-up Factors ...........................................................................................4-11 4.2.1.4 Development Costs ......................................................................................4-12
4.2.2 Operating Costs...............................................................................................4-13 4.2.2.1 Nominal Vehicle Life.....................................................................................4-13 4.2.2.2 Driving Schedules ........................................................................................4-13 4.2.2.3 Energy Consumption....................................................................................4-15 4.2.2.4 Scheduled Maintenance ...............................................................................4-15
xi

4.2.2.5 Unscheduled Maintenance ...........................................................................4-17 4.2.2.6 Frequency and Cost of Battery Replacement ...............................................4-17
4.2.2.6.1 Battery Life ...........................................................................................4-17 4.3 Component and Vehicle Costs .................................................................................4-20
4.3.1 Vehicle Fully Loaded Costs .............................................................................4-20 4.4 Energy Cost Savings................................................................................................4-23 4.5 Maintenance Cost Savings.......................................................................................4-23 4.6 Reduction in Gasoline Consumption ........................................................................4-24 4.7 Estimated Trips to the Gas Station...........................................................................4-25 4.8 Additional Configurations .........................................................................................4-25 4.9 Issues not Addressed in this Study ..........................................................................4-27
5 CUSTOMER PREFERENCES............................................................................................. 5-1 5.1 Focus Groups ........................................................................................................... 5-1
5.1.1 Focus Group Interviews.................................................................................... 5-2 5.1.2 Focus Group Results........................................................................................ 5-3
5.2 Choice-Based Market Modeling ................................................................................ 5-4 5.2.1 Design Attributes .............................................................................................. 5-4 5.2.2 Methodology to Collect Interview Data.............................................................. 5-5
5.2.2.1 Interview Assumptions................................................................................... 5-5 5.2.3 Interview and Model Construction..................................................................... 5-6
5.2.3.1 Analysis and Model Validation....................................................................... 5-7 5.2.3.2 Accuracy of Model Results ...........................................................................5-10 5.2.3.3 Model Assumptions ......................................................................................5-11
5.2.4 Market Preference Results ..............................................................................5-13 5.2.4.1 Base Case Results.......................................................................................5-14 5.2.4.2 Sensitivity Analysis.......................................................................................5-19
5.3 Direct Assessment Survey Responses.....................................................................5-23 5.3.1 Ranking of HEV Benefits .................................................................................5-23 5.3.2 Interest in Plugging in Versus Going to the Gasoline Station ...........................5-24 5.3.3 Ranking of HEV Incentives ..............................................................................5-25
6 HEV COMMERCIALIZATION OPPORTUNITIES AND BARRIERS .................................... 6-1 6.1 Policies and Incentives.............................................................................................. 6-2
6.1.1 Current and Pending Policies and Incentives.................................................... 6-2
xii

6.1.1.1 Federal Incentives for HEVs.......................................................................... 6-3 6.1.1.1.1 Tax Incentives........................................................................................ 6-3 6.1.1.1.2 The Energy Policy Act of 1992 (EPAct).................................................. 6-7 6.1.1.1.3 Corporate Average Fuel Economy (CAFE) ............................................ 6-8 Current CAFE Standards ................................................................................... 6-8 CAFE Incentives for Alternative Fuels and Flexible Fuel Vehicles ................. 6-8 Flexibility for HEVs in CAFE Incentives ............................................................ 6-9 Possible Hybrid Vehicle Fuel Economy Calculation for CAFE........................ 6-9 CAFE Incentives for Manufacturers .................................................................6-10 6.1.1.1.4 HEVs in HOV Lanes and ZEV-Areas ....................................................6-10 6.1.1.1.5 Proposed Federal Legislation on HEVs Incentives................................6-11
6.1.1.2 Current State Incentives ...............................................................................6-12 6.1.1.2.1 California ...................................................................................................6-12
California Energy Commission (CEC) EV $5,000 Buy Down Program CEC.....................................................................................................................6-12 Zero Emission Vehicle Incentive Program.......................................................6-12 Reduced Vehicle Registration Fees .................................................................6-12 Incentives to Lease or Buy Advanced Vehicles ..............................................6-12 Zero Emission Vehicle (ZEV) Mandate .............................................................6-13
6.1.1.3 Proposed State Incentives............................................................................6-13 6.1.1.3.1 CEC Efficient Vehicles Incentive Program ............................................6-13
6.1.1.4 Local Incentives............................................................................................6-13 6.1.1.4.1 Parking and Charging Incentives for EVs and HEVs.............................6-13
6.2 Technology Barriers and Opportunities ....................................................................6-14 6.2.1 Advantages of HEV Infrastructure ...................................................................6-14 6.2.2 Battery Life ......................................................................................................6-14
6.3 Marketing and Public Education/Information ............................................................6-15 6.3.1 Current Marketing and Public Information Efforts.............................................6-15
7 REFERENCES .................................................................................................................... 7-1
8 GLOSSARY......................................................................................................................... 8-1
A SUMMARY AND CONCLUSIONS ......................................................................................A-1
B HEV PERFORMANCE, EFFICIENCY, AND EMISSIONS...................................................B-1 B.1 ADVISOR Modeling Results...................................................................................... B-1
xiii
B.2 Mileage Weighted Probabilities Versus Utility Factor................................................. B-1 B.3 Fuel Economy Formulas ........................................................................................... B-5
Gasoline Only ..................................................................................................... B-5 Electric Only ....................................................................................................... B-5 UF Weighted ....................................................................................................... B-6 J1711 UF Weighted............................................................................................. B-6 MWP Weighted.................................................................................................... B-7 J1711 MWP Weighted......................................................................................... B-7
B.4 Emissions.................................................................................................................. B-8
C HEV COSTS........................................................................................................................C-1 C.1 Formulas for Computing Vehicle Component Costs .............................................C-1 C.2 Component Cost Summary for Mid-Size Vehicles ................................................C-1 C.3 Vehicle RPE Calculations .....................................................................................C-3 C.4 Details on ANL Method.........................................................................................C-5
C.4.1 Common Components Retail Price Equivalent .................................................C-5 C.4.2 Allocation of Indirect Costs ...............................................................................C-6 C.4.3 Component Cost Information ............................................................................C-7 C.4.4 Component Cost Functions ..............................................................................C-8
C.5 Fuel Costs ..........................................................................................................C-10 C.6 Maintenance Costs.............................................................................................C-17 C.7 Petroleum Displacement.....................................................................................C-24
D CUSTOMER PREFERENCE...............................................................................................D-1 D.1 HEV Discussion Guide .........................................................................................D-1 D.2 HEV Interview Questions......................................................................................D-5 D.3 HEV Frequently Asked Questions ......................................................................D-29 D.4 HEV Education Slides ........................................................................................D-30 D.5 HEV Screener Quantification Document.............................................................D-34 D.6 Focus Group Responses ....................................................................................D-38
D.6.1 Vehicle and Fuel Costs:..................................................................................D-38 D.6.2 Vehicle Attributes:...........................................................................................D-40 D.6.3 Societal and Policy Changes: .........................................................................D-41
D.7 Willingness to Pay More for HEVS .....................................................................D-42 D.8 120 V Plug for Electric Appliances; Pre-heat/Pre-cool as Option ........................D-44
xiv

LIST OF FIGURES
Figure 1-1 HEV Comparison Study Task Structure ................................................................. 1-2 Figure 1-2 Participants in the HEV Working Group Study ....................................................... 1-3 Figure 2-1 Fuel Economy Comparisons for the Mid-Size Car.................................................. 2-5 Figure 2-2 Full Fuel-Cycle Energy Use for the Mid-Size Car for the Average Driving
Cycle and Charging Nightly ............................................................................................. 2-6 Figure 2-3 NOx Plus HC (Smog) “Well-to-Wheels” Emissions for the Mid-Size Car for the
Average Driving Schedule and Charging Nightly ............................................................. 2-8 Figure 2-4 Greenhouse Gas Emissions (CO2) “Well-to-Wheels” for the Mid-Size Car for
the Average Driving Schedule and Charging Nightly ....................................................... 2-9 Figure 2-5 Mid-Size Car Component Retail Price Equivalent .................................................2-11 Figure 2-6 Retail Price Equivalent for the Mid-Size Car with and without Battery
Replacements ................................................................................................................2-12 Figure 2-7 NiMH Battery Module Costs to OEM Versus Battery Energy.................................2-12 Figure 2-8 Fuel Costs Per Mile for the Mid-Size Car when Charging Nightly..........................2-14 Figure 2-9 Market Preference Versus Vehicle Price for Mid-Size HEVs .................................2-16 Figure 3-1 Generic Parallel HEV Configuration (e.g., HEV 0, HEV 20, HEV 60)...................... 3-7 Figure 3-2 Parallel HEV Control Strategy (High Battery SOC)................................................3-18 Figure 3-3 Parallel HEV Control Strategy (Low Battery SOC) ................................................3-19 Figure 3-4 Engine and Motor Results for Mid-Size Vehicles...................................................3-21 Figure 3-5 Battery Energy Results for Mid-Size HEVs............................................................3-22 Figure 3-6 Mid-Size HEV and CV Masses..............................................................................3-23 Figure 3-7 Power-to-Mass Ratios for Mid-Size HEVs and CV ................................................3-25 Figure 3-8 Fuel Economy of Mid-Size HEVs Relative to CV...................................................3-27 Figure 3-9 Fuel-Cycle and Vehicle Emissions (NOx plus HC) .................................................3-40 Figure 3-10 Fuel-Cycle and Vehicle CO2 Emissions...............................................................3-41 Figure 4-1 Engine Cost as a Function of Engine Power .......................................................... 4-3 Figure 4-2 Traction Motor Costs as a Function of Production Volumes ................................... 4-5 Figure 4-3 Motor Controller Costs Versus Production Volumes............................................... 4-6 Figure 4-4 NiMH Battery Module Costs for Different HEV Battery Types................................. 4-8 Figure 4-5 Mid-Size Car Component Costs (without Mark-ups)..............................................4-22 Figure 4-6 Vehicle Fully Loaded Cost Estimates for the Mid-Size Car....................................4-22 Figure 4-7 Lifetime Energy Costs for the Mid-Size Car by Fuel Type for the Average
Driving Schedule and Nightly Charging ..........................................................................4-23
xv

Figure 4-8 Lifetime Maintenance Costs for the Mid-Size Vehicle for the Average Driving Schedule and Nightly Charging ......................................................................................4-24
Figure 4-9 Lifetime Gasoline Usage for the Mid-Size Car for Average Driving Schedule and Nightly Charging......................................................................................................4-24
Figure 4-10 Trips to the Gasoline Station per Year for the Mid-Size Car for the Average Driving Schedule and Nightly Charging ..........................................................................4-25
Figure 4-11 Total Component Costs for the Low-Drag, Lower Mass Mid-Size Car (Without Mark-ups).........................................................................................................4-26
Figure 4-12 Vehicle RPE for the Low-Drag, Lower Mass Mid-Size Car ..................................4-26 Figure 4-13 Lifetime Energy Costs for the Low-Drag, Lower Mass Mid-Size Car ...................4-27 Figure 5-1 Scenario 1 Base Case Results for Mid-Size and all Respondents.........................5-15 Figure 5-2 Preferences for HEV 0 by Commute Distance ......................................................5-16 Figure 5-3 HEV 20 Preference by Commute Distance ...........................................................5-16 Figure 5-4 Preferences for HEV 60 by Commute Distance.....................................................5-17 Figure 5-5 Preferences for HEVs and CVs by Commute Distance (Scenario 2) .....................5-18 Figure 5-6 Preference for HEVs When Choosing 1 Vehicle from all Configurations
(Scenario 2)....................................................................................................................5-18 Figure 5-7 Market Potentials for Mid-Size HEV 0 Versus a Conventional Vehicle ..................5-19 Figure 5-8 Market Preferences for Mid-Size HEV 20 Versus a Conventional Vehicle.............5-20 Figure 5-9 Market Preferences for Mid-Size HEV 60 Versus a Conventional Vehicle.............5-21 Figure B-1 Mileage Weighted Probability and Utility Factor Versus all Electric Range
(derived from 1995 NPTS)............................................................................................... B-4
Figure C-1 Typical Breakdown of Vehicle Direct and Indirect Costs ........................................C-6 Figure C-2 Engine Support System Cost Curves ....................................................................C-9 Figure C-3 Transmission and Gear Drive Cost Curves..........................................................C-10 Figure C-4 High-Voltage Inverter and Power Electronics Cost Curves ..................................C-11 Figure C-5 Permanent Magnet Motor/Generator Cost Curves...............................................C-11 Figure D-1 Constant Market Potential Versus HEV Price ......................................................D-43 Figure D-2 HEV Market Potential at Constant Price ..............................................................D-43
xvi

LIST OF TABLES
Table 2-1 Acceleration Results for the Mid-Size Car ............................................................... 2-2 Table 2-2 Power Train Specification Results........................................................................... 2-3 Table 2-3 Summary of the Base and ANL Methods ...............................................................2-10 Table 2-4 Customer Preference for HEV Benefits .................................................................2-17 Table 2-5 Incentives and Tax Credits Applicable to HEVs.........................................................2-19 Table 3-1 Several Different Names for HEVs with or without Plug-in Capability ...................... 3-3 Table 3-2 Mid-Size HEV Design Parameters .......................................................................... 3-4 Table 3-3 Mid-Size HEV Performance Targets (Worst Case for HEV 20 and HEV 60)........... 3-5 Table 3-4 Parallel HEV Component Technologies and Model Baseline Values....................... 3-9 Table 3-5 Driving Cycles Considered in ADVISOR Simulations .............................................3-12 Table 3-6 Example of Mileage Weighted Probabilities for HEV 20 .........................................3-13 Table 3-7 All-Electric usage Probabilities Comparison Derived from 1995 NPTS
Assuming Nightly Charging ............................................................................................3-13 Table 3-8 Charging Frequency Versus All Electric Operation for an HEV 60..........................3-14 Table 3-9 Engine, Motor, and Battery Power and Energy Simulation Results for Mid-Size
Vehicles..........................................................................................................................3-21 Table 3-10 Component Mass and Total Mass Results for Mid-Size Vehicles .........................3-24 Table 3-11 Predicted Vehicle Acceleration (seconds) ............................................................3-25 Table 3-12 Predicted Sustained Top Speed (mph).................................................................3-26 Table 3-13 Fuel Economy Results for Mid-Size Vehicles .......................................................3-28 Table 3-14 Engine, Motor, and Battery Power and Energy Results for Mid-Size Vehicles
with Reduced Mass, Improved Aerodynamics, and Reduced Rolling Resistance...........3-29 Table 3-15 Fuel Economy Results for Mid-Size Vehicles with Reduced Mass, Improved
Aerodynamics and Reduced Rolling Resistance ............................................................3-30 Table 3-16 Average Real World Lifetime Tailpipe Emission Factors [7]..................................3-35 Table 3-17 Power Generation Emission and Efficiency Assumptions.....................................3-38 Table 3-18 Power Pant Emission Rates (g/kWh)....................................................................3-38 Table 3-19 NMOG Emissions from Gasoline Production and Distribution (g/gal) ...................3-39 Table 3-20 Fuel-Cycle Emission Rates used for Fuel-Cycle Emissions for HEVs Driven
in the U.S. ......................................................................................................................3-39 Table 3-21 Emission Reductions for HEVs.............................................................................3-40 Table 4-1 Engine Specifications and System Costs for the Mid-Size Vehicle .......................... 4-4 Table 4-2 Electric Traction System Costs for the Mid-Size Vehicle ......................................... 4-7
xvii

Table 4-3 Accessory Costs for the Mid-Size Vehicle ............................................................... 4-7 Table 4-4 Energy Storage System Costs for the Mid-Size Vehicle .......................................... 4-9 Table 4-5 Charger Component Costs.....................................................................................4-10 Table 4-6 Charging Time for Various Circuit Voltage and Amperage Levels ..........................4-11 Table 4-7 Development Costs per Vehicle (Base Method only)..............................................4-13 Table 4-8 Driving Schedules ..................................................................................................4-14 Table 4-9 All-Electric Operation for Charging every Day ........................................................4-14 Table 4-10 Scheduled Maintenance Items .............................................................................4-16 Table 4-11 Component Costs for the Base Case Vehicles.....................................................4-21 Table 5-1 Distribution of Participants in Focus Groups............................................................ 5-2 Table 5-2 Vehicle Concepts for Full-Profile Questions ............................................................ 5-9 Table 5-3 Concepts to Test Inertia or Resistance to New Technologies.................................. 5-9 Table 5-4 Validation Results for Concepts .............................................................................5-10 Table 5-5 Base Case for Mid-Size Conventional and HEV Configurations .............................5-12 Table 5-6 Ranking of HEV Benefits and Other Factors with High to Strong Influence for
Mid-Size Vehicle Owners ...............................................................................................5-24 Table 5-7 Gasoline Station Versus Plugging-in Question Result for Mid-Size Vehicle
Owners...........................................................................................................................5-25 Table 5-8 Favorite on-going Incentives for Mid-Size Vehicle Owners.....................................5-25 Table 6-1 Federal and State Incentives for HEVs.................................................................... 6-4 Table 6-2 Effect of Existing HEV Incentives on Stakeholders.................................................. 6-6 Table 6-3 Proposed Federal Policies as of November 2000 Affecting HEVs ..........................6-11 Table 6-4 HEV Marketing/Public Outreach Challenges and Strategies ..................................6-17 Table A-1 Results for Base Case ............................................................................................ A-2 Table A-2 Fuel-Cycle Energy and Emission Results for Base Case for the Average
Driving Schedule and Charging Nightly ........................................................................... A-3 Table A-3 Component Retail Price Equivalent Average for Base and ANL Methods ............... A-4 Table A-4 Vehicle RPEs and Battery Replacement Costsa for Base and ANL Methods........... A-4 Table A-5 NiMH Battery Module Costs to OEM....................................................................... A-4 Table A-6 Fuel Costs per Mile for Base Case for the Average Driving Schedule and
Charging Nightly.............................................................................................................. A-5 Table A-7 Market Preference Versus Vehicle Price Scenario for All Mid-Size Vehicle
Segment of Customer Surveya......................................................................................... A-5
Table B-1 Summary of Results for Base Case ........................................................................ B-2 Table B-2 Summary of Results for Low-Drag, Reduced Mass Case ....................................... B-3 Table B-3 Mileage Weighted Probability Fuel Economies for the Base Case .......................... B-4 Table B-4 Mileage Weighted Probability Fuel Economies for the Low-Drag, Reduced
Mass Case ...................................................................................................................... B-5 Table B-5 Fuel-cycle Emission Results for Base Case for the Average Driving Schedule
and Charging Nightly....................................................................................................... B-9
xviii

Table B-6 Fuel-cycle Emission Results for Base Case for the Average Driving Schedule and Never Charging ...................................................................................................... B-10
Table B-7 Fuel-cycle Emission Results for Base Case for the Low Commute Driving Schedule and Charging Nightly ..................................................................................... B-11
Table B-8 Fuel-cycle Emission Results for Base Case for the Mid Commute Driving Schedule and Charging Nightly ..................................................................................... B-12
Table B-9 Fuel-cycle Emission Results for Base Case for the High Commute Driving Schedule and Charging Nightly ..................................................................................... B-13
Table B-10 Fuel-cycle Emission Results for Low-Drag, Reduced Mass Case for the Average Driving Schedule and Charging Nightly ........................................................... B-14
Table C-1 Component Cost Formulas.....................................................................................C-1 Table C-2 Component Costs for the Base Case Vehicles .......................................................C-2 Table C-3 Component Costs for Low-Drag, Reduced-Mass Vehicles .....................................C-3 Table C-4 Base Method RPE for Base Case Mid-Size Car .....................................................C-4 Table C-5 ANL Method RPE for Base Case Mid-Size Car.......................................................C-4 Table C-6 Base Method RPE for Reduced-Mass, Low-Drag Mid-Size Car..............................C-4 Table C-7 ANL Method RPE for Reduced-Mass, Low Drag Mid-Size Car ...............................C-4 Table C-8 Functions Used for Estimating HEV Component Costs...........................................C-8 Table C-9 Fuel Costs for Base Case Mid-Size Car for Average Driving Cycle and Nightly
Charging........................................................................................................................C-12 Table C-10 Fuel Costs for Base Case Mid-Size Car for Low Commute Driving Cycle and
Nightly Charging............................................................................................................C-13 Table C-11Fuel Costs for Base Case Mid-Size Car for Mid Commute Driving Cycle and
Nightly Charging............................................................................................................C-14 Table C-12 Fuel Costs for Base Case Mid-Size Car for High Commute Driving Cycle and
Nightly Charging............................................................................................................C-15 Table C-13 Fuel Costs for Base Case Mid-Size Car for Average Driving Cycle and Never
Charging........................................................................................................................C-16 Table C-14 Fuel Costs for Low-Drag, Reduced Mass Mid-Size Car for Average Driving
Cycle and Nightly Charging ...........................................................................................C-17 Table C-15 Scheduled Maintenance Costs for Base Case Mid-Size Car using Average
Driving Schedule and Nightly Charginga ........................................................................C-18 Table C-16 Scheduled Maintenance Costs for Base Case Mid-Size Car using Low-
Commute Driving Schedule and Nightly Charginga ........................................................C-19 Table C-17 Scheduled Maintenance Costs for Base Case Mid-Size Car using Mid-
Commute Driving Schedule and Nightly Charginga ........................................................C-20 Table C-18 Scheduled Maintenance Costs for Base Case Mid-Size Car using High-
Commute Driving Schedule and Nightly Charginga ........................................................C-21 Table C-19 Scheduled Maintenance Costs for Base Case Mid-Size Car using Average
Driving Schedule and Never Charginga..........................................................................C-22 Table C-20 Scheduled Maintenance Costs for Low-Drag, Reduced Mass Mid-Size Car
using Average Driving Schedule and Nightly Charginga.................................................C-23
xix

Table C-21 Petroleum Displacement for Base Case Mid-Size Car for Average Driving Cycle and Nightly Charging ...........................................................................................C-24
Table C-22 Petroleum Displacement for Low-Drag, Reduced Mass Mid-Size Car for Average Driving Cycle and Nightly Charging .................................................................C-25
xx

EXECUTIVE SUMMARY
Expectations of substantially lower automobile fuel consumption and exhaust emissions have motivated interest in, and technology advancement of, hybrid electric vehicles (HEVs) in the U.S. and elsewhere for a number of years. The introductions of the Prius by Toyota and the Insight by Honda signal that major automakers see a potential for HEVs as a competitive new automotive product. These developments raise the question of which type (or types) of HEVs will offer the best combination of environmental and efficiency benefits while meeting the driving needs and economic constraints of automobile owners.
Motivated by a common need for answers, individuals from key environmental regulating agencies, DOE and its National Laboratories, major automobile manufactures, and EPRI including several of its member electric utilities, formed the Hybrid Electric Vehicle Working Group (WG) to examine this question. Since 1999, WG members have been collaborating to systematically compare different HEV types with each other and with comparable conventional vehicles (CVs). The comparisons addressed all major vehicle characteristics of interest to these stakeholders: Performance and driveability; efficiency in the use of gasoline and (where applicable) grid electricity; emissions of air pollutants and carbon dioxide, the major greenhouse gas; vehicle first and operating costs; and the likely vehicle preferences of the prospective owners of future HEVs compared to their counterpart CVs. The WG also commissioned and discussed a preliminary examination of the issues and opportunities associated with the introduction of HEVs as a major new automotive product.
With extensive support from the WG members’ organizations, expert contractors, and several consultants, the WG carried out its analyses and comparisons through four major study tasks: �� Modeling of selected HEV configurations to approximate closely the main performance
characteristics of counterpart CVs and to estimate vehicle efficiency and emissions characteristics for representative driving cycles.
�� Assessment of key cost factors, including capital, energy (motor fuel and electricity), maintenance and infrastructure, for comparisons of vehicle purchase (first) and operating costs.
�� Assessment of prospective owner/user acceptance of HEVs in terms of performance and other key driving characteristics, vehicle first and operating costs factors, infrastructure implications, and the anticipated special features and societal benefits of HEVs.
�� A preliminary assessment of likely commercialization issues associated with the introduction of user-acceptable HEV types, and identification of currently applicable and prospective incentives available to key stakeholders (including owners) to overcome barriers to the introduction of HEVs.
xxi
Executive Summary
This report summarizes the approaches, findings, and conclusions for mid-size conventional and hybrid vehicles; the results for two other important platforms, sports utility vehicles and compact cars, will be summarized in a follow-on report. To put the study’s findings and conclusions in perspective, the following assumptions made by the WG are noted:
�� A year 2010 horizon was assumed for commercial availability and cost of improved HEV component technologies, especially for those currently under active development for which significant performance gains and/or cost reductions from current levels are predicted.
�� A nominal vehicle life of 100,000 miles or 10 years was assumed for cost comparisons, consistent with past studies and targets of major government-funded advanced-technology vehicle component development programs. However, the HEV life cycle cost impacts of longer vehicle life assumptions (for example, 150,000 miles and/or 15 years) were examined as well.
�� Production levels of 100,000 units per year were assumed for cost comparisons. �� All costs were assumed or calculated in year 2000 dollars. �� The HEVs studied and their counterpart conventional vehicle had gasoline-fueled engines
which met the Super Low Emission Vehicle (SULEV) emission standard in 2010.
The main findings and conclusions from the four study tasks for mid-size conventional and hybrid vehicles were the following: �� Engine/battery hybrid vehicles, including those without electric range capability (HEV 0), as
well as plug-in hybrid electric vehicles with various all-electric ranges (AER) [i.e., 20 miles AER (HEV 20) and 60 miles AER (HEV 60)], can be designed on a mid-size vehicle platform to have key performance parameters comparable to, and operating characteristics familiar to, customers of current conventional vehicles.
�� These HEV designs offer major efficiency improvements and reductions in the consumption of petroleum-based fuels, as well as substantial reductions in the emissions of air pollution precursors (nitrogen oxides and reactive organic gases) and of carbon dioxide.
�� All of these efficiency and environmental benefits increase with HEV electric range capability if that capability is fully utilized. For example, while a HEV 0 can reduce smog precursor emissions by up to 15%1 and petroleum consumption and CO2 emissions by 25% in representative driving, a HEV 60 fully charged every night can reduce emissions, energy use and CO2 emissions by 50% and petroleum consumption by over 75%. Specifically, simulations show that the petroleum consumption of an HEV 60 can be less than that of the PNGV diesel engine-battery HEV 0 concept vehicles and attain the equivalent of 80 mpg without resorting to expensive lightweight construction or extreme body aerodynamics.
�� All of HEVs designed and analyzed in this study will cost more than the corresponding conventional vehicle, even in mass production. Estimated increments over the CV retail price equivalent (RPE) are from $2,500 to $4,000 for an HEV 0, from $4000 to $6000 for an HEV 20, and from $7400 to $10,000 for an HEV 60. (The RPE is the cost of a vehicle’s components and assembly, fully loaded with all applicable overheads, development and warranty costs, and profit margins, but does not include special manufacturer-proprietary
1 Smog precursor emission reductions for the HEV 0 would be less in the Greater Metropolitan Los Angeles area because emissions associated with gasoline production are capped by local regulations. The effect of local caps is significantly less pronounced for plug-in hybrids that utilize their all-electric range.
xxii
Executive Summary
pricing considerations. The ranges in these increments reflect the two methods used by the WG to estimate RPEs. Actual uncertainties are almost certainly larger because of the uncertainties in the costs of key components that are not now available commercially in volume quantities.)
�� HEVs will have lower costs of energy (gasoline plus, where applicable, electricity) and maintenance, with mileage-related operating cost savings increasing as electric range capability and its utilization increase. Although substantial, it is uncertain whether these cost savings are sufficient to offset the life cycle cost impact of higher vehicle costs. If the battery must be replaced over the life of the vehicle (likely for the HEV 20 in this study if it is used to the full extent of its electric range capability), much of the operating cost advantage is lost. Accordingly, achievement of the 10-year/100,000 vehicle miles or even longer battery life represents the largest cost uncertainty and most important technical target, especially for plug-in HEVs with their larger, more expensive and harder-working batteries.
�� Some design issues still need to be resolved. These include use of a single motor, which could produce some driveability issues, placement of large battery packs in the vehicle, limited battery reserve capacity under some control strategies, selection of the best battery/engine control strategy, cabin heating, battery cooling, and battery life.
�� The Customer Preference study indicates definite market potential for all HEVs. That potential is large if cost equivalence with conventional vehicles could be achieved because most of the survey participants valued the efficiency, environmental and convenience attributes especially of the plug-in HEVs. The results for the different vehicle price assumptions (Low, Base, ANL, and High) in the study show that market potential is sensitive to price, particularly for the HEV 60. For the Base and ANL price scenarios, 35% to 46% of the respondents who drive a mid-size vehicle would choose an HEV 0 over a conventional vehicle, 35% to 47% would choose an HEV 20 over a conventional vehicle, and 17% to 33% would choose an HEV 60 over a conventional vehicle (when each is compared to a comparable CV).2
�� An important finding was that the majority of the study participants preferred charging (on their own premises) a vehicle with plug-in capability to fueling the vehicle at a gasoline station; only a small minority preferred fueling at gasoline stations. However, when the costs and benefits of plugging in an HEV 20 or HEV 60 each night is explained, preference for plugging in varies with price and other key attributes. The study also showed that a large majority of the survey population had ready access to the 120V AC power that will be sufficient for overnight charging of mid-size plug-in HEV batteries. Together, these findings appear to significantly reduce concerns about availability and cost of the charging infrastructure.
�� It is not clear why so many people prefer mid-size HEVs over their CV counterparts. However, ten HEV benefits have a high to strong influence on the purchase decision for those who prefer HEVs. This infers more than fuel cost savings could be marketed.
2 It should be noted, however, that “stated preference” studies involving choices the respondents have never made before always tend to have some bias in favor of the “new” product being studied. It is well known in the automobile industry, for example, that customers do not always value operating cost reductions that a given type of vehicle may offer in the initial purchase decision. It addition it is not likely that HEVs will be offered in all market segments or vehicle models in the near term. Thus customer preference might be less than stated above.
xxiii

Executive Summary
�� The Toyota Prius and Honda Insight are the first commercial hybrid vehicles (both HEV 0s, although technically quite different). They are available to customers in Japan, the United States and Europe because of the willingness of Toyota and Honda to subsidize the introduction of these promising new automotive products. With the possible exception of the batteries, plug-in HEVs require only evolutionary engineering advances over HEV 0 technology to meet technical requirements. However, there are no major automaker initiatives to develop and introduce plug-in HEVs, presumably because of battery technology readiness and vehicle cost concerns. Thus, there is as yet an unclear commercialization path to realize the substantial environmental, efficiency and energy security benefits of plug-in HEVs.
�� Tax credits and other incentives could offset much or most of the first and life cycle cost difference between HEVs and CVs that remain after allowing for the lower energy and maintenance costs of HEVs. Currently, most incentives do not increase with the all electric range of HEVs, even though there are larger environmental and energy security benefits associated with electric (battery-only) operation.
The WG concluded from the deliberation of its findings that there is a need for further study of the factors most critical to the future benefits, competitiveness and market prospects, provision of incentives, and investments in development and commercialization of HEVs. This is especially true for plug-in HEVs with their basic attractiveness to consumers and potential for superior societal benefits. These factors and the associated study tasks are currently being defined, based in good part on the insights gathered in the study reported here.
xxiv

1 INTRODUCTION
1.1 Background
HEVs are seen by some researchers as a very promising near-term technology for improving fuel economy and reducing emissions. Proponents also argue that HEVs can provide improved performance for the customer and, in contrast to other advanced-technology vehicles, require no extensive new infrastructure. With many of the advantages but without the range limitation of electric vehicles, HEVs could have broad customer appeal.
HEVs, however, come in many different configurations, and even HEV proponents disagree among themselves, which of these is “best.” This question motivated the Hybrid Electric Vehicle Working Group (WG), a cooperative effort of HEV stakeholders, to study the prospective efficiencies, emissions, costs, and customer acceptance of different types of HEVs, for a systematic comparison of HEVs with each other and with a conventional vehicle (CV) of similar design and performance. This report summarizes the study approach and key findings of the WG.
The study grew out of the discussions of an informal working group that in 1999 brought together knowledgeable individuals from the utility and automotive industries, regulatory agencies and consultants, and the Department of Energy. The initial working group set itself the objectives to establish what was known about hybrid vehicle characteristics and impacts based on credible sources of information; identify gaps in existing information, and define the research needed to fully characterize the different types of HEVs and compare their prospective benefits and impacts.
The working group also decided to serve as an initial forum for discussion of the rather diverse views and interests of the stakeholder members in the HEV area. It was envisioned that this group would be able to identify possible strategies and alliances for development, commercialization, and infrastructure support of hybrid vehicle propulsion systems and vehicle options. Finally, the expectation was that the work of the group would lead to increased public and private understanding and, if appropriate, support of all aspects of hybrid electric vehicle system development.
The first output of the WG’s activities was an informal report, produced with the assistance of ARCADIS (now part of Arthur D. Little), titled Assessment of Current Knowledge of Hybrid Vehicle Characteristics and Impacts, that summarized the results of the survey of existing studies. Although valuable in collecting data and other information on HEVs, the information proved inadequate for a systematic comparison of different types of HEVs. In particular, it was left unclear how the efficiencies and emissions of HEVs deriving part of their propulsion energy from electricity supplies compare to those of HEVs that do not plug in; whether consumers
1-1

Introduction
would save sufficient operating cost from plugging in to pay for additional battery cost; and whether customers would see the plug-in feature as a disadvantage or as an advantage by eliminating many or most trips to gasoline stations. Each member had different interests in wanting to learn more about the different types of HEVs.
From the survey results and deliberations of the WG, a conceptual framework (see Figure1-1) emerged for the needed systematic analysis of HEV architectures, quantification of their environmental and efficiency advantages, estimation of their likely future costs, and assessment of HEV prospects for widespread acceptance by customers. To implement the study framework, the WG defined and developed specific work statements for the following four tasks:
�� Modeling of representative HEV types, to ascertain the vehicles’ potential for competitive performance, and to determine their emissions and efficiency characteristics for the vehicles themselves as well as for their fuel/energy supply infrastructures over driving patterns/cycles of primary interest.
�� Estimation of key HEV component and vehicle costs and life cycle costs for comparison of HEVs with each other and with a baseline conventional internal combustion engine (ICE) vehicle.
�� Assessment of prospects for customer acceptance of HEVs by prospective owners and users, based upon assumptions about the vehicles’ performance and other key driving characteristics, costs, and infrastructure availability.
�� Identification and analysis of likely commercialization issues for the introduction and broad acceptance of potentially beneficial and user-acceptable HEV types, and identification of policy incentives and strategies to mitigate these issues. It should be noted, however, that the WG did not intend to, and has not, taken any position on the merits of particular government regulations, programs or policies related to HEVs.
Figure 1-1 HEV Comparison Study Task Structure
1-2
Introduction
Project teams were established to conduct the study tasks between March 2000 and March 2001.
The WG agreed to restrict its analyses to HEVs with specified component and vehicle technical and costs characteristics that some researchers believed would have reasonable prospects to be or become available in the coming decade. This allowed the study to focus on technological advances anticipated in the literature based upon the assumption that public awareness and broader acceptance of these technologies would develop in that period.
1.2 Study Organization
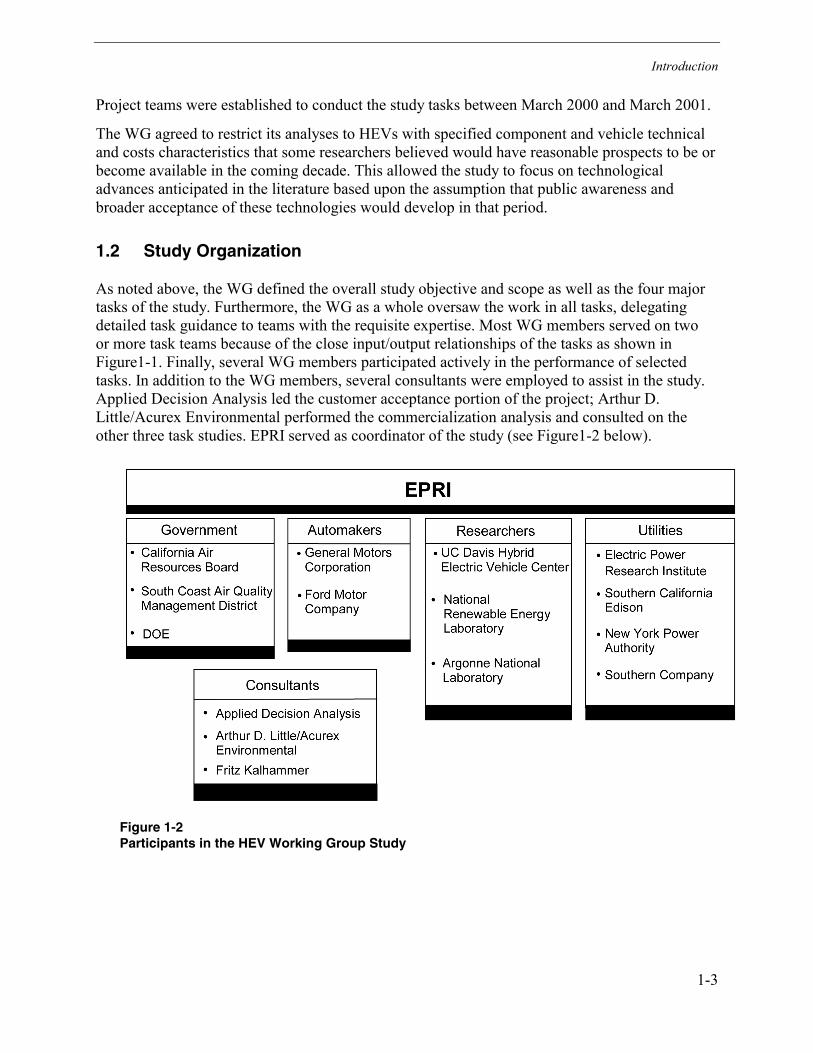
As noted above, the WG defined the overall study objective and scope as well as the four major tasks of the study. Furthermore, the WG as a whole oversaw the work in all tasks, delegating detailed task guidance to teams with the requisite expertise. Most WG members served on two or more task teams because of the close input/output relationships of the tasks as shown in Figure1-1. Finally, several WG members participated actively in the performance of selected tasks. In addition to the WG members, several consultants were employed to assist in the study. Applied Decision Analysis led the customer acceptance portion of the project; Arthur D. Little/Acurex Environmental performed the commercialization analysis and consulted on the other three task studies. EPRI served as coordinator of the study (see Figure1-2 below).
Figure 1-2 Participants in the HEV Working Group Study
1-3

Introduction
1.3 Road Map to Report
The Executive Summary, precedes this introduction. Section 2 presents summaries and conclusions of this study for the mid-size vehicle. Section 3 presents HEV performance, efficiency, and emissions. Section 4 details vehicle first and operating costs. Section 5 discusses consumer preference and market potential information for HEVs. Section 6 explains commercialization issues and opportunities for HEVs. References and a Glossary of Terms follow Section 6. Appendix A contains data that support the charts and tables in Section 2. Appendix B contains data and additional information that supports the work in Section 3. Appendix C contains data and additional information that supports the work in Section 4. Appendix D contains additional information on customer preference discussed in Section 5.
1-4

2 MID-SIZE CAR SUMMARY AND CONCLUSIONS
2.1 Introduction
This section summarizes the study’s analysis methodology and results for the mid-size vehicle platform; other important vehicle platforms (compact cars and sports utility vehicles) will be documented in a separate report. Further details on methodology and additional results can be found in Sections 3 through 6. Data supporting the charts and tables in this section can be found in Appendix A.
2.2 Vehicle Designs
Initially series hybrid configurations were considered, but quickly rejected because of their higher cost and lower efficiency. Thus, only parallel hybrid configurations were considered in this study. In a parallel HEV, the combustion engine and the electric motor-battery combination can provide power to the drive axle(s) in parallel. HEVs may or may not have plug-in capability, that is, the ability to charge the batteries from a source of electric power such as the power grid. The study examined and compared four vehicle designs:
�� A conventional vehicle (CV) with an internal-combustion engine (ICE) that served as baseline for the comparisons of vehicle attributes
�� A parallel hybrid with a small battery for power assist and regenerative braking but no plug-in capability and no all-electric range (HEV 0)
�� A parallel hybrid that can operate like an HEV 0 but also has plug-in capability and a battery of sufficient capacity to provide about 20 miles of all-electric range (HEV 20)
�� A parallel hybrid that can operate like an HEV 0 but also has plug-in capability and a battery of sufficient capacity to provide about 60 miles of all-electric range (HEV 60)
2.3 Vehicle Performance
The guiding principle in establishing the key performance parameters for the hybrid vehicles was that all HEVs had to be based on a conventional vehicle body and closely approximate the main performance characteristics of the CV. However, in the iterative HEV design process that was required to achieve this objective, limited trade-offs between performance and cost were permitted where such trade-offs reduced HEV costs significantly without impairing performance characteristics (such acceleration from a stop or when passing) to which vehicle owners/operators are likely to be sensitive.
2-1

Mid-Size Car Summary and Conclusions
2.3.1 Design Methodology and Performance
HEV and CV component and vehicle characteristics were modeled using the ADVISOR (ADvanced VehIcle SimulatOR) computer program developed by the National Renewable Energy Laboratory (NREL) with support from Department of Energy (DOE). Each HEV was conceptually designed by the WG as part of an iterative process to meet or exceed the performance of the baseline CV in several performance categories, including various acceleration, top speed, gradeability, minimum towing capability, and minimum range targets. In addition, plug-in HEVs were asked to meet these performance targets with a battery discharged down to nearly 20% state of charge (SOC), the lowest SOC permitted in the interest of good battery cycle life. In a few cases, HEV performance parameters were relaxed somewhat if matching a specific CV parameter would have increased the cost of the HEV design greatly with only marginal useful gains for the vehicle owner/operator. (More details on these trade-offs are given in Section 3):
�� Sustained Top Speed—The target for all HEVs was established at 90 mph, while a typical mid-size CV top speed was estimated to be approximately 120 mph. (The final HEV 0 design actually could sustain 120 mph, the HEV 20 could sustain 98 mph, the HEV 60 could sustain 97 mph and maintain 120 mph for about 2 minutes even with a low battery.)
�� Gradeability—The HEV gradeability targets were 7.2% at 50 mph for 15 minutes and 7.2% at 30 mph for 30 minutes, while a typical mid-size CV gradeability is 7.2% at 50 mph for 30 minutes. (The HEV target is equivalent to climbing one of the longest and toughest grades in the world, the road to the top of Pike’s Peak in Colorado, at 50 mph. All HEVs could also maintain freeway speeds on maximum Interstate Highway grades.)
�� Passing Performance and Standing Acceleration—The target time to accelerate from 50 to 70 mph was increased from 4.8 seconds to 5.1 seconds while the 0-60 mph acceleration target was lowered from 11 seconds to 9.5 seconds, well within the 8 to 12 second range of 0-60 mph acceleration times of representative mid-size CVs. As shown in Table 2-1, HEVs exceed CV performance in 3 categories, with the CV slightly exceeding HEV performance in the 50-70 mph passing time category.
�� Gasoline Range—All vehicles were designed to travel 350 miles using gasoline in the charge sustaining mode, but the HEVs’ gasoline tank needed to have only about two-thirds of the CV’s capacity. Table 2-1 Acceleration Results for the Mid-Size Car
Vehicle Type CV HEV 0 HEV 20 HEV 60
0 to 30 mph, seconds 3.5 3.1 3.0 3.0
0 to 60 mph, seconds 9.3 8.7 8.9 8.9
40 to 60 mph, seconds 4.6 4.2 4.3 4.3
50 to 70 mph, seconds 4.5 5.2 5.2 5.2
2-2

Mid-Size Car Summary and Conclusions
�� Trailer Towing—All vehicles met the requirement to tow a 1,000 kg trailer.
�� HEV Engine Stop/Starts—To minimize driveability issues, all HEVs were limited to 30 engine stop/starts on the FUDS3 driving cycle by adjusting their control strategy accordingly. (This strategy reduced fuel economy by about 10% relative to the maximum value that required 80 engine stop/ starts per drive cycle).
�� High Speed Driving (HEV 20 and HEV 60)—At a low battery SOC, both plug-in HEVs exceed the modeling target to complete the federal test cycle for aggressive and higher speed (65-80 mph) driving (US061) twice in a row. All HEVs can do this indefinitely at low SOC, substantially exceeding the original expectations. In fact, there is enough battery capacity for the HEV 60 to complete this rather stringent test cycle for 40 miles using only the battery. Even the HEV 20 was able to complete the 16-mile US06 cycle operating almost entirely (98%) in all electric (battery-only) mode.
Results for the CV and HEV designs are summarized in Table 2-2. Note that despite addition of a battery and an electric drive train, the HEV 0 and HEV 20 are lighter than the CV due to replacement of the V-6 engine with a smaller L-4 or L-3 engine.
Table 2-2 Power Train Specification Results
Vehicle CV HEV 0 HEV 20 HEV 60
Engine Peak Power, kW 127 67 61 38
Motor Rated Power, kW — 44 51 75
Battery Rated Capacity, kWh — 2.9 5.9 17.9
Vehicle Mass, kg 1,682 1,618 1,664 1,782
2.3.2 Design Issues
A number of design issues were identified in the efforts to model HEV performance. While there are probably solutions to each of them, they need further analysis. Section 4.6 includes a preliminary discussion of the following and other design issues that should be examined for successful commercialization of HEVs.
�� Designs which only Include a Single Motor (versus two motor designs). A single motor solution may produce unacceptable shift quality and unmanageable accessory drive and engine starting.
�� Battery Pack Placement/Location in the hybrid vehicles are a concern especially with larger battery packs such as in the HEV 60.
�� “Turtle” Light (Limited Battery Reserve Capacity) could be a challenge for plug-in hybrids depending on which control strategy is selected.
3 See Section 3.3.1.2 for driving cycle definitions.
2-3

Mid-Size Car Summary and Conclusions
�� Cabin Heating. It is assumed in this study that the engine would provide the heat for the cabin, but fuel economy would be sacrificed to perform cabin heating. Other forms of heat could be used such as Positive Thermal Coefficient (PTC) heating element at a cost.
�� Battery Cooling. Electric losses in the battery during charging and discharging generate heat that must be removed by flow of air or liquid coolant to keep the battery temperatures under control.
�� Battery Life and Battery Replacement. Under some driving scenarios, plug-in hybrid electric vehicles may require that the battery be replaced during the nominal lifetime of the vehicle. If the vehicle is driven over 100,000 miles or operated longer than 10 years, all hybrids might need a battery replacement. However, larger battery packs tend to accumulate more miles before replacement is needed.
�� Control Strategies. There are many control strategies than can be used with plug-in HEVs that can optimize fuel economy, emissions, and/or battery life. These should be examined in detail to determine the best possible strategy for plug-in HEVs.
2.4 Vehicle Efficiency (Fuel Economy)
The hybridization of combustion engines with electrical energy storage devices into hybrid drive trains can reduce gasoline fuel consumption in two ways. All types of HEVs can make more efficient use of gasoline because hybridization permits not only the use of smaller engines operated more efficiently but also partial recovery of vehicle kinetic energy when the vehicle is decelerating or going down a hill. In addition, plug-in HEVs permit substitution of electricity as propulsion “fuel” for part of the gasoline.
Fuel economy can be defined in several ways, as shown in Figure 2-1. The gasoline only fuel economy applies to the CV and HEV 0 in all driving modes. It also applies for the HEV 20 and the HEV 60 whenever these plug-in hybrids are driven in the charge-sustaining mode, that is, with no net change in the energy content of the battery.
Electric-only fuel economy, expressed normally as miles per unit of electric energy is converted in this report to miles per (energy) equivalent gasoline gallon (mpeg) whenever a plug-in HEV is operating in electric-only mode; the energy equivalent calculations uses a conversion factor of 33.44 kWh per gallon of gasoline.
While plug-in hybrid electric vehicles can be operated for a given distance in electric-only mode (determined by battery capacity), trips since the battery was last charged that are longer than the HEV’s all-electric range have mixed operation, i.e. some in electric-only mode and some in charge sustaining mode. The probability of a given HEV operating all its mileage in all-electric mode is referred to here as a mileage weighted probability (MWP). The MWP gives an estimation of what portion of a plug-in HEV’s daily annual mileage will be operated in all-electric mode (see Section 3.3.1.4). The Society of Automotive Engineers (SAE) subcommittee on hybrid electric vehicles also defined an all-electric usage factor which they named a Utility Factor (UF). The UF is used by ADVISOR to determine mixed fuel economy (see Section 3.3.1.3 for a discussion of the differences between MWP and UF).
2-4

Mid-Size Car Summary and Conclusions
Figure 2-1 Fuel Economy Comparisons for the Mid-Size Car
Charging frequency also plays a part in determining the portion of annual miles that a plug-in HEV will operate in all-electric mode. The more often a plug-in hybrid is charged, the more likely it is to travel a greater percentage of its annual miles in all-electric mode. The SAE subcommittee also developed a recommended practice (J1711) that assumes the vehicle is just as likely to start a trip with the battery fully charged as with the battery at a low SOC. This provides a case between charging every night and not charging at all. Other cases might include charging twice daily (at home and at work), or charging every other day. (See Section 3.3.1.4 for the effect charging frequency has on fuel economy.) The UF weighted (charging every day) and J1711 UF weighted (just as likely to start the trip with a full charge as a low SOC) fuel economies are also shown in Figure 2-1.
As can be seen in Figure 2-1, there is a wide range of fuel economies for the plug-in HEVs depending on how the vehicles are operated. If they are charged every day and driven less than their all-electric range, fuel economies exceeding 100 mpeg can be achieved. Even when they are not charged at all, plug-in HEVs still provide a 50% improvement in fuel economy over the equivalent CV. As expected, the J1711 fuel economy for mixed gasoline and electricity-fueled driving falls between these two. MWP weighted fuel economy for the HEV 20 and HEV 60 are (not shown in Figure 2-1) are 58 and 82 miles per gasoline gallon equivalent, respectively when charging nightly.
Another metric of energy efficiency often used is based on the “total” energy used by a vehicle over its life that includes not only the propulsion “fuel” energy but all of the energy needed to produce the fuel used by a CV or HEV, for example, the energy needed to refine gasoline, and the energy needed to produce electricity. This total lifetime energy also is termed “fuel-cycle energy.” Key assumptions underlying the fuel-cycle energies shown in Figure 2-2 include the following:
2-5

Mid-Size Car Summary and Conclusions
�� Gasoline includes methyl tertiary butyl ether (MTBE), an oxygenate made from natural gas
�� Electricity used to charge plug-in HEVs is generated by combined cycle natural gas fired power plants, in the assumption that charging will be at night with electricity produced at the margin (additional electricity produced on top of the current electricity needs most likely will be produced by natural gas fired power plants; therefore, electricity production is allocated to natural gas. See more detailed fuel-cycle discussion in Sections 2.5 and 3.4.3).
�� The energy used for fuel/energy production facility construction and vehicle construction is generally less than 15% of vehicle lifetime energy use.
Figure 2-2 Full Fuel-Cycle Energy Use for the Mid-Size Car for the Average Driving Cycle and Charging Nightly
2.5 Emissions
2.5.1 Methodology
Environmental impacts of HEVs were compared with each other and the baseline CV on the basis of emissions over the full fuel-cycle (“well-to-wheels”). This analysis takes into account all emissions associated with the extraction, processing, distribution, and final use of the energy used to propel the different types of HEVs, and compares them with those of the corresponding conventional vehicle. For the CV, these include all emissions that result from extracting crude oil, processing oil into a vehicle fuel, distributing the fuel, fueling the vehicle, and lastly, the vehicle’s tailpipe and evaporative emissions during operation. For the HEV 0, the perspective is the same because this type of vehicle only uses gasoline as fuel, although substantially less due to its higher efficiency. For plug-in HEVs like the HEV 20 and HEV 60, the “well-to-wheels” analysis must also take into account the emissions produced by the power plants that provide the electricity for charging the vehicles’ batteries. As shown below, fuel-cycle emissions can add up to a significant fraction of emissions associated with vehicle operation.
2-6

Mid-Size Car Summary and Conclusions
Smog precursor (NOx + HC) and greenhouse gas (primarily CO2) emissions were examined for CVs and HEVs using the following assumptions:
�� The HEVs and CVs meet the Super Ultra Low Emission Vehicle (SULEV) standards when operating on gasoline.
�� Plug-in HEVs are charged primarily at night.
�� Less efficient power generators, older coal and fuel oil power plants cannot readily be turned on and off, so these plants are used at full load during peak demand and idled or turned off at night; they do not respond to marginal load increases.
�� Nuclear and hydroelectric power plants generally are already at capacity satisfying the base load requirement and thus not available to respond to marginal load increases.
�� By 2010, many older fossil fuel power plants will have been replaced with new combined cycle turbines that have better efficiency, reduced emissions, and can respond efficiently to load changes.
�� During off-peak periods (especially at night), marginal increases in power demand will be met by efficient combined cycle plants that can be dispatched more rapidly and economically than less efficient plants. Since charging even a substantial population of HEVs is estimated to be less than 1% of all power generated in 2010, power generated for HEV charging can be assumed to be on the generation margin and generated by high-efficiency, natural gas-fired combined cycle turbines.
�� New power plants and refineries in non-attainment areas will need to meet the very low emission standards for “best available control technology” (BACT), without their owners/operators being able to claim emission offsets, particularly in California.
�� Most oil refineries are at capacity; therefore, marginal gasoline use will most likely come from foreign oil. New refineries will be limited to BACT-level emissions, again without offsets.
For smog precursors (NOx + HC), only urban emissions are considered since they directly affect non-attainment, and it is assumed that 70% of the emissions generated by power plants and refineries are in urban areas. Because CO2 and other greenhouse gases emissions are persistent, they become globally distributed, and only total CO2 emissions need be considered. Further details on emissions analysis can be found in Section 3.4.3.
2.5.2 Results
Figure 2-3 shows totals of fuel-cycle, evaporative, and tailpipe emissions of urban smog precursors for mid-size CV and HEVs in milligrams per mile (mg/mi). It is evident that these emissions decrease with increasing degree of hybridization.
2-7

Mid-Size Car Summary and Conclusions
Figure 2-3 NOx Plus HC (Smog) “Well-to-Wheels” Emissions for the Mid-Size Car for the Average Driving Schedule and Charging Nightly
The fuel economy data assumed for this analysis are for “real world” driving as defined by the U.S.EPA, simulated by decreasing city and highway fuel economies calculated from this study’s model by 10% and 22%, respectively4. A “real world” driving schedule (daily miles, annual miles, city/highway miles) was derived from the survey data discussed in Section 2.6 and is discussed in more detail in Section 4.2.2.2.
CVs and all HEVs produce evaporative emissions from their fuel tanks and fuel systems. Meeting a zero emission standard such as that required for partial ZEV (PZEV) credits is challenging for all vehicles, but probably more so for plug-in HEVs that are operated on electric power for longer periods since the engine must be operating to ingest fuel vapor and thus purge the carbon canisters used to control evaporative emissions. Methods to reduce evaporative emissions of hybrids clearly need more study. Generally, however, smog precursor emissions are lower for all HEVs due to their improved fuel economy. Plug-in hybrids provide additional benefits because, on a gram per vehicle mile basis, emissions from electric power plants are much lower than that from the same vehicle running on gasoline.
Figure 2-4 shows CO2 emissions for the CV and HEV designs of the mid-size car. Evidently, HEVs can substantially reduce greenhouse gas emissions due to their improved fuel economy alone, and these benefits grow with increasing all-electric range and its utilization. In addition, greenhouse gas emissions from power plants on a gram per all-electric vehicle mile are much lower than greenhouse refinery emissions on a gram per gasoline vehicle mile.
4 These factors are used by the U.S. Environmental Protection Agency in their Fuel Economy Guide and in vehicle labeling to represent “real world” driving. These factors were derived for CVs and may be different for HEVs but were used for this phase of the study.
2-8

Mid-Size Car Summary and Conclusions
Figure 2-4 Greenhouse Gas Emissions (CO2) “Well-to-Wheels” for the Mid-Size Car for the Average Driving Schedule and Charging Nightly
2.6 Vehicle Retail Price Equivalent and Operating Costs
2.6.1 Vehicle Retail Price Equivalent
Many factors and considerations—including proprietary information and pricing strategies not available to the WG—enter into the determination of a manufacturer’s suggested retail price (MSRP) for a presently marketed vehicle. Thus, projecting likely MSRPs for future vehicles such as the HEVs modeled in this study would not have resulted in meaningful numbers for the vehicle cost comparisons. Instead, the WG used the vehicle “Retail Price Equivalent” (RPE) as the basis for estimating and comparing the costs of hybrids and the corresponding conventional vehicles.
For the purpose of this study, a vehicle’s RPE is defined as the sum of all component costs, marked-up with the applicable manufacturer and dealer overheads and profits, as explained in more detail below.
2.6.1.1 Methodology
Two different methodologies were used to estimate vehicle RPEs. In the first method, component costs were estimated as the cost of labor and materials for each component. In the second method, component costs were estimated to be the cost that a manufacturer would pay to build the component or, in the case of electric components (motor, controller, and battery), buy it from a supplier. The first method is a typical automobile industry standard accounting procedure
2-9

Mid-Size Car Summary and Conclusions
that was adopted as the “Base Method” by the WG; the second was developed by Argonne National Laboratory (ANL) with input from the WG. The WG inputs were not based upon proprietary information from members of the WG.
Component cost estimates were collected from a number of credible sources and checked against or supplemented by the WG’s own estimates where necessary. Generally, these estimates or extrapolations took into account technological advancements that could be foreseen or considered likely to occur by the year 2010 and that applied in mass production, for example, at production volumes of 100,000 vehicles per year. All costs are stated in year 2000 dollars.
In the Base Method, all component costs are treated as the cost of labor and materials, and manufacturer and dealer mark-ups are applied to all component costs. In addition, costs are added for vehicle development. In the ANL method, electric components (motor, controller, and battery) are assumed to be supplied by outside vendors. Their costs include not only the cost of labor and materials, but also a partial mark-up that includes some research and development costs, supplier overhead and profit, and appropriate warranties. Different mark-ups are applied to component costs depending on whether they are built by the manufacturer or supplied by a supplier. A single mark-up covers manufacturer and dealer mark-ups and development costs.
Both methods assume that batteries are one of the largest cost components and therefore a reduced mark-up is applied5. Mark-up factors for the two methods are given in Table 2-3; more detail on the two methods and component costs can be found in Section 4.
Table 2-3 Summary of the Base and ANL Methods
Item Base Method ANL Method
Component Costs
Assumes all costs are manufacturer costs for labor and materials
Same cost as Base Method, except it assumes that motor, controller and batteries already have a partial mark-up from supplier.
Manufacturer Mark-up
All component costs except battery modules are marked-up at 1.5 times component cost
All components manufactured by the vehicle manufacturer are marked-up at 2 times component costs, those purchased from an outside vendor are marked-up at 1.5 times component costs.
Battery Module Mark-up
Battery module mark-ups are fixed at $800 for the HEV 0 battery, $850 for the HEV 20 battery, and $900 for the HEV 60 battery.
Same as Base Method.
Dealer Mark-up All components carry an additional mark-up of 16.3% of manufacturer marked-up prices.
Included in manufacturer mark-up
Development costs
Development costs for 2010 component technology (amortized over 5 years of production) are added at $94 per vehicle for the CV, $440 for the HEV 0, and $464 for the HEV 20 and HEV 60.
Included in manufacturer mark-up
5 This approach was very controversial within the WG due to the concern for potential uncertain additional costs. More details are given in Section 4.2.1.3.
2-10

Mid-Size Car Summary and Conclusions
2.6.1.2 Discussion of Results
Component- and vehicle-level retail price equivalent (RPE) estimates for the mid-size car CV and HEVs are compared in Figure 2-5. For each of the vehicles, the bars represent the numerical averages of the component RPEs determined using the Base and ANL methods, respectively. Figure 2-5 makes clear that most of the cost increments between the HEV designs and the CV are due to battery pack and charger costs.
Figure 2-5 Mid-Size Car Component Retail Price Equivalent
In Figure 2-6, RPEs for the CV and hybrid vehicles are shown separately for the Base and ANL methods, respectively. Depending on the method used, compared to the CV’s RPE the HEV 0 RPE is approximately $2,500 to $4,000 higher, the HEV20 RPE approximately $4,000 to $6,000 higher, and the HEV 60 RPE is approximately $7,400 to $10,000 higher. These cost premiums for HEVs would be increased by about $420 if future year conventional vehicles are assumed to use more economical continuously variable transmissions (CVTs). Also shown in Figure 2-6 is a battery replacement cost that might be required if the vehicle is driven more than 100,000 miles as discussed in Section 2.6.2.3.6 Additional costs of $200 for an infrastructure upgrade could also be necessary for charging an HEV 60 if a 20-amp circuit is required.7
6 Battery replacement depends upon many factors. Larger batteries tend to last longer, but many factors are involved in determining battery life. See Section 2.6.2.3 for further details. 7 Some utilities use a time-of-use (TOU) meter to obtain lower electricity prices (like the $0.06/kWh estimated in this study), which adds an additional $235 for installation of such a meter. At least one utility does not use a TOU meter for the lower rates (which can be linked to ownership or miles traveled).
2-11

Mid-Size Car Summary and Conclusions
Figure 2-6 Retail Price Equivalent for the Mid-Size Car with and without Battery Replacements
Figure 2-7 NiMH Battery Module Costs to OEM Versus Battery Energy
2-12

Mid-Size Car Summary and Conclusions
Significant uncertainties exist in overall vehicle RPE because of uncertainties in future costs of mass-produced batteries that are presently produced only in limited volume. The uncertainties increase with the increasing contribution of the battery to vehicle costs as battery capacity increases from the HEV 0 to HEV 60. To put the battery costs shown in Figure 2-5 in perspective, the lowest specific cost for NiMH electric vehicle battery modules is estimated to be $225 to $250 per kWh in mass production and unlikely to decrease without major, currently unforeseen materials breakthroughs during the next decade [1]. Even less information is available publicly on HEV battery module costs, so the WG had to develop its own first-cut estimate from EV battery module costs, allowing for the generally higher specific costs of battery designs of a given chemistry as specific power increases and specific energy decreases as a result. Since in large production volume, battery costs are largely driven by material cost, they were estimated in this study by assuming that, for a given battery type and chemistry, specific costs (in $/kWh) are inversely proportional to their specific energy (kg/kWh). The battery module cost curve shown in Figure 2-7 was developed by Kalhammer for the WG and confirmed by a NiMH battery developer. (See Section 4.2.1.2.6 for more details on battery module costs.)
2.6.2 Operating Costs
2.6.2.1 Methodology
Operating costs include costs for fuel and maintenance. In this study, both cost contributions were calculated using label-adjusted fuel economies and representative driving patterns based on survey results. The annual mileage for the average driving pattern is 13,322 miles per year. Further discussion of the methodology and results can be found in Section 4.2.2.
Fuel costs were assumed to be $1.65 per gallon of gasoline and $0.06 per kWh of electricity.8 The gasoline price was the average national gasoline price at the time of the study, the kWh price as the average price of off-peak electricity currently offered by utilities (Boston, Atlanta, Phoenix, Los Angeles, and San Francisco) for charging of EVs.9
Scheduled maintenance costs were estimated from the annual distances driven with engine and battery power, respectively. Further discussion of the methodology used for estimating scheduled maintenance costs can be found in Section 4.2.2.5.
8 It should be noted that during the writing of this report, California is currently in an “energy crisis” with spot electricity prices substantially higher than those used in the calculations. While this would change the economics of plug-in HEV operating costs, the WG has assumed that this situation is short term. Specifically, it is assumed that new plants that would add another 25% of California generation capacity are scheduled to come on line in the next few years. Because gasoline prices can be volatile, they could increase as well. California gasoline prices are around $2.00 per gallon. Furthermore, fuel price sensitivity is substantially less for electricity than for gasoline because of the much higher efficiency with which electricity is used in vehicle propulsion. 9 The report assumes that in 2010, electric fueled vehicles would continue not to pay road taxes used by federal and state governments (for roads and transit) and that gasoline fueled vehicles would continue not to pay electric utilities users tax (0-12%) used by some local and state governments (for police, fire, libraries, etc).
2-13
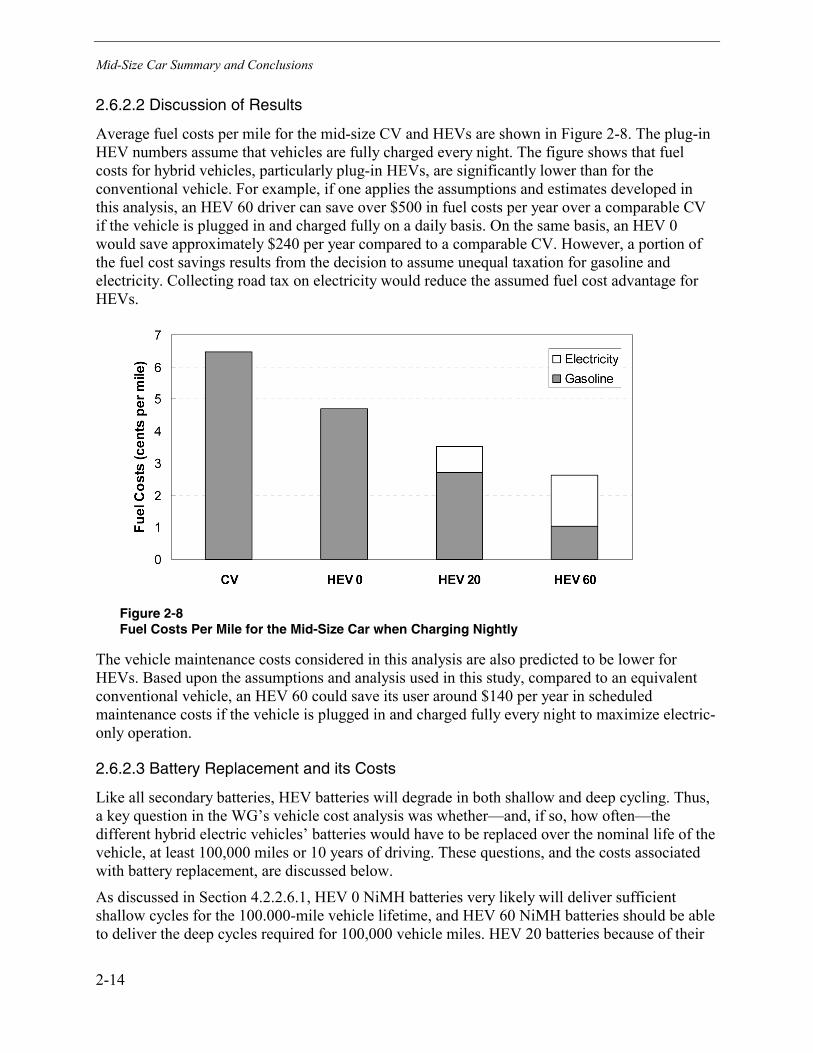
Mid-Size Car Summary and Conclusions
2.6.2.2 Discussion of Results
Average fuel costs per mile for the mid-size CV and HEVs are shown in Figure 2-8. The plug-in HEV numbers assume that vehicles are fully charged every night. The figure shows that fuel costs for hybrid vehicles, particularly plug-in HEVs, are significantly lower than for the conventional vehicle. For example, if one applies the assumptions and estimates developed in this analysis, an HEV 60 driver can save over $500 in fuel costs per year over a comparable CV if the vehicle is plugged in and charged fully on a daily basis. On the same basis, an HEV 0 would save approximately $240 per year compared to a comparable CV. However, a portion of the fuel cost savings results from the decision to assume unequal taxation for gasoline and electricity. Collecting road tax on electricity would reduce the assumed fuel cost advantage for HEVs.
Figure 2-8 Fuel Costs Per Mile for the Mid-Size Car when Charging Nightly
The vehicle maintenance costs considered in this analysis are also predicted to be lower for HEVs. Based upon the assumptions and analysis used in this study, compared to an equivalent conventional vehicle, an HEV 60 could save its user around $140 per year in scheduled maintenance costs if the vehicle is plugged in and charged fully every night to maximize electric-only operation.
2.6.2.3 Battery Replacement and its Costs
Like all secondary batteries, HEV batteries will degrade in both shallow and deep cycling. Thus, a key question in the WG’s vehicle cost analysis was whether—and, if so, how often—the different hybrid electric vehicles’ batteries would have to be replaced over the nominal life of the vehicle, at least 100,000 miles or 10 years of driving. These questions, and the costs associated with battery replacement, are discussed below.
As discussed in Section 4.2.2.6.1, HEV 0 NiMH batteries very likely will deliver sufficient shallow cycles for the 100.000-mile vehicle lifetime, and HEV 60 NiMH batteries should be able to deliver the deep cycles required for 100,000 vehicle miles. HEV 20 batteries because of their
2-14

Mid-Size Car Summary and Conclusions
smaller capacity will undergo substantially more deep cycles and, therefore, might require replacement within the 100,000-mile lifetime under conditions that maximize all-electric HEV operation. Several methods to extend HEV 20 battery are discussed in Section 5. The consumer cost of an HEV 0 battery replacement is estimated between $1,500 to $2,000 if the batteries have a salvage value (see Section 4.2.2.7.1). Battery replacement costs for an HEV 20 are estimated between $2,000 to $3,000 and those for an HEV 60 are estimated between $4,000 and $7,000.
If vehicle lifetimes were extended to 15 years or 150,000 miles, it is likely that all HEV designs will require battery replacements within this extended vehicle lifetime. However, this depends upon the vehicle control strategy and as well as many other factors. In addition, larger battery packs tend to provide more all-electric miles over their lifetimes than smaller battery packs.
After the batteries degrade to the 80% of original capacity, the emissions and fuel costs of a plug-in hybrid will slowly approach the emissions and fuel costs of an HEV 0 if the batteries are not replaced. However, unlike an EV, plug-in hybrids are still quite functional without a battery replacement with the proper control strategies. At present it is unknown when degraded battery capacity will affect performance.
2.7 Customer Preference
Customer preference for HEVs was studied using two methods. The first used focus groups to determine how potential buyers viewed HEVs. In the second, a 400-person survey was used to develop a choice based market model. These methods are described below. Further details can be found in Section 5.
2.7.1 Focus Groups
Four focus groups were conducted in Los Angeles and Orlando to determine what features of HEVs customers found most interesting and how best to explain HEV concepts. Focus groups were conducted by gathering impressions, educating the participants, and through guided discussions. Focus group participants were told to assume that HEVs had been sold for 5 or more years and that they were as safe, reliable, and had the same performance as conventional vehicles.
The focus groups indicated that, provided the basic assumptions are met, most participants preferred an HEV to a conventional vehicle if the HEV was available in the same design and at the same vehicle price. Participants thought fuel cost savings were one of the most attractive features of HEVs. Although environmental benefits, fewer trips to the gas station, and the flexibility of the dual-mode operation were influential in purchasing a vehicle, few respondents were willing to pay more for these attributes.
A large majority of the participants thought that plugging in was preferable if it was convenient, but some had issues regarding charging. Most people considered plugging in their vehicles more convenient than fueling at a gasoline station.
2.7.2 Choice Based Market Model
A computer-administered quantitative customer preference interview was taken by over 400 consumers in Boston, Atlanta, Phoenix, and Los Angeles. The first portion of the interview contained over 60 trade-off questions for nine independent attributes of HEVs, which were later
2-15

Mid-Size Car Summary and Conclusions
linked to describe the HEV 0, HEV 20, and HEV 60. Additional trade-off questions were also asked comparing HEV designs to each other and to the consumer’s conventional vehicle. The results from these questions were used to construct a choice based market mode (CBMM). This model was then used to predict market potential or preference for HEVs. The interview also included over 100 direct assessment questions to measure demographics and attitudes as well as customer views on HEV benefits, government incentives and plugging in versus going to the gasoline station. Further description of the CBMM can be found in Section 5.2. Results from the CBMM for the mid-size car are shown in Figure 2-9 for four vehicle price scenarios.10 The Base and ANL prices are those described in Section 2.6.1. The Low and High price scenarios represent possible price uncertainty in vehicle prices.11 The Low and High prices are relative to the Base price and represent incremental costs that are 50% less or 50% greater than the difference between the Base price HEV and the Base price CV. Actual prices used in this analysis can be found in Table A-7 in Appendix A.
Figure 2-9 Market Preference Versus Vehicle Price for Mid-Size HEVs
As shown in Figure 2-9, market potential is very sensitive to vehicle price, especially for the HEV 60. At the Low vehicle price, the HEV 20 and HEV 60 are preferred over the HEV 0 and even the CV. At the ANL, Base, and High prices, the HEV 0 and HEV 20 are preferred over the HEV 60.
10 The results assume a simple market (HEV 0 versus CV, HEV 20 versus CV, and HEV 60 versus CV). 11 The High price case might occur if, for example, production volumes are less than the 100,000 units per year estimated in this study, if battery costs are significantly higher, or the selling costs of HEVs exceed those of CVs. The Low price case might occur if government incentives reduce the vehicle price or if production and selling costs are not used to determine price. Also, some components costed in this analysis could be used in other product lines, so component costs could be lower than represented here. It should be noted that the “High” and “Low” prices do not necessarily bound all possible outcomes. These scenarios were not based upon proprietary input from members of the WG.
2-16

Mid-Size Car Summary and Conclusions
Fuel price also had a significant effect on market potential. If gasoline prices rose from $1.65 per gallon (baseline assumption) to $3.00 per gallon (an 82% increase), market potential for an HEV 0 would increase about 30%, an HEV 20 would increase about 35%, and an HEV 60 would increase about 65%. On the other side, if batteries need to be replaced at 5 years or 50,000 miles, market potential for the HEV 0 is reduced by about two-thirds and the HEV 20 and HEV 60 by about half. Battery replacements at 80,000 miles or 120,000 miles were not tested and should not be inferred. Further interpretation of the data shows that HEV purchase intenders are willing to pay about $3,000 more for the HEV 60 than the HEV 0, and about $1,800 more for the HEV 20 than the HEV 0.12 HEV 0 purchase intenders are also willing to pay significantly more for the HEV 0 than the CV. It is not clear why this is so. However, following results show consumers value much more than HEV fuel cost savings.
2.7.3 Direct Assessment
About 100 direct assessment questions were asked in the quantitative computer-based interview discussed in Section 2.7.2. These direct assessment questions can be used to try to determine which HEV benefits consumers might value. Table 2-4 shows the percentage of mid-size respondents that indicated the HEV benefit listed would strongly influence them to purchase an HEV. Generally, HEV preferrers, a subset of the all-respondents group, value HEV benefits more than the percentages shown in Table 2-4 for the all-respondents group. Several other benefits are discussed in Section 5.3. Another direct assessment question asked in the survey related to people’s preference for plugging-in their vehicle at home versus going to a gasoline station. 63% of mid-size vehicle respondents strongly preferred plugging in at home to going to the gasoline station. Only about 1% strongly preferred going to the gasoline station.
Table 2-4 Customer Preference for HEV Benefits
HEV Benefit Strong Influence on Purchase Decision
Fuel cost savings 89%
Reducing maintenance (cost and personal time) 87%
50% longer range 83%
Leaving every morning with a fully-charged battery 73%
Better handling: balanced weight distribution 71%
Reducing air pollution and global warming gases 66%
Better handling: lower center of gravity 66%
Quietness (at stops and acceleration) 61%
Reducing dependence of foreign oil 60%
Less vibration and fatigue (at stops and acceleration) 60%
12 When analyzed at a common 18%, 25% and 45% market potential. See Appendix D.7.
2-17

Mid-Size Car Summary and Conclusions
2.8 Commercialization Issues
A preliminary examination of commercialization issues for HEVs was conducted. Like any new automotive product with new attributes, HEV commercialization will encounter barriers but also opportunities because of their unique impacts and benefits. These barriers and opportunities exist in a number of areas, including the characteristics and readiness of new technology and the realization or perception by manufacturers of the higher costs and market risks associated with the new automotive product. Whether, policies and incentives to mitigate higher costs and risks of HEVs are warranted depends upon economic quantification of the societal environmental and petroleum reduction benefits, a task that has not been done. As well, the lack of understanding of the new product’s attributes and how they might affect prospective buyers/users must be examined. This first-cut analysis of several of these issues led to several conclusions that are discussed in more detail in Section 6 and summarized below.
2.8.1 Technology Barriers and Opportunities
HEV commercialization faces several technology-related barriers that translate into a higher cost relative to the corresponding conventional vehicle. These include the relatively high cost of the HEV 0, HEV 20 and the HEV 60 NiMH batteries that currently represent the best technology choices, limited life even of these improved batteries in the deep cycling that is associated with representative all-electric driving, and the prospect that some HEV 60 hybrids (especially those for heavier vehicles such as SUVs) may require 240V AC power supplies with the associated incremental infrastructure cost over the universally available 120V AC outlets. Although battery technology has been progressing much slower than battery manufacturers projected, further improvement in battery cycle life seems certain. Battery cost is a more difficult issue, but major efforts are being undertaken to reduce battery costs through materials breakthroughs and development of low-cost battery components and manufacturing. These and other technology-related issues, as well as opportunities for technology improvements and cost reductions, are discussed in Sections 3, 4, and 6 of this report.
Infrastructure is generally an advantage for HEVs compared to most alternative fuel vehicles. Charging most mid-size plug-in HEVs can be accomplished using a 120 V AC outlet, but HEVs can also be run on gasoline, so no major infrastructure needs to be built to effectively fuel these vehicles.
While HEVs will be burdened with technical and cost challenges not faced by CVs, plug-in HEVs offer consumers technology-based advantages beyond the efficiency increases and emission reductions that represent the major motivations for the interest in all HEVs. Battery power can be used to automatically pre-heat or cool the vehicle without starting the ICE engines, and the battery can power a series of electric appliances when if the vehicle’s engine is not being operated. In the customer preference surveys, consumers indicated a strong interest in this feature. Another possibility (not explicitly included in the customer preference study) is to use a stationary HEV as an emergency generator, for arbitrarily long periods if another vehicle is available to meet transportation needs.
2-18

Mid-Size Car Summary and Conclusions
2.8.2 Policies and Incentives
Table 2-5 summarizes federal and state policies and incentives currently in force that could be applicable to plug-in HEVs, and shows the dollar levels associated with these incentives. State policies and incentives are summarized in Section 6. In addition, in the current 107th Congress, there are bi-partisan bills that include HEV tax breaks and policies. Except for CAFE and federal infrastructure tax deductions, all of the incentives listed in Table 2-5 do not have definitive rulings on whether HEVs qualify. Generally speaking, however, high AER plug-in HEVs have the best prospects for inclusion with the highest dollar benefits because they have the largest societal benefits: the lowest emissions, highest efficiencies, lowest consumption of petroleum-based fuels, and lowest emissions of greenhouse gases.
The sale of highly efficient vehicles such as HEVs would reduce the number of less profitable, low-priced conventional vehicles that must be sold to meet the provisions of fleet average CAFE standards. Another potentially relevant policy is the California’s Zero Emission Vehicle regulatory provisions for partial ZEV credits. These measures provide benefits to automakers in avoided costs that could be passed to consumers in the form of lower vehicle prices.
Table 2-5 Incentives and Tax Credits Applicable to HEVs
Policy HEV 0 HEV 20 HEV 60 Selection Criteria
Federal Tax Credit a Likely $0 Eligibility unclear
10% of purchase price up to $4,000
“primarily powered by an electric motor”
Federal Tax Deduction b Likely $0 Up to $2,000 Up to $2,000 Strong case under dual fuel vehicle definition
Federal Tax Deduction for Infrastructure c
Not eligible EV chargers eligible
EV chargers eligible
For businesses only
Federal requirement for federal, state, and alternative fuel provider fleets to purchase AF vehicles
Likely $0 Eligibility unclear
Eligibility unclear
Strong case under dual fuel vehicle definition
Fuel economy fleet standards on automakers (CAFE) d
No bonus Eligible for 2 bonuses
Eligible for 2 bonuses
Dual fuel bonus and PEF bonus
a Can claim either tax credit or deduction. Both are expiring at end of 2004. b Toyota at a recent conference reported that the IRS is seriously considering allowing Prius
customers to receive the federal tax deduction. c $100,000 per location for EV and AFV infrastructure, expires end of 2004. d Dual fuel bonus factor (expires end of 2004) and petroleum equivalent bonus factor.
2-19

Mid-Size Car Summary and Conclusions
2.9 Conclusions Among the many conclusions that have emerged from this study, the first publicly documented, systematic comparison of CVs and HEVs—including HEVs capable of being driven practical distances with battery power only—the following stand out: �� All HEVs, including plug-in hybrid engine-battery vehicles, can be designed for a mid-size
vehicle platform in ways that meet the performance and operating characteristics customers have come to expect and are familiar with.
�� HEVs can offer major efficiency improvements as well as substantial reductions in the consumption of petroleum-based fuels and emissions of air pollution precursors (NOx and HC) and carbon dioxide over gasoline CVs. All of these benefits increase with HEV electric range capability if that capability is fully utilized.
�� While desirable reductions of up to 15% in smog-forming gases and 25% in CO2 emissions, energy use, and petroleum consumption can be expected for a properly designed HEV 0, a 50% reduction in smog precursors, CO2, and energy use, as well as a 75% reduction in petroleum consumption, is predicted for the HEV 60.13 Specifically, ADVISOR simulations show that the petroleum consumption of an HEV 60 (using gasoline/electricity) can be less than that of the PNGV diesel engine-battery HEV 0 concept vehicles and attain the equivalent of 80 mpg without resorting to costly light-weight construction or body aerodynamics.
�� HEV 0 technology is in the early commercial stage.14 Relative to mature combustion engines and state-of-the-art EV technology, HEV technology requires only evolutionary advances to meet technical requirements, with the possible exception of batteries. NiMH batteries are technologically capable, but there are uncertainties regarding their life and costs, especially in plug-in HEV service.
�� All HEVs will cost more to produce than their CV equivalent. Estimated increases in the retail price equivalent (RPE) are from $2,500 to $4,000 for an HEV 0, from $4000 to $6000 for an HEV 20, and from $7400 to $10,000 for an HEV 60. Battery costs are the primary reason for this incremental cost. The cost premium for HEVs will be higher by about $420 if future year conventional vehicles use more economical continuously variable transmissions (CVTs).
�� Total energy (motor fuel and electricity) and maintenance costs of plug-in HEVs will be less than that for CVs, partially offsetting the impact of battery costs. The magnitude of the energy cost savings for HEVs depends on whether charging is done during off-peak periods and whether “time-of-use” meters are needed. It also depends on whether electricity continues to be exempt from road tax and gasoline from utility taxes. Incentives to buyers of HEVs could provide additional cost offsets, but more analysis is necessary to confidently quantify and compare life cycle costs.
�� Under the vehicle design and cost assumptions used in the study, the Customer Preference Model indicates definite market potential for all HEVs, especially if cost-equivalence with conventional vehicles can be achieved.
13 When compared to a SULEV conventional vehicle. 14 Both the Honda Insight and the Toyota Prius are currently in production in Japan, the U.S., and Europe. Several other automobile manufacturers have announced upcoming models. The Renault Kangoo has been announced for launch in 2001 in Europe as a plug-in hybrid.
2-20

Mid-Size Car Summary and Conclusions
�� The study indicates that people are willing to pay more for an HEV 60 than an HEV 20, more for an HEV 20 than an HEV 0, and more for an HEV 0 than a CV. While it is not clear why this is so, the study did indicate there are about 10 marketable HEV benefits that have a strong to high influence on the purchase decision.
�� The majority of the people surveyed preferred plugging in a vehicle to fueling at the gas station.
�� Some issues that have been identified need to be examined for successful commercialization including battery cost and packaging.
�� HEV 0 vehicles are in the early commercialization stage; the WG speculates that this is the result of decisions by the relevant manufacturers to subsidize this promising new automotive product. However, there is an unclear commercialization path for plug-in hybrid electric vehicles despite their substantial societal benefits because, in particular, there are no corresponding automakers initiatives, presumably because of battery cost and battery replacement concerns. However, HEV 0s could be a stepping stone to plug-in hybrids.
�� Tax credits and other incentives could offset much of the first and life cycle cost difference between HEVs (especially plug-in HEVs) and conventional vehicles that remain after allowing for the lower energy and maintenance costs of HEVs. However, the applicability of most of the existing incentives to the different HEV types is not clear, but should be made clear. Generally, there appears to be justification for larger incentives going to those HEV types that have greater all electric range because of the potentially larger environmental and energy security benefits associated with all electric mode (battery only miles); however the economic value of these benefits has not been quantified in this study.
�� Because of the battery, the vehicle life assumption was limited to 100,000 miles or 10 years of life, whichever is less. Real-world testing must be done regarding life.
�� Significant uncertainty exists regarding HEV retail price. Each OEM is expected to price products differently. Many OEM prices consider not only costs and market demand, but proprietary considerations (e.g., the shifting of costs of one product onto other product lines), that the WG did not know how to quantify.
�� In particular, incremental costs for all HEVs are significant in low and medium volume production (higher than the numbers in this report). Yet, there are also certain societal benefits if HEVs are commercialized. In addition, the infrastructure issues for HEVs are fewer compared with alternative fuel vehicles. (Even for plug-in HEVs, the survey found 86% had relatively easy access to a plug, with 120V systems being relatively hassle free).
2-21

3 HEV PERFORMANCE, EFFICIENCY, AND EMISSIONS
3.1 Overview
A central task of this study was to model the performance of a number of hybrid vehicle configurations, that is, combinations of common vehicle platforms and selected hybrid-electric designs. These models became the basis not only for predicting the vehicle fuel efficiencies and emissions discussed in this section but also for performing the cost estimation (Section 4) and customer preference analyses (Section 5). The configurations considered, and the main issues pertinent to their selection and interpretation, are discussed in Section 3.2. While the study examined several platforms, this report centers on mid-size cars. Other platforms (compacts and SUVs) will be part of a subsequent report.
For meaningful comparisons of vehicle efficiencies, emissions, cost and customer preference, it was imperative that the conventional and hybrid vehicle configurations selected for this study have closely comparable performance. This goal became the basis for specifying the main vehicle components, including engine and motor power and mass; battery pack power, energy, and mass; as well as others. Performance equivalence of vehicle configurations was achieved through iterative applications of the simulation model while adjusting and refining component specifications until the performance predicted by the model for each vehicle type met the pre-established performance targets. In this process, a few targets were adjusted to reduce costs. Details on simulation tools and predicted vehicle performance are documented in Section 3.3, which also presents a discussion of other vehicle configurations.
When comparing different HEVs to each other as well as to conventional vehicles, the efficiency and environmental characteristics are of primary interest. Among the latter characteristics, those most relevant are the “well-to-wheels” emissions that include upstream (fuel-cycle) emissions in addition to vehicle tailpipe emissions. Upstream emissions are associated with the generation of the electricity used to charge plug-in HEV batteries and with the production, transportation, refining, and distribution of fossil fuels. Well-to-wheels emissions predicted on the basis of the vehicle performance simulations are discussed in Section 3.4. Other vehicle and component issues not addressed in this part of the study such as engine, motor, transmission, and battery selection are discussed in Section 3.5. Data that supports the charts and tables in this section can be found in Appendix B.
3-1

HEV Performance, Efficiency, and Emissions
3.2 Vehicle Configurations
This section summarizes the main vehicle configurations selected for the comparison study. The design parameters, performance targets and trade-offs, selected HEV component technologies, and control strategies are discussed in this section.
3.2.1 HEV Configurations
Many HEV configurations were considered during the course of this study, but only a limited number of them were analyzed in detail with respect to performance, efficiency, emissions, cost, and customer preference. These primary configurations are discussed in some detail below. Other HEV configurations are discussed where they provide significant additional insights on the alternatives and sensitivities of interest. Additional HEV configurations are discussed in more detail in Sections 4 and 5 to illustrate important cost and customer preference considerations.
Initially, series as well as parallel hybrid configurations were examined15, and both configurations were considered with and without plug-in capability and batteries capable of providing the vehicle with various all-electric ranges (AER). Initial modeling runs confirmed findings from previous studies that were reviewed by the WG: Series HEVs tend to have smaller fuel economy benefits and higher vehicle cost than parallel designs. Accordingly, the analysis focused on three parallel hybrid configurations and a baseline conventional (non-hybrid) vehicle, as follows:
�� A conventional vehicle (CV) with a gasoline internal-combustion engine only
�� A parallel hybrid with no all-electric range (HEV 0) (Charge Sustaining)
�� A parallel hybrid with “plug-in” capability (that is, capability for battery recharging from an off-board source of electricity) and a battery providing about 20 miles of all-electric range (HEV 20) (Charge Depleting)
�� A parallel hybrid with plug-in capability and a larger battery providing about 60 miles of all-electric range (HEV 60) (Charge Depleting)
There are a confusing number of synonyms for the HEV 0 as well as the HEV 20 and HEV 60. Table 3-1 shows these where each column lists synonymous terms.
Initial consideration was also given to a parallel hybrid with a plug-in capability and a 40-mile all-electric range (HEV 40). However, early analyses indicated that HEV 40 characteristics could be interpolated from HEV 20 and HEV 60 results in reasonable approximation.
15 A series HEV receives all of its traction power from an electric motor, and an on-board engine-driven generator charges the batteries. In a parallel HEV, both the electric motor and the engine can be connected to the drive axle(s) as well as to a generator to charge the batteries.
3-2

HEV Performance, Efficiency, and Emissions
Table 3-1 Several Different Names for HEVs with or without Plug-in Capability
HEV 0 HEV 20 and HEV 60
Non-grid-connected HEV Plug-in or grid-connected HEV
Gasoline-only HEV or Fuel-only HEV Dual Fuel HEV (e.g., EV mode for shorter trips and gasoline HEV mode for longer trips)
Power Assist HEV; Mild HEV a Extended ZEV Range HEV b
Engine Dominant HEV Battery Dominant HEV c
Charge Sustaining HEV Charge Depleting HEV c
a The difference between a power assist HEV and a “mild” HEV is a matter of degree rather than principle, with the power assist hybrid having a somewhat larger electric motor and battery. For example, a mild hybrid’s engine may need to turn on at about 1 mph for adequate acceleration, while the power assist HEV’s engine might need to turn on only at 10 mph. The power assist hybrid uses the motor and battery more extensively than the mild HEV for acceleration, passing, and capture of braking energy.
b As long as the battery has sufficient charge, the Plug-in HEVs operate in EV mode with no engine. However, when the battery’s state of charge is low (e.g., approximately 20%), plug-in HEVs operate like a power assist HEV 0. Other plug-in HEV control strategies are possible to accommodate the goals of the vehicle designer or needs of the driver; several of these strategies are strategies discussed in Section 3.3.4.
c A plug-in HEV is sometimes called a battery dominant or charge depleting HEV because the vehicle control strategy software gives first choice to depleting energy from the battery until the battery is low (e.g. about 20% SOC). At this low SOC, the engine is allowed to sustain the battery charge at that level, but not charge the battery further so that the use of electricity as a source of propulsion energy is maximized. This control approach encourages the user to charge the battery fully each evening in order to realize the environmental, energy cost, and energy security benefits of electricity from off-board sources.
As noted above, a few iterations of two series HEVs models were performed, but these were not optimized, nor were their costs analyzed. The WG also did not investigate a split-power type HEV like Toyota’s Prius that combines elements of parallel and series configurations but is characterized by greater complexity and likely higher cost. There was consensus in the WG that parallel HEV configurations will be the lower-cost options in the long-term due to their simplicity. A number of publications discuss series, parallel, and grid-connected HEV configurations [2].
Several variations of the study’s primary vehicle configurations were examined:
�� A high-power, mid-size HEV 0 design with a relatively low-power engine, and a high-power electric battery and motor. (This design had higher first costs and thus was not selected for detailed design.)
�� High-efficiency mid-size HEV 0, HEV 60 and CV designs, with mass reduced by about 10%, improved aerodynamics (Coefficient of drag = 0.26), and reduced tire rolling resistance (Coefficient = 0.0055). (See Section 3.3.3.)
3-3
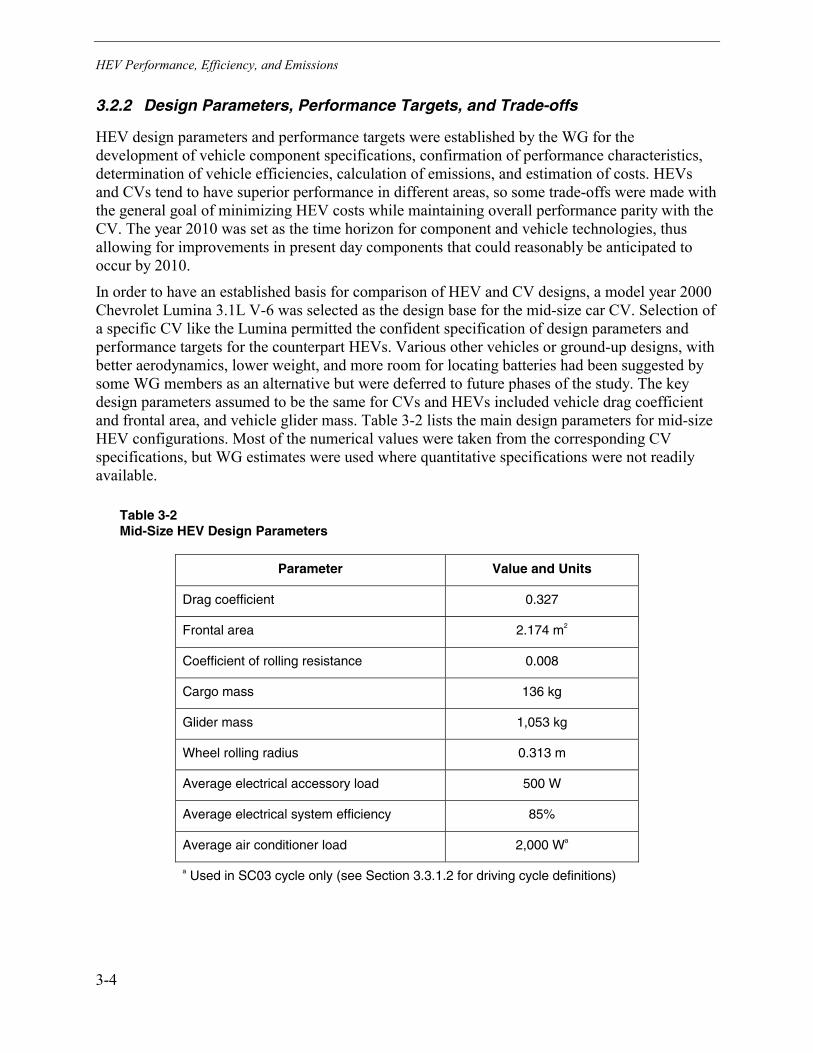
HEV Performance, Efficiency, and Emissions
3.2.2 Design Parameters, Performance Targets, and Trade-offs
HEV design parameters and performance targets were established by the WG for the development of vehicle component specifications, confirmation of performance characteristics, determination of vehicle efficiencies, calculation of emissions, and estimation of costs. HEVs and CVs tend to have superior performance in different areas, so some trade-offs were made with the general goal of minimizing HEV costs while maintaining overall performance parity with the CV. The year 2010 was set as the time horizon for component and vehicle technologies, thus allowing for improvements in present day components that could reasonably be anticipated to occur by 2010.
In order to have an established basis for comparison of HEV and CV designs, a model year 2000 Chevrolet Lumina 3.1L V-6 was selected as the design base for the mid-size car CV. Selection of a specific CV like the Lumina permitted the confident specification of design parameters and performance targets for the counterpart HEVs. Various other vehicles or ground-up designs, with better aerodynamics, lower weight, and more room for locating batteries had been suggested by some WG members as an alternative but were deferred to future phases of the study. The key design parameters assumed to be the same for CVs and HEVs included vehicle drag coefficient and frontal area, and vehicle glider mass. Table 3-2 lists the main design parameters for mid-size HEV configurations. Most of the numerical values were taken from the corresponding CV specifications, but WG estimates were used where quantitative specifications were not readily available.
Table 3-2 Mid-Size HEV Design Parameters
Parameter Value and Units
Drag coefficient 0.327
Frontal area 2.174 m2
Coefficient of rolling resistance 0.008
Cargo mass 136 kg
Glider mass 1,053 kg
Wheel rolling radius 0.313 m
Average electrical accessory load 500 W
Average electrical system efficiency 85%
Average air conditioner load 2,000 Wa
a Used in SC03 cycle only (see Section 3.3.1.2 for driving cycle definitions)
3-4

HEV Performance, Efficiency, and Emissions
Performance targets for use in the simulation analyses (Section 3.3.1) were set for acceleration, gradeability, top speed, and trailer-towing capability; Table 3-3 lists and defines the targets that determine the mid-size HEV design specifications. All targets were met by all HEV designs and in many cases the designs performed better than the minimum targets (see Section 3.3.2 for details).
Table 3-3 Mid-Size HEV Performance Targets (Worst Case for HEV 20 and HEV 6016)
Performance Target Target Value and Units
0 to 60 mph accelerationa 9.5 seconds
50 to 70 mph accelerationb 5.1 seconds
Minimum sustained top speed 90 mph
Gradeability at 50 mph for 15 minutesa,c 7.2%
Gradeability at 30 mph for 30 minutesa,c 7.2%
Minimum towing capabilityd 1,000 kg
ZEV range on FUDS/HWFET cyclee,f 20 miles for HEV 20, 60 miles for HEV 60
Minimum total range on FUDS cyclef 350 miles
US06 capability from any conditionf 2 cycles
Engine starts/stopsg Less than 30
HEV 20 & HEV 60 engine turn-on speed Above 60 mph only unless at or below 21% SOC
a Initial SOC = 20.5% for HEV 20 and HEV 60, 60% for HEV 0. b Running start (derived from 0 to 70 mph acceleration run). c Initial SOC = charge sustaining SOC, final SOC > 20%. d At 55 mph on 0% grade. e Must provide ZEV range that HEV was designed for (i.e. HEV 20 must provide 20 miles ZEV
range on FUDS/HWFET cycle). f See Section 3.3.1.2 for driving cycle definitions. g A greater number of engine start/stop cycles allows an HEV to achieve greater fuel economy.
However, there may be a concern over driveability. The number of on/off cycles was checked on the FUDS driving cycles. See Section 3.3.1.5 for more information.
16 The constraints were enforced at low SOC for the grid-connected HEVs (see table footnotes).
3-5

HEV Performance, Efficiency, and Emissions
Establishment of the HEV performance targets in Table 3-3 involved the following performance trade-offs:
�� Sustained top speed — The target for all HEVs was established at 90 mph, while a typical mid-size CV top speed was estimated to be approximately 120 mph. However, as part of the modeling effort it was determined that the HEV 0 actually could achieve a sustained 120 mph. Furthermore, the HEV 20 and HEV 60 could achieve sustained speeds of 98 mph and 97 mph, respectively, and 120 mph for approximately two minutes starting from the lowest permitted battery SOC of about 20%, that is, the worst case. Higher top speeds are sustainable for longer durations when the starting SOC is higher.
�� Gradeability — A typical mid-size CV gradeability is 7.2% at 50 mph for 30 minutes. The HEV gradeability targets were relaxed to 7.2% at 50 mph for 15 minutes and 7.2% at 30 mph for 30 minutes (with initial SOC assumed to be the charge sustaining SOC [21% SOC] and the final SOC was required to be � 20.5%) to reduce engine sizing requirements.17 Meeting the tougher gradeability requirements with the HEVs in principle is not an issue: the HEVs in this study could be designed for nearly any conceivable driving requirement if battery cost were not an object. In practice, the HEV 60 can meet the more stringent CV requirement by temporarily permitting discharge of the specified battery to approximately 15% SOC. However, the WG decided to adopt the somewhat reduced HEV gradeability target above as a reasonable compromise between vehicle (especially battery) performance and cost.
�� Passing Performance and Standing Acceleration — the target time to accelerate from 50 to 70 mph was increased from 4.8 seconds to 5.1 seconds to permit a reduction of HEV traction motor size. On the other hand, all HEV designs had better 0 to 30 and 0 to 60 mph acceleration and 40 to 60 mph passing performance than the CV. Mid-size vehicles typically have 0 to 60 mph acceleration times that vary from 8 to 12 seconds. The 0 to 60-mph acceleration target for the HEVs was lowered from initially 11 seconds to 9.5 seconds; if 11 or 12 seconds were allowed, HEVs would have reduced costs.
�� Engine Stop/Starts — A limit of 30 engine stops and starts on the FUDS driving cycle was imposed near the end of the study, when it was discovered that the surprisingly high fuel economy results for the HEV 0 were partially due to the fact that the optimization model called for approximately 80 engine stops and starts over the 23 minute driving cycle which raises serious concerns with driveability and possibly with component reliability.
�� Engine Turn-on at 60 mph for the HEV 20 and HEV 60 — Because the 1998 ARB test procedures for measuring the all-electric range of a HEV 20 or HEV 60 do not have test speeds above 60 mph, the engine could be allowed to run continuously above 60 mph, with the motor providing power assist during the higher speeds of the US06 performance target. This could be considered a reduced target, but it turned out the HEV 20 and HEV 60 modeled in the study could stay in all electric mode well above the 60 mph target (see Section 3.2.3.2 for all performance results).
17 This somewhat reduced target is tougher than climbing from Denver to Eisenhower Tunnel on the I-70 freeway, and similar to climbing the road up Pike’s Peak, Colorado. The Pike’s Peak road is considered one of the longest, steepest roads in the world–12.4 miles in length and an average grade of 7.0%. Such a course at 50 mph would be completed in 14.9 minutes, and the study’s HEV 60 could meet this requirement starting at a low SOC.
3-6

HEV Performance, Efficiency, and Emissions
3.2.3 Components
This section summarizes the design specifications and component technology selections for the primary HEV configuration modeled in the study. The main technologies selected include the type of engine (e.g., spark ignition or diesel), electric motor18 (AC induction, DC, or DC brushless permanent magnet), and batteries (nickel metal hydride or lead acid). Selection criteria included vehicle performance requirements, technology maturity, and prospective costs. Component capabilities were then quantified as part of, and to support, the HEV performance modeling efforts. These efforts also identified key uncertainties in component specifications and evaluated the sensitivities of the results to these uncertainties. A more detailed discussion of component technology options and their prospective costs is presented in Section 4.
HEV component specifications were quantified by applying the ADVISOR (ADvanced VehIcle SimulatOR) 2.2.1d HEV performance simulation model in an iterative fashion so that the predicted vehicle performance met targets, such as those shown in Table 3-3 for the mid-size HEVs. Some customization of the model was involved in these efforts. The ADVISOR program, driving cycles, and other details of HEV performance prediction calculations are documented in Section 3.3.1. Figure 3-1 shows a generic parallel HEV schematic to aid the understanding of the functional components and their specifications discussed below. Typically, as all-electric range increases (i.e. going from an HEV 0 to an HEV 60), the engine gets smaller and the motor and battery get larger. In addition, the HEV 20 and HEV 60 will have an on-board charger and cable to connect it to the power grid. An air conditioning compressor and a power steering pump are driven off the accessory drive.
Figure 3-1 Generic Parallel HEV Configuration (e.g., HEV 0, HEV 20, HEV 60)
18 Throughout this report, “engine” refers to the internal combustion engine, and “motor” refers to the electric motor.
3-7

HEV Performance, Efficiency, and Emissions
The ADVISOR simulation uses an iterative approach to modeling in which component sizes were guessed initially and then adjusted iteratively with modeling results to meet the targets listed in Table 3-3. Cost, driveability, and fuel economy trade-offs were also part of the iterative process to set component sizes/ratings that meet performance targets. Table 3-4 summarizes the technologies selected by the WG for each parallel HEV component, the component baseline specifications adopted in the ADVISOR model, and the relationships used to adjust these specifications. The table also lists the mid-size HEV component specifications (power, energy, etc.) determined from the baseline specifications and used in the simulation, as discussed in Section 3.3.1.
3.2.4 HEV Control Strategies
In an HEV, the decision of how to operate the engine and the battery-motor combination at any given time is made by the vehicle’s hybrid controller. The algorithms that govern the control decisions for the engine and motor make up the vehicle’s control strategy. There are many different options for designing control strategies that represent different trade-offs among performance, efficiency, emissions, and cost. Control strategies can have a significant impact on component sizing, costs, vehicle efficiency, and customer preference. Control strategy design also can be influenced by factors such as testing procedures, performance targets, and definition of all electric range, as well as regulatory objectives such as maximization of electric range.
Thus, considerable attention was focused on the control strategy for the charge-sustaining parallel HEV 0. Even greater efforts were devoted to control strategies for the HEV 20 and HEV 60, because many more control options and trade-offs are possible if varying portions of the propulsion energy are provided from an off-board source of electricity. The control strategy originally considered for the three HEVs, and the iterative process for developing component sizes to meet performance targets, are described in Section 3.3.1.5. The control strategy that emerged from this process was somewhat different than originally hypothesized because the HEV 20 and HEV 60 engine did not need to come on at speeds above 60 mph in most situations; this is detailed in the performance results in Section 3.3.2.3. Technical aspects of the control strategies selected are discussed below, in conjunction with the simulation approach taken in the study. Additional control strategy options that might provide superior HEV efficiency, cost and/or performance characteristics are discussed in Section 3.3.4.
3.3 Vehicle Performance Specifications and Efficiencies
This section explains the simulation approach, presents baseline mid-size vehicle results, and discusses additional vehicle configurations.
3-8

HEV Performance, Efficiency, and Emissions
Table 3-4 Parallel HEV Component Technologies and Model Baseline Values
Vehicle Architecture CV HEV 0 HEV 20 HEV 60
Engine
Base engine map Lumina 3.1L Prius Atkinsona Prius Atkinsona Prius Atkinsona
Base engine output (kW) Rated 127 43 43 43
Final engine output (kW) Rated 127 67 61 38
Scaled by N/A Max torque Max torque Max torque
Electric Motor
Base motor efficiency map N/A Precept 35 kW PM
Precept 35 kW PM
Precept 35 kW PM
Base motor peak output (kW) 35 35 35
Final motor peak output (kW) b 44 51 75
Continuous motor output c 19 22 32
Scaled by Max torque Max torque Max torque
High-Voltage Battery
Base battery efficiency map N/A Ovonic HiPwr Ovonic HEV-28 Ovonic HEV-45
System voltage (V) d 381 217 388
Base specific power (W/kg)e 650 444 393
Base specific energy (Wh/kg)f 37 49 71
Final specific power (W/kg) 650 441 393
Final specific energy (Wh/kg) 39 48 g 71
Final battery power (kW) 49 54 99
Final battery energy (kWh) 2.9 5.9 17.9
Peak specific power to energy ratio 16.9 9.1 5.5
Scaled by Battery energy Battery energy Battery energya Non-proprietary data included with ADVISOR software. b For 120 seconds. c Not considered in modeling. d These voltages are somewhat arbitrary since they are pieced together from existing battery
specifications. The voltages are higher than those for currently commercial HEV 0s that typically have battery voltages between 144V (Honda Insight) and 274V (Toyota Prius). Variations in battery cell capacity (in ampere-hours) offer considerable flexibility in selecting battery voltage, but in general the lowest voltage to meet battery peak power and efficiency targets should be used. Lower voltage results in fewer cells and modules, less complicated battery electrical management, and thus higher battery system reliability. To achieve manufacturing economies of scale, voltage standardization should be addressed.
e Specific energy at the C/3 (3-hour discharge) rate. f Maximum power at 50% DOD. g Power per module increased by decreasing internal resistance and increasing mass of each module.
3-9

HEV Performance, Efficiency, and Emissions
3.3.1 Simulation Approach
3.3.1.1 ADVISOR Model
The HEV and CV component and vehicle characteristics were modeled using the ADVISOR computer program developed by the National Renewable Energy Laboratory (NREL) with support from Department of Energy (DOE) to simulate conventional, electric, and hybrid electric vehicles. NREL has refined ADVISOR through several versions that can be downloaded from their website (http://www.ctts.nrel.gov/analysis). They also provide a Users’ Manual [3] and host ADVISOR Users’ Conferences.19
ADVISOR consists of a set of mathematical models, key data, and script text files for use with the Matlab®-Simulink® dynamic stimulation program. That program provides a flexible modeling environment so ADVISOR users can easily modify parts of the model to address their specific needs. It readily accommodates graphic ADVISOR inputs and outputs utilizing graphical user interface (GUI) screens. Although other excellent HEV performance simulation programs were available, the WG agreed to employ ADVISOR for this project because the model was considered suitable for the specific tasks of the study, easy to use, widely recognized and reasonably well validated [4]. The study’s ADVISOR analyses were carried out in a cooperative effort by WG member’s NREL and the University of California Davis (UCD) Hybrid Electric Vehicle Center.20
The ADVISOR simulation is a generic “backward” model with forward checks and corrections. Details of vehicle components (e.g., transmission, engine, motor, battery) are represented by modules or blocks. Information from a specified driving cycle is transmitted backwards through these blocks (i.e., from the pavement through the engine and motor to the fuel tank and/or battery), while component response and capability information is transmitted “forward” (e.g., to calculate how much the vehicle deviates from the input driving cycle if its acceleration capability is inadequate). Blocks can be set up to simulate series and parallel HEVs as well as CVs. Because of its primarily backward computational approach, ADVISOR is well suited for vehicle performance analyses, e.g., fuel use, electricity consumption, and exhaust emissions for specified vehicles and driving cycles. It is less suited for vehicle component design applications, but simple design questions (e.g., how much motor power is required to provide a specified acceleration) can be answered through iterative ADVISOR applications. Detailed discussions of ADVISOR modeling and applications have been published [5]. One of the limitations of ADVISOR is that efficiency results tend to be optimistic if it is given enough flexibility to minimize fuel consumption. A forward model will more realistically model a vehicle, including the necessary control system for proper operation as a real vehicle.
19 Users’ conference for ADVISOR, Costa Mesa, California, August 24-25, 2000. 20 The UCD HEV Center has constructed seven plug-in HEV60 vehicles in the last 10 years, including compact car, mid-size car, and large SUV versions for a variety of clients. The results and data of these vehicles have verified the ADVISOR program.
3-10

HEV Performance, Efficiency, and Emissions
Initially, a continuously variable transmission was specified for all HEV models because of the superior efficiency and potentially lower cost of continuously variable transmissions (CVTs). Specifically, modern CVT designs are significantly more efficient than automatic transmissions and can approach, or even exceed under some operating conditions, the efficiency of manual transmissions. CVTs also allow continuous engine efficiency optimization, thus improving fuel economy, especially in highway driving. Finally, a CVT allows the electric motor efficiency to be optimized in both driving and regeneration modes. However, when the study’s modeling effort began, NREL was still in early development of a CVT submodel for ADVISOR. Therefore, all vehicles selected had to be modeled with a 5-speed automatically shifted manual transmission.21 It seems likely that the vehicle designs analyzed in this study would achieve better energy economy if they had been modeled with a CVT. This expectation should be tested in future HEV modeling efforts.
3.3.1.2 Driving Cycles
Using the ADVISOR simulation, vehicles were “driven” over prescribed driving cycles in the worst case scenario of low (about 20%) battery state of charge (SOC) in order to assess their ability to follow the cycle and maintain the SOC, as well as to predict their fuel economy. Four standard driving cycles were used in the ADVISOR simulations: FUDS, HWFET, US06, and SC03. These cycles are defined in Table 3-5, and the specified speed-time profiles for each cycle are documented in the Code of Federal Regulations.22 Of these, the US06 is the most challenging because it has several hard accelerations and high-speed (65–80 mph) segments. Being able to complete two US06 in the charge-sustaining mode, starting from about 20% SOC, was one of the performance targets. The WG established the following ground rules for ADVISOR simulations of vehicles subjected to these cycles:
�� The speed predicted by the model must always be within 2 mph of the speed required in the driving cycle (“trace speed”).
�� For all HEVs, the battery SOC must stay above 20% throughout all cycles.
�� The SC03 cycle simulation includes an additional 2 kW of electrical accessory load for air conditioner usage.
21 The actual option selected for ADVISOR runs was a 5-speed manual transmission for HEVs and a 4-speed manual transmission for the CV; relatively high driveline loss assumptions in ADVISOR led to results similar to an automatic transmission. This was validated in the CV (baseline vehicle) runs where CV fuel economy was compared against actual automatic transmission vehicle fuel economy even though a manual transmission was selected in ADVISOR because there is no torque converter required for HEVs. 22 The FUDS, US06, and SC03 driving cycles can be found in 40CFR Part 86 Appendix I. The HWFET can be found in 40CFR Part 600 Appendix I.
3-11
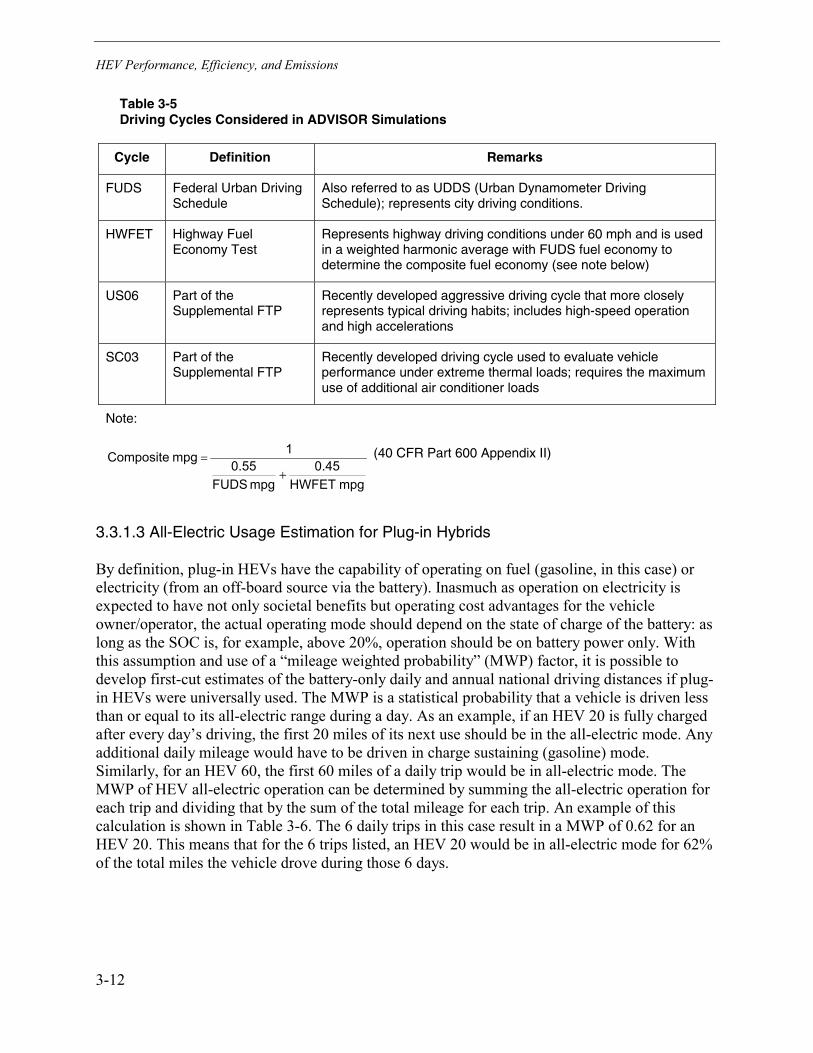
HEV Performance, Efficiency, and Emissions
Table 3-5 Driving Cycles Considered in ADVISOR Simulations
Cycle Definition Remarks
FUDS Federal Urban Driving Schedule
Also referred to as UDDS (Urban Dynamometer Driving Schedule); represents city driving conditions.
HWFET Highway Fuel Economy Test
Represents highway driving conditions under 60 mph and is used in a weighted harmonic average with FUDS fuel economy to determine the composite fuel economy (see note below)
US06 Part of the Supplemental FTP
Recently developed aggressive driving cycle that more closely represents typical driving habits; includes high-speed operation and high accelerations
SC03 Part of the Supplemental FTP
Recently developed driving cycle used to evaluate vehicle performance under extreme thermal loads; requires the maximum use of additional air conditioner loads
Note:
mpgHWFET0.45
mpgFUDS0.55
1mpgComposite�
� (40 CFR Part 600 Appendix II)
3.3.1.3 All-Electric Usage Estimation for Plug-in Hybrids
By definition, plug-in HEVs have the capability of operating on fuel (gasoline, in this case) or electricity (from an off-board source via the battery). Inasmuch as operation on electricity is expected to have not only societal benefits but operating cost advantages for the vehicle owner/operator, the actual operating mode should depend on the state of charge of the battery: as long as the SOC is, for example, above 20%, operation should be on battery power only. With this assumption and use of a “mileage weighted probability” (MWP) factor, it is possible to develop first-cut estimates of the battery-only daily and annual national driving distances if plug-in HEVs were universally used. The MWP is a statistical probability that a vehicle is driven less than or equal to its all-electric range during a day. As an example, if an HEV 20 is fully charged after every day’s driving, the first 20 miles of its next use should be in the all-electric mode. Any additional daily mileage would have to be driven in charge sustaining (gasoline) mode. Similarly, for an HEV 60, the first 60 miles of a daily trip would be in all-electric mode. The MWP of HEV all-electric operation can be determined by summing the all-electric operation for each trip and dividing that by the sum of the total mileage for each trip. An example of this calculation is shown in Table 3-6. The 6 daily trips in this case result in a MWP of 0.62 for an HEV 20. This means that for the 6 trips listed, an HEV 20 would be in all-electric mode for 62% of the total miles the vehicle drove during those 6 days.
3-12

HEV Performance, Efficiency, and Emissions
Table 3-6 Example of Mileage Weighted Probabilities for HEV 20
Daily Trip Trip Mileage All Electric Mileage
A 40 20
B 10 10
C 15 15
D 30 20
E 5 5
F 45 20
Total 145 90
MWP 0.62
Using a national recognized survey of personal driving habits, the U.S. Department of Transportation 1995 Nationwide Personal Transportation Survey (NPTS), MWPs for the HEV 20 and HEV 60 can be calculated using nationwide driving patterns. NPTS surveyed over 44,000 households nationwide on their driving habits, thus it provides data for calculating a national average all-electric use factor for hybrid electric vehicles for use in determining fuel economy and emissions from vehicle testing and modeling.
The Society of Automotive Engineers (SAE) subcommittee on hybrid electric vehicles developed a recommended practice for determination of hybrid electric vehicle efficiency (SAE J1711, described in Section 3.3.1.5). In developing this recommended procedure, the SAE subcommittee also attempted to compute an all-electric usage factor, which they termed a “Utility Factor.” In doing this, the SAE subcommittee also used NPTS to determine MWPs for all possible all-electric ranges from 0 to 500 miles at one-mile intervals. They then weighted these MWPs by all-electric range, which resulted in Utility Factors (UF) for the HEV 20 and HEV 60 that were less than the standard MWP. Several WG members do not see a basis for this additional weighting and this matter should be further reviewed in a future phase of this project. MWPs and UFs calculated using NPTS for an HEV 20 and HEV 60 are shown in Table 3-7. It is interesting to note that MWPs for the customer survey data described in Sections 4 and 5 result in MWPs of 0.39 and 0.75 for the HEV 20 and HEV 60, values very close to those calculated using NPTS for a much larger population.
Table 3-7 All-Electric usage Probabilities Comparison Derived from 1995 NPTS Assuming Nightly Charging
Vehicle UF MWP
HEV 20 0.31 0.39
HEV 60 0.63 0.74
3-13

HEV Performance, Efficiency, and Emissions
3.3.1.4 Charging Frequency
Charging frequency also has a large effect on annual all-electric use. Starting each trip with a full charge maximizes all-electric mileage and therefore the fuel economy and emissions benefits of a plug-in HEV. The discussion in Section 3.3.1.3 assumed charging nightly. HEV owners on the other hand may charge every other night, never charge or charge two times a day (once at home and once at work). SAE J1711 (described in Section 3.3.1.5) assumes that the driver is as likely to start each trip with a full charge as he or she is to start the trip with a low SOC. The effect of these charging frequency assumptions on all electric operation are shown in Table 3-8 for an HEV 60 driver who drives 40 miles each day for two consecutive days.
Table 3-8 Charging Frequency Versus All Electric Operation for an HEV 60
All-Electric Miles
Travel Days Daily Charging Every Other Day Charging SAE J1711
Day 1 40 40 40
Day 2 40 20 0
Total 80 60 40
For an HEV 20, charging twice a day would result in 80 miles of all electric operation for the two days, charging nightly would result in 40 miles of all electric operation, and SAE J1711 and every other day would result in 20 miles of all electric operation.
3.3.1.5 SAE J1711 Recommended Practice for Efficiency Determination
The SAE subcommittee on hybrid electric vehicles developed a Recommended Practice for Measuring the Exhaust Emissions and Fuel Economy of Hybrid-Electric Vehicles (March 1999)23 labeled J1711. Certain aspects of this procedure are included in ADVISOR simulations, and these parts are summarized here.
23 In this study, several minor deviations from the published SAE J1711 Recommended Practice were agreed upon by the WG. The first concerned the test length for full charge test (FCT) measurements. The recommended practice states that the vehicle must complete a specified number of cycles for both the FUDS and HWFET cycles. If the engine has not turned on by the end of the minimum number of cycles then the vehicle must continue to drive repeat cycles until the engine does turn on. In this study, it was assumed that the FCT portion for all drive cycles would end when the engine turns on regardless of distance traveled. This change was made because, based on the recommended practice method, the FCT results will over penalize a vehicle with less than ~30 miles of electric range because the results will include gasoline usage and emissions. The application of the utility factor, based on all electric range during FCT mode, in calculating the utility-factor weighted full charge test results already sufficiently accounts for the lack of utility of this operating mode. The second deviation relates to the calculation and reporting of US06 and SC03 fuel economy and emissions results. The recommended practice provides formulas for calculating the weighted emissions results for each of these cycles and does not require that a FCT be performed. In this study the weighted fuel economy and emissions results were calculated based on simulation results from the model. This approach was taken because it takes very little time to simulate the additional cycles and it was believed that the simulation results should be more accurate than simple formulas based on unknown assumptions. Note that the US06 and SC03 fuel economy results have been provided for informational purposes only while the emissions results from these cycles will be used in future Supplemental Federal Test Procedures (SFTP). This solution does not address all the issues identified for this test. The test also did not address all the issues. Further evaluation is required. In addition, the development of the utility factor needs further study as discussed in Section 3.3.1.3.
3-14

HEV Performance, Efficiency, and Emissions
The SAE J1711 recommended practice includes the UF factors described above, and this is built into ADVISOR for calculation of emissions and fuel economy.
Depending on the type of hybrid vehicle being simulated, the SAE J1711 procedure employs two types of tests:
1. Partial Charge Test (PCT)
2. Full Charge Test (FCT)
The first test, PCT, is always run, with the initial SOC specified for each driving cycle. This generally tests the vehicle in charge sustaining mode. The FCT test is only run if the vehicle has plug-in (grid connection) capability. In the SAE J1711 recommended practice, this is called Off-Vehicle Charge (OVC) capability. This generally tests the vehicle in all-electric mode (charge depleting mode). The model simulates these tests as appropriate for the vehicle type being considered, over the four driving cycles discussed in Section 3.3.1.3. For the HEVs and CVs considered here, four types of composite fuel efficiencies are defined as follows (where composite denotes the weighted harmonic average defined in the footnote of Table 3-5 and formulas for the 6 listed fuel efficiency measures are given in Appendix B):
1. Gasoline only—Composite fuel efficiency (in miles per gallon of gasoline) of the CV and of HEVs operated on fuel only, with the battery kept in the charge sustaining mode (determined during the PCT).
2. Electric only—Composite fuel efficiency including charger losses for a plug-in HEV when operating in all-electric mode, in miles driven per kWh of electricity. This is converted to miles per gallon of gasoline on an energy equivalent basis using 33.44 kWh/gallon of gasoline (determined in the FCT test).
3. UF weighted—A mixed fuel/electricity efficiency (in miles per gallon of gasoline energy equivalent) measure that assumes that an HEV starts each trip with a full charge. This is calculated by adding the electric-only efficiency in (2) above times the UF to the gasoline only efficiency in (1) above times (1-UF).
4. J1711 UF weighted—A mixed fuel/electricity efficiency (in miles per gasoline gallon energy equivalent) measure that assumes that an HEV is just as likely to start a trip with a low state of charge as a high state of charge. This is calculated taking the inverse of the quantity of 0.5 divided by the Gasoline only fuel efficiency in (1) above and 0.5 divided by the UF weighted fuel efficiency in (3) above.
In addition, two more measures of fuel economy could be defined based upon the use of MWP instead of UF. These are defined as follows:
5. MWP weighted—A mixed fuel/electricity efficiency (in miles per gallon of gasoline energy equivalent) measure that assumes that an HEV starts each trip with a full charge. This is calculated by adding the electric-only efficiency in (2) above times the MWP to the gasoline only efficiency in (1) above times (1-MWP).
3-15

HEV Performance, Efficiency, and Emissions
3-16
6. J1711 MWP weighted—A mixed fuel/electricity efficiency (in miles per gasoline gallon energy equivalent) measure that assumes that an HEV is just as likely to start a trip with a low state of charge as a high state of charge. This is calculated taking the inverse of the quantity of 0.5 divided by the Gasoline only fuel efficiency in (1) above and 0.5 divided by the MWP weighted fuel efficiency in (5) above.
Other charging frequency assumptions than the one in SAE J1711, such as those discussed in Table 3-8, could be used with MWP and UF to define other measures of HEV mixed fuel efficiency.
3.3.1.6 Control System Simulation
The control strategy element of ADVISOR allows the user to modify several control parameters. While ADVISOR was originally designed to model HEV 0 vehicles, the control strategies in ADVISOR were modified for this study to accommodate plug-in HEV designs. The main operating modes are as follows:
1. Electric Mode: In this mode, the battery and motor are used to provide the entire driving torque below a certain minimum vehicle speed (i.e. no engine is used). In an HEV 0, the electric mode is used for launching the vehicle from a stop, and the engine turn-on (or launch speed) is typically set at 15 mph or less and is a function of SOC. In plug-in vehicles, this launch speed could also be set as a function of battery SOC but at higher speeds, so that electric power is used as much as possible, especially when the SOC is high. For the HEV 20 and HEV 60 modeled in this study, the engine typically was not allowed to turn on at all in normal city and highway test cycle driving conditions when the SOC was greater than 21% to assure maximum use of electricity by the HEVs. In addition, both the HEV 20 and HEV 60 modeled in this study can operate at 70 mph on the freeway in electric mode. In principle, engine turn-on above 21% SOC could be allowed if desired to accommodate driver power demands (i.e., hill climbing or hard accelerations) in excess of peak battery power (see Hybrid Mode 2c and 2d below and Section 3.2.2 for more discussion of electric operation above 60 mph). In this “excess power” mode, propulsion energy is supplied by both the engine and the motor with the battery being gradually discharged.
2. Hybrid Mode: Depending on the specific driving conditions, the engine or electric motor or both may be operating in this mode. Four variations are given below:
a) HEV 0 Hybrid Mode: This mode is used when the vehicle speed is greater than the launch speed. The engine is used as the primary source of power, but the battery-motor combination can provide temporary power assist to the engine if the torque demanded by the driver exceeds the maximum torque available at the engine's operating speed. The battery is being depleted in this mode. The HEV 0 battery may temporarily go as low as 20% SOC, but normal operation is around 60% SOC.
b) Charge-Sustaining Mode: This mode is only used when the HEV 0 is operating in the Hybrid mode. When the battery SOC is low, the engine is asked to provide excess torque that is used by the motor/generator to charge the battery to the design SOC, typically around 60%. For example, if the battery SOC is at 40%, the engine is asked to charge the battery until it reaches the designated SOC (e.g., 60%). After that, the battery charge is being sustained.

HEV Performance, Efficiency, and Emissions
3-17
c) Engine Assist Mode: This mode is used with plug-in hybrids when the driver demands more power than electric motor can provide at any battery SOC. Because the motor is operating continuously, the battery as the primary power source is being depleted. This mode did not occur in the base case HEV 60 when modeled on the US06, but did so occasionally for the base case HEV 20 at speeds above 60 mph (e.g., while passing) in the US06 driving cycle test procedure.
d) Motor Assist Mode: This mode is used with plug-in HEVs when the battery SOC falls below 21% after about 20 miles all-electric (battery-only) operation in the HEV 20 or after about 60 miles in the HEV 60. The vehicle switches to a charge-sustaining mode to protect the battery, and the engine is used to meet normal torque requirements, but it is not allowed to produce excess torque to charge the battery above 21% SOC24. However, battery power and motor power assist can be added for limited periods when demanded. In that mode, the vehicle launch speed decreases as the battery SOC drops. This strategy causes the vehicle to use the engine more often as the battery continues to deplete, thus preventing the SOC from dropping too far. In this study, the launch speed was set to decline from 60 mph at 21% SOC to near 20 mph25 at 20.5% SOC. The battery SOC is sustained in this mode. Originally, the WG expected the plug-in HEVs to be in this mode (engine on continuously with motor assisting occasionally) at speeds above 60 mph with a full battery. However, it was found that this was not necessary, probably due to the larger motors needed to meet the performance targets for gradeability. Using the motor to assist the engine at speeds over 60 mph reduces the need for battery replacement and offers other practical advantages.
3. Regeneration Mode: Regeneration (absorption of vehicle kinetic energy during deceleration by allowing the motor to operate as a generator charging the HEV battery) can be used in the Electric or Hybrid mode. Coasting to a stop, coasting downhill, or braking are examples of this mode. The battery is being charged. If braking is required during hybrid mode for two seconds or longer, then the engine is shut off. HEVs use this regenerative mode when appropriate with different strategies. For example, if a plug-in HEV has climbed a hill in the charge-sustaining mode at 20.5% SOC, it can subsequently descend in regenerative braking mode and charge the battery up to 25% or higher SOC. It can then shift to Electric mode to deplete the battery back down to 21% SOC, after which the HEV will return to charge sustaining mode. An HEV 0 can also accomplish this but only to the extent that the battery has sufficient capacity to absorb and deliver energy, and the swing in the SOC level will be substantially larger due to the smaller battery pack.
4. Low-Torque Electric Mode: This mode allows for a brief change from the Hybrid to the Electric mode. When the engine runs inefficiently (typically when a low torque level is required) for a period longer than 4 seconds, the engine will shut off and the motor will produce the required torque. The vehicle returns to the Hybrid mode when the power level increases to a level sufficient for efficient engine operation. The battery is being depleted during this mode.
24 SOC limit in relation to performance of the vehicle will be further evaluated during the continuing technical analysis. 25 On the urban driving cycle and possibly lower on other driving cycles.

HEV Performance, Efficiency, and Emissions
When HEVs in this study are examined in the above detail, it becomes clear how complex HEV control strategy can be. In particular, HEV 0, HEV 20 and HEV 60 use all four basic modes above, charging, depleting, and sustaining the battery at various times during normal operation. The base case control strategies identified above are not necessarily the best ones; see Section 3.3.4 for other possible strategies.
During a simulation run, control algorithms decide whether to obtain torque from the engine, the motor, or both according to a set of control parameters, depending on whether the battery SOC is above or below the “low SOC” setting (20.5% in this study). If the SOC is above the low setting, the engine is engaged when the vehicle is traveling above the minimum engine-on speed of the Electric mode or when the torque demand is above the engine-off torque setting. The engine-off torque typically is set to force the engine to operate in an efficient region. Figure 3-2 illustrates this strategy.
Figure 3-2 Parallel HEV Control Strategy (High Battery SOC)
If the SOC is below the low setting, the engine operates when the required torque (including additional torque needed by the motor/generator to charge the batteries) lies above a minimum torque level. This minimum level is typically set lower than the engine-off setting used when the batteries are above the “low SOC” condition. This allows the engine to operate more frequently. Figure 3-3 illustrates this strategy.
3-18
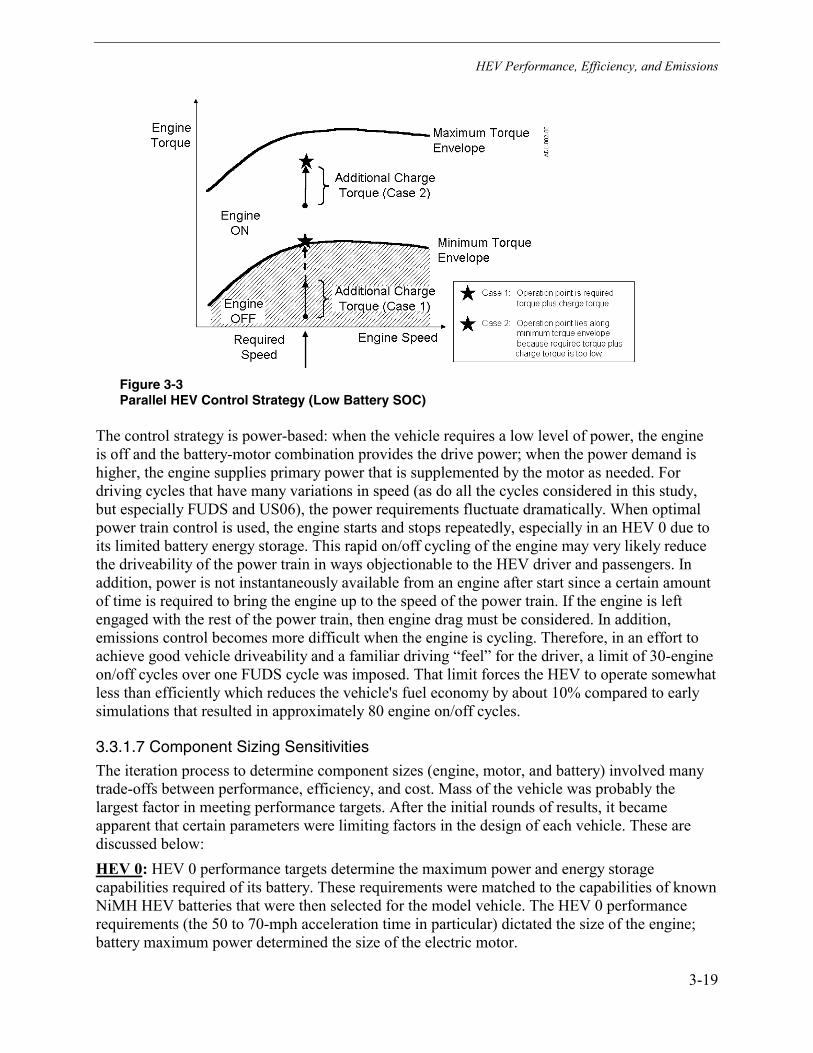
HEV Performance, Efficiency, and Emissions
Figure 3-3 Parallel HEV Control Strategy (Low Battery SOC)
The control strategy is power-based: when the vehicle requires a low level of power, the engine is off and the battery-motor combination provides the drive power; when the power demand is higher, the engine supplies primary power that is supplemented by the motor as needed. For driving cycles that have many variations in speed (as do all the cycles considered in this study, but especially FUDS and US06), the power requirements fluctuate dramatically. When optimal power train control is used, the engine starts and stops repeatedly, especially in an HEV 0 due to its limited battery energy storage. This rapid on/off cycling of the engine may very likely reduce the driveability of the power train in ways objectionable to the HEV driver and passengers. In addition, power is not instantaneously available from an engine after start since a certain amount of time is required to bring the engine up to the speed of the power train. If the engine is left engaged with the rest of the power train, then engine drag must be considered. In addition, emissions control becomes more difficult when the engine is cycling. Therefore, in an effort to achieve good vehicle driveability and a familiar driving “feel” for the driver, a limit of 30-engine on/off cycles over one FUDS cycle was imposed. That limit forces the HEV to operate somewhat less than efficiently which reduces the vehicle's fuel economy by about 10% compared to early simulations that resulted in approximately 80 engine on/off cycles.
3.3.1.7 Component Sizing Sensitivities
The iteration process to determine component sizes (engine, motor, and battery) involved many trade-offs between performance, efficiency, and cost. Mass of the vehicle was probably the largest factor in meeting performance targets. After the initial rounds of results, it became apparent that certain parameters were limiting factors in the design of each vehicle. These are discussed below: HEV 0: HEV 0 performance targets determine the maximum power and energy storage capabilities required of its battery. These requirements were matched to the capabilities of known NiMH HEV batteries that were then selected for the model vehicle. The HEV 0 performance requirements (the 50 to 70-mph acceleration time in particular) dictated the size of the engine; battery maximum power determined the size of the electric motor.
3-19

HEV Performance, Efficiency, and Emissions
HEV 20: Cost was a key parameter for the design of the HEV 20. In an effort to reduce the power electronics cost of the vehicle, a relatively small electric motor was selected. The minimum size of the motor was ultimately dictated by the power requirements during all-electric operation. This requirement, in turn, determined the power capability of the battery, and the 20-mile all-electric range (AER) requirement determined the energy storage capacity of the battery. The engine was then sized to meet the 50 to 70 mph acceleration guideline.
HEV 60: As the HEV 60 requires a significant amount of energy storage, this larger battery can provide a substantial amount of power as well. One design goal was, therefore, to minimize the size of the engine while optimizing the trade-off between vehicle performance and cost. The primary limiting factor of the HEV 60 design, the capability to drive up a 7.2% grade at 50 mph for 15 minutes, dictates that the required drive power be almost completely provided by the engine. Accordingly, the grade requirement determines engine size while the specified acceleration capability (specifically, the 50 to 70 mph times) sets the battery power and motor size. Within the guidelines summarized in Table 3-4, component sizes and masses were the primary parameters changed during model iterations. The values finally obtained after convergence of the iterations are documented in the results below in Section 3.3.2, together with other pertinent data. After the design revisions (such as modifications of component technologies and control strategies) made by the WG in the course of ADVISOR iterations, the final design goals became those discussed in Section 3.2, and the final design parameters those discussed below in Section 3.3.2. Note that any given combination of HEV component specifications is not generally the only combination capable of meeting the performance targets. HEV design alternatives judged to be also of significant interest are discussed in Sections 3.3.3 and 3.3.4.
3.3.2 Base Case Results
The results of ADVISOR simulation analyses to quantify component specifications and predict performance and efficiency (expressed as fuel economy) for the mid-size HEVs and CVs are presented in this section.
3.3.2.1 General
As noted earlier, there are many combinations of component sizes that would allow the modeled HEVs to meet the performance targets specified in Table 3-3. The modeling efforts emphasized HEV designs that minimize battery and motor size to reduce the cost differential between the CV and HEVs. Possibilities for reducing costs further by changing base case assumptions, and the resulting alternative configurations, are discussed in Section 3.3.3. Yet, other HEV configuration alternatives that should be analyzed in the future for their efficiency, emissions, and cost characteristics are discussed in Section 3.3.4.
The quantitative power and energy specifications for the mid-size CV, HEV 0, HEV 20, and HEV 60 propulsion systems are listed in Table 3-9. Figure 3-4 compares the power available from the HEV engine and motor with CV engine power. Figure 3-5 compares the minimum battery energy storage capacities required for the mid-size HEV 0, HEV 20, and HEV 60 designs.
3-20

HEV Performance, Efficiency, and Emissions
Table 3-9 Engine, Motor, and Battery Power and Energy Simulation Results for Mid-Size Vehicles
Vehicle
Component Specification Units CV HEV 0 HEV 20 HEV 60
Engine Power (peak) kW 127 67 61 38
Motor Power (peak for 120 seconds) kW — 44 51 75
Total Motive Power Power (peak) kW 127 111 112 113
Motor Power (continuous) kW 19 22 32
Batteries Rated energy kWh — 2.9 5.9 17.9
Batteries Rated power kW — 49 54 99
Figure 3-4 Engine and Motor Results for Mid-Size Vehicles
The simulation results show that the charge-sustaining mid-size HEV 0 engine requires about 60% of the counterpart CV power, while the plug-in HEV 60 engine requires only 34% of CV power. In fact, the combined engine plus motor power for all the mid-size HEVs can be slightly less than the CV engine power, a direct result of the somewhat lower top speed results for HEVs and because the base CV can go faster than 120 mph (see Section 3.3.2). Also, motors generally have greater torque capability at low speed compared to engines of the same peak power rating; thus, all other performance targets can be met with lower total power than a conventional vehicle. The main trade-offs are between the sustained gradeability versus sustained top speed performance targets, both of which affect battery storage capacity and cost (see trade-off discussion in Section 3.2.2). All other HEV performance characteristics are equal or better than those of the CV. By 2010, when CVTs can be expected to have attained more power and durability due to better electronic controls, HEVs will have better performance over a broader range of driving conditions.
3-21

HEV Performance, Efficiency, and Emissions
Figure 3-5 Battery Energy Results for Mid-Size HEVs26
Figure 3-5 shows the increased battery energy capacity and power required to provide all-electric range capability with adequate vehicle power. For example, the mid-size HEV 60 needs approximately six times more energy capacity than a HEV 0 but only twice the power. Note that the HEV 0, HEV 20, and HEV 60 designs modeled in this study are not the only solution to the mid-size design rules and constraints. Thus, other mid-size HEV designs can be defined for the purpose of analyzing trade-offs between performance and cost; some of these trade-offs are discussed in Section 3.3.3.
3.3.2.2 Vehicle Mass
The masses of the principal vehicle components were estimated using three different sources: (1) the relationships summarized in Table 3-4, (2) actual vehicle or manufacturers’ data where applicable and available, and (3) engineering judgment and consensus where data were unavailable. Significant effort was spent detailing vehicle masses (including examining the mass of brackets, bolts, nuts and washers).
The resultant masses of mid-size CV and HEV components and the total vehicle masses are summarized in Table 3-10. Figure 3-6 compares the total mass of the mid-size CV, HEV 0, HEV 20, and HEV 60. Both the HEV 0 and HEV 20 were lighter than the CV because of the lighter mass of the transmission and because the V-6 engine of the CV was replaced with an L-4 in the HEV 0 and HEV 20. While an L-3 engine and CVT transmission were used in the HEV 60, the much larger batteries of the HEV 60 caused it to weigh more than the CV.
26 Useful energy for the HEV 0 is actually larger because it can go down to 20% SOC, but the control strategy tends to minimize this as a trade-off for battery life. Similarly the plug-in HEVs also have a larger useful energy by going down to 18% SOC, but the control strategy will prevent this due to battery life issues.
3-22

HEV Performance, Efficiency, and Emissions
Figure 3-6 Mid-Size HEV and CV Masses
3.3.2.3 Performance
The mid-size HEV 0, HEV 20, and HEV 60 designs complied with the design rules and performance constraints discussed in Section 3.2.2. These included acceleration, top speed, gradeability, and the other factors listed in Table 3-3. HEV top speed, gradeability, and passing performance were relaxed with respect to CV capabilities, as discussed in Section 3.2.2.
Vehicle performance depends primarily on the power-to-mass ratio, secondarily on transmission characteristics and control strategy, and to a lesser extent on other factors. Figure 3-7 shows the total peak power (engine plus motor)-to-mass ratios of the mid-size CV, HEV�0, HEV 20, and HEV 60. This comparison shows that plug-in HEVs are able to meet preset performance requirements with a lower power-to-mass ratio because of the favorable torque characteristics of battery-motor combinations and because acceleration requirements are partially governed by available torque rather than peak power.
3-23

HEV Performance, Efficiency, and Emissions
Table 3-10 Component Mass and Total Mass Results for Mid-Size Vehicles
Mass (kg)
Component CV HEV 0 HEV 20 HEV 60
Engine 155.6 87.1 79.3 50.1
Engine Thermal 8.1 4.7 4.3 2.7
Lube 7.8 7.0 5.0 4.0
Engine Misc. 32.6 10.0 10.0 10.0
Engine Mounts 5.1 5.0 5.0 5.0
Engine Total 209.1 113.8 103.6 71.8
Exhaust/Evap System 41.0 31.6 29.7 22.4
Transmission 97.9 50.0 50.0 50.0
Generator/Alternator 4.7 — — —
A/C Compressor 6.2 11.2 13.0 15.0
A/C Condenser 2.2 2.3 2.6 3.2
A/C Misc. 12.6 12.6 12.6 12.6
Accessory Power Module — 10.0 10.0 10.0
Accessory Power Total 25.6 36.1 38.2 40.8
Starter Motor 6.1
Electric Motor 23.5 27.2 39.9
Power Inverter 5.0 5.0 5.0
Motor/Electronics Thermal 16.6 16.6 16.6
Electric Traction Total 6.1 45.1 48.8 61.5
Fuel Storage (tank + lines) 13.4 9.0 8.0 7.5
Accessory Battery 14.8 5.0 5.0 5.0
Energy Batteries 75.2 121.0 252.0
Pack Tray 7.0 10.0 22.0
Pack Hardware 13.5 13.5 13.5
Battery Thermal 14.6 14.6 14.6
Energy Storage Total 28.2 124.3 172.1 314.6
Charge Port 7.0 7.0
Charging Total 0.0 0.0 7.0 7.0
Total Power Train 455 401 449 568
Glider (including power steering) 1053 1053 1053 1053
Mass of fuel for full tank 38.4 27.7 25.9 24.8
Total Curb Mass 1546 1482 1528 1646
Driver and cargo mass 136 136 136 136
Total Test Mass 1682 1618 1664 1782
3-24

HEV Performance, Efficiency, and Emissions
Figure 3-7 Power-to-Mass Ratios for Mid-Size HEVs and CV
Several of the vehicle characteristics such as drag coefficient, frontal area, and rolling resistance significantly affect vehicle engine and power train requirements. As noted earlier, for the HEV designs examined in this study, these characteristics are assumed to be the same as for representative current vehicle designs. Reductions in vehicle drag and other engine loads through high-efficiency vehicle design will have a large, positive effect on the HEV 20 and HEV 60 configurations (see discussion in Section 3.3.3).
Meeting all of the vehicle performance specifications listed in Table 3-3 proved challenging for some HEV configurations. In the design compromise adopted, HEVs had faster 0 to 30 mph, 0 to 60 mph, and 40 to 60 mph acceleration times than specified (Table 3-11) while the 50 to 70 mph time was slightly longer. Top speed comparisons are shown in Table 3-12. In the judgment of the WG, the parameters summarized in these tables represent overall vehicle performance characteristics that would be viewed as equivalent by customers, thus meeting the goal to achieve performance equivalent to the CV with the lowest possible engine and battery costs.
Table 3-11 Predicted Vehicle Acceleration (seconds)
Acceleration Speed Range (mph) Specification CV HEV 0 HEV 20 HEV 60
0 to 30 — 3.5 3.1 3.0 3.0
0 to 60 9.5 9.3 8.7 8.9 8.9
40 to 60 — 4.6 4.2 4.3 4.3
50 to 70 5.1 4.5 5.2 5.2 5.2
3-25

HEV Performance, Efficiency, and Emissions
Table 3-12 Predicted Sustained Top Speed (mph)
Specification CV HEV 0 HEV 20 HEV 60
90 120 a 120 a 98 b 97 b
a Governed to 120 mph. b The top speed listed here is the speed that can be sustained. In principle, the
HEV 20 and HEV 60 can reach 120 mph during typical operation; the top speeds shown above resulted from the model’s limitations in the vehicles’ gearing. With a fully functioning 5th gear or a CVT, the HEV 20 very likely could sustain 120 mph, the HEV 60 a higher speed.
Other key performance requirements are hill climbing and trailer towing capabilities at high speeds. These requirements proved challenging for the HEV designs of the study because the total power requirements exceeded design peak engine power. As a consequence, the electric motor-battery combination needs to provide some of the power and energy for hill climbing. Using this strategy, all of the vehicles in this study met the hill climbing requirements discussed in Table 3-3 if the gradeability requirement was relaxed from the original target of 30 minutes at 50 mph to 15 minutes.
At low SOC, the HEV 20 and HEV 60 in the motor-assist (charge sustaining) mode could meet sustained US06 tests. Specifically, at 21% SOC the engine turned on at 60 mph, and at 20.5% SOC the engine turned on near zero-mph, with intermediate turn-on speeds between these two SOCs. In the all electric mode, the HEV 60 could meet the US06 test for approximately 40 miles (or 5 test cycles) including long periods at up to 80 mph, an unexpected high performance. In the all-electric mode (starting at 100% SOC), the HEV 20 engine turns on only 7 times for a total of 17 seconds during the same (16 minute) test cycle, less than 2% of the time, also a better result than expected. Thus, instead of the motor providing power assist at high speeds, the motor ran continuously on battery power and the engine provided power assist for only a small fraction of the cycle.
All other performance goals listed in Table 3-3 were met or exceeded. If the battery SOC is 100% (instead of the 21% assumed in the model), not much improvement of acceleration, passing, top speed, and towing will be noticeable or available to the consumer, with the possible exception of improved gradeability, slightly longer range (350 miles on fuel plus 60 or 20 all-electric miles), and potentially fewer engine turn-ons and turn-offs. At these higher battery SOCs, the HEV 60 will operate mainly in the default all-electric mode (including the hard accelerations and high speeds of the US06 driving cycle). However, for grades and possibly other situations, the engine will need to assist the motor and battery. The HEV 20 at these high battery SOCs will also mainly operate in all electric mode (except for tough grades and for two percent of the time in the US06 driving cycle when the engine must assist the motor and battery).
Although all HEVs passed the modified minimum performance requirements with components and controls that are available or believed attainable in the study’s time horizon, the ultimate proof of HEV performance, efficiency, and control capabilities must be delivered by hardware built and tested to automotive standards.
3-26

HEV Performance, Efficiency, and Emissions
3.3.2.4 Fuel Economy (Fuel Efficiency)
Figure 3-8 compares the four composite fuel economy measures discussed in Section 3.3.1 for the mid-size CV, HEV 0, HEV 20, and HEV 60 vehicle designs. These are listed in Table 3-13 along with the MWP weighted fuel and MWP weighted J1711 fuel economies. Because the CV and HEV 0 vehicles cannot be operated in an all-electric mode, gasoline-only fuel economy is the only measure that applies. A notable simulation result was that the HEV 0 has approximately 45% higher fuel efficiency than the CV. For the plug-in HEV 20 and HEV 60, all four fuel efficiency measures are higher than either CV or HEV 0 fuel efficiencies. The electric-only fuel efficiencies of the HEV 20 and HEV 60 were similar and exceeded CV efficiency by about 300%, consistent with the fact that electric motors are much more efficient than gasoline engines. The gasoline-only fuel efficiency of the HEV�20 and HEV 60 are again similar and slightly better than the HEV 0 because their more extensive hybridization permits use of smaller engines that operate more efficiently over the driving cycle. As expected, the NPTS utility factor weighted and J1711 fuel economies of the HEV 20 and HEV 60 designs fall between (since they are weighted averages of) their gasoline-only and electric-only fuel efficiencies.
Figure 3-8 Fuel Economy of Mid-Size HEVs Relative to CV
3-27

HEV Performance, Efficiency, and Emissions
Table 3-13 Fuel Economy Results for Mid-Size Vehicles
Parameter Units CV HEV 0 HEV 20 HEV 60
UF Weighted SAE J1711
Weighted Urban mpeg a — — 45.8 52.7
Weighted Hwy mpeg — — 52.3 60.8
Composite b mpeg — — 48.5 56.1
UF Weighted Composite mpeg — — 54.9 73.4
MWP Weighted SAE J1711
Weighted Urban mpeg — — 46.8 55.1
Weighted Hwy mpeg — — 53.4 63.0
Composite b mpeg — — 49.6 58.4
MWP Weighted Composite mpeg — — 57.6 81.8
Partial Charge Test
Gasoline Urban mpg 23.2 40.6 40.9 42.4
Gasoline Highway mpg 41.4 43.7 47.1 49.7
Gasoline Composite mpg 28.9 41.9 43.5 45.4
Full Charge Test c
Electric, Urban kWh/mi — — 0.288 0.298
Electric, Highway kWh/mi — — 0.282 0.288
Electric Composite mpeg 117.2 113.8 a Miles per gasoline equivalent gallon. Electric fuel economy in kWh/mi is converted to miles
per gasoline equivalent gallon using 33.44 kWh/gallon of gasoline. b Also termed mixed fuel economy. c These numbers reflect FTP test results. Energy cost calculations use fuel economies which
are discounted with EPA labeling factors. See discussion in Section 4.2.2.4.
An analysis of the GM EV1 versus the HEV 60 modeling results was done to assess HEV 60 efficiency against that achieved by the EV1. Using scaling equations for aerodynamics, accessory loads, friction, vehicle mass, tire rolling resistance, and battery size, the EV1 energy consumption of 0.25 kWh/mi was adjusted for the above listed parameters to determine the energy consumption for the HEV 60. The resulting energy consumption for the HEV 60 in all-electric mode using these scaling equations was 0.37 kWh/mi, much higher than the 0.29 kWh/mi found in this study. There are several reasons for this discrepancy. First, the EV1 uses an AC induction motor that is less efficient than the HEV 60’s DC BPM motor. Second, the EV1 batteries have a high internal resistance that requires significant cooling during charging. The HEV 60, on the other hand, has a high power battery with a much lower internal resistance and therefore requires much less or no cooling during charging. Using ADVISOR to model the
3-28

HEV Performance, Efficiency, and Emissions
EV1 produced an energy consumption that matched the EV1’s rated fuel economy. In addition, the ADVISOR run of the SUV HEV 60 (to be described in a subsequent report) matched exactly the energy consumption of the U.C. Davis built and tested Chevrolet Suburban HEV. However, model validation is of utmost importance in any modeling study and real hardware should be built and tested to validate this study’s results.
3.3.3 Additional Vehicle Configurations
As discussed in Section 3.2.1, several simulations were run to explore other hybrid designs and various component selection trade-offs, mostly to provide a basis for evaluating sensitivities with respect to cost and customer preference. One case analyzed in more detail assumed CV, HEV 0, and HEV 60 designs of reduced mass, improved aerodynamics and tires with reduced rolling resistance, as follows: Vehicle mass was reduced by 170 kg and the drag coefficient (Cd) was reduced from 0.327 for the Lumina to 0.25 (e.g., the 2001 Lexus LS 430). While a detailed analysis of how to achieve these advances at low cost was not conducted, some implementing options for 2010 might include a low-mass steel frame27, Saturn-type thermoplastic panels, and increased use of plastics and aluminum in the drive train (e.g., like the Honda Insight). Tire rolling resistance was also lowered from 0.008 to 0.0055 based upon tires that Goodyear has currently available. Engine, motor, and battery power results for this simulation are shown in Table 3-14. Fuel economy results are shown in Table 3-15. Additional results can be found in Appendix B. (Trade-offs between the cost impacts of reductions in mass, Cd and/or frontal area, and tire improvements, will have to be done to determine the lowest-cost high-efficiency vehicle options.)
Table 3-14 Engine, Motor, and Battery Power and Energy Results for Mid-Size Vehicles with Reduced Mass, Improved Aerodynamics, and Reduced Rolling Resistance
Component Specification Units CV HEV 0 HEV 60
Engine Power (peak) kW 98 55 34
Motor Power (for 120 seconds) (peak) kW — 40 65
Total Motive Power Power (peak) kW 98 95 99
Motor Power (continuous) kW 17 28
Batteries Rated energy kWh — 2.2 15.0
Batteries Rated power kW — 39 83
27 The American Iron and Steel Institute has announced light mass steel with 10% less mass for the same price as today’s steel [6].
3-29

HEV Performance, Efficiency, and Emissions
Table 3-15 Fuel Economy Results for Mid-Size Vehicles with Reduced Mass, Improved Aerodynamics and Reduced Rolling Resistance
Parameter Units CV HEV 0 HEV 60
UF Weighted SAE J1711
Weighted Urban mpeg a — — 69.0
Weighted Hwy mpeg — — 82.3
Composite b mpeg — — 74.4
UF Weighted mpeg — — 96.0
MWP Weighted SAE J1711
Weighted Urban mpeg 71.9
Weighted Hwy mpeg 84.6
Composite b mpeg 77.1
MWP Weighted mpeg 105.4
Partial Charge Test
Gasoline Urban mpg 27.7 58.0 56.3
Gasoline Highway mpg 50.5 69.7 67.3
Gasoline Composite mpg 34.8 62.7 60.8
Full Charge Test c
Electric Urban kWh/mi — — 0.246
Electric Highway kWh/mi — — 0.222
Electric Composite mpeg 142.1 a Miles per gasoline equivalent gallon. Electric fuel economy in kWh/mi is converted to miles per
gasoline equivalent gallon using 33.44 kWh/gallon of gasoline. b Also termed mixed fuel economy. c These numbers reflect FTP test results. Energy cost calculations use fuel economies which are
discounted with EPA labeling factors. See discussion in Section 4.2.2.4.
3.3.4 Issues for Future Consideration
As noted earlier, a number of different control strategies for charge sustaining (HEV 0) and, even more so, for plug-in hybrid electric vehicles (HEV 20 and HEV 60) are possible. In practice, the specific design of the vehicle and the product goals of the manufacturer will govern the proper choice of control strategies. In the context of this study, several options beyond those used in the three HEV designs were identified for future investigation because of their apparent potential for improved performance and efficiency.
3-30

HEV Performance, Efficiency, and Emissions
3.3.4.1 Additional HEV 0 Control Strategy Options
�� Using the battery capacity more completely (lowering the minimum SOC before the engine turns on) to sustain HEV 0 performance under conditions when the electric motor is needed. Further study should examine whether it is worth the expected reduction in NiMH battery cycle life due to deeper cycling.
�� Adjusting the vehicle speed at which the engine turns on to maximize battery-motor use for better efficiency versus the need for a larger battery.
�� Setting a lower bound on engine torque, below which, the engine will shut off to increase the extent to which the engine is operating in an efficient range.
�� Utilizing engine efficiency maps to control engine start-stops and throttling decision processes to increase fuel efficiency.
�� Programming engine start-ups to produce lower emissions due to the large size of the electric motor. By allowing starting at a higher torque and rpm than for a CV, the HEV engine exhaust will be hotter and can heat the catalyst more rapidly, thereby reducing cold starting emissions.
3.3.4.2 Additional Control Options for Plug-in HEVs
Plug-in HEVs have more energy storage to work with than a charge-sustaining (HEV 0) vehicle, and they can be operated in the charge-sustaining as well as charge-depleting modes. As a consequence, and as noted earlier, plug-in HEVs offer substantially more control strategy options than a charge-sustaining HEV. For example:
�� Limiting driving below 45 mph to electric power only (except when the battery has reached its minimum SOC). Above 45 mph, the engine would be on continuously, and the motor and battery would be used only occasionally to assist. This is a simpler control strategy than the power-based strategy used as the base case. The HEV 20 engine at speeds above 60 mph occasionally assists the motor and results in less frequent engine on/off cycling. Using a speed-based engine turn-on strategy during charge-depleting operation extends battery range because it allows a plug-in HEV to use the engine at high (e.g., freeway) speeds, thus “conserving” battery energy for lower-speed driving. This strategy minimizes fuel consumption, increases vehicle lifetime zero-emission miles, and reduces emission of smog-forming gases as well as carbon dioxide. Alternatively, battery size could be reduced because less energy and energy storage is needed to go 20, 40, or 60 miles, and this reduces the vehicle cost. (There was considerable discussion among WG members because this particular control strategy is not compatible with the current SAE J1711 or ARB draft test procedures. Among others, all-electric range must be defined carefully for this strategy since it may involve summing periods of all-electric driving separated by periods of engine use.)
�� Limiting driving below 60 mph to electric power only (except when the battery is low). This is very similar to the above, except the definition of all-electric range would not need to be changed. (Originally, the WG had expected this control strategy to become the base case, see Section 3.3.1.5 and 3.3.2.3.)
3-31

HEV Performance, Efficiency, and Emissions
�� Limiting driving below 80 mph to electric power only (except when the battery is low). The engine would assist the battery-motor combination only at very high speeds, or on longer trips when the battery SOC has reached 21%.
�� Change the engine turn-on vehicle speed versus battery SOC ramp for the HEV 20 and HEV 60. In the base case, the HEV 20 and HEV 60 engine comes on at 60 mph at 21% SOC and near zero mph at 20.5% SOC. The above three examples change this turn-on speed but keep the 21% and 20.5% parameters for HEV mode. The turn-on ramp is very steep, partly because it was easier for ADVISOR to accommodate such a profile. Originally, however, a control strategy was considered in which the engine turned on at 60 mph at 60% SOC, at 30 mph at 45% SOC, and at near zero mph at 20.5% SOC. This strategy can result in the benefits mentioned above for the first alternative, but also causes the same issues. Variations of this concept can be combined with many of the control strategies listed in this section.
�� Permitting the driver to operate the vehicle in Electric mode during a different portion of the trip rather than at the beginning. This is particularly advantageous to a vehicle with low all-electric range such as an HEV 20, where the driver may want to “save” all-electric miles for certain portions of a trip such as the end of a commute. It also could be used on a HEV 60 that is programmed to use the engine for freeway travel—the user may know the freeway trip is short and that it could be done all-electrically.
�� Smart-car with trip planning capability. It should be possible to provide the driver with the option of programming the vehicle with a trip plan. For example, four or more typical trips of each driver could be programmed into the trip planner, and the all-electric miles maximized (including freeway travel). This might work well with an HEV 60 or HEV 40. Conversely, the trip planner could be designed to maximize the most energy-efficient miles by saving all electric range for city (lower speed) travel. This might work well for an HEV 20.
�� The Electric mode may also take the batteries to a lower state-of-charge than the 20% minimum level assumed in this study (such as 10%) in order to maximize all-electric range. This could allow using a battery that is about 10% smaller and save on vehicle cost, but it is expected that there will be a reduction in battery life. However, if lifetime all-electric miles are similar as the 20% SOC base case, then this is an attractive option.
�� Operating the plug-in HEV’s engine in its most efficient region, taking advantage of the fact that plug-in HEVs have significant torque reserves in their larger-capacity battery-electric motor combinations. Particularly with a CVT, plug-in HEV engines could be allowed to track a so-called “ideal operating line” under most driving conditions. This strategy also prevents rapid changes in the engine throttle setting, thereby reducing emissions.
�� Programming engine startups to produce lower emissions in plug-in HEVs due to the large size of the electric motor by starting the engine at a higher rpm and torque. This will provide a hotter exhaust, which should warm the catalyst more quickly.
�� Governing the CVT gear ratio (or gear number selection in a standard manual or automatic transmission) with two separate algorithms to achieve separate optimum ratios in the Electric and Hybrid modes, respectively. This can increase energy efficiency during all-electric operation.
3-32

HEV Performance, Efficiency, and Emissions
�� Smart car–Minimize battery replacement strategy. This strategy’s benefits are examined in Section 5. It is particularly useful with the HEV 20 to limit the all electric miles as only about 30,000 are possible per battery pack (but could prove useful for longer range plug-in HEVs such as the HEV 40 and HEV 60). The control strategy would automatically limit the accumulation of all electric driving (possibly as the car gets older). A variation on this control strategy is to limit all electric driving to the smog season of the owner’s region. This would maximize the environmental benefit.
�� Mountain mode–In some regions, it might be permissible to have a manual override switch that would allow the engine to provide more energy and power than it normally would. For example, it might come on at lower speeds if the grade was above a certain degree, or if the vehicle was using a trailer. A variation on this, is to have a manual override switch that would allow the battery to go from 20% SOC to 10% so that additional motor power could be provided to the engine. (This might be useful if the vehicle were stuck or other emergency situations).
Several of the above control strategies can be combined. More detailed analyses of these strategies are needed to quantify their impacts and better understand the trade-offs involved.
3.4 Emissions
As noted earlier, an appropriate approach to emission comparisons of conventional and the various hybrid vehicles is to consider total (“well-to-wheel”) emissions. This is the approach taken in this study, although its results also permit comparisons of vehicle on-road emissions. Total emissions include emissions from vehicle manufacturing and recycling, fuel production facility construction and decommissioning, fuel production (gasoline and electricity), and vehicle operation (tailpipe and evaporative emissions). The study focused on fuel production and vehicle operation inasmuch as these emissions have the greatest impacts on air quality and its regulation. Previous studies have examined the impact of fuel/energy production facility construction and vehicle construction and found that energy use for these activities is generally less than 15% of vehicle lifetime energy use, and the associated emissions are correspondingly less as well.
3.4.1 Tailpipe Emissions
The ADVISOR model has the capability to predict vehicle tailpipe emissions in grams per mile (g/mi) for a given driving cycle. The model calculates emissions from engine “maps” that describe emissions per brake-specific power (g/kWh) as a function of engine operating variables. However, the WG elected not to use model-predicted results for the comparisons of CV and HEV tailpipe emissions for three reasons: First, emissions predictions by ADVISOR are not sufficiently accurate because the model does not capture transient engine operation that can greatly affect (usually increase) emissions. Second, the engine data used for most of the HEV modeling effort (taken from a Japanese-specification, non-SULEV Toyota Prius driven on a chassis dynamometer) were incomplete. Third, some of the emissions components of the Prius tested are higher than current EPA standards and thus are not representative of the best state of control technology. Instead, the WG agreed that the HEVs considered in this study should be assumed to meet applicable certification standards, regardless of engine size, vehicle mass, etc.
3-33
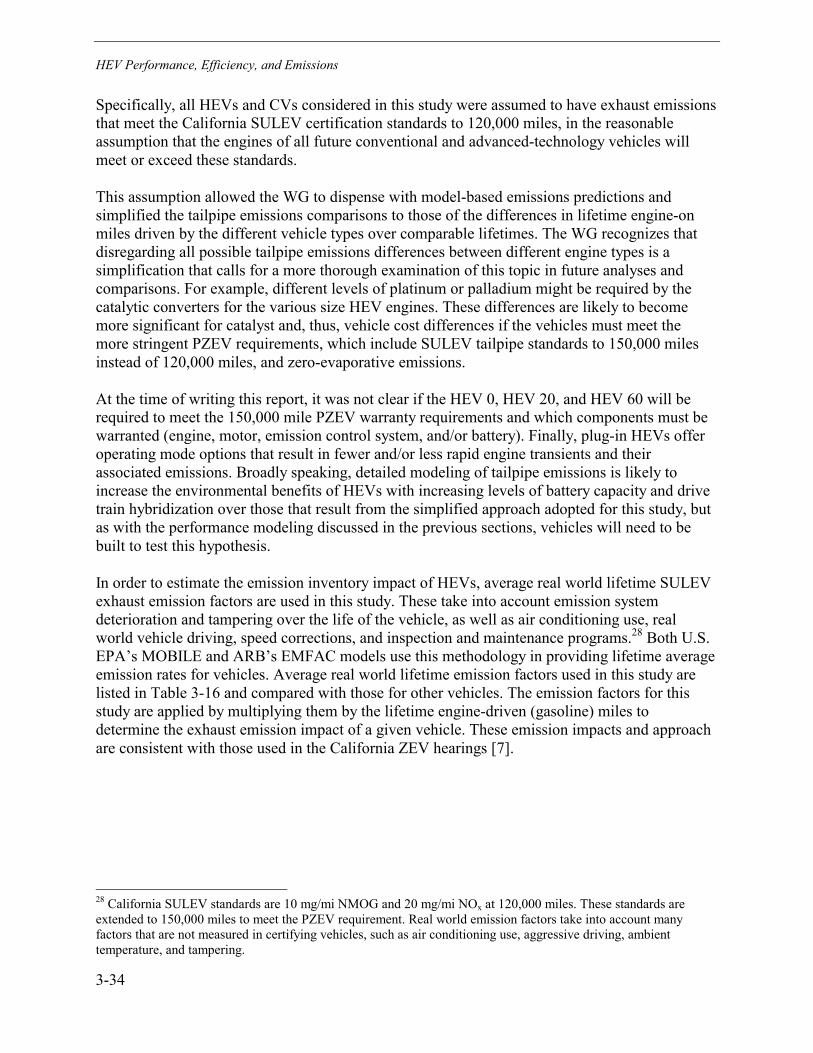
HEV Performance, Efficiency, and Emissions
Specifically, all HEVs and CVs considered in this study were assumed to have exhaust emissions that meet the California SULEV certification standards to 120,000 miles, in the reasonable assumption that the engines of all future conventional and advanced-technology vehicles will meet or exceed these standards.
This assumption allowed the WG to dispense with model-based emissions predictions and simplified the tailpipe emissions comparisons to those of the differences in lifetime engine-on miles driven by the different vehicle types over comparable lifetimes. The WG recognizes that disregarding all possible tailpipe emissions differences between different engine types is a simplification that calls for a more thorough examination of this topic in future analyses and comparisons. For example, different levels of platinum or palladium might be required by the catalytic converters for the various size HEV engines. These differences are likely to become more significant for catalyst and, thus, vehicle cost differences if the vehicles must meet the more stringent PZEV requirements, which include SULEV tailpipe standards to 150,000 miles instead of 120,000 miles, and zero-evaporative emissions.
At the time of writing this report, it was not clear if the HEV 0, HEV 20, and HEV 60 will be required to meet the 150,000 mile PZEV warranty requirements and which components must be warranted (engine, motor, emission control system, and/or battery). Finally, plug-in HEVs offer operating mode options that result in fewer and/or less rapid engine transients and their associated emissions. Broadly speaking, detailed modeling of tailpipe emissions is likely to increase the environmental benefits of HEVs with increasing levels of battery capacity and drive train hybridization over those that result from the simplified approach adopted for this study, but as with the performance modeling discussed in the previous sections, vehicles will need to be built to test this hypothesis.
In order to estimate the emission inventory impact of HEVs, average real world lifetime SULEV exhaust emission factors are used in this study. These take into account emission system deterioration and tampering over the life of the vehicle, as well as air conditioning use, real world vehicle driving, speed corrections, and inspection and maintenance programs.28 Both U.S. EPA’s MOBILE and ARB’s EMFAC models use this methodology in providing lifetime average emission rates for vehicles. Average real world lifetime emission factors used in this study are listed in Table 3-16 and compared with those for other vehicles. The emission factors for this study are applied by multiplying them by the lifetime engine-driven (gasoline) miles to determine the exhaust emission impact of a given vehicle. These emission impacts and approach are consistent with those used in the California ZEV hearings [7].
28 California SULEV standards are 10 mg/mi NMOG and 20 mg/mi NOx at 120,000 miles. These standards are extended to 150,000 miles to meet the PZEV requirement. Real world emission factors take into account many factors that are not measured in certifying vehicles, such as air conditioning use, aggressive driving, ambient temperature, and tampering.
3-34

HEV Performance, Efficiency, and Emissions
Table 3-16 Average Real World Lifetime Tailpipe Emission Factors [7]
Vehicle Type NMOG (mg/mi)
NOx (mg/mi)
This Study:
SULEV 7.3 25
Comparisons:
BEV a 0.0 0.0
PZEV-SULEV b 6.7 24
PZEV HEV non-grid c 6.7 24
SULEV with LEV II DR d 15 30
MY 2002 California vehicle 62 173
Federal Tier II 27 43 a Battery electric vehicle. b Gasoline vehicle eligible for 0.2 partial PZEV allowance. c Gasoline non-grid connected HEV eligible for 0.3 partial PZEV allowance. d SULEV vehicle with high in-use deterioration.
3.4.2 Vehicle Evaporative Emissions
Vehicle evaporative emissions are expected to be similar for HEVs and CVs because both vehicles contain fuel tanks and fuel systems. While both will most likely be able to meet conventional evaporative emission tests, real world use of plug-in HEVs might pose complications if the engine is never or only infrequently started. Evaporative emissions systems use canisters to contain gasoline vapors during diurnal (when the fuel tank is subjected to rising and falling temperatures during a day) and fueling events. The canister is purged by drawing vapors into the engine intake manifold when the engine is running. If the engine is infrequently used, vapors can saturate the canister and leak to the atmosphere, causing significantly higher emissions. However, control strategies that require the engine to be run occasionally for a few seconds could be used to solve this potential problem. A more careful study of this issue and possible solutions is indicated.
To meet PZEV requirements, evaporative emissions must be reduced to near zero levels. While only limited prototype vehicles have met this standard today, it is assumed that a portion of California vehicles will meet the standard by 2010. (The evaporative emission factors used in this study do not include non-fuel evaporative emissions because these are assumed to be the same for both CVs and HEVs.)
Total lifetime average evaporative emission factors for NMOG for SULEVs are 32-mg/mi [7]. Subtracting a representative 18 mg/mi for non-fuel emissions from vehicles (vinyl seats, adhesives, tires, paint, etc.) leaves 14 mg/mi of vehicle fuel system NMOG evaporative emissions. This latter factor should be applied to all vehicle miles, not just engine-driven miles. This would need to be reduced to 2 mg/mi to meet PZEV requirements.
3-35

HEV Performance, Efficiency, and Emissions
The methods that will be used by 2010 to reduce evaporative emissions from all vehicles also will reduce evaporative emissions from HEVs. These include use of low permeation materials, returnless fuel injection systems, segmented canisters and others [8]. With these improvements, both CVs and HEVs can meet the zero evaporative emission PZEV requirements by 2010, provided a strategy is used to purge canisters when running for long periods in all electric mode. Further study of this issue should be part of a follow-on effort.
3.4.3 Fuel-Cycle Emissions
This section compares the fuel-cycle or “upstream” emissions associated with CV and HEV operation. Only the emissions from the production and distribution of gasoline and electricity are discussed. The emission impacts of manufacturing and recycling vehicles, batteries, and fuel production facilities are not considered because the associated energy impacts and, therefore, in first approximation, their emissions are typically less than 15 percent of those from vehicle operation.
Fuel-cycle emissions include evaporative emissions and electricity production emissions and vehicle tailpipe emissions from such items as extraction of fuel feedstocks, fuel production, fuel storage, and transportation to local distribution stations, as well as distribution to vehicles at a local distribution station. Local emissions of hydrocarbons, NOx, CO, SO2, and particulates occur in urban areas as well as throughout the fuel production chain. Greenhouse gases (CO2, methane, and N2O) are of concern in conjunction with global climate change. Because of their stability and long residence times in the atmosphere, total worldwide emissions are of concern regardless of where they are produced.
Conceptually, fuel-cycle emissions are inversely proportional to vehicle fuel efficiency. The fuel-cycle emissions analysis in this study was based on the fuel efficiency estimates in Section 3.3.2.4. However, consistent with the procedure adopted by the U.S. EPA for its vehicle fuel economy guide and vehicle labeling, city fuel consumption was increased by 10 percent and highway fuel consumption by 22 percent over the levels determined through modeling to estimate “real world” fuel consumption rates.
Data on fuel-cycle emissions for gasoline and electric power production have been reported and were reviewed by the WG. The primary differences between the GREET model (1.5a) developed by Argonne National Laboratory [9] and the analyses by Arthur D. Little Inc. for ARB [10] is that GREET determines average emissions associated with electricity generation, that is, the emissions from all generation sources divided by total power generation in kWh. The bulk of the analysis carried out by Arthur D. Little estimated marginal emissions, that is, the incremental emissions produced by additional production of gasoline or of electric power, e.g. for plug-in HEV battery charging. Although estimates of marginal emissions are subject to greater uncertainties because they depend on local emission sources, they were used in this study because plug-in HEVs will be a new and thus incremental use of electricity. In addition, several air quality regions allow additional emissions to be offset by reducing emissions from other sources or are capped at existing levels. To provide a national approach to this study, all incremental power plant and refinery emissions were assumed to meet best available control technology levels without using offsets.
3-36

HEV Performance, Efficiency, and Emissions
The key fuel-cycle emission assumptions for the nation are the following: �� Plug-in HEVs are charged primarily at night. (It is likely that some vehicles will be charged
during the day, but it is assumed that they will be a small minority.) �� Older coal and fuel oil power plants cannot be turned on and off rapidly, so these less
efficient plants will be used at full load during peak demand and idled or turned off at night. They do not respond to marginal load increases.
�� Nuclear and hydroelectric power plants are already at capacity satisfying the base load requirement and would not be used to provide marginal needs.
�� By 2010, many older fossil fuel power plants will be replaced with new natural-gas-powered, combined cycle turbines that have much better efficiency and reduced emissions. By 2020 and later, even more power plants will be replaced. Because newer, more efficient and reliable power plants cost less to run, there will be pressure to replace the large stock of old US power plants irrespective of the regulatory environment (market-oriented or command and control).
�� During off-peak periods (especially at night), marginal increases in power demand will be met by efficient combined cycle plants that can be dispatched more rapidly and economically than less efficient plants. Since charging even a substantial population of HEVs is estimated to be less than 1% of all power generated in 2010, power generated for HEV charging can be assumed to be on the generation margin generated by high-efficiency, natural gas-fired combined cycle turbines.
�� New power plants and refineries in non-attainment areas will need to meet the very low emission standards for “best available control technology” (BACT), without their owners/operators being able to claim emission offsets, particularly in California.
�� Most oil refineries are at capacity; therefore, marginal gasoline use will most likely come from foreign oil. New refineries will be limited to BACT-level emissions, again without offsets.
Table 3-17 and Table 3-18 show a range of power plant emission and efficiency assumptions taken from the GREET and ARB emission studies. Emissions are shown for the GREET model which estimates average emissions from power plants and upstream fuel production processes. Also shown are marginal emission estimates based on dispatch model studies performed on the mix of marginal power generation facilities in California. The California dispatch based emissions studies are affected by the large mix of older power plants in the State. In a situation where power supplies are less limited than in California, older facilities would be repowered to combined-cycle natural gas turbines to maintain competitive operating costs. Total fuel cycle smog precursors in urban areas were estimated to be 0.098 g/kWh for marginal natural gas based power production from newer facilities. Table 3-19 shows comparisons of gasoline fuel cycle emissions for California South Coast Air Basin marginal emissions high and low national marginal production estimates and GREET estimates. After careful review, the emission rates in Table 3-20 was used for the HEV fuel-cycle emissions analysis for the entire nation. These are an average of the high and low national marginal estimates. The electricity-associated emission rates estimates are also for marginal emissions. Emissions from petroleum production represent marginal rates from new refinery capacity while power plant emissions represent high-efficiency marginal nighttime generation. The power generation and refinery emissions were adjusted to reflect a scenario where 70 percent of all emissions occur in urban areas; this simplification represents a composite of several urban areas.
3-37

HEV Performance, Efficiency, and Emissions
Table 3-17 Power Generation Emission and Efficiency Assumptions
Study Mix NOx
(ppm) NOx
(lb/MMBtu) Heat Rate (Btu/kWh)
� (HHV)
GREET 1.5a Baseline Assumptions
GREET Combined Cycle NG 30% 136 0.5 6474 52.7%
GREET Other NG 70% 136 0.5 10663 32.0%
GREET Composite — 136 0.5 8930 38.2%
Marginal Natural Gas Power Plants
New Combined Cycle Planta — 6 0.022 6500-8800 39-53%
aHeat rate and efficiency depend upon load
Table 3-18 Power Pant Emission Rates (g/kWh)
Study NOx NMOG CO2
ANL HEV/WG Average Analysisa
GREET NE mix, long term 0.871 0.045 556
GREET CA mix, long term 0.362 0.019 254
GREET MidWest, long term 0.444 0.033 755
Marginal Natural Gas Power Plants
ARB 1996b 0.04 0.01 505
ARB 2001b 0.07 0.007 —
New Combined Cycle NG Plantsc 0.06 0.026 427
a Assumes 70% of NOx and NMOG is in urban areas b Composite power plan emissions based upon dispatch modeling. (Emissions from
South Coast Air Basin power plants/total EV kWh) c Total emissions from power plant
3-38
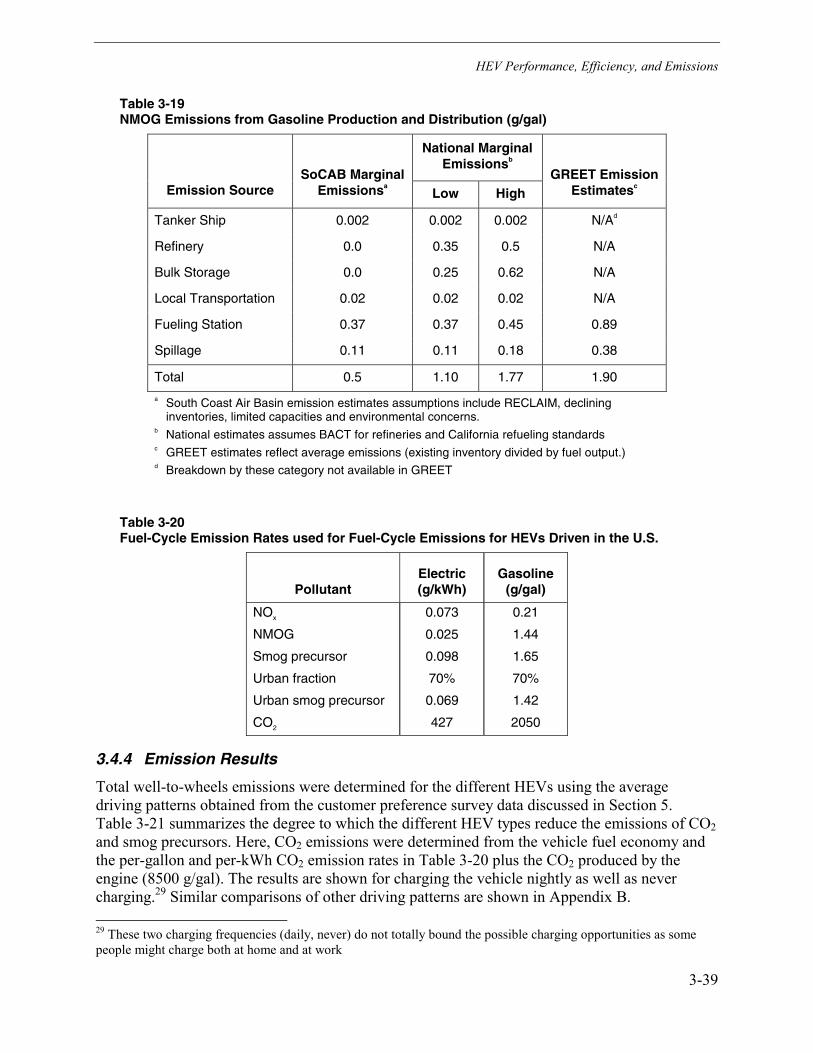
HEV Performance, Efficiency, and Emissions
Table 3-19 NMOG Emissions from Gasoline Production and Distribution (g/gal)
National Marginal Emissionsb
Emission Source SoCAB Marginal
Emissionsa Low High GREET Emission
Estimatesc
Tanker Ship 0.002 0.002 0.002 N/Ad
Refinery 0.0 0.35 0.5 N/A
Bulk Storage 0.0 0.25 0.62 N/A
Local Transportation 0.02 0.02 0.02 N/A
Fueling Station 0.37 0.37 0.45 0.89
Spillage 0.11 0.11 0.18 0.38
Total 0.5 1.10 1.77 1.90
a South Coast Air Basin emission estimates assumptions include RECLAIM, declining inventories, limited capacities and environmental concerns.
b National estimates assumes BACT for refineries and California refueling standards c GREET estimates reflect average emissions (existing inventory divided by fuel output.) d Breakdown by these category not available in GREET
Table 3-20 Fuel-Cycle Emission Rates used for Fuel-Cycle Emissions for HEVs Driven in the U.S.
Pollutant Electric (g/kWh)
Gasoline (g/gal)
NOx 0.073 0.21
NMOG 0.025 1.44
Smog precursor 0.098 1.65
Urban fraction 70% 70%
Urban smog precursor 0.069 1.42
CO2 427 2050
3.4.4 Emission Results
Total well-to-wheels emissions were determined for the different HEVs using the average driving patterns obtained from the customer preference survey data discussed in Section 5. Table 3-21 summarizes the degree to which the different HEV types reduce the emissions of CO2 and smog precursors. Here, CO2 emissions were determined from the vehicle fuel economy and the per-gallon and per-kWh CO2 emission rates in Table 3-20 plus the CO2 produced by the engine (8500 g/gal). The results are shown for charging the vehicle nightly as well as never charging.29 Similar comparisons of other driving patterns are shown in Appendix B. 29 These two charging frequencies (daily, never) do not totally bound the possible charging opportunities as some people might charge both at home and at work
3-39

HEV Performance, Efficiency, and Emissions
Table 3-21 Emission Reductions for HEVs
Vehicle Charging HEV 0 HEV 20 HEV 60
Well to Wheels CO2 Reductions
Nightly Charging 28% 44% 57%
Never Charge 28% 31% 34%
Reduction in Well to Wheels Smog Precursor Emissions
Nightly Charging 15% 35% 52%
Never Charge 15% 17% 18%
Figure 3-9 shows the emissions of NOx and HC from all sources—fuel-cycle, evaporation, and tailpipe—for the CV and three HEV designs. In addition, a “Limited HEV 20” has been added. This vehicle manages electric operation to prevent a need for battery replacement during the vehicle’s nominal lifetime (100,000 miles or 10 years). This vehicle is described in more detail in Section 4.2.2.6. As with CO2 emissions, fuel-cycle HC and NOx correspond to the g/gallon and g/kWh values in Table 3-18 divided by fuel consumption. The better fuel economy of HEVs results in fewer refueling emissions from fewer trips to the gasoline station as well as fewer emissions from production and marketing of gasoline.
Figure 3-9 Fuel-Cycle and Vehicle Emissions (NOx plus HC)
HEVs also produce evaporative emissions from vehicle fuel tanks and fuel systems. Although these subsystems (e.g., tank size and configuration) may differ for the different vehicle designs, in first approximation the evaporative emissions per mile (regardless of electric or charge sustaining mode) are assumed to be the same. The vehicle evaporative emissions for all vehicle configurations shown in Figure 3-9 represent the lower estimates developed by the WG.
3-40

HEV Performance, Efficiency, and Emissions
If evaporative emissions from vehicles can eventually be eliminated (e.g. through development of sealed systems), the total smog precursor emission reductions could reach 60% for the HEV 60 vehicle. CO2 emissions for the CV and four HEV types are shown in Figure 3-10 for the average driving schedule and charging nightly. A majority of the CO2 emissions come from the vehicle when using gasoline.
Figure 3-10 Fuel-Cycle and Vehicle CO2 Emissions
3.5 Other Vehicle and Component Issues
Several issues regarding vehicle components are discussed in this subsection to provide an independent “reality check” on modeling results since ADVISOR did not model them. They include the number of motors used, engine durability, engine selection, use of continuously variable transmissions, cabin heating, battery pack placement, the “turtle light” issue, as well as battery selection, life requirement, and cooling considerations. These issues need scrutiny beyond the level applied in this study because each of them is likely to become important in the commercialization of HEVs.
3.5.1 Number of Drive/Traction Motors
Because of the expected lower cost, this study only considered HEV designs using a single electric drive motor for vehicle traction. However, this design requires that the same motor starts the engine and propels the vehicle without major interruption to the driver and passengers. If instead a separate starter motor were used, it would be subject to many more (e.g., over 20 times as many) starting events as the starter motor for a conventional vehicle. As a result, the very rugged supplemental starter motor required for an HEV would cost significantly more than the units in conventional vehicles.
3-41

HEV Performance, Efficiency, and Emissions
The need for a second motor depends on the design of the HEV. Of the two HEVs currently on the market in the U.S., the Toyota Prius (with its electric continuously variable transmission) uses two motors while the Honda Insight (with a manual transmission) uses one motor. Although the use of only one motor in an automatic transmission HEV has been demonstrated in prototype vehicles, it is not a proven concept for commercial vehicles at this time. In light of these facts, the consideration of only a single motor in this study provides a cost advantage for the HEVs.
3.5.2 Engine Durability
Each charge-depleting hybrid vehicle (HEV 20 and HEV 60) would require an electric oil pump for the engine or some method of lubrication so that it may be lubricated when not in use. In particular, if the HEV 60 were being used in the electric mode for several months and the engine were required to start, all the engine oil might have drained from the top of the engine causing a durability issue. A lubrication system may be required to keep the engine lubricated even though the engine is not running. Applicable electric oil pumps are readily available in the after market for a low cost or conversely, the power train computer could occasionally turn the engine on. This issue was identified but not examined further in this study.
3.5.3 Engine Selection
Toyota has developed a special Atkinson engine for the Prius. Such an engine can be used in all the hybrids studied in this study. The control of this engine in our study was not necessarily optimal, and more specific engine designs for hybrids can improve the efficiency further.
3.5.4 Continuously Variable Transmission (CVT)
It is assumed in the cost portion of this study30 that all HEVs will use a CVT to reduce costs and provide an output shaft for driving accessory loads with the electric motor when the engine is not running with the vehicle stopped. A CVT is ideal for blending the power and input shaft speed from the engine and motor. A CVT also reduces mass and is much simpler compared to traditional transmissions. It provides the torque multiplication ratio needed to optimize engine and motor efficiency for all conditions resulting in improved fuel economy. Although several car and truck manufacturers, including Nissan, Subaru, Renault, Fiat, Honda, and Volvo have started to use CVTs in some of their vehicles, a CVT (computer) model was not yet ready for use with ADVISOR at the start of this study. As a consequence, a less efficient 5-speed automatically shifted manual transmission was used in the modeling using ADVISOR to determine performance and determine fuel economy. The base case conventional car used an automatic transmission in the cost analysis and to determine the vehicle mass, but during ADVISOR modeling of fuel economy, a surrogate had to be used for the automatic transmission.31
While CVTs have a long history in compact cars, there is some question regarding the ability of CVTs to meet the higher torque requirements of mid-size cars, and maintain durability. 30 The CVT was also an assumption in the calculation of the vehicle masses used in the ADVISOR model to calculate fuel economy. 31 A four-speed automatically shifted manual transmission was used.
3-42

HEV Performance, Efficiency, and Emissions
However, CVTs are clearly being developed for mid-size and larger cars. For example, a CVT (with a Van Dorn belt) has been in a commercial mid-size 2.8 liter car for over a year (MY 2000 Nissan Premera, which is sold in Japan). The 2002 Audi A4 will use a different technology called a CVT chain.32 In addition, a 350-hp hybrid electric SUV with 60 miles AER and a Van Rooij chain-type CVT is now being demonstrated at U.C. Davis.
3.5.5 Cabin Heating
The scenarios studied considered fuel-fired heaters for cabin heating as well as catalyst heating. The study concluded that this function could be done with the engine (running it inefficiently), or with PTC (Positive Thermal Coefficient) resistive heaters. This study assumes that the engine with SULEV emission controls would be used for supplemental heat. Fuel cell vehicles and battery electric vehicles with a fuel-fired heater are allowed by ARB to meet ULEV emission levels that, however, exceed SULEV NOx and ROG levels by a factor of 10.
3.5.6 Battery Pack Placement/Location
The placement of battery packs in the Lumina-derived HEV 60 is an important issue that was not resolved on the level of vehicle design used in this study. Future studies should examine the design and associated cost issues posed by plug-in HEV batteries, especially the larger packs of HEV 60 designs, because of their volume requirements. Several potential solutions were identified, including use of liquid-cooled batteries, batteries with improved energy density, use of taller vehicles, placing the engine in the rear, multiple battery packs, and ground up vehicle designs. These and other possible solutions remain to be explored in future studies. Cost issues and the need for trade-offs are likely consequences, but so are opportunities to improve the basic vehicle by lowering the center of gravity and improving the front to rear mass distribution closer to the ideal 50/50.
3.5.7 “Turtle” Light (Battery Reserve Capacity)
If the driver demands power in excess of engine peak power for extended periods, the HEV battery can become almost fully discharged during operation, and only the engine is available to produce drive torque and power. In the Japanese version of the Toyota Prius, this state of reduced performance is indicated by a turtle icon on the dashboard. (Toyota recognized the different needs of the U.S. market and increased the engine size of the U.S.-version Prius that, as a consequence, sees fewer instances of low performance.)
The HEVs in this study were designed so that this low-charge battery condition arises only under unusual circumstances. For example, the HEV 0 was designed with greater battery capacity than the Prius and Insight and will exhibit reduced performance only after more than one minute of full-power use. Such a condition could result from hard acceleration on steep hills, or after a number of successive full-power acceleration and braking cycles, both rare occurrences.
32 There are at least three types of CVT chain technologies (Borg Warner, Luk, Van Rooij, as well as other proprietary efforts.)
3-43

HEV Performance, Efficiency, and Emissions
The HEV 20 design of this study employs a somewhat smaller engine than the HEV 0, but its battery capacity is about twice that of the HEV 0. As a result, this HEV 20 would reach a “turtle light” low performance condition even less frequently than the HEV 0. The HEV 60, with its yet smaller engine but 3-fold larger battery capacity than the HEV 20, would show reduced performance only after long periods of maximum acceleration or very long periods of moderate acceleration, even when starting the acceleration at a low battery state of charge (SOC). Indeed, one reason for setting the normal minimum state of charge for the HEV 60 (and HEV 20) at 20% SOC was to provide a cushion for periods of aggressive driving. Even when starting at 20% SOC, the HEV 60 can provide approximately two continuous minutes of full-power driving, an extreme condition, before fully discharging the battery. Thus, the HEV 60 vehicle modeled in this study would almost never exhibit reduced performance.
3.5.8 Battery Life Requirement
Battery cycle life is sometimes included among performance specifications because the performance of HEV (like EV) batteries deteriorates with continued cycling and thus can degrade vehicle performance over time. EV battery service life is normally defined as the number of 80% depth-of-discharge cycles a battery can deliver at a specified discharge rate (typically, at the 3-hour rate = C/3) until its storage capacity(C) has decreased by 20%.
For HEV 0s, the capability of delivering relatively short pulses at a specified peak power is the critical battery characteristic, and life criteria are formulated accordingly. For example, the Partnership for the New Generation of Vehicles (PNGV) specifies that such a battery must be able to deliver at least 200,000 pulses of 25 Wh energy, or 50,000 pulses of 100 Wh, at 25 kW peak (pulse) power during its service life. The cycle life requirements to be met by HEV 20 and HEV 60 batteries qualitatively resemble those for EV batteries: a large number of shallow discharge/charge cycles for acceleration and regeneration, superimposed over a smaller number of the deeper (and slower) cycles required for delivering the vehicles’ electric range. However, quantitatively, the deep cycling requirement for plug-in HEVs is more stringent than for EVs since, for same number of lifetime vehicle miles driven electrically, plug-in HEVs need to deliver a larger number of cycles. Since HEVs also operate in gasoline mode and accumulate gasoline miles, total vehicle miles during the battery’s lifetime are generally greater for HEVs.
More detail on HEV battery cycle life and replacement requirements, and possible strategies for economic maximum use of HEV 20 and HEV 60 battery life, are presented in Section 4.2 in conjunction with the discussion of HEV operating costs and economics.
3.5.9 Battery Selection
The WG selected nickel metal hydride (NiMH) batteries as the storage technology most likely to meet the combination of performance and cycle life criteria for the various HEV types. During this decade, NiMH batteries have already proven themselves in the Prius and Insight HEVs, and several developers appear to have NiMH battery designs capable of meeting or approaching the performance requirements for HEV 20 and HEV 60 applications, although meeting the cycle life requirements will be a challenge. While less costly on a kWh basis, lead acid batteries were not
3-44

HEV Performance, Efficiency, and Emissions
considered due to their limited life (both cycle and calendar) which would require battery replacements several times over the life of an HEV. New advanced lead acid batteries with extended cycle lives might change this picture, but proof of this capability still is needed.
The specific power of batteries for the HEV configurations was modeled from existing battery technology, as indicated in Table 3-4. The battery power and energy levels required by the HEVs modeled in this study did not correspond precisely to the specifications of available designs. However, it is very likely that the leading NiMH battery suppliers can meet these specifications well before 2010 through evolutionary design changes.
3.5.10 Battery Cooling
Electric losses in the battery during charging and discharging generate heat that must be removed by flow of air or liquid coolant to keep the battery temperatures under control. All types of HEV batteries will require cooling systems and controls. Generally, larger batteries (e.g., for the HEV 60) have lower resistance and power density but must deliver higher total power. As a result, battery cooling capacities will differ much less than battery capacities. In other words, the larger packs’ cooling needs are not proportional to their size, and large packs need proportionally less cooling. In determining vehicle cost and mass, a liquid-cooled battery thermal management system was assumed to be used for next-generation NiMH batteries, because it requires much less volume and uses less energy per kWh of battery; see also Table 4-4 and Section 4.2.1.2.6.
3-45


4 HEV COSTS
4.1 Overview
The WG employed two cost methodologies to estimate component costs and vehicle retail price equivalent (RPE) for the various hybrid designs. They provide a reasonable bound on vehicle retail price equivalent comparison between the various types of HEVs and CVs described in this report. In this section, bottom up RPE analyses are provided as well as vehicle operating costs for the various conventional and hybrid configurations for the mid-size vehicle. Because of the complexities, uncertainties, and proprietary information involved, the WG did not attempt to turn RPE into manufacturer suggested retail price (MSRP) or “transaction price,” which is the key measurement when discussing customer preference in Section 5. Data that support the charts and tables in this section can be found in Appendix C.
4.2 Methodology
Vehicle RPE and operating cost methodologies are discussed in this section. Two methods of estimating RPE are described in this section, one suggested by an automobile manufacturer representative in the WG (adopted as “Base Method” by the group), and one developed by Argonne National Laboratory (“ANL Method”). Both methods calculate RPE by starting with individual component costs and applying the appropriate overheads and mark-ups. In the first method, component costs are assumed to be what a manufacturer would pay to manufacture them; the other assumes that the electric components would be procured from outside vendors and their costs would represent what a vehicle manufacturer would pay a supplier for them. Mark-up factors for manufacturer and dealer overhead, profit and warranty are then applied and allocated development costs for developing the vehicle are added. Extensive discussions of the two vehicle cost estimating methodologies led WG members to the conclusion that the vehicle RPEs estimated with the Base and the ANL method are likely to yield upper and lower bounds, respectively. Vehicle operating costs include cost of “fuel” (i.e., gasoline, as well as electricity to charge plug-in HEV batteries) and scheduled maintenance. All costs are estimated in year 2000 dollars for production levels of 100,000 units per year, in the assumption that these production levels would be attained by 2010 for a commercially successful vehicle. The component cost estimates allow for cost reductions through technological advances likely or feasible to occur by the year 2010. Vehicle RPEs and operating costs are discussed in the sections below.
4-1

HEV Costs
4.2.1 Vehicle RPE
Both methodologies used for calculating vehicle RPE are described in this section. The first method (Base Method) uses a modified version of the Retail Price Equivalent (RPE) formula developed by Lindgren [11]. The Base Method RPE includes such items as cost to manufacture the components (raw cost), manufacturing overhead, warranty costs, and profit, and dealer overhead and profit. Manufacturing overhead, warranty costs, and profit are combined in one mark-up factor, while dealer overhead and profit are combined into a different factor. Development costs are then added to the marked-up cost. Battery module costs are marked up separately, as described in Section 4.2.1.3. The formula is as follows:
sCosttDevelopmenAmortizedupMarkDealerupMarkModuleBatteryCostModuleBattery
upMarkerManufacturCostsComponentRPE ���
���
��
� ���
����
�
The second method, developed by ANL (ANL Method), also is a modification of Lindgren’s RPE formula. ANL assumes that a manufacturer will procure electric components from outside suppliers. Their costs represent what a manufacturer would pay a supplier and as such already include component-level development costs, overhead, and profit margins. Instead of having separate mark-ups for manufacturer and dealer overhead and profit, these are combined into one mark-up factor that also includes development costs. Battery modules are marked up separately as is described in Section 4.2.1.3. The formula is as follows:
upMarkModuleBatteryCostModuleBatteryupMarkCombinedCostsComponentRPE ������
4.2.1.1 Representative Costs: Conventional Vehicle
Conventional vehicle (CV) costs are determined from model year 2000 MSRP for the representative mid-size vehicle chosen, a model year 2000 Chevrolet Lumina. The Chevrolet Lumina has an MSRP of $18,890.
4.2.1.2 Component-Based Cost Analysis
The costs of CV and hybrid electric vehicle (HEV) components to the vehicle manufacturer are discussed in this section. Several components common to both the CV and HEV are combined into the “glider.” The glider includes the vehicle chassis, body, brakes, steering system and suspension, wheels, tires, and other components that are common between CV and HEVs. Components specific to HEVs include HEV gasoline engines, the transmission, the electric traction motor and related power electronics, accessories specific to HEVs, the energy storage system including the battery pack and the required controls and hardware, and the charger. The Base Method assumes the component costs discussed in the sections to follow only include materials and assembly costs to assemble the components. On the other hand, the ANL Method assumes that electric component costs also include some warranty costs and research and development costs, as well as supplier overhead and profit, because these parts have been supplied to the manufacturer by an outside vendor. Component cost formulas used in this study are listed in Appendix C.
4-2

HEV Costs
4.2.1.2.1 Glider Costs
It is assumed in this study that HEVs use bodies that are similar to CVs and look identical. This allows the use of a glider common with the CV, which reduces costs. Glider costs were estimated in this study by deleting dealer and manufacturer mark-ups from the typical conventional vehicle MSRP and then subtracting the costs of a conventional vehicle power train. Using this approach, the cost of a glider for the mid-size vehicle (without mark-ups) was estimated at $7,150 using the Base Method and $5,760 in the ANL Method.33
4.2.1.2.2 Engine Costs
The cost of manufacturing various engine types were provided by an automobile manufacturer within the WG. Engine costs are assumed to be the same whether the engines are built by the OEM or purchased from an outside vendor. Figure 4-1 shows engine costs for L-4, V-6, and V-8 engines. The L-4 curve can also be used to calculate costs of L-3 and smaller engines. In addition to direct costs for the engine, costs for the engine thermal management system were estimated at 23.6 cents per kW of engine power and added to the above costs. The cost of the exhaust system for the conventional vehicle was estimated to be $300 for a V-8, $250 for a V-6, $200 for an L-4 and $150 for an L-3. It was assumed that the exhaust system includes a three-way catalyst capable of reducing exhaust emissions to SULEV emission levels, but no detailed cost study for that type of system was performed. Table 4-1 shows engine specifications and total engine system (engine, exhaust, thermal) costs for the mid-size vehicle configurations.
Figure 4-1 Engine Cost as a Function of Engine Power
33 The difference between these two glider costs is an anomaly of applying two different methods in the same way. Since the component costs for the CV power train are assumed to be the same and the MSRP of the CV is assumed to be the same for the two methods, the main difference is the mark-ups to calculate vehicle RPE. See Section 4.1.2.3 for details on mark-ups for the two methods.
4-3

HEV Costs
Table 4-1 Engine Specifications and System Costs for the Mid-Size Vehicle
Vehicle Configuration CV HEV 0 HEV 20 HEV 60
Engine Power 127 kW 67 kW 61 kW 38 kW
Engine Type V-6 L-4 L-4 L-3
Engine System Cost $2,360 $1,440 $1,370 $1,040
4.2.1.2.3 Transmission Costs
All HEVs analyzed in this report were assumed to have continuously variable transmissions (CVT).34 The CV, on the other hand, was assumed to have a normal automatic transmission. CVTs with advanced controls allow hybrids to maximize fuel efficiency by always operating the engine in the peak-efficiency operating range. In addition, CVTs provide an output shaft for driving HEV accessories with power from either the engine or from the battery-motor combination when the engine is turned off during stops and in the all-electric mode. The cost of an automatic transmission was taken from the MY 2000 Chevrolet Lumina price list at $1,045. CVTs were estimated by the WG to be $625 for the mid-size vehicle. CVTs have only about 10% of the components required for an automatic transmission and thus are expected to be significantly less expensive to manufacture in volume.35
4.2.1.2.4 Electric Traction Costs
The electric traction system in an HEV includes the electric traction motor, motor controller, and the thermal management for the power electronics. Traction motor options for HEVs include DC motors (both series and shunt), AC induction motors, and DC brushless permanent magnet (BPM) motors. The power electronic controllers used with these motors are usually, pulse-width modulation types, using insulated-gate bipolar transistors (IGBT) power electronic devices. High-power controllers require cooling that is performed by a thermal management system comprising heat transfer devices and fluids (air or liquid), fans or pumps, a radiator, and a control system.
AC induction motors are widely used in industry and have the lowest cost per kW but use simpler constant speed motor controllers, while variable speed controllers are needed for EV and HEV applications. BPM and induction motors can operate at any speed. The BPM motor gearbox is smaller, less complex, and somewhat more efficient. Also, BPM motors are easier to control than AC induction motors. For these reasons, a BPM motor was used in this analysis. Costs of BPM motors vary from vendor to vendor, depending mostly upon production volumes. Currently, such motors are produced in the 20,000 units per year range, but for this cost analysis it was assumed that by 2010, HEVs would be produced in quantities of 100,000 per year. 34 Because the current version of the ADVISOR model is unable to model CVTs, the HEV configurations used to determine performance and fuel economy were assumed to have automatically shifted 5-speed transmissions. 35 It should be noted that CVTs are also considered feasible for CVs. Should future model year CVs use CVTs, their costs will be $420 lower and the price premium for HEVs will be increased by the same amount.
4-4

HEV Costs
Additional mass production cost reductions could be realized if permanent magnets are also used in other applications.36 Figure 4-2 shows BPM traction motor costs per kW for several studies and different production volumes. Estimates by ANL [12] for EV applications indicate that, if permanent magnets are used also for other large-volume applications, BPM motors could be produced at $10.50 per kW for a 70 kW motor. Lipman [13] indicates that in quantities of 200,000 units per year, BPM motors of a similar size could be produced at $12.50 per kW. As part of the WG study, Vyas [14] estimated BPM motors in quantities of 100,000 to cost approximately $16 per kW. The WG agreed on using $13.70 per kW plus $190 or approximately $16 per kW as a conservative cost for traction motors. Lower cost estimates for BPM motors were suggested by some members of the WG based on higher production volumes and use of permanent magnets in other markets. For example, the PNGV goals are very aggressive at $4 per kW, but these are for very large production volumes and barely cover the cost of materials. Nevertheless, PNGV’s development contractors have confidence that their low motor cost projections can be attained in mass production. In the WG’s view, this situation argues for a closer examination of BPM motor cost projections.
Figure 4-2 Traction Motor Costs as a Function of Production Volumes
36 Under this assumption of additional markets for permanent magnets reaching 400,000 units per year, the cost for the BPM motors would be $150 + $8/kW or about $10.50 per kW. ANL estimates BPM motors in quantities of 100,000 units per year would cost approximately $11.80 per kW if permanent magnets were produced only for these motors.
4-5
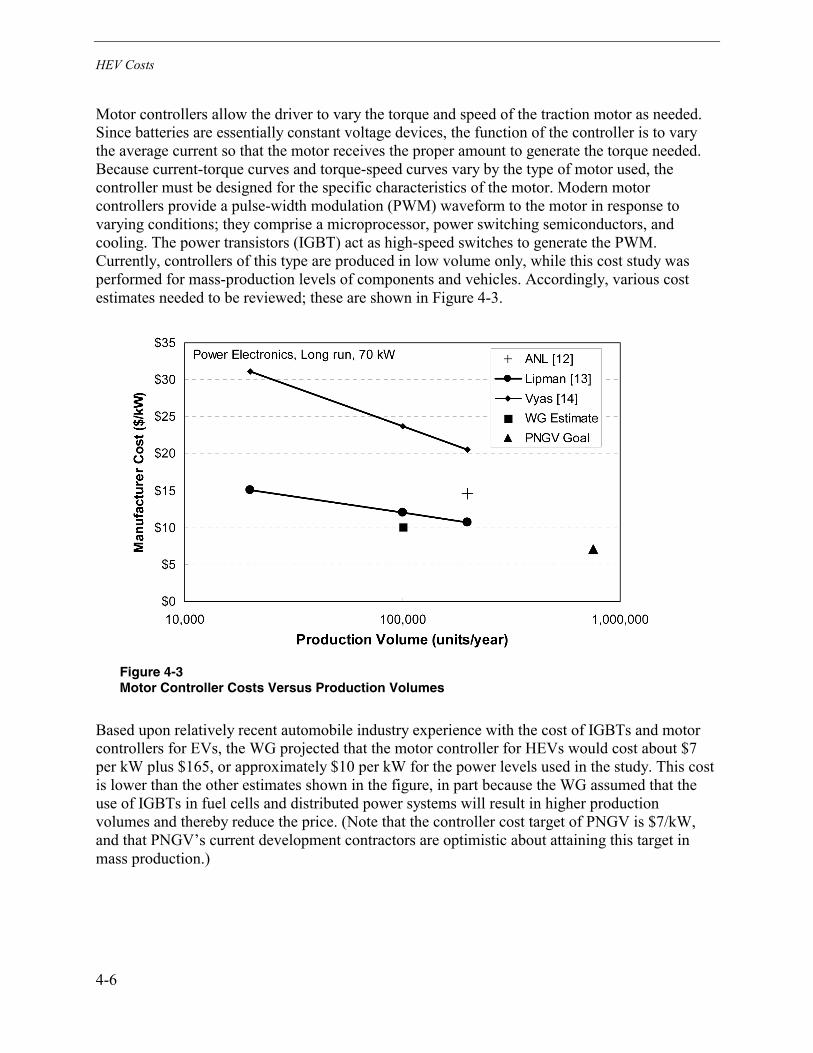
HEV Costs
Motor controllers allow the driver to vary the torque and speed of the traction motor as needed. Since batteries are essentially constant voltage devices, the function of the controller is to vary the average current so that the motor receives the proper amount to generate the torque needed. Because current-torque curves and torque-speed curves vary by the type of motor used, the controller must be designed for the specific characteristics of the motor. Modern motor controllers provide a pulse-width modulation (PWM) waveform to the motor in response to varying conditions; they comprise a microprocessor, power switching semiconductors, and cooling. The power transistors (IGBT) act as high-speed switches to generate the PWM. Currently, controllers of this type are produced in low volume only, while this cost study was performed for mass-production levels of components and vehicles. Accordingly, various cost estimates needed to be reviewed; these are shown in Figure 4-3.
Figure 4-3 Motor Controller Costs Versus Production Volumes
Based upon relatively recent automobile industry experience with the cost of IGBTs and motor controllers for EVs, the WG projected that the motor controller for HEVs would cost about $7 per kW plus $165, or approximately $10 per kW for the power levels used in the study. This cost is lower than the other estimates shown in the figure, in part because the WG assumed that the use of IGBTs in fuel cells and distributed power systems will result in higher production volumes and thereby reduce the price. (Note that the controller cost target of PNGV is $7/kW, and that PNGV’s current development contractors are optimistic about attaining this target in mass production.)
4-6

HEV Costs
Cooling is necessary for high-power controllers such as those used on HEVs. The WG estimated that the required thermal management system would cost $1 per kW plus $70. Total electric traction system (motor, controller, thermal) costs to the manufacturer estimated by the WG for the mid-size hybrid vehicles are given in Table 4-2.
Table 4-2 Electric Traction System Costs for the Mid-Size Vehicle
Vehicle Configuration HEV 0 HEV 20 HEV 60
Motor Size 44.3 kW 51.3 kW 74.7 kW
Traction System Cost $1,390 $1,540 $2,050
4.2.1.2.5 Accessory Costs
In CVs, accessories requiring significant power are usually mounted on and driven by the engine through belts and pulleys. Key accessories include the alternator, power steering pump, air-conditioning compressor, and a cooling fan. Other accessories such as brakes, HVAC valves, etc. are often actuated by vacuum from the engine intake manifold. In an HEV, the engine is not operating when the vehicle either stopped or (for plug-in HEVs) operating in all-electric mode. Also, the HEV traction motor is not operating when the vehicle is stopped. Thus, a special set of electrically powered accessories is required for an HEV. As noted above, in an advanced-design HEV, the transmission37 is assumed to drive the accessories, requiring the traction motor to operate even when the vehicle is stopped temporarily (with the transmission in neutral). Also for HEVs, an accessory power module (APM) is needed to run the electrical system (lights and other electric loads) since the main storage battery is at a much higher voltage than the electrical system requires. Assuming that the HEV’s power steering pump, air conditioning compressor, and vacuum pump can be powered by the transmission, the main cost difference between CV and HEV accessories is the cost of the APM. Accessory costs for various vehicle configurations for the mid-size car are shown in Table 4-3.
Table 4-3 Accessory Costs for the Mid-Size Vehicle
Vehicle Configuration CV HEV 0 HEV 20 HEV 60
Accessory Costs $210 $300 $300 $300
4.2.1.2.6 Storage System Costs
The battery system is the major contributor to HEV costs, and battery capacity and costs increase with HEV all-electric range capability. In addition to battery modules (groups of electrochemical cells normally packaged together physically and connected electrically in series), several other subsystems contribute to storage system costs. Unfortunately, very little information is available 37 While this is possible to do this with a manual transmission, an automatically shifted manual transmission, or a CVT, it is more difficult and costly to do it with an automatic transmission.
4-7

HEV Costs
on life and cost of mass-produced HEV battery modules and systems, including the NiMH batteries used in the commercially available Toyota Prius and Honda Insight HEVs. Accordingly, for HEV cost comparisons the WG had to estimate battery module and other subsystem costs, as discussed in the next subsections.
4.2.1.2.6.1 Battery Module Cost
It has been proposed that, in first approximation, HEV module specific costs (i.e., module costs per kWh of capacity) be estimated from the better-known EV module specific cost by multiplying EV module cost per kWh with the ratio of the EV module and HEV module specific energies [15]. The assumptions underlying this simple model is that, in mass production, EV as well as HEV module costs are largely determined by materials costs, and that the materials needs (and costs) for EV and HEV modules of a given storage capacity are inversely proportional to their specific energies.
To derive quantitative estimates with this model, the WG relied on a specific cost projection of approximately $250/kWh for mass-produced NiMH EV battery modules, as reported recently by the Battery Technical Advisory Panel [1]. This $250/kWh estimate is recognized to be the lowest probable cost for NiMH battery modules in 2010. Current prices for battery modules at low production volumes are approximately $900 to $1200 per kWh. The specific cost points shown in Figure 4-4 were developed by the WG using this assumption, the above formula by Kalhammer, and the battery specific energy and power data given in Table 3-4 for three different NiMH HEV battery designs of the Ovonic Battery Co.
Figure 4-4 NiMH Battery Module Costs for Different HEV Battery Types
4-8

HEV Costs
4-9
4.2.1.2.6.2 Other Battery Component Costs
Based on estimates from automobile manufacturers that produce EV battery packs, costs of other battery components were estimated by the WG. Battery system costs in addition to module costs include the costs for the battery pack tray at $130 plus $5 per kWh, pack hardware including the battery control system at $460 plus $5 per kWh, and the battery thermal management system at $90 plus $3 per kWh. The fuel tank for the gasoline engine and the accessory battery are also included in the storage system costs. The total energy storage system costs for mid-size HEVs are given in Table 4-4.
Table 4-4 Energy Storage System Costs for the Mid-Size Vehicle
Vehicle Configuration HEV 0 HEV 20 HEV 60
Battery volume (l)38 18.9 liters 38.2 liters 116.5 liters
Battery Energy 2.91 kWh 5.88 kWh 17.94 kWh
Battery Power 49 kW 54 kW 99 kW
Power to Energy 16.8 W/Wh 9.1 W/Wh 5.5 W/Wh
Specific Energy 39 Wh/kg 48 Wh/kg 71 Wh/kg
Storage System Cost $1,900 $2,660 $5,780
Plug-in HEV battery size and, therefore, battery costs are predicated on the assumption that the routinely usable energy capacity of NiMH batteries is only 80% of the total battery capacity because fully discharging NiMH and other types of batteries can significantly reduce battery life. Some battery manufacturers, however, claim that their NiMH batteries can be almost completely discharged (down to 0% SOC) on a regular basis without significantly affecting battery life. If the usable range of a battery is assumed to be 90% instead of 80%, battery size could be reduced by 11%. This would reduce HEV 60 energy storage system costs by more than $500 as well as provide the additional benefit of increased fuel economy due to the reduced vehicle mass.
4.2.1.2.7 Charger Costs
In order to charge the batteries of a HEV 20 or HEV 60 from the electric power grid, a charger is needed to convert AC power from the grid to DC with the voltage (typically 150-300V) needed to charge the batteries while also controlling the rate and end of charging to prevent excessive overcharging. To prevent electrical hazard to the user, chargers require a ground fault circuit interrupt (GFCI) function. Currently, inductive and conductive charging systems are in use. In conductive charging, electricity from the grid is transferred through a conducting connection to
38 Based on technology currently in commercial production and listed at 154 wh/liter in the Battery Technical Advisory Panel report [1]. The above volumes do not include battery management or battery cooling systems (air or liquid) that also must be considered.

HEV Costs
the charger that can be located off-board or on-board the HEV. For inductive charging, a paddle-like inductor terminates the power cord. This paddle is inserted into the vehicle where the inductor generates a magnetic field inside a transformer that in turn, induces a current in the current pick-up on the vehicle.
The WG assumed that the HEVs modeled in this report would have an integrated, on-board conductive charging system. In this integration, the charging system shares power electronic components with the motor controller and uses the traction motor winding for inductance, with the objective to reduce the combined costs of charger and controller. Additional components needed on the vehicle include an electromagnetic interference (EMI) filter and contactor, an isolation transformer, an SAE J1772 compatible connector on the inverter/charger, and a connector to attach a cable on the vehicle. The cable includes the GFCI, a relay, and a SAE J1772 compatible connector. Costs for a system capable of utilizing either 120V or 240V circuits are shown in Table 4-5.
Table 4-5 Charger Component Costs
Component Cost
EMI Filter and Contactor $175
Isolation Transformer $125
Connector $50
Connector on Vehicle $30
Total Charger Cost $380
120 V Capable Cable $80
240 V Capable Cable $150
As shown in Table 4-6, the HEV 20 battery can be charged in less than 5 hours with a 120 V, 15A charger. The HEV 60 battery can be charged from empty in less than 11 hours (e.g., overnight) with a 120 V, 20 A charger, so both vehicles can come standard with a 120 V cord.39 Faster charging is possible with a 240 V 40 A charger such as might be available at public EV charging stations. The WG estimated the cost of installing an additional 120V, 20 A circuit and outlet near the electrical panel of a residential or commercial building (or upgrading an existing 15 amp circuit) at $200 and the cost of adding a 240V 40 A circuit at $1,000.40
There are infrastructure issues that have been identified which affect some customers. These include 15 amp versus 20 amp circuit breakers and multiple GFCIs in series issues. These infrastructure issues will need to be addressed and are dependent upon the final design of the vehicle. 39 It should be noted that it is unlikely that an HEV 60 will be fully discharged during a given travel day. Thus charging times from a higher SOC to full capacity will be shorter if charged nightly. 40 In addition, some utilities use a time-of-use meter to obtain lower electricity prices (like the $0.06/kWh estimated in this study), which adds an additional $235 for installation of such a meter. At least one utility does not use a TOU meter for the lower rates (which can be linked to ownership or miles traveled).
4-10

HEV Costs
4-11
Table 4-6 Charging Time for Various Circuit Voltage and Amperage Levels
Charging Time (To Charge Empty Packc)
Charging Circuit Charger
Sizea Charging
Rateb Infrastructure
Costs HEV 20 HEV 60
Pack size — — 5.9 kWh 17.9 kWh
Rated pack sized — — 4.7 kWh 14.4 kWh
120 V 15 amp 1.4 kW 1.0 kWh/hr $0 4.7 hrs 14.3 hrs
120 V 20 amp 1.9 kW 1.3 kWh/hr $200 3.5 hrs 10.7 hrs
240 V 40 amp 7.7 kW 5.7 kWh/hr $1,000 0.8 hrs 2.5 hrs a An 80% required safety factor for continuous charging is used. b Charger efficiency assumed to be 82% for 120 V chargers and 87% for 240 V chargers c Battery efficiency assumed to be 85%. d Rated pack size assumed to be 80% of nominal pack size.
4.2.1.3 Mark-up Factors
Mark-up factors were used to estimate the vehicle RPE from manufacturer component costs (or raw costs of purchasing and assembling the materials), as described in Section 4.2.1. Mark-up factors include overhead (warranty, R&D/engineering, plant depreciation/amortization), cost of general corporate overhead, cost of retirement and health overhead, cost of selling (dealer’s invoice discounts, holdback, manufacturer rebates, advertising, other dealer support costs) and profits (manufacturer and dealer margins).
In the Base Method, two separate mark-ups are used. The first is a manufacturer mark-up that includes assembly labor to integrate the components into the vehicle, manufacturer overhead, and profit. A second mark-up factor, the dealer mark-up, is applied to the marked-up manufacturer costs. It includes dealer overhead, vehicle transportation, and sales commissions. The amount of mark-up applied varies from manufacturer to manufacturer and from study to study, as reported by Delucchi [16]. Delucchi lists manufacturers’ mark-up factors of 1.33 to 2.24 (i.e., 33 to 124%) and dealer mark-ups from 1.10 to 1.31. For the Base Method, the WG used an intermediate manufacturer mark-up of 1.5 times the previously described component costs and a dealer mark-up of 1.163 times the marked-up manufacturer price. As a compromise for the higher manufacturer and dealer mark-ups, the WG decided to use a fixed mark-up on battery costs that minimizes the additional cost of larger batteries because it believed there would be small differences between large and small battery packs on assembly, testing, and storage costs, and that some of the warranty costs would be borne by the battery supplier.41 Under this assumption, smaller capacity batteries might have a higher percentage mark-up than the larger ones. Battery module costs were segregated from the above methodology, then added back with mark-ups of $800 for the HEV 0, $850 for the HEV 20 and $900 for the HEV 60. This resulted in mark-ups on battery modules of 69% for the HEV 0, 45% for the HEV 20 and 19% for the HEV 60. In addition, the 16.3% dealer mark-up was added to these marked-up battery module costs before they were added to the vehicle RPE. As described in Section 4.2.1.4, an amortized development cost also was added to the final vehicle RPE.
41 This approach was very controversial within the WG due to the concern over potential uncertain additional costs.

HEV Costs
In the ANL method, the manufacturer and dealer mark-ups were combined into one mark-up. Because this method assumes that the electric component prices determined in Section 4.2.1.2 were costs that a vehicle manufacturer would pay a supplier, they already include the warranty, research, engineering and plant depreciation portions of the mark-up described above in the Base Method. It is also assumed that electric component development costs are included in the mark-up as a portion of development is done by the suppliers and already in the cost of components. Specifically, a mark-up factor of 1.5 was used for components supplied from an outside vendor and a mark-up factor of 2.0 was used for the parts manufactured by the original equipment manufacturer (OEM). Battery module costs were also segregated from the ANL methodology and fixed mark-ups were applied as in the Base Method. In the ANL Method, however, no additional dealer mark-up on battery module costs was applied. The ANL method results in a lower RPE in large part due to less mark-up for the dealer on the battery modules. ANL derived the mark-up factors from analysis of conventional vehicle cost structures, which matched earlier analyses by C. Borroni-Bird [17] and the Office of Technology Advancement [18]. See Appendix C.4 for more details on the ANL method and on battery mark-ups used for both methods.
Although not part of this study, it is well known that manufacturers use several other factors to determine vehicle price, including the buyer perception of vehicle value and/or desirability, as well as others. HEVs provide added value to the consumer beyond CVs and, therefore, may command a higher price. To the manufacturer, HEVs could provide CAFE and possibly PZEV credits that might allow them to build additional, more profitable vehicle types with poorer fuel economy and emission characteristics while still meeting corporate average requirements. Establishing a technologically advanced or environmental image for the automaker or seeking to capture fleet or young buyers also can factor into the final retail price [19, 20]. How manufacturers would actually price HEVs using internal cross-product-line subsidies is a matter of debate. Precedents are now being set by Honda’s Insight and Toyota’s Prius. The method used to determine these pricing strategies was not available to the WG. The vehicle price issue is discussed in more detail in Section 5 in conjunction with the Choice- Based Market Modeling results where, as expected, consumer interest is shown to depend on the “transaction” price for which assumptions had to be made.
4.2.1.4 Development Costs
Development costs are added to the marked-up manufacturer and dealer costs in the Base Method to cover such items as dealer and service department training, tooling, and engineering development. Typically, these costs are amortized over 5 years of 100,000-unit annual production of each model. No mark-up on development costs is applied for either the manufacturer or dealer. Development costs per vehicle for the various vehicle designs are shown in Table 4-7. Development costs are assumed to be part of the mark-up in the ANL Method [21].
4-12

HEV Costs
Table 4-7 Development Costs per Vehicle (Base Method only)
Vehicle CV HEV 0 HEV 20 HEV 60
R&D Costs $90 $440 $460 $460
4.2.2 Operating Costs
Operating costs estimated in this study include the cost of fuel (gasoline, and in the case of plug-in HEVs, electricity), maintenance costs, and the cost of battery replacements if needed during the nominal life of the vehicle. Two important parameters are needed to consistently compare operating costs, namely: nominal life and driving schedule. The driving schedule (daily miles, urban miles versus highway miles, annual miles) determines the amount of miles an HEV drives annually and during its lifetime as well as the amount of electric only miles driven by plug-in HEVs. These in turn can be used to calculate fuel use costs and maintenance costs as well as determine battery replacement frequency. All these topics are discussed below.
4.2.2.1 Nominal Vehicle Life
Nominal vehicle life defines the time period and miles driven over which the vehicle investment can be written off. For purposes of this study, the WG adopted a nominal vehicle life of 10 years or 100,000 vehicle miles42, whichever occurs earlier. This also is the target set by PNGV until recently for the life of HEV batteries. Under this assumption, some of the driving cycles discussed in Section 4.2.2.2 reach 100,000 vehicle miles in less than 6 years, while in others the vehicle will reach 10 years before it has traveled 100,000 miles. Because of the importance of the vehicle and battery life topics, the vehicle and component operating life conventions, and the associated questions and life cycle cost impacts, should be critically examined in future analyses and comparisons of CVs and HEVs.
4.2.2.2 Driving Schedules
Driving schedules are used to provide a consistent measure of how an average customer might use a vehicle. Plug-in HEVs can provide substantial all-electric operation, but the extent to which that potential is utilized depends upon driving schedules and charging frequency.
It was found in the Customer Preference Surveys that the most consistently reported variable regarding people’s driving habits was their one-way commute distance to work. To determine reasonable real world driving patterns, results from the Customer Preference Survey were analyzed for city and highway driving for various one-way commute distances. Results were segregated into three commute distance “bins”, (1) drivers who’s commute distance was less than 5 miles one way, (2) drivers commuting 5 to 15 miles one way, and (3) those commuting more than 15 miles one way. Details on driving schedules are given in Table 4-8.
42 Current proposed PZEV requirements set pollution control device and system warranty requirements at the earlier of 15 years or 150,000 miles, but these requirements are not yet finalized.
4-13

HEV Costs
Table 4-8 Driving Schedules
One-Way Commute Distance < 5 mi 5 to 15 mi > 15 mi Average
Annual Vehicle Mileage 7,712 11,937 17,975 13,322
Average Daily Miles 21.1 32.7 49.2 36.5
Average City Miles 47.3% 52.9% 47.2% 49.0%
Lifetime, years 10.0 8.4 5.6 7.5
Lifetime, vehicle miles 77,120 100,000 100,000 100,000
Percent/Number of Drivers from Customer Preference Survey
27.5%/106 30.0%/116 42.5%/164 100%/386
By examining daily miles driven during the week and on weekends for each survey respondent, annual all electric (AE) miles were calculated for the plug-in HEVs that were fully charged each night. Individual AE miles for each respondent and each plug-in hybrid design were then averaged for the three commute bins and overall; the results are given in Table 4-9. Since an HEV 20 might require a battery replacement during the vehicle lifetime (see discussion in Section 4.2.2.6), a special driving schedule was also defined for the HEV 20 in which the vehicle can reach 100,000 vehicle miles without a battery replacement by reducing all-electric operation; this schedule is labeled HEV 20 Limited. Mileage weighted probabilities (MWP) for the four driving schedules are also given in Table 4-9.
Table 4-9 All-Electric Operation for Charging every Day
One-way Commute Distance < 5 mi 5 to 15 mi > 15 mi Average
HEV 20 Limited total AE miles 29,363 29,568 29,360 29,425
HEV 20 Unlimited total AE miles 49,250 45,397 29,981 39,604
HEV 60 total AE miles 58,530 84,075 71,833 75,965
Total Vehicle miles 77,120 100,000 100,000 100,000
HEV 20 Limited MWP 0.38 0.30 0.29 0.29
HEV 20 Unlimited MWP 0.64 0.45 0.30 0.40
HEV 60 MWP 0.76 0.84 0.72 0.76
4-14

HEV Costs
4.2.2.3 Energy Consumption
Energy (motor fuel and electricity) consumption data needed for determination of operating costs were calculated for both CVs and HEVs from their fuel economies over each driving cycle. These, in turn, were derived from the modeling runs discussed in Section 3, but US EPA labeling discounts were applied to the modeling results to better represent real-world driving behavior (such as hard accelerations and air conditioning use) that is not accounted for in the current federal test procedure. Specifically, the FUDS43 fuel economy is multiplied by 0.90 and the HWFET31 fuel economy is multiplied by 0.78. While these factors date to the late 1970s, they are still used in producing the fuel economy figures published in U.S.EPA’s yearly Fuel Economy Guide, in the assumption that the same factors are still representative of today’s vehicles.44
Fuel costs were assumed to be $1.65 per gallon of gasoline, a mid-range value for national gasoline prices at the time of the study. An electricity price of $0.06 per kWh assumes time-of-day EV electricity pricing based upon off-peak battery charging.45, 46
4.2.2.4 Scheduled Maintenance
Maintenance data for CVs are regularly tracked by the American Automobile Association, Runzheimer, Consumer Guide, Consumer Reports, and the Complete Car Cost Guide. Unfortunately, reported maintenance costs vary among sources because there is no consistency as to what is included in scheduled and unscheduled maintenance as well as what is considered maintenance versus fuel consumption. Typically, maintenance data are only given for the first five years of operation and do not include warranty costs. Of the data for CVs, Complete Car Cost Guide [22] gave the most complete data for the various vehicle sizes analyzed in this study. The Complete Car Cost Guide 2000 gave average scheduled maintenance costs of 4.4 cents per mile for the first 5 years of operation for mid-size vehicles.
43 See Section 3.3.1.2 for definitions of the Federal Test Procedure driving cycles. 44 See 40CFR Part 600 Subsection 209 for details on labeling discounts. 45 It should be noted that during the writing of this report, California is currently in an “energy crisis” with spot electricity prices substantially higher than those used in the calculations. While this would change the economics of plug-in HEV operating costs, the WG assumed for purposes of this study that this situation is short term. Specifically, it is assumed that new plants that would add another 25% of California generation capacity are scheduled to come on line in the next few years. Because gasoline prices can be volatile, those prices could increase. In fact, gasoline prices in California are around $2.00 per gallon. Moreover, because of the high electric energy efficiency of plug-in HEVs the fuel price sensitivity of HEV operating costs to electricity price variations is considerably smaller than the sensitivity to gasoline prices. 46 The WG researched the off peak rates for EVs in the four cities used in the customer preference survey (Phoenix, Atlanta, Boston, and Los Angeles) as well as the pilot survey conducted in the San Francisco Bay Area. Participants in the survey saw customized fuel savings for based on the gasoline prices in their area at the time, their driving patterns, and the following off-peak or incentive EV rates (Phoenix = $0.0611 per kWh from average of SRP and APS utilities, Boston = $0.940 per kWh from Boston Edison, Los Angeles = $0.583 per kWh from average of SCE and LADWP, San Francisco = $0.0557 from PG&E, and Atlanta = $0.044 from assumed 40% discount off of local utility rate).
4-15

HEV Costs
Because scheduled maintenance data for HEVs are virtually nonexistent, EV scheduled maintenance data were considered for estimation of HEV maintenance. Unfortunately, even EV data are quite limited. Some anecdotal data exists regarding locomotives and electric trolleys, but they do not provide side-to-side comparisons with conventional vehicles. EV maintenance is being performed on EVs rented at Los Angeles Airport (LAX) but costs were not consistently tracked. Only limited data from SCE on the Toyota RAV4 EVs exist47; these indicate about 25% lower maintenance costs than for equivalent CVs, but SCE believes less maintenance is required than the owner’s manual suggests. A literature survey [12, 16, 23, 24] conducted by the WG revealed that 50% lower EV maintenance costs were usually estimated for modern AC motors or data from old DC motor EV technology. While substantial potential exists for lower maintenance requirements and cost for HEVs operating in electric-only mode, the WG reached consensus to use rather conservative assumptions.
To estimate the difference in scheduled maintenance costs between CVs and HEVs, the WG examined and quantified maintenance items that might be different between an HEV and a CV. Table 4-10 lists the estimated frequencies and costs assigned to scheduled maintenance items. Engine related items depend on engine type, while frequency depends on the proportion of charge-sustaining (gasoline engine) miles. The front brake replacements depend on vehicle miles, but with the assumption that since HEVs use regenerative braking, their brake pads are assumed to last more than twice as long. Rear brake service life was assumed to be the same for CVs and HEVs. Maintenance issues and costs should be reexamined in future studies, as more data on EV and HEV maintenance become available.
Table 4-10 Scheduled Maintenance Items
Item Frequency Costs
Oil and Filter Change Earlier of 6,000 charge sustaining miles or 1 year
Oil: 1 quart per cylinder + 1 quart at $2.50 per quart Filter $10.00 Labor 0.3 hrs @ $70/hr
Air Filter Replacement 30,000 charge sustaining miles V-6 $25, L-4 $20, L-3 $15 0.08 hrs labor @ $70/hr
Spark Plug Replacement 50,000 charge sustaining miles $8.50 per spark plug Labor: 0.08 hours per plug @ $70/hr
Timing Chain Adjustment 90,000 charge sustaining miles 2 hrs labor @ $70/hr
Front Brake Replacement 40,000 vehicle miles for CV, 80,000 vehicle miles for HEVs
Brake costs: $100, 2 hrs labor @ $70/hr
47 SCE has 5.7 million EV miles including 3.8 million miles on 253 RAV4 EVs.
4-16

HEV Costs
4.2.2.5 Unscheduled Maintenance
Unscheduled maintenance data for EVs are very limited and virtually nonexistent for HEVs. In absence of such data — or even data that could be extrapolated to HEV unscheduled maintenance — the WG was not able to determine whether HEVs would have a lower or higher unscheduled maintenance costs than CVs.
4.2.2.6 Frequency and Cost of Battery Replacement
In Section 3.6.8, the battery cycle life requirements of the different HEV types were identified. In the following subsections, these requirements are discussed against the currently demonstrated and/or projected cycling capabilities of applicable NiMH battery designs. In part, these considerations are based on a 1999 analysis of HEV battery performance and life requirements [25] and more recent, limited test stand data for the batteries used in Toyota’s Prius.
4.2.2.6.1 Battery Life
HEV 0 In absence of statistically valid field data, a complex analysis of representative combined urban-highway driving cycles is required to determine the number and energy of the charge-discharge cycles to which an HEV 0 battery is likely to be subjected over the vehicle’s life. Such an analysis underlies the cycle life targets published by PNGV for an HEV 0 battery capable of lasting 100,000 vehicle miles: 200,000 cycles with a pulse energy of 25 Wh or, alternatively, 50,000 cycles with a pulse energy of 100 Wh, delivered over about 12-18 seconds at a peak power of 25 kW. An analysis of HEV battery charge/discharge power characteristics indicates that a NiMH battery of 1 to 3 kWh capacity is required to deliver such pulses [25].
Each set of these energy pulses adds up to 5000 kWh over the life of the battery. For the 2.9 kWh HEV battery assumed in this study (see Table 4-4), 5000 kWh is the energy equivalent of about 2000 deep charge-discharge cycles. Although data are lacking at this time, it is likely that a properly designed 2.9 kWh NiMH battery can deliver 5000 kWh over its life in the form of very shallow cycles; even the larger pulse (100 Wh) represents only about 3.5% of battery capacity. This is strongly suggested by Toyota data [26] showing that the improved Prius (1.9 kWh) NiMH battery technology is capable of delivering test cycles equivalent to more than 150,000 miles of HEV 0 operation with less than 10% capacity degradation. Additional support for this can be found in recent field data for the Prius battery that indicates no deterioration of power or capacity after 60,000 miles [26]. Consequently, no replacement of HEV 0 batteries is likely to be necessary if the originally installed battery also has a 10-year calendar life. This latter capability, although not unlikely, has not yet been demonstrated in tests (much less in HEVs) over such a long period.
HEV 20 As indicated in Table 4-9, batteries for HEV 20 vehicles typically have to last for approximately 30,000 lifetime electric miles in limited (i.e., constrained) and 40,000 lifetime electric miles in unlimited (maximum) use of the battery over 100,000 total miles. With the
4-17

HEV Costs
average HEV 20 electric-only efficiency of 3.57 miles per kWh used in this study48, these distances translate into requirements of about 8,000 kWh and 11,000 kWh delivered over the nominal life of the vehicle. For the 5.9 kWh HEV 20 battery modeled in this study, this energy corresponds to about 1750 and 2360 deep discharge (e.g., 80% depth-of-discharge) lifetime cycles, respectively.
At this time, NiMH batteries from international battery manufacturers have demonstrated 1500-2000 deep cycles under controlled laboratory conditions. While it is as yet not proven that optimally designed NiMH batteries can achieve well more than 2000 cycles under practical operating conditions, two considerations argue for this capability. First, when charged nightly, even HEV 20 batteries are unlikely to be fully discharged every day. As a result, the lifetime discharge energy of about 11,000 kWh is likely to be delivered over a spectrum of discharge depths. The reduced stress will increase cycle life beyond that delivered in nominal 80% deep discharges. Second, recent advancements in positive electrode composition have substantially increased NiMH battery charge acceptance and efficiency (especially at elevated temperature and near the end of charge), with the consequence that average battery operating temperatures will be significantly decreased. As yet unpublished data indicate that such batteries can attain substantially increased cycle life. It seems likely that this important advance will become part of commercial NiMH HEV battery technology within the next ten years, and it is noteworthy that the beneficial effect will be most pronounced for batteries that are charged nightly—the likely situation with HEV 20 batteries.
In addition to these deeper cycles, HEV 20 batteries will experience approximately the same number of shallow cycles as an HEV 0 battery, but superimposed over deeper cycles. However, because of the 2-fold larger capacity of the HEV 20 battery, these cycles will be proportionally shallower than for the HEV 0 battery, and the additional life impact of the superimposed shallow cycles is considered small compared to that of the deep cycles. Thus, on the basis of current information, the WG assumed that no battery replacement over 100,000 miles will be necessary for HEV 20 vehicles for which electric range is limited to 30,000 electric miles. For the “unlimited” (~40,000 mile) electric-range HEV 20 vehicles, one battery replacement is assumed, but the life of that second battery is likely to extend beyond 100,000 total vehicle miles. Future advances in HEV vehicle and NiMH battery technology might eventually eliminate the need for battery replacement for all HEV 20 use modes.
HEV 60 The same analysis can be applied to the 17.9 kWh batteries modeled for the HEV 60 vehicles of this study. With an average of 76,000 mile lifetime electric mileage (see Table 4-9), an HEV 60 with a 3.48 kWh per mile all-electric efficiency used in this study48 will require about 22,000 kWh from its battery which translates into the equivalent of approximately 1500 deep cycles. This should be within the capability of future NiMH batteries, especially with the anticipated technology improvements and considering that, in actual driving and with daily recharging, many of the HEV 60 battery cycles will be less than 80% deep. The HEV 60 is assumed to have the same lifetime number of shallow battery discharges as the HEV 20 and HEV 0, but of proportionally less depth since 100 Wh only represent 0.56% depth of discharge.
48 Real world DC fuel economy on the average driving schedule with EPA labeling discounts applied and excluding charger losses.
4-18

HEV Costs
Therefore, HEV 60 battery replacement most likely will not be required within 100,000 miles. However, in absence of in-vehicle data, there is a need for confirmation—including long term testing—of the capabilities of NiMH technology to meet the stringent cycle and calendar life requirements demanded by representative HEV 20 and HEV 60 applications.
Battery Life Extension Strategies If nominal vehicle life were extended to 15 years or 150,000 miles (as currently proposed for modified warranty requirements of PZEV emission control systems and in the revised PNGV battery life targets), HEV 20 and perhaps even HEV 60 batteries (probably also HEV 0 batteries) would have to be replaced at least once for all HEV driving schedules unless control strategy restrictions were imposed to limit electric mileage. One battery life extension strategy was discussed and analyzed by the WG: to utilize plug-in HEV batteries and vehicles increasingly in the HEV 0 mode when their capacities continue to decline (as a consequence of cycling) below 80%, the standard definition of the end of battery service life. That strategy is based on the expectation that, even at their nominal end of life, HEV 20 and HEV 60 batteries will have capacities well above that of a new HEV 0 battery. However, several caveats apply here. Most importantly—especially for HEV (high power) batteries—end-of-life is normally determined by a decline of peak power capability rather than storage capacity. Thus, the HEV owner will experience a continuing—probably even accelerating—decline in vehicle performance that may not be acceptable. This situation is more likely to occur with HEV 20 batteries since “excess” battery power can more easily be designed into the larger HEV 60 batteries. A corollary battery life extension strategy might be to increase engine power such that the engine-battery system meets total power requirements for a period during which battery peak power is declining to a predetermined level. However, each of these strategies probably comes at a cost, either financial or to the vehicle operator’s expectation, or both.
The detailed trade-off analyses needed to determine the merits and limitations of these and possibly other battery life extension strategies were beyond the scope of the WG study but deserve a closer look in future studies.
Battery Replacement Cost In a likely commercial scenario, battery replacement, if needed, would be done in a repair shop. Such shops would purchase batteries from a battery supply house and ship the removed batteries to these locations for disassembly and eventual salvaging of battery modules. The battery supply house (located in industrial areas throughout the country) would disassemble the battery packs, refurbish the pack hardware and tray, and reassemble the packs with new modules and the refurbished tray and hardware. In a more automated setting, assembled packs would need to be kept continually charged until they are shipped to the repair shop for replacement in a vehicle. This would allow rapid replacement of the battery in a repair shop.
If HEV batteries are replaced when their capacities have fallen to 80%, their modules might still have significant life left for less weight sensitive applications such as golf carts, riding lawn mowers, or for lower range neighborhood electric vehicles (NEVs), and for infrequent discharge cycle applications such as stationary back-up power. Various salvage models propose trade-in values for HEV batteries at $40 to $113 per kWh, but information on remaining battery life that would support such estimates is not available because of the short periods over which EVs and HEVs have been in service.
4-19

HEV Costs
With the generally optimistic assumptions that the battery supply houses can purchase the battery modules directly from the battery manufacturer for the same price as the vehicle manufacturer, that the pack tray and hardware can be reused, and that used HEV battery modules can be sold for $100 per kWh, the battery replacement customer costs for the mid-sized vehicle would be approximately $2,100 for the HEV 0, $3,100 for the HEV 20, and $7,300 for the HEV 60. This assumes 5 hours of labor (at $35 per hour including fringe benefits) to disassemble, refurbish, and reassemble a battery pack, a 50% mark-up on battery module costs and labor to account for the battery supplier overhead, distribution, and profit, plus a repair shop mark-up of 16.3% and two hours of labor at $70 per hour to remove and reinstall the battery pack.
In the ARB staff report [7], ARB uses an optimistic business model based upon a study by ANL [12] in which the repair shop does all the work including disassembling, refurbishing, and assembling of the battery packs. In this model, the repair shop removes the battery pack from the vehicle, orders replacement battery modules from the battery manufacturer, disassembles the battery pack, refurbishes the pack tray and hardware, reassembles the battery pack with the new modules, and reinstalls the battery pack into the vehicle. ARB assumes an overhead rate of 15% plus $500 for the labor to remove the pack, disassemble, refurbish, and reassemble it, and replace the pack in the vehicle. ANL envisions that an industry for batteries would develop, similar to the replacement of jet engines in aircraft and diesel engines in heavy-duty trucks, where expensive engines are procured from outside suppliers with a relatively low mark-up. If one assumes that the repair shop can purchase battery modules from the battery manufacturer at the same price as the vehicle manufacturer, battery replacement customer costs would be $1,600 for the HEV 0, $2,200 for the HEV 20 and $4,600 for the HEV 60 for the mid-size vehicle with a $100 per kWh battery module salvage value.
4.3 Component and Vehicle Costs
Vehicle component and RPE results for mid-size vehicles are presented in this section. Operating costs, including energy use and maintenance, are also discussed along with petroleum displacement and the consequent reductions in trips to the gasoline station.
4.3.1 Vehicle Fully Loaded Costs
Figure 4-5 shows component costs determined using the Base Method discussed in Section 4.2.1 without any mark-ups applied49. As can be seen from this figure, battery and charger costs make up most of the component cost difference between the various vehicle configurations. Table 4-11 provides further details on component costs. Component costs assume production levels of 100,000 vehicles per year in 2010 using year 2000 economics.
49 Component cost summaries listed in Section 4.2.1 differ from this table due to rounding.
4-20

HEV Costs
Table 4-11 Component Costs for the Base Case Vehicles
Vehicle Type CV HEV 0 HEV 20 HEV 60
Engine $2,077 $1,228 $1,156 $880
Engine Thermal $30 $16 $14 $9
Engine Total $2,107 $1,244 $1,170 $889
Exhaust System $250 $200 $200 $150
Transmission $1,045 $625 $625 $625
Power Steering Pump $50 $50 $50 $50
Generator/Alternator $40
A/C Compressor $100 $100 $100 $100
A/C Condenser $20 $20 $20 $20
APM $130 $130 $130
Accessory Power Total $210 $300 $300 $300
Starter Motor $40
Electric Motor $797 $893 $1,213
Power Inverter $478 $528 $694
Electronics Thermal $114 $121 $145
Electric Traction Total $40 $1,390 $1,542 $2,052
Fuel Storage (tank) $10 $10 $10 $10
Accessory Battery $20 $15 $15 $15
Energy Batteries $1,164 $1,882 $4,844
Pack Tray $145 $159 $220
Pack Hardware $475 $489 $550
Battery Thermal $99 $108 $144
Energy Storage Total $30 $1,907 $2,663 $5,782
On-board Charger $380 $380
Cable $80 $80
Off Board Equip Installation $0 $200
Charging Total $0 $0 $460 $660
Total $3,682 $5,665 $6,960 $10,458
4-21

HEV Costs
Figure 4-5 Mid-Size Car Component Costs (without Mark-ups)
Figure 4-6 shows the vehicle fully loaded cost for the mid-size vehicle determined with both the Base and ANL methods. Vehicle fully loaded costs are fully marked up. As can be seen by Figure 4-6, the vehicle RPE for the HEV 0 is from $2,500 to $4,000 higher, the HEV 20 from $4,000 to $6,000, and the HEV 60 from $7,400 to $10,000 than the comparable CV.
Figure 4-6 Vehicle Fully Loaded Cost Estimates for the Mid-Size Car
4-22

HEV Costs
4-23
4.4 Energy Cost Savings Lifetime energy costs for the mid-size car are shown in Figure 4-7 for the average driving schedule (see Section 4.2.2.2) and assuming $1.65 per gallon for gasoline, $0.06 per kWh for electricity, 100,000 miles of vehicle operation, and nightly charging. Energy cost savings for the HEV 0 over the CV are $1,800. The unlimited HEV 20 saves $2,960 if the vehicle is charged nightly and operated on the average driving schedule, the limited HEV 20 saves $2,710, and the HEV 60 saves $3,850 in energy cost compared to the CV in every case. Details on energy cost savings for this and other driving schedules are shown in Appendix C.
Figure 4-7 Lifetime Energy Costs for the Mid-Size Car by Fuel Type for the Average Driving Schedule and Nightly Charging
4.5 Maintenance Cost Savings
Lifetime maintenance costs for 100,000 miles of mid-size vehicle operation on the average driving schedule are shown in Figure 4-8; these costs were estimated using the methodology described in Section 4.2.2.4. HEV 0 maintenance cost savings over the CV is $360. When the vehicle is charged nightly and operated on the average driving schedule, the unlimited HEV 20 saves $790, the limited HEV 20 saves $750, and the HEV 60 saves $1,050 in maintenance cost compared to the CV. Maintenance cost details for this and other driving schedules can be found in Appendix C.

HEV Costs
Figure 4-8 Lifetime Maintenance Costs for the Mid-Size Vehicle for the Average Driving Schedule and Nightly Charging
4.6 Reduction in Gasoline Consumption
Gasoline consumption for the mid-size vehicle operated on the average driving schedule is shown in Figure 4-9 for 100,000 miles of lifetime vehicle operation. Using an HEV 0 instead of a CV saves 1,090 gallons over 100,000 miles of lifetime vehicle operation. Charged nightly, the unlimited HEV 20 saves 2,280 gallons, the limited HEV 20 2,010 gallons, and the HEV 60 saves of 3,300 gallons in every case compared to the CV. Further details can be found in Appendix C.
Figure 4-9 Lifetime Gasoline Usage for the Mid-Size Car for Average Driving Schedule and Nightly Charging
4-24

HEV Costs
4.7 Estimated Trips to the Gas Station
Compared to a CV, HEVs will make fewer trips to the gasoline station. Two cases are presented in Figure 4-10. The first assumes that the fuel tank size is designed to provide 350 gasoline-only miles per fill-up for each vehicle type; the second assumes that the fuel tank is the same size for all vehicle configurations. In the first case, trips to the gasoline station are reduced from 37 per year to 9 per year for the HEV 60. In the second case, the HEV 60 trips to the gas station are reduced to 6 per year. Further details are in Appendix C.
Figure 4-10 Trips to the Gasoline Station per Year for the Mid-Size Car for the Average Driving Schedule and Nightly Charging
4.8 Additional Configurations
The substantial differences in HEV fully loaded costs are almost entirely due to the differences in their battery sizes and costs. There is, therefore, a large financial incentive for reducing battery costs by increasing vehicle efficiency. In this section, vehicle RPE and energy efficiency are calculated for the high-efficiency vehicles identified in Section 3.3.3. Component costs for the low-drag, lower mass mid-size car are shown in Figure 4-11. Because the battery size for the HEV 60 can now be reduced from the base case of 17.9 kWh to 15.0 kWh, the $6,600 difference in total component costs between the base case CV and HEV 60 is reduced to $5,800 for the advanced-design vehicles.50
50 Because the same method was used to determine glider costs and the CV MSRP was assumed the same as the base case, the reduction in power train costs for the low-drag, low-mass CV resulted in a significantly higher glider cost ($316 more) before mark-ups. While this was not studied in detail, this additional cost might compensate for the materials differences between the base case and low-drag, reduced mass cars.
4-25

HEV Costs
Figure 4-11 Total Component Costs for the Low-Drag, Lower Mass Mid-Size Car (Without Mark-ups)
Vehicle RPE for the low-drag, reduced mass mid-size car are shown in Figure 4-12 using both the Base and ANL Methods. In the base case described in Section 4.3, the vehicle RPE differential between the CV and HEV 60 is between $7,400 to $10,000 depending on the costing method used, while the vehicle RPE differential for the low-drag, reduced mass case HEV 60 versus the low-drag, reduced mass CV is between $6,800 to $9,200.
Figure 4-12 Vehicle RPE for the Low-Drag, Lower Mass Mid-Size Car
4-26
HEV Costs
Fuel and overall energy economy also is improved for the low-drag, reduced mass HEV 60 over the similar CV. Energy cost savings over 100,000 vehicle miles in the average driving schedule for the low-drag, reduced mass HEV 60 are $3,560 when charging nightly (shown in Figure 4-13). In comparison, the base HEV 60 energy cost savings over the base CV were $3,290 over the 100,000 vehicle miles using the average driving schedule and charging nightly.
Figure 4-13 Lifetime Energy Costs for the Low-Drag, Lower Mass Mid-Size Car
Other possible benefits of low-drag, reduced mass designs (particularly for the HEV 20 not modeled in this phase of the study) warrant further study and quantification.
4.9 Issues not Addressed in this Study
The following is a list of issues and opportunities that were not addressed by the WG in this phase of the study but may have important impacts on HEV comparisons and feasibility:
�� Trends to use better aerodynamics, better tires, or lightweight steel and materials with each new model. (The WG costs are based on a conservative choice of cars, and sensitivity analysis showed that modest improvements can reduce the HEV 60 battery pack from 18 to 15 kWh, which saves about $850 after estimated glider cost increases and improves fuel savings by about 30%.)
�� Cost savings from manufacturing more than one vehicle type (EV, HEV, conventional) with the same platform.
�� Designing an HEV to meet 0-60 mph in 11 or 12 seconds, which would reduce costs due to lower battery power and cost. (The WG assumption of a mid-size car with 0-60 mph at 9.5 seconds is only one segment of the mid-size car market; other segments have less performance.)
4-27

HEV Costs
�� Cost savings from very high volume production (e.g., 200,000, 500,000 or 1,000,000 units per year).
�� Cost savings from credits for NiMH batteries used for less demanding secondary applications after their useful life in an HEV. (See Section 4.2.2.6 for some discussion of this opportunity.)
�� Resale value of HEVs (not enough information was available to the WG for estimating this important issue).
�� Lower costs of BPM motors where permanent magnets are used in other applications to increase production volume.
�� Cost to meet SULEV and PZEV compliance for a CV or HEV using gasoline. The costs will be different for L-3, L-4, V-6, and V-8 engines, and there may be potential for larger cost savings than the WG estimated if HEVs enable easier compliance with lower tailpipe and evaporative emissions standards.
�� Using the same ICE engine for the HEV 0 and HEV 20 in order to lessen HEV engine development and/or production costs.
�� Battery leasing or renting as a way of turning nearly all of the incremental up front cost for HEVs into an operating cost.
4-28
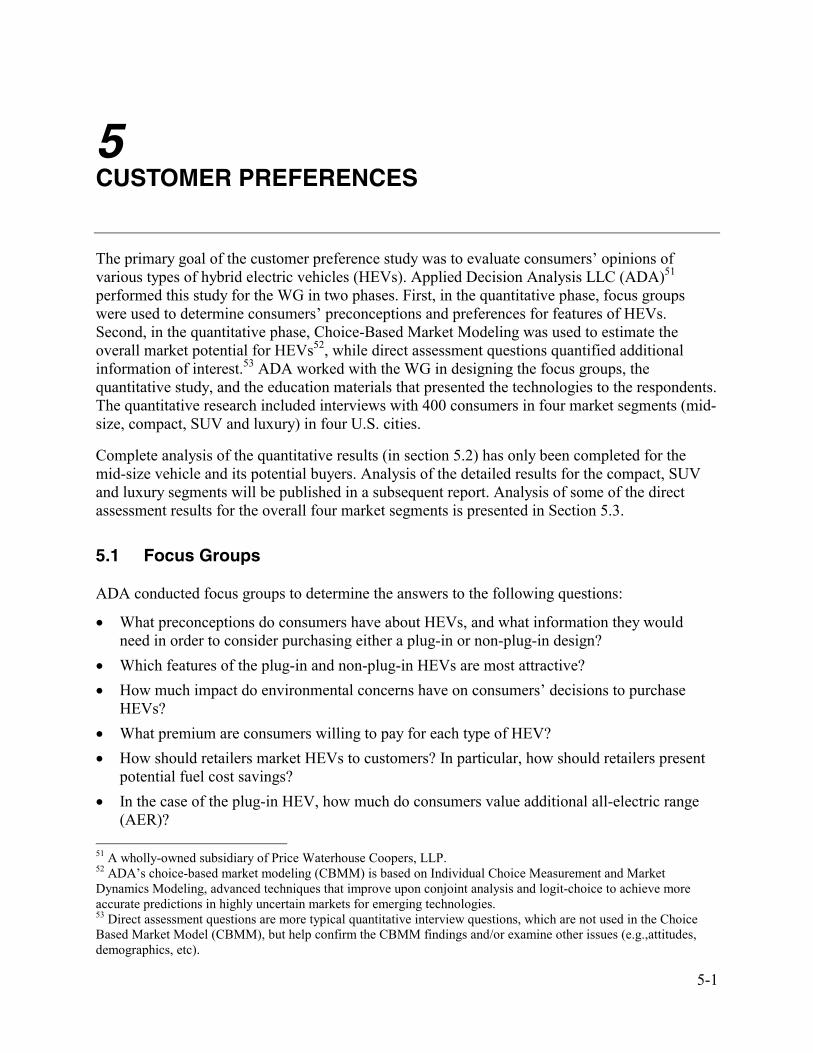
5 CUSTOMER PREFERENCES
The primary goal of the customer preference study was to evaluate consumers’ opinions of various types of hybrid electric vehicles (HEVs). Applied Decision Analysis LLC (ADA)51 performed this study for the WG in two phases. First, in the quantitative phase, focus groups were used to determine consumers’ preconceptions and preferences for features of HEVs. Second, in the quantitative phase, Choice-Based Market Modeling was used to estimate the overall market potential for HEVs52, while direct assessment questions quantified additional information of interest.53 ADA worked with the WG in designing the focus groups, the quantitative study, and the education materials that presented the technologies to the respondents. The quantitative research included interviews with 400 consumers in four market segments (mid-size, compact, SUV and luxury) in four U.S. cities.
Complete analysis of the quantitative results (in section 5.2) has only been completed for the mid-size vehicle and its potential buyers. Analysis of the detailed results for the compact, SUV and luxury segments will be published in a subsequent report. Analysis of some of the direct assessment results for the overall four market segments is presented in Section 5.3.
5.1 Focus Groups
ADA conducted focus groups to determine the answers to the following questions:
�� What preconceptions do consumers have about HEVs, and what information they would need in order to consider purchasing either a plug-in or non-plug-in design?
�� Which features of the plug-in and non-plug-in HEVs are most attractive? �� How much impact do environmental concerns have on consumers’ decisions to purchase
HEVs? �� What premium are consumers willing to pay for each type of HEV? �� How should retailers market HEVs to customers? In particular, how should retailers present
potential fuel cost savings? �� In the case of the plug-in HEV, how much do consumers value additional all-electric range
(AER)? 51 A wholly-owned subsidiary of Price Waterhouse Coopers, LLP. 52 ADA’s choice-based market modeling (CBMM) is based on Individual Choice Measurement and Market Dynamics Modeling, advanced techniques that improve upon conjoint analysis and logit-choice to achieve more accurate predictions in highly uncertain markets for emerging technologies. 53 Direct assessment questions are more typical quantitative interview questions, which are not used in the Choice Based Market Model (CBMM), but help confirm the CBMM findings and/or examine other issues (e.g.,attitudes, demographics, etc).
5-1

Customer Preferences
Many of the answers to these questions were uncovered during four focus groups studies conducted in Los Angeles and Orlando. The participants were grouped into compact, midsize, minivan, and SUV owners, according to their currently owned vehicles. Only those participants who had bought model year 1996 and later vehicles and said they would consider purchasing an HEV were used. This later condition had only a minor effect on recruiting participants, as most people who had bought new cars in the last 5 years were open to purchasing HEVs. ADA also made an effort to have a mix of ages, gender, and daily mileage patterns among the participants. The distribution of location, vehicle platform and gender are shown in Table 5-1.
Table 5-1 Distribution of Participants in Focus Groups
Location Group Type Total Men Women
Compact 7 86% 14%
Mid-size 12 25% 75%
Minivan 8 50% 50% Los Angeles
SUV 10 60% 40%
Compact 7 57% 43%
Mid-size 10 70% 30%
Minivan 9 67% 33% Orlando
SUV 7 43% 57%
Total 70 56% 44%
5.1.1 Focus Group Interviews
The focus groups were conducted by gathering initial impressions, educating the participants (in two sessions), and guiding discussions about the technologies. Participants were provided an explanation of the differences between two HEV options: non-plug-in and plug-in, referred to as Hybrid X and Hybrid Y, respectively, to avoid nomenclature biases. The vehicle attributes of the most interest to the participants were price, fuel cost savings, reliability and maintenance costs, safety, appearance, comfort, options, seating capacity, recharging frequency, and resale value. In order to present hybrids on an equal footing with conventional vehicles, participants were asked to assume that HEVs were well established (out for 5 or so years) and met the following criteria:
�� The technology is safe and reliable
�� Skilled mechanics are available
�� Resale value is comparable to the equivalent conventional vehicle
�� Performance is comparable to the equivalent conventional vehicle
�� Interior roominess and convenience/comfort features are comparable to the equivalent conventional vehicle
5-2

Customer Preferences
�� HEVs are produced by many manufacturers in a wide range of styles, so that any model can be purchased as an HEV
�� Information about HEVs is widely available from the Internet, magazines, automakers, government, consumer groups, and other sources.
Each focus group was conducted in three phases. First, ADA asked respondents what they knew about HEVs. Then, after introducing the basic features of HEVs, ADA probed for more details on how the respondent thought about fuel cost. Finally, after a more detailed education on HEV benefits and HEV types, respondents were probed about these benefits and their overall acceptance of HEVs. (See Appendix D.4 for the education materials and Appendix D.1 for the focus group discussion guide.) The focus groups were useful in determining which HEV benefits are most important to consumers, and how best to explain these benefits. The more important attributes/benefits were then included in the Choice Based Market Model (CBMM) portion of the quantitative survey and the less important in the direct assessment portion. The focus group results summarized below, while not quantitative, are similar to the findings in the quantitative portion of the customer preference study. In that respect, the focus groups helped to confirm the quantitative findings.
5.1.2 Focus Group Results
The focus groups indicated that, provided the basic assumptions are met, most participants preferred an HEV to a conventional vehicle if the HEV was available in the same design and at the same vehicle price. Participants thought fuel cost savings were one of the most attractive features of HEVs. Although environmental benefits, fewer trips to the gas station, and the flexibility of the dual-mode operation were influential in purchasing a vehicle, few respondents were willing to pay more for these attributes.
A large majority of the participants thought that plugging in was preferable if it was convenient, but some had issues regarding charging. Most people considered plugging in their vehicles more convenient than fueling at a gasoline station. Still, when asked how a higher price vehicle would affect their decisions, many respondents thought the vehicle must be inexpensive enough for the HEV fuel cost savings to compensate for the higher vehicle cost in a reasonable time.54
Since the focus groups were small, informal discussions were used to collect qualitative information only. Quantitative analyses were done using choice-based market modeling discussed in the following section. While the focus groups indicated that there is substantial interest in HEVs, people will only seriously consider buying them if they are similar in performance, reliability, and appearance to their favorite conventional car, produced by known manufacturers, and are not priced too much more.
The focus groups also indicated that further education is needed on HEVs, especially plug-in HEVs. A few focus groups participants, for example, never seemed to understand that the plug-in HEV still can operate if they are not plugged in nightly. More focus group work is required to learn how to best explain key HEV benefits, and to understand prospective buyer/user reaction to these benefits. Focus group responses are discussed in Appendix D.6.
54 ADA has found through many vehicle marketing studies that consumers do not generally do life cycle calculations when purchasing a vehicle.
5-3

Customer Preferences
5.2 Choice-Based Market Modeling
The focus group study provided the WG with consumers’ opinions about the HEV concept. To take the assessment of customer preferences a step further toward estimating market preferences for HEVs relative to CVs, a quantitative study of customer choices was designed and carried out by ADA. This allowed the WG to test various HEV design and attributes trade-offs in a virtual marketplace.
5.2.1 Design Attributes
ADA tested design attributes with respondents through a computer-administered interview. Attributes are vehicle characteristics that are of likely importance to consumers, which can be tested by monitoring their reaction when attribute values are varied. These reactions are combined to generate market preferences. The attributes chosen on the basis of focus group responses and special interests of WG member organizations included the following:
�� Vehicle price
�� Fuel cost savings
�� Trips to the gas station
�� Environmental benefits
�� Maintenance costs
�� Battery life and replacement costs
�� Electrical system (infrastructure) upgrade costs55
�� Government incentives
�� Special features/options such as a 110/120-volt outlet to run various “appliances”, and pre-heat/pre-cool capability (available with engine on or off)
�� Linked or combined attributes of fuel cost savings, environmental benefits, and trips to the gas station.
�� All of the attributes combined for an HEV 0, HEV 20, and HEV 60
Except for the last two, attributes were not linked but kept independent in the design of the interview questions. After trade-off questions were asked for each independent attribute, questions about the nine attributes linked for an HEV 0, HEV 20 or HEV 60 (full-profile trade-off questions) were asked. Further, to assure this independence, education and questions about various other HEV benefits and issues were conducted at the end the interview. (See Section 5.3 on direct assessment results). The process and methodology for the interviews are explained below.
55 To accommodate overnight charging in some situations, an upgrade to the electric panel or an additional circuit might be necessary.
5-4

Customer Preferences
5.2.2 Methodology to Collect Interview Data
A pilot test of the computer-administered interview was conducted in the San Francisco area with 14 respondents to ensure that the educational aspect was adequate and that the attributes selected were understandable. Respondents were monitored during the interview process and were given a one-on-one debriefing interview to uncover difficulties and misunderstandings. The pilot test revealed a few points of confusion that were clarified for the main study, as well as indicated that more questions were needed in order to accurately model price sensitivity. The changes indicated from the pilot test improved the quality of the results in the main study.
For the quantitative customer preference study, more than 400 respondents completed the one-hour computer-administered interview. To obtain a representative national sample, ADA conducted interviews in 4 cities: Atlanta, Boston, Los Angeles, and Phoenix. The sample was drawn from a list (compiled by the R.L Polk Company) of drivers who had acquired a new compact, mid-size, sport utility or luxury vehicle within the last 5 years.56 (See Appendix D.5)
In order to maximize the value of the sample, ADA recruited only participants who said that they usually park within 25 feet of an electrical circuit.57 For the purposes of the study, these respondents were asked to assume that they would be able to plug in a vehicle after a relatively simple electrical upgrade, even if the circuit did not include an electrical outlet today. This screening criterion allowed the study to be focused on respondents who would be able to consider both types of hybrids. Each respondent went through the preference model twice:
�� Once allowing the respondent to choose among all the vehicles (including the vehicles with a plug) and
�� Once restricting the choice to only the conventional and HEV 0 (excluding the vehicles with a plug).
ADA used a weighted average of these runs to compute the overall market preferences.
5.2.2.1 Interview Assumptions
In order to present hybrids on an equal footing with conventional vehicles, respondents were asked to assume that HEVs have been available in the market for about 10 years, and had the same characteristics as those postulated in the focus group study:
�� The technology is safe and reliable
�� Skilled mechanics are available
�� Resale value is comparable to the equivalent conventional vehicle 56 Fleet vehicles were not part of the survey sample. This is a fairly large market that could be examined in a future phase of the study. 57 Based on data collected in the screening process, ADA estimated that 95% of those who live in houses and 60% of those who live in apartments pass this criterion. This translates into 86% of people having relatively easy access to a cord.
5-5

Customer Preferences
�� Performance is comparable to the equivalent conventional vehicle
�� Interior roominess and convenience/comfort features are comparable to the equivalent conventional vehicle
�� HEVs are produced by many manufacturers in a wide range of styles such that any model can be purchased as an HEV
�� Information about HEVs is widely available from the Internet, magazines, automakers, government, consumer groups, and other sources.
The intent of ADA and the WG was to focus respondents on their preferences with respect to their choice of well-established powertrain (conventional or several hybrid) options, not on any other differences in the vehicle itself. To fully capture the market potential for HEVs, the team assumed a relatively optimistic scenario for the base case, as noted in the assumptions above. The survey design included some potential HEV benefits that may not be realized, especially as conventional vehicles improve: better handling due to inherently better weight distribution, completely equivalent performance even for hill-climbing, towing and carrying large payloads, and an improved ability to run appliances from an AC power outlet in the vehicle, even when the engine is off. For these reasons, the WG believes that the market potential estimated here will exceed the market share actually achieved, certainly in the near term. Nevertheless, the market potential shown here is useful for understanding how customers view HEVs, assuming that these design criteria are met, and especially for understanding the impact of cost on market potential.
In addition, the study assumes full consideration of HEVs and that customers are educated about HEV benefits and costs (similar to what might be on the Internet in 2010).58 With this in mind, the education process used in the interview provided information on the nine design attributes listed in Section 5.2.1, six of which were positive HEV benefits and three of which resulted in increased costs for HEVs. The education process used in the interview did not educate participants regarding about 10 “minor” benefits. The most controversial assumption above is that the resale value is comparable to a conventional vehicle. More surveying should be done in this area.59 The full text of the interview and supporting educational materials are included in this report as Appendix D.2.
5.2.3 Interview and Model Construction
The customer preference model was constructed to be extremely flexible. Market preferences can be predicted for any vehicle described by the attributes listed in Section 5.2.1, not just the vehicles explicitly tested in the interview. As a result, the model was able to obtain credible results even as the WG refined the vehicle design, costs, and environmental data inputs to those described in Sections 3 and 4. Due to this flexibility, there are also many possibilities to use the existing data in further studies to better understand market preferences in sectors of the market 58 The software used in the model (section 5.2.3.3) to calculate custom HEV benefits for each respondent was assumed to be widely used by 2010 on the Internet and dealerships. 59 Trade-offs, complexities and uncertainties make resale value difficult to study. Uncertainty and debate over battery life for different HEVs is a key negative. On the other hand, a paradigm shift is possible with positive benefits such as battery leasing, resale of batteries for second-use markets, and keeping a vehicle for 200,000 or more miles by using two battery packs. Impact of this resale issue for those who keep their vehicles only a few years (e.g. lessees) should also be explored.
5-6

Customer Preferences
other than the mid-size vehicle. For example, market preference data from a large portion of the market (the mid-size cars, compact cars, SUVs or luxury cars in this study) could be used to roughly estimate60 market preference for other hybrid vehicles with similar prices and attributes, e.g., hybrid pick-up trucks.
The interview consisted of four sections, plus education (see HEV Education Slides in Appendix D.4 and Frequently Asked Questions in Appendix D.3):
1. The purpose of the study was explained to the participants. Working with the WG, ADA set the context for the interview questions using the assumptions described in Section 5.2.3 and gathered some introductory assessments, such as representative driving patterns of the participants. Setting the common context made it easier to later interpret the customer preference model results. It also allowed gathering of data necessary to calculate HEV benefits customized for each survey taker (see Section 5.2.4.3).
2. The participants were asked pair-wise trade-off questions that captured their values for the nine attributes one at a time. In order to make these questions more real, the respondents were asked to think about buying a vehicle to replace their current vehicle.
3. The vehicle configurations were introduced. In this section, the participants were asked full-profile trade-off questions to capture their values for inertia (resistance to purchase new products) and technology-linked attributes. These pair-wise and full-profile questions (see Tables 5-2 and 5-3) are discussed in detail in the following section.
4. In the direct assessment section (discussed on Section 5.3), some additional demographic questions and other questions about attitude and values were asked.
5.2.3.1 Analysis and Model Validation
The study required two kinds of data:
�� Demographics and direct assessments – e.g. “Are you male or female?” or “What is your attitude toward each of the following statements?”
�� Trade-off responses – e.g.
If you had to replace your current Ford Taurus, which would you prefer?
Fuel costs $60 per month (25% less than current costs)
Fuel costs $8 per month (90% less than current costs)
Costs $600 per month for 36 months with $3000 down (Total $23,000)
Costs $650 per month for 36 months with $3000 down (Total $24,700)
Please assume that the vehicles are exactly the same except for the characteristics shown.
60 It is a rough estimate because consumers are somewhat different across vehicle market segments, and the fuel cost savings and other benefits achieved relative to the increased cost for HEV batteries vary significantly by vehicle type.
5-7

Customer Preferences
Demographics and direct assessments provide context for the preference results, and can also be useful in their own right. For example, respondents were asked directly which factors would be most influential in their purchase decision (see Section 5.3). These questions also provided the input needed to compute fuel usage for each respondent.
The market preference model is driven by the values for each attribute (the “utilities”) computed from the trade-off responses. Each respondent was asked approximately 60 trade-off questions.61 The answers to these questions were used to populate a maximum likelihood utility estimator, which estimated each respondent’s utilities for every level of every attribute.
As discussed in Section 5.2.3.3, the computer-administered interview was adaptive and customized for each respondent, using each respondent’s driving patterns and answers to early questions to create unique trade-off questions for each respondent. To validate utilities individually, their values were then plugged back into the questions asked to predict the respondent’s answer to each question. Respondents who gave inconsistent answers (where the ADA was unable to match at least 75% of the answers) were excluded from the model. ADA and the WG also looked at several other factors that might mean that a respondent had been confused during the study – completing the interview too quickly or too slowly, using the preference scale midpoint too frequently, disagreeing with the facts presented in the education, etc. Respondents identified by any of these criteria were excluded from the study if their pattern of responses indicated that they were not giving good data, or if ADA was unable to match at least 80% of their answers. After removing these respondents from the sample, the resulting sample for the study was 386 good respondents out of 441. Specifically, the survey results in Section 5.2 are based upon a sample size of 92 mid-size vehicle owners. Using the 386 qualified respondents, the model was then validated on a broad basis. Of course, since the market for the type of vehicles modeled in the study (see Section 3) is not yet established, the model could not be validated with actual sales data. Instead, the full-profile questions from the interview were used to ensure that the model was able to predict respondent choices for complete vehicle descriptions and to match their answers to the pair-wise, attribute-by-attribute questions.
The full-profile questions asked respondents to choose between the four vehicle concepts in Table 5-2. These concepts were chosen to span the range of vehicles covered by the study, with Concept 1 presenting a full feature concept at a relatively high price, and Concept 4 representing a low feature concept at a substantially lower price. By spanning a range in this manner, imbalances among the attributes and overstatements of willingness-to-pay for individual attributes can be identified.
61 Note the interview in Appendix D.2 is only about half its actual length because the 60 or so trade-off questions are not listed in detail, in part because the trade-off questions were customized to each respondent’s individual situation.
5-8

Customer Preferences
Table 5-2 Vehicle Concepts for Full-Profile Questions
Concept 1 Concept 2 Concept 3 Concept 4
~90% gas use savings (reducing fuel cost, trips to gas station, and emissions/global warming)
~60% gas use savings (reducing fuel cost, trips to gas station, and emissions/global warming)
~60% gas use savings (reducing fuel cost, trips to gas station, and emissions/global warming)
~25% gas use savings (reducing fuel cost, trips to gas station, and emissions/global warming)
Significantly lower maintenance cost (0.5 cents per mile)
Standard maintenance cost (4.0 cents per mile)
Significantly lower maintenance cost (0.5 cents per mile)
Standard maintenance cost (4.0 cents per mile)
Can run 110V plug and pre-heat/pre-cool system with the engine off
Cannot run 110V plug and pre-heat/pre-cool system with the engine off
Cannot run 110V plug and pre-heat/pre-cool system with the engine off
Cannot run 110V plug and pre-heat/pre-cool system with the engine off
Significant electrical upgrade cost ($1000)
Minimal electrical upgrade cost ($150)
No electrical upgrade cost ($0)
No electrical upgrade cost ($0)
Costs ~35% more than conventional vehicle
Costs ~20% more than conventional vehicle
Costs ~25% more than conventional vehicle
Costs ~10% more than conventional vehicle
In addition, ADA tested several concepts versus the conventional vehicle in “purchase/no purchase” or “PNP” questions. These questions test for buying inertia and/or resistance to adopting new technologies. The concepts shown in Table 5-3 were used to test these questions. While these concepts appear extreme or skewed, this was intentional so that when more realistic examples were examined they would fall within this table’s validated concept ranges. The goal was to avoid having realistic examples fall outside of the concept ranges, which would require the use of less accurate extrapolation of data outside the validated concept ranges.
Table 5-3 Concepts to Test Inertia or Resistance to New Technologies
PNP 1 PNP 2 PNP 4 Conventional
~90% gas use savings (reducing fuel cost, trips to gas station, and emissions/global warming)
~60% gas use savings (reducing fuel cost, trips to gas station, and emissions/global warming)
~25% gas use savings (reducing fuel cost, trips to gas station, and emissions/global warming)
Conventional gas use (15% increase in fuel cost, same trips, and same emissions/ global warming)
Can run 110V plug and pre-heat/pre-cool system with the engine off
Can run 110V plug and pre-heat/pre-cool system with the engine off
Cannot run 110V plug and pre-heat/pre-cool system with the engine off
Cannot run 110V plug and pre-heat/pre-cool system with the engine off
Significant electrical upgrade cost ($1000)
Minimal electrical upgrade cost ($150)
No electrical upgrade cost ($0)
No electrical upgrade cost ($0)
Costs ~30% more than conventional vehicle
Costs ~20% more than conventional vehicle
Costs ~15% more than conventional vehicle
Costs same as conventional vehicle
5-9

Customer Preferences
A comparison between PNP1 versus Conventional shows the percent of respondents that would purchase a Concept 1 vehicle over the conventional vehicle. The validation results among all respondents for these concepts are shown in Table 5-4.
Table 5-4 shows that the predicted results match actual results quite well for the 386 participants. In the concept test, the model slightly underpredicts Concepts 1 and 2, and overpredicts Concepts 3 and 4. In the PNP questions the model slightly overpredicts PNP1 and underpredicts PNP4. Since these two effects balance, there is good confidence that the model is using appropriate price sensitivity and attribute sensitivity. As another check, the correlation62 of 78.1% in the concept tournament is well above the validation target of 70%. In other words, the model was calibrated to not understate or overstate the importance of any one attribute.
Table 5-4 Validation Results for Concepts
Actual Predicted
Concept 1 31.7% 24.9%
Concept 2 14.5% 10.9%
Concept 3 24.7% 31.1%
Concept 4 29.1% 33.0%
Root Mean Square Error 5.41%
Correlation 78.1%
Actual Predicted
PNP1 vs. Conventional 50.3% 54.9%
PNP2 vs. Conventional 60.9% 58.8%
PNP4 vs. Conventional 53.2% 50.0%
5.2.3.2 Accuracy of Model Results
In measuring the acceptance of future technology like HEVs, two types of error need to be considered: sample error and structural error. Sample error is based on the accuracy with which the sample set represents the market as a whole. The sample sizes recommended by ADA for Individual Choice Measurement are often much smaller than those required by other techniques. There are two principal reasons for this:
1. ADA uses sophisticated survey and data analysis techniques to estimate the complete value function that each respondent has for all the attributes in the study. No approximations or aggregations across groups of respondents are needed.
2. ADA uses a probabilistic choice model in the market models. “Yes/no” choice models (such as assigning 100% likelihood to the product with maximum estimated value) require larger sample sizes for the same degree of accuracy, particularly for products that appeal to a small fraction of the market.
62 Correlation refers to how well the “cloud” of data fits around the line plotted through the data.
5-10

Customer Preferences
Other ADA studies have shown that a sample of 30-50 respondents is sufficient to produce accurate results for a sampling cell, where a sampling cell is a group of customers with similar needs and preferences. Because sample error and structural error must be combined, it is not cost-effective to use too large a sample; increasing the sample (and thus the cost) by a factor of 4 will reduce the sample error by only a factor of 2. The sample of 92 mid-size vehicle respondents is well above this threshold, and thus the sample error for these results is within the acceptable range for predictive confidence. Caution should be used in interpreting results for some subsets of the groups (for example, the low commute and mid commute subgroups contained only 23 and 29 respondents, respectively), particularly when the differences between the results for these groups are small. Structural error is based on the accuracy with which the product model and descriptions in the interview represent the way the future technology will actually be developed and marketed. Typically, in a new technology study, structural error is a significant concern, and the assumptions made in modeling the new technology versus its characteristics when actually introduced will be the dominant source of difference between the preference shares predicted and the real market. In this study, ADA and the WG made a significant effort to balance the many viewpoints of the diverse participants, and to educate respondents about the differences between HEVs and conventional vehicles, thus reducing structural error. The assumptions described in the section 5.2.4.3 describe the potential sources of structural error in more detail. The confidence intervals in the direct assessment portion of the quantitative customer preference study are generally very reasonable and the sample variance is also within reasonable bounds. ADA has a good confidence that the answers to the questions asked are meaningful. Previous ADA studies have replicated the market for new technologies five years in the future to within an error of 5-10%, using updated descriptions of the products each year as the market evolved.
5.2.3.3 Model Assumptions
The market model and interview required assumptions about the characteristics of the hybrid vehicle configurations, and the customer responses depend critically on many of these. As a result, the WG made a considerable effort to choose the most appropriate design and cost assumptions as inputs for the customer preference model. In particular, this effort required credible technical and cost assumptions for the mid-size vehicle and its various HEV and battery options, as discussed in the modeling and cost sections of the report (see Section 3 and 4). Table 5-5 lists these and other input assumptions for the customer preference model. The last eight assumptions for incentives were determined by WG consensus. The WG developed the computer interview so that each interviewee was asked the appropriate questions about their car, their commute, and other driving behavior. For each interview participant, total miles driven per year as well as prospective electric-powered and gasoline-powered miles were calculated. Next, using mid-size fuel economy data from Section 4 adjusted with US EPA labeling adjustments for real world driving, a customized fuel savings was calculated for the participant driving an HEV 0, HEV 20 or HEV 6063 in daily, weekend and vacation routines. The results from these inquiries were used to derive average driving schedules in Section 4.2.2.2. Conversely, using data from Section 4, customized maintenance savings for the HEV 0, HEV 20 and HEV 60 were calculated for each interview participant based on their driving patterns, and this became an output or result of Section 4. 63 The savings were based on the mid-size car in Section 3, rather than their particular model.
5-11

Customer Preferences
Table 5-5 Base Case for Mid-Size Conventional and HEV Configurations
Vehicle Configuration CV HEV 0 HEV 20 HEV 60
Price a $18,984 $23,042 $24,966 $29,053
City/Hwy Charge Sustaining Fuel Economy (mpg)b 20.9/32.3 36.5/32.3 41.7/41.9 38.2/38.8
City/Hwy Electric Fuel Economy (kWh/mi)b — — 0.30/0.34 0.31/0.35
Gasoline Tank Size (gal) to go 350 miles CS 14.1 9.89 8.38 9.11
Fuel Price ($/gal) Electricity price ($/kWh) 1.65 1.65 1.65(.06) 1.65 (.06)
Maximum all electric miles out of 100,000 total miles c — — 31,210 93,224
Battery Price $0 $2,284 $3,147 $6,679
Replace Battery No No No No
Gasoline/Electric Combined Maintenance Cost ($/mile)
0.0331 0.0307 0.0307 0.0307
% Smog Reduction beyond SULEV 0% 20% 30% 52%
% CO2 reduction beyond base 0% 33% 42% 54%
Electrical Upgrade Cost $0 $0 $0 $200
Extra Features with Engine Off No No Yes Yes
Extra Features with Engine on d Yes Yes Yes Yes
Charging Every Day e NA NA Yes Yes
Carpool Lane Access No No No No
Free Parking At Work No No No No
Free Parking at Trains No No No No
Free Parking at the Mall No No No No
Free Charging At Work No No No No
Free Charging at Trains No No No No
Free Charging at the Mall No No No No a Equal to base case retail price estimate in Section 4. b Includes US EPA labeling discount to account for “real world” driving (use of heat and AC, aggressive driving). c Based on maximum of 1750 deep discharge cycles. See Section 5.2.2.6.1 for discussion of battery life (for EV and
charge sustaining miles). d See Section 5.2.4.1.2 e Charging every day was not an output (attribute) but an input that affects performance, fuel savings, trips to the
gas station, battery replacement and maintenance savings attributes. Sensitivities were done with other assumptions of charging frequency.
5-12
Customer Preferences
The number of trips to the gas station for each HEV was similarly customized, and the results are reported in Section 4. Questions about vehicle price were customized based on how the participant reported purchasing their vehicle (pay cash or finance) and the length of their finance payments or lease. The environmental benefits were not customized but estimated based on a high commute assumption. The results in Section 4 for environmental benefit are for the average Customer Preference Survey commute. ADA, Arthur D. Little, Inc., and two teams of the WG developed this customized software over several months. Using this software, each interview participant was asked trade-off questions pertinent to and/or customized to his or her unique situation, factoring in personal driving patters as well the local gasoline and electricity prices.64
The number of trips to the gas station for each HEV was similarly customized, and the results are reported in Section 4. Questions about vehicle price were customized based on how the participant reported purchasing their vehicle (pay cash or finance) and the length of their finance payments or lease. The environmental benefits were not customized but estimated based on a high commute assumption. The results in Section 4 for environmental benefit are for the average Customer Preference Survey commute. ADA, Arthur D. Little, Inc., and two teams of the WG developed this customized software over several months. Using this software, each interview participant was asked trade-off questions pertinent to and/or customized to his or her unique situation, factoring in personal driving patters as well the local gasoline and electricity prices.65
5.2.4 Market Preference Results
The Customer Preference Model results represent the consumers’ opinions of HEVs. In particular, they indicate the percentage of consumers who prefer one of the HEV designs to the conventional vehicle. Although the model generated consumer preferences for each of the vehicle platforms (compact, mid-size, SUV, and luxury66), only the mid-size findings are presented here. Results for other vehicle platforms will be summarized in a subsequent report.
The model can be used to describe consumers’ preferences for one HEV configuration over another, or to measure preferences for HEVs versus conventional vehicles. These preferences were of particular interest to the WG, as was information on how consumers trade hybrid and conventional vehicle attributes with vehicle cost. Comparing HEVs with each other introduces biases for features that differ among them. The WG did, of course, not know how many HEV configurations of its CV counterpart might be available 10 years from now. The WG assumed that only two choices would be available during early HEV commercialization to minimize costs. For example, a consumer could purchase Brand X’s small car as a CV or an HEV 0, or Brand Y’s mid-size car as a CV or an HEV 20 and so on. However, a case could be made as HEVs become more mature commercially, more choices in the same model and brand might be
64 These three factors influence three attributes: fuel economy savings, maintenance savings and trips to the gas station. In other words, these three attributes were customized for each respondent, with questions to test a respondent’s interest or disinterest in that attribute built around their unique situation. 65 These three factors influence three attributes: fuel economy savings, maintenance savings and trips to the gas station. In other words, these three attributes were customized for each respondent, with questions to test a respondent’s interest or disinterest in that attribute built around their unique situation. 66 The luxury category included compact and mid-size luxury cars, but excluded full size luxury cars. The SUV category included a subsegment of luxury SUVs.
5-13

Customer Preferences
available. For example a CV, an HEV 0, and HEV 20 in Brand Z’s sport utility vehicle, or a CV, an HEV 30, HEV 45 and HEV 60 in Brand W’s mid-size car. This is especially attractive if most components can be kept the same or if off-the-shelf engines and motors can be used. In a future effort, the WG proposes to examine more of these scenarios with the market model using the already-collected survey data. At present, only two scenarios were analyzed:
1) CV versus HEV 0; CV versus HEV 20; CV versus HEV60 in the same brand and car model (The base case scenario for 2010.)
2) CV versus HEV 0 versus HEV 20 versus HEV 60 in the same brand and car model. (A future scenario in the 2015 to 2020 timeframe or a very aggressive scenario for 2010.)
Because of the nature of ADA’s choice-based market model, both scenarios are considered equally valid. ADA organized the data in several ways, including preferences by consumer age and location, and by commute type. Some of the interview respondents had much longer commutes that could influence their valuation of lower fuel costs and particular HEV configurations. To take this factor into account, ADA collected data for consumers in three categories of one-way commutes: less than 5 miles, 5 to 15 miles, and greater than 15 miles. In the following section, the different commute distances are first averaged together to demonstrate general preferences for HEVs and are then shown separately.
5.2.4.1 Base Case Results
The base case or Scenario 1 results show that consumers are interested in HEVs. Approximately 35% of respondents who drive a mid-size vehicle would choose an HEV 0 over a conventional vehicle, 35% would choose an HEV 20 over a conventional, and 17% would choose an HEV 60 over a conventional vehicle. Note that these shares represent market potential or preference assuming that HEVs are well established and have equal availability to conventional vehicles (see assumptions in Section 5.1.1). Market potential does not necessarily equate to market share. Instead, the model presents the possibilities as though a mid-size vehicle is offered in all configurations, chosen one at a time: it models the choice between a conventional vehicle and HEV in the same way as people select an L-4 or a V-6 engine today.
The confidence intervals for the Scenario 1 base case market preference results for the 92 mid-size participants are 35.4% ± 5.6 % for the HEV 0, 34.5% ± 6.6% for the HEV 20, and 16.9% ± 5.7% for the HEV 60. This statement is valid only if the entire set of base case assumptions applies. For the full 386 participants (mid-size, compact, SUV and luxury) assuming Scenario 1, the preliminary market preference results are 26.8 ± 2.8% for the HEV 0, 26.3 ± 3.1% for the HEV 20, and 11.7 ± 2.3% for the HEV 60. ADA believes the statistical validity for a sample of this size is reasonable (see Section 5.2.3.2). The contrast between the mid-size car results and the broader results for all four platforms is shown in Figure 5-1. The reason the market preference is lower for all four platforms combined is because at the preliminary base price there is somewhat less market preference for the compact, SUV, and luxury markets. Analysis of the other segments will be published in a subsequent report.
5-14
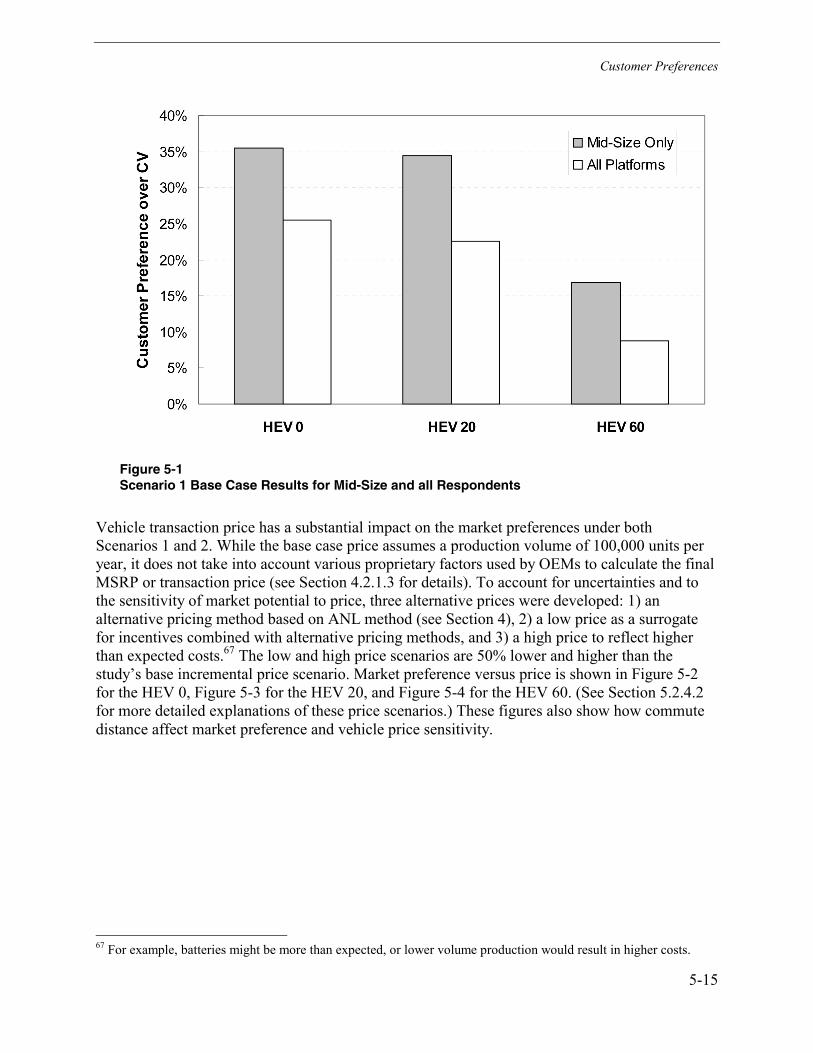
Customer Preferences
Figure 5-1 Scenario 1 Base Case Results for Mid-Size and all Respondents
Vehicle transaction price has a substantial impact on the market preferences under both Scenarios 1 and 2. While the base case price assumes a production volume of 100,000 units per year, it does not take into account various proprietary factors used by OEMs to calculate the final MSRP or transaction price (see Section 4.2.1.3 for details). To account for uncertainties and to the sensitivity of market potential to price, three alternative prices were developed: 1) an alternative pricing method based on ANL method (see Section 4), 2) a low price as a surrogate for incentives combined with alternative pricing methods, and 3) a high price to reflect higher than expected costs.67 The low and high price scenarios are 50% lower and higher than the study’s base incremental price scenario. Market preference versus price is shown in Figure 5-2 for the HEV 0, Figure 5-3 for the HEV 20, and Figure 5-4 for the HEV 60. (See Section 5.2.4.2 for more detailed explanations of these price scenarios.) These figures also show how commute distance affect market preference and vehicle price sensitivity.
67 For example, batteries might be more than expected, or lower volume production would result in higher costs.
5-15

Customer Preferences
Figure 5-2 Preferences for HEV 0 by Commute Distance
Figure 5-3 HEV 20 Preference by Commute Distance
5-16

Customer Preferences
Figure 5-4 Preferences for HEV 60 by Commute Distance
In Figure 5-5, commute distance versus market potential is shown for Scenario 2 (consumers choose one vehicle from all configurations). The data is analyzed in this manner to understand which type of vehicle configuration are preferred by consumers who have different commute distances. As seen in Figure 5-5, the HEV 20 is nearly equally popular among consumers with low, mid, and high distance commutes. However, the small differences in HEV popularity may not be statistically significant since the low and mid commute distance subgroups were only 23 and 29 people, respectively, somewhat below the desirable minimum sample size of 30. Figure 5-5 illustrates that, regardless of commute, due to the HEV 60's high price, consumers find it the least attractive option if they are presented with other HEV choices. It should also be noted that in mid and high commute cases, over 50% of the respondents would prefer an HEV to a conventional vehicle. Additional information is also available from the Customer Preference Survey, such as market share versus age, income, city, attitudes, home ownership, gender, or other factors. At present, this data has not been analyzed but could be part of a follow on effort.
The effects of vehicle pricing on market preference are shown in Figure 5-6 for Scenario 2. The bars in each price scenario add up to 100% market potential. This figure also illustrates one estimate of how consumers factor price into their decisions. There is a preference for the HEV 60 in the low price scenario price, a preference for the HEV 20 at the ANL and base case price scenarios, and a preference for the HEV 0 in the high price scenario. In fact, over 70% of respondents choose one of the three HEVs in the low price scenario. In the high price scenario, fewer than 40% of the respondents chose HEVs over CVs and fewer than 2% of consumers chose the HEV 60 over the other configurations.
5-17
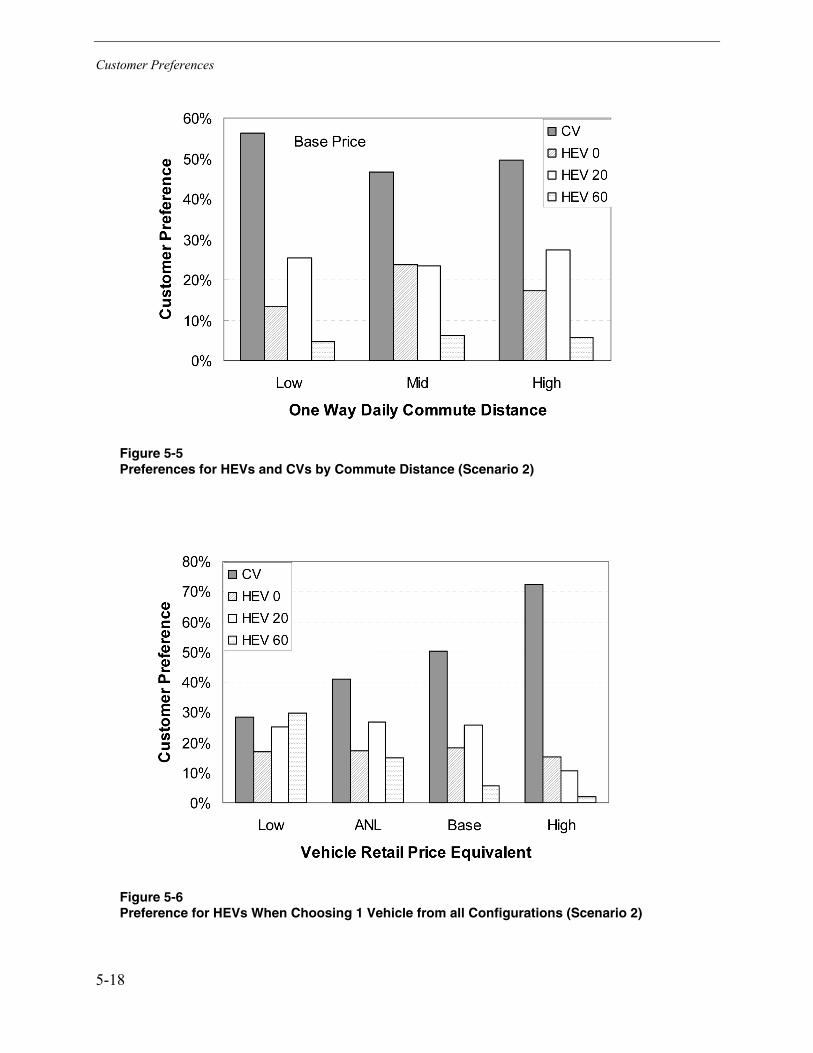
Customer Preferences
Figure 5-5 Preferences for HEVs and CVs by Commute Distance (Scenario 2)
Figure 5-6 Preference for HEVs When Choosing 1 Vehicle from all Configurations (Scenario 2)
5-18

Customer Preferences
5.2.4.2 Sensitivity Analysis
Although the base case results are revealing, the sensitivities of consumer preferences to various assumptions are also significant. For each of the values in the base case, the WG chose ranges to represent uncertainties in technology, costs, and policy. The customer preference model produces the same types of outputs as in the base case, but uses alternative parametric inputs to determine a range of market preferences. These preferences are most easily viewed in the form of tornado charts, which are presented on the following in Figures 5-7 through 5-9 using the base case (Scenario 1).68
HEV 0 Base Case Assumptions:
�� Results are for a midsize HEV 0 versus a conventional vehicle with the survey taker not having to change brand or current model
�� Average of all mid-size respondents (92) �� Conventional vehicle price: $18,984 �� 100,000 miles using the average driving schedule (see Section 4.2.2.2) �� Fuel economy: 36.5 mpg city, 34.1 mpg hwy (includes ‘real world’ factor) �� Extra features available as option: 110/120-volt plug, pre-heat/pre-cool capability �� No incentives �� Fuel savings $239/yr
Figure 5-7 Market Potentials for Mid-Size HEV 0 Versus a Conventional Vehicle
68 When evaluating the information presented in tornado charts, it must be remembered that the individual parameters on each bar cannot be added; instead a new base case with different parameters would need calculated.
5-19

Customer Preferences
HEV 20 Base Case Assumptions:
�� Results are for a midsize HEV 20 versus a conventional vehicle with the survey taker not having to change brand or current model
�� Average of all mid-size respondents (92)
�� Conventional vehicle price: $18,984
�� 100,000 total miles using the average driving schedule of 13,322 mi/yr (see Section 4.2.2.2) and 29,425 all electric range (AER) miles for base case. 39,604 AER for unlimited case.
�� No battery replacement requires limited all-electric driving
�� Fuel economy 36.8 mpg city, 36.7 mpg hwy; 0.32 kWh/mi city, 0.36 kWh/mi hwy (includes factor for “real world driving)
�� 5.9 kWh battery pack capacity
�� Fuel tank range is charge-sustaining miles only. Vehicle is plugged in daily.
�� Extra features available as option: 110/120-volt plug, pre-heat/pre-cool capability
�� No incentives
�� Off –peak electricity cost: 6¢/kWh
�� Fuel savings $394/yr
Figure 5-8 Market Preferences for Mid-Size HEV 20 Versus a Conventional Vehicle
5-20

Customer Preferences
HEV 60 base case Assumptions:
�� Results are for a midsize HEV 60 versus a conventional vehicle with the survey taker not having to change brand or current model
�� Average of all mid-size respondents (92)
�� Conventional vehicle price: $18,984
�� 100,000 total miles using the average driving schedule of 13,332 (see Section 4.2.2.2) with 75,965 all electric range (AER) miles. No battery limits.
�� Fuel economy 38.2 mpg city, 38.8 mpg hwy; 0.33 kWh/mi city, 0.37 kWh/mi hwy (includes ‘real world’ driving factor)
�� 17.9 kWh battery pack capacity
�� Fuel tank range is charge-sustaining miles only. Vehicle is plugged in daily.
�� Extra features available as option: 110/120-volt plug, pre-heat/pre-cool capability
�� No incentives
�� Off-peak electricity cost: 6¢/kWh.
�� Fuel savings $513/yr Figure 5-9 Market Preferences for Mid-Size HEV 60 Versus a Conventional Vehicle
5-21

Customer Preferences
The tornado charts show that consumers are most sensitive to the price of the vehicle, battery price, and fuel costs. Although other attributes, such as maintenance savings, electrical upgrade costs, environmental benefits, and trips to the gas station (fuel tank size) create shifts in market preference, they tend to be less significant than the monetary attributes. Only the HEV 0 shows appreciable sensitivity to environmental benefits, suggesting that price completely dominates preferences for the more expensive HEV 20 and HEV 60.
Some of the attributes have relatively small effects on customer preference because their ranges are relatively small; nevertheless, they are important. For example, due to size and weight for representative vehicles, their gasoline tank size cannot be increased enough to significantly reduce the frequency of fuel station visits even though consumers value that attribute. The desire to have a longer range is one reason for the consumers’ preference for an HEV 60. The relationship of tank size to vehicle configuration and range is addressed in Appendix C.
The vehicle and battery price ranges in the figures above are based upon a low and high price plus the base case using the Base Method for vehicle retail price estimates. The prices, along with values for other sensitivity attributes, are listed above the market share bars in the figures. Although the prices are only parametric values chosen to produce a range of customer preferences, they are intended to reflect actual prices based on two WG estimates of retail prices (Base and ANL). However, since each automaker develops the MSRP or transaction price based on their own proprietary formula, prices ranges are used in the figures of this section. The lower range represents the possibilities that production, marketing, and other sales costs will be less than expected or that competition, market demand, or efforts to capture new markets cause prices to be set lower. Alternatively or in addition, low prices could be the result of significant policy or tax incentives for purchase of HEVs.
The highest price (a 50% increase in the incremental prices of the HEV base cases) represents the possibility that vehicle costs are much greater than estimated here. Since the model can test unlimited “what if?” scenarios, any price can be evaluated for customer preferences. The intersection of the vertical line with the x-axis of the tornado charts shows the market potential for vehicles priced according to the Base method retail price equivalent. As noted above, this results in 35.4% market potential for HEV 0, 34.5% for the HEV 20, and 16.9% for the HEV 60. Using Scenario 1 comparisons but with vehicles priced lower according to the ANL retail price equivalent, the market potentials are 45.9% for the HEV 0 (at $21,373), 46.7% for the HEV 20 (at $22,971), and $32.6 % for the HEV 60 (at $26,319).
A high gasoline price of $3.00 per gallon fuel price significantly increases the preferences for all three HEV architectures, making the price of gasoline an important factor for HEV market penetration. Electricity price changes where not explicitly included. However, a possible surrogate for changes in electricity prices can be found by using the gasoline price bar also for electricity price, in the unproven assumption that vehicle owners/users value a $100 increase in gasoline annual costs the same as a $100 increase in electricity annual costs.
While not shown in Figures 5-7 through 5-9, there is significant sensitivity to an independent attribute called “extra features” (pre-heating or pre-cooling the vehicle to provide a more comfortable environment when entering the parked vehicle, and offering a 110V plug capability for operation various home, work, office and recreational appliances). For the HEV 20 and HEV 60, in which these features were assumed available with the engine off (using battery power alone), 41% of survey respondents chose both options, an additional 26% selected one feature,
5-22

Customer Preferences
and 33% selected no features. For the CV and HEV 0, which must have the engine on to use these features69, 83% selected no features, 16% selected one feature, and 1% selected both features. See Appendix D.8 for details.
Another interpretation of the survey responses are that people prefer the HEV 6070 if all HEVs are priced at $24,000 or at $27,500. Similar results occur if Scenario 1 data is analyzed at 18%, 25% and 45% market potential for each of the three HEVs. Specifically, HEV purchase intenders are willing to pay about $3,000 more for the HEV 60 than the HEV 0, and about $1,800 more for the HEV 20 than the HEV 0. HEV 0 purchase intenders are also willing to pay significantly more for the HEV 0 than the CV. See Appendix D.7 for discussion and charts. It not known why there is this indication of willingness to pay more, but in the next section, consumers indicate they are influenced by over 10 HEV benefits.
5.3 Direct Assessment Survey Responses
The final section of the computer-based interview had more than 80 direct assessment questions. More than 20 were asked at the beginning of the interview listed in Appendix D.2. The results of the direct assessment questions did influence the calculation of market potential described in Section 5.2. Some of the most important responses and findings are reported below. Some of the most interesting questions are about consumer ranking of HEV benefits (5.3.1), interest in plugging-in versus going to the gas station (5.3.2), and consumer ranking of HEV incentives (5.3.3).
5.3.1 Ranking of HEV Benefits
In the direct assessment section of the interview, consumers were asked how they value various HEV benefits. Most of these benefits had not been explained to the interviewees, yet they still received relatively high ratings. Specifically, respondents were asked to rate on a scale of 1 to 9, several benefits, where 1 = no influence on my decision, and 9 = strong influence on my decision to purchase an HEV. Table 5-6 shows the 16 most influential benefits ranked by the percent of respondents which gave the benefit a 7 to 9 score.
Several of the benefits listed above show significant interest by consumers and can be used in marketing HEVs. The results also show there is a complex set of benefits offered by HEVs that customers are interested in and is not just a simple trade-off of fuel cost savings versus increased up front costs. In addition to fuel costs, reducing maintenance time and cost, increasing range, and the convenience of leaving every morning with a fully charged battery are very important or influential benefits.
There are important differences between HEV preferrers and all respondents, and analysis of the direct assessment results can be useful for explaining “why” the preferrers chose HEVs. Generally, preferrers value all of the HEV benefits more than all respondents. For example, for the preferrers of all three types of HEVs, “fuel cost savings” is more important than “price.” It is also interesting to note there are differences in demographics. For example, women, higher income households, and blacks prefer HEVs more.
69 While it is possible for CVs and HEV 0s to provide these options with the engine off, the amount of time that they could be used would be significantly shorter than for plug-in HEVs or a separate battery would need to be provided. 70 Over 50% increase in market potential with the HEV 60 compared to the HEV 0.
5-23

Customer Preferences
5.3.2 Interest in Plugging in Versus Going to the Gasoline Station
Participants were asked about their preferences for vehicle options on the basis of plugging in versus going to the gas station, on a ranking scale of 1 –9, where 1 = strongly prefer to fuel my vehicle with gas at the gas station, and 9 = strongly prefer to fuel my vehicle by plugging it in at home. More sophisticated choice-based market model results for willingness to purchase a vehicle which is plugged in each night (the HEV 20 and HEV 60)71 are shown in the tornado charts (Figures 5-8 and 5-9), where interest varies with vehicle price and other key attributes. The results of the above direct assessment question in Table 5-7 verify the market model results by showing that people have a large interest in plugging in their vehicle.
Table 5-6 Ranking of HEV Benefits and Other Factors with High to Strong Influence for Mid-Size Vehicle Owners
HEV Benefit (7-9) Rank
Average Score
Vehicle Price 91% 8.3 ±.3
Fuel cost savings 89% 8.0 ±.3
Reducing maintenance (cost and personal time) 87% 7.8 ±.3
50% longer range a 83% 7.7 ±.3
Tax Breaks 77% 7.5 ±.4
Leaving every morning with a fully-charged battery 73% 7.2 ±.4
Better handling: balanced weight distribution 71% 7.1 ±.4
Reducing air pollution and global warming gases 66% 7.1 ±.4
Better handling: lower center of gravity 66% 6.8 ±.4
Quietness (at stops and acceleration) 61% 6.7 ±.4
Reducing dependence of foreign oil 60% 6.5 ±.5
Less vibration and fatigue (at stops and acceleration) 60% 6.6 ±.4
Improved 0-30 and 0-60 mph acceleration 55% 6.6 ±.4
Pre-heat / pre-cool with the engine off 52% 6.3 ±.5
Using 110/120V plug to run electric items with engine off 41% 5.6 ±.5
Carpool lane access 38% 4.9 ±.6
Avoiding exposure to fumes/spills at gas stations 35% 5.3 ±.5
Attention / pioneer image 33% 5.1 ±.5
Avoiding personal security issues at gas stations 29% 4.4 ±.6 a A 50% longer range was not a design feature of the HEVs in the study, but can be accomplished by a larger capacity battery or a larger fuel tank.
71 With the nine attributes, the HEV 20 and HEV 60 benefits were described as well as the costs such as the need for an electrical system upgrade.
5-24

Customer Preferences
Table 5-7 Gasoline Station Versus Plugging-in Question Result for Mid-Size Vehicle Owners
Ranking Results
Average with confidence interval 6.9 ±.35
1-3 Ranking 1.1%
4-6 Ranking 35.9%
7-9 Ranking 63.0%
5.3.3 Ranking of HEV Incentives
In the attribute trade-off question section of the interview, participants were asked to rank their preference for different types of incentives that provide on-going benefits (on a scale of 1-9 where 1= no influence, and 9= strong influence).72 The results of this ranking are shown in Table 5-8 for favorite incentives. The favorite incentives for the mid-size respondents are the free, reserved parking at work, the free charging at work, and carpool lane access for HEVs with a single occupant.
Table 5-8 Favorite on-going Incentives for Mid-Size Vehicle Owners
On-going Incentive Results
Free, reserved parking at work 27%
Free charging at work 25%
Carpool (HOV) access 20%
Free, reserved parking at the mall 13%
Free, reserved parking at train stations 6%
Free charging at the mall 4%
Free charging at train stations 1%
None 4%
Incentives that reduce the up front price of the HEV, such as tax credits73, were not included in the list because their impact was accounted for by varying up front vehicle price. Tax credits or other incentives that reduce the up front price are very popular. The tornado charts earlier assumed no incentives in the base case. However, if all the incentives in Table 5-8 were available, the HEV 20 market potential would increase from the base 35% to 50%, the HEV 60 market potential from 17% to 30%. If only the incentives under government control (carpool lane access, and free parking/charging at train stations) were implemented, the market potential of the HEV 20 would increase from the base 35% to 42%, the HEV 60 from 17% to 22%. Incentives that lower the price of the vehicle to the customer can have a more dramatic impact on market preference. For example, lowering the up front incremental price for the HEV 60 by $5,000 increases the market potential from 17% to over 50%. 72 The participants were also asked trade-off questions based on each participants 2 favorite and no incentive situations. 73 Note that sales tax exemptions, grants, direct rebates, and tax deductions are other examples.
5-25


6 HEV COMMERCIALIZATION OPPORTUNITIES AND BARRIERS
This section reviews the issues associated with commercialization of hybrid-electric vehicles including social policies and incentives, technology opportunities and barriers, and marketing and public outreach. Although this study indicates that HEVs can be designed to perform, and presumably look and “feel,” much like conventional vehicles, HEVs — especially HEV types that plug in and can be operated with battery power only — are certain to face questions and barriers in their commercial introduction. Like other new automotive and other major consumer products, HEVs will be successfully commercialized only if the product meets an existing or evolving market need, and if the introduction plan and strategy can present this new option as an attractive, technically mature, and economically viable vehicle. Given the multiple challenges associated with this goal, it is important to analyze the potential benefits and challenges manufacturers and consumers are likely to experience when producing and purchasing HEVs. In particular, several issues and opportunities of probable impact (partly identified but not resolved in the previous report sections) need to be considered. These include:
�� Technology barriers that must be overcome to reduce costs and/or increase adoption of the HEV
�� Attractive technology opportunities not feasible with conventional vehicles such as high energy demand, off-board battery-powered accessories
�� Possible barriers of and opportunities from existing and potential policies on HEVs on the global, federal, state, and local levels
�� Need for public education on the special benefits and features of HEVs; adoption of standard vocabulary in education, marketing, and sales; metrics to compare HEVs with each other and conventional vehicles
The analysis of these issues results in several findings:
�� In general, HEVs currently have significant opportunities to take advantage of policy and tax incentives. Although most current policies have not been written specifically for HEVs, a variety of options and some limitations exist for including these vehicles.
�� In the last national energy security policy bill (EPAct 1992) alternative fuel vehicles were encouraged with tax breaks, but HEV 0s were not, and plug-in HEVs were given a mixed signal (HEV 60s are likely to qualify, but it is not clear if plug-in HEV with less all electric range qualify). Policymakers should consider the potential petroleum reduction and environmental benefits of HEVs in future legislation. If there are tax or research provisions for HEVs in future legislation, policymakers should consider including different treatment
6-1

HEV Commercialization Opportunities and Barriers
for different types of HEVs based on all electric range attributes. The findings in Sections 3 and 4 may support larger incentives for HEVs with more all electric range (or more combined fuel economy).
�� Current Corporate Average Fuel Economy (CAFE) regulations require use of a “petroleum equivalency factor” and a constant percentage of operation on electricity. Ongoing review of the dual fuel rules should consider changes to the way in which HEVs contribute to a manufacturer’s CAFE value.
�� In contrast to most alternative fuel vehicles, HEV 0s do not have a commercialization problem with fueling infrastructure because they use gasoline only. Since most plug-in HEVs only need 120 V plugs, they have few infrastructure costs and concerns compared to most alternative fuel vehicles. The battery also allows a wide array of extra features that might help HEV commercialization.
�� There may be a need for public education regarding the multi-fuel capability of plug-in HEVs, which have received essentially no attention so far.
6.1 Policies and Incentives
Unless the cost of HEVs can become more competitive with conventional vehicles, the commercialization of HEVs may depend on various policies and incentives at the local, state, and federal level of government. The nature of these policies and incentives could be quite diverse and could include such things as: free parking, HOV lane access, criteria emissions and greenhouse gas regulations, fuel economy regulations, tax credits and deductions, and vehicle purchase subsidies. Some of these measures, like purchase subsidies and tax credits, could provide benefits to the consumer to increase HEV demand. This section discusses these various policies and incentives that could effect the commercialization of HEVs and analyzes the impact different measures will likely have on different HEV models.
6.1.1 Current and Pending Policies and Incentives
There are currently a wide variety of state and federal polices that provide financial incentives to encourage the commercialization of alternative fuel vehicles (AFVs). In general, most of the policies do not include or apply to HEV 0s. However, with the exception of the California Low-Emission Vehicle Regulations that encourage the development of plug-in HEVs, it is generally unclear how the other AFV policies will, or will not, apply to plug-in HEVs.
Some regulations are intended to encourage auto manufacturers to develop HEV 0s and plug-in HEVs with increased all-electric range. Other regulations limit their incentives to pure electric vehicles. Some programs place the burden on automakers and/or purchasers to prove that a given HEV design should be eligible for a given AFV incentive. This process varies, depending on the agency, but in general it involves making legal, technological, and factual arguments that a specific HEV design should fall within some rather vague definition of an AFV, EV, or some other similar term that does not clearly include or exclude HEVs.
6-2

HEV Commercialization Opportunities and Barriers
Given these uncertainties with the current policies, some new policies are now being proposed at the state and federal level which would either explicitly extend certain incentives to HEVs, or provide benefits to lower emitting and/or more efficient vehicles in a technologically neutral manner which could include HEVs of various types and designs.
Table 6-1 briefly summarizes the current incentives and mandates at the federal and state level. It also indicates how those policies might apply to HEV 0, HEV 20, and HEV 60. Following the table, a more detailed discussion is provided of the federal and California policies, as these are currently the vanguard jurisdictions for AFV incentives.
Table 6-2 displays some of the generic types of incentives and mandates that may effect HEV commercialization and summarizes the possible effect that such polices will have on various stakeholders like consumers, automakers, energy providers, government regulators, and other stakeholders including environmental advocacy groups.
6.1.1.1 Federal Incentives for HEVs
Federal incentives come in several different forms:
�� Consumers may receive purchase subsidies from tax credits and deductions (government and non-profit entities can’t get these even if the vehicle is owned by a leasing institution).
�� Fleet operators may be able to satisfy certain alternative fuel vehicle fleet requirements with HEVs.
�� Certain proposed federal legislation would explicitly provide purchase subsidies for HEVs.
This section will discuss each of these types of federal incentives and will analyze their possible interpretation with regard to different HEV designs.
6.1.1.1.1 Tax Incentives
Federal law currently provides two possible financial incentive mechanisms that could possibly apply to HEVs. They are the Electric Vehicle Tax Credit, (US Code 26 section 30) and the Clean-Fuel Vehicle Tax Deduction (US Code 26 section 179A). The former provides a tax credit of 10% of an EV’s total purchase price, with a $4,000 limit. The latter provides a tax deduction (not a credit) for the incremental cost of certain alternative fuel and flex-fuel vehicles, as well as a business deduction for the cost of installing AF refueling/ recharging equipment. These deductions are limited to $2,000 for the cost of the vehicle, and $100,000 for the cost of the equipment. Both the credit and deduction provisions will terminate at the end of 2004. (A phase out starts in 2001 with a 25% reduction in the maximum incentive amounts.)
6-3
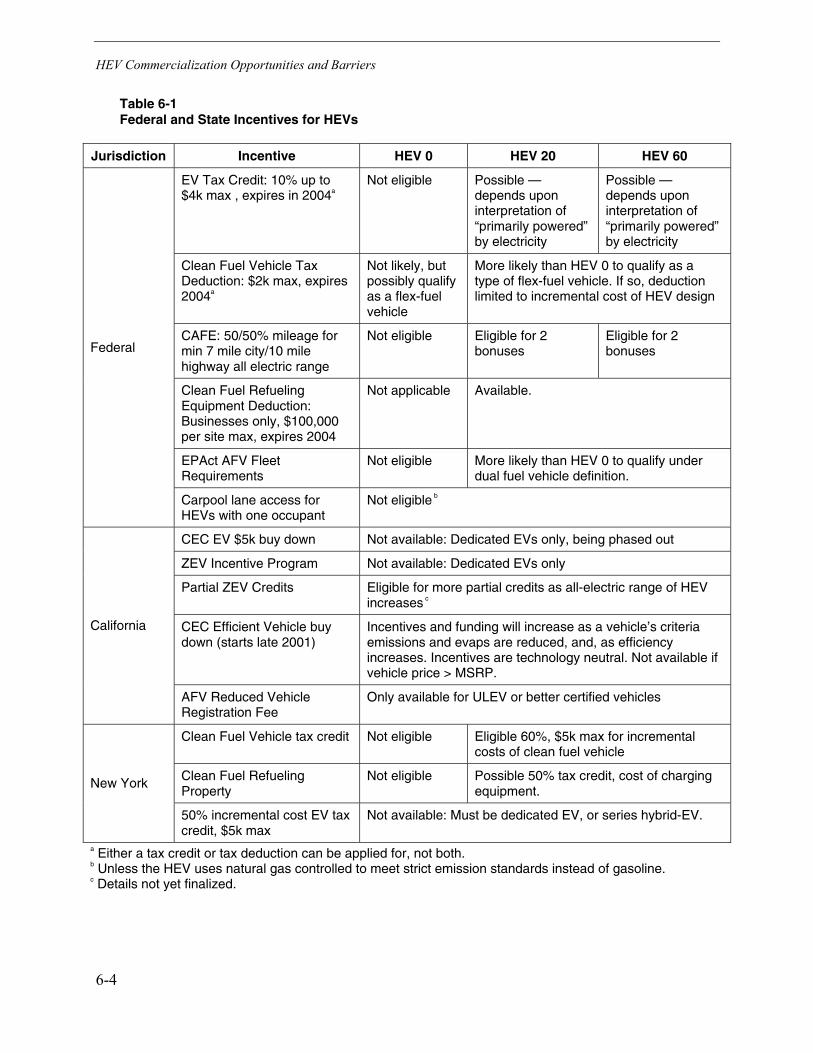
HEV Commercialization Opportunities and Barriers
Table 6-1 Federal and State Incentives for HEVs
Jurisdiction Incentive HEV 0 HEV 20 HEV 60
EV Tax Credit: 10% up to $4k max , expires in 2004a
Not eligible Possible — depends upon interpretation of “primarily powered” by electricity
Possible — depends upon interpretation of “primarily powered” by electricity
Clean Fuel Vehicle Tax Deduction: $2k max, expires 2004a
Not likely, but possibly qualify as a flex-fuel vehicle
More likely than HEV 0 to qualify as a type of flex-fuel vehicle. If so, deduction limited to incremental cost of HEV design
CAFE: 50/50% mileage for min 7 mile city/10 mile highway all electric range
Not eligible Eligible for 2 bonuses
Eligible for 2 bonuses
Clean Fuel Refueling Equipment Deduction: Businesses only, $100,000 per site max, expires 2004
Not applicable Available.
EPAct AFV Fleet Requirements
Not eligible More likely than HEV 0 to qualify under dual fuel vehicle definition.
Federal
Carpool lane access for HEVs with one occupant
Not eligible b
CEC EV $5k buy down Not available: Dedicated EVs only, being phased out
ZEV Incentive Program Not available: Dedicated EVs only
Partial ZEV Credits Eligible for more partial credits as all-electric range of HEV increases c
CEC Efficient Vehicle buy down (starts late 2001)
Incentives and funding will increase as a vehicle’s criteria emissions and evaps are reduced, and, as efficiency increases. Incentives are technology neutral. Not available if vehicle price > MSRP.
California
AFV Reduced Vehicle Registration Fee
Only available for ULEV or better certified vehicles
Clean Fuel Vehicle tax credit Not eligible Eligible 60%, $5k max for incremental costs of clean fuel vehicle
Clean Fuel Refueling Property
Not eligible Possible 50% tax credit, cost of charging equipment.
New York
50% incremental cost EV tax credit, $5k max
Not available: Must be dedicated EV, or series hybrid-EV.
a Either a tax credit or tax deduction can be applied for, not both. b Unless the HEV uses natural gas controlled to meet strict emission standards instead of gasoline. c Details not yet finalized.
6-4

HEV Commercialization Opportunities and Barriers
Table 6-1 Federal and State Incentives for HEVs (concluded)
Jurisdiction Incentive HEV 0 HEV 20 HEV 60
Rhode Island
50% of incremental cost tax credit for vehicle and infrastructure
Not eligible Possible 50% tax credit for AFV incremental costs; and total recharging equipment costs
Connecticut 50% corporate tax credit for EV purchase/recharge equip
Not available – only for EVs “exclusively” powered by electricity.
Tax exemptions for incremental costs of clean fuel vehicles.
Not likely eligible for any exemption since powered by gasoline.
If considered an “electric vehicle”, possible tax exemption of 50% of HEV purchase price
Maine
50% tax credit for infrastructure
No eligible Eligible
Mass. Rapid charging stations Not eligible Limited public charging facilities available
Vehicle tax credit for business and individuals
Eligible if emissions are low enough
Coloradoa Tax credit for infrastructure Not applicable Off-board chargers and other
infrastructure eligible.
$2,500 tax credit for low emission vehicles
Eligible if emissions are low enough
Georgiab $2,500 business tax credit for charger
Not applicable Eligible
Marylandc Tax credit for HEVs varies from $250 to $1,500
Eligible
Utah Grants up to $3,000 for businesses to purchase clean fueled vehicles
Not Eligible HEV 20 probably not eligible. HEV 60 Eligible if it can show 70% of miles on electricity
Tax rebates for AFVs All HEVs eligible for up to $4,000 to cover incremental costs. Available to government agencies only
New Jersey 10% business tax credit for EV and infrastructure
All HEVs eligible for incentives – limited to government agencies only
Other States HEV incentives may exist but they were not examined a HB 1067 (law as of 5/31/00) Details unavailable at this time. b HB 801 (law as of 4/29/00) Details unavailable at this time. c HB 20 (law as of 5/11/00) Based on energy efficiency with bonus depending on amount of regenerative
braking. Other details unavailable at this time.
6-5

HEV Commercialization Opportunities and Barriers
Table 6-2 Effect of Existing HEV Incentives on Stakeholders
Incentives
Stakeholder
Government HEV
Purchase Grants
HEV Purchase
Tax Credit/ Deductions
Reduced Vehicle Lic/Reg
Fees
Recharging Equip
Installation Gov Subsidies
EPACT AFV Fleet Rule CAFE
ZEV Mandates
Consumers Purchase incentive
Purchase incentive
Purchase incentive
Plug-in purchase incentive
No effect Subsidizes more efficient vehicles
No effect
Regulators Budget constraints
No Effect No Effect Budget constraints
No effect Discourages HEV design over HEV 10
Encourages ZEV and ZEV like technologies
Automakers Increase market share of HEVs
increase market share of HEVs
increase market share of HEVs
increase market share of plug-in HEVs
Create demand for plug-in HEVs
Increase market share of plug-in HEVs
create demand for PZEV type HEVs
Environmental Organizations
Encourages lower emission/ efficient vehicles
encourages lower emission/ efficient vehicles
encourages lower emission/ efficient vehicles
Encourages lower emission/ efficient vehicles
Encourages lower emission/ efficient vehicles
Encourages lower emission/ efficient vehicles
Encourages lower emission/ efficient vehicles
Energy Providers
Plug in HEVs can increase electricity demands
Reduced petroleum demand from all HEV types
Plug in HEVs can increase electricity demands
Reduced petroleum demand from all HEV types
Plug in HEVs can increase electricity demands
Reduced petroleum demand from all HEV types
pub chargers: increase peak demand
private chargers: increase off-peak demand
Creates shift from petroleum to AF demand
Plug in HEVs increase electricity demands
Creates shift from petroleum to AF demand
According to the U.S. Internal Revenue Service, Office of the Chief Counsel in Washington D.C., it is uncertain whether the EV tax credit and clean fuel vehicle tax deduction would be available to HEVs of any type. In general, for the tax credit to apply, the IRS would have to be convinced that a given HEV is “primarily powered by an electric motor drawing current from rechargeable batteries, fuel cells, or other portable sources or electrical current.”74 There are many possible interpretations regarding what Congress meant by this phrase. Two possible examples are:
74 US Code 26 Section 30 (c)(1)(A).
6-6

HEV Commercialization Opportunities and Barriers
1. Determining whether the HEV is capable of being plugged in more than 50 percent of the time.
2. Determine whether the probability (using NPTS or other databases) of an HEV traveling more than 50 percent of its miles using the electric motor alone.75
Because it is unclear how large the all-electric range of an HEV is required to qualify for the tax credit, HEV commercialization in the near term is more difficult. The HEV 60, because of its long all-electric range, appears to have the strongest case for most of the possible interpretations of Congress’s definition, but the HEV 20 could meet at least one interpretation of the definition.
Currently there is no IRS ruling in regards to tax credits or deductions for HEVs. Initially, an individual would have to apply to the IRS for a “private letter ruling” to determine a given HEV’s eligibility. This procedure requires the payment of a fee and usually the participation of an attorney. Through this procedure, the IRS can give a party-specific ruling on the applicability of these tax provisions. Usually, once this is done, it sets a practical precedent and eventually if HEVs do become commercial, a standard interpretation could be set for them on these issues. This may already be happening as Toyota at a recent conference reported that the IRS is seriously considering allowing Prius customers to receive the federal tax deduction.
6.1.1.1.2 The Energy Policy Act of 1992 (EPAct)
Federal law, under EPAct, provides a mandate for federal, state, and alternative fuel provider fleets to be comprised of a certain percentage of AFVs.76 According to the DOE, no official rulings have been made as to the eligibility of HEVs to comply with these AFV fleet requirements.
It appears there are two possible ways that plug-in HEVs might be considered AFVs for the EPAct fleet mandates. The first is that dual fuel vehicles and flexible fuel vehicles (as with the federal tax deduction) qualify as AFVs for the EPAct fleet mandates, and electricity in the definition section for the fleet mandates77 includes electricity as an alternative fuel. Plug-in HEVs, could be eligible as dual fuel vehicles because they are “capable of operating on alternative fuel and on gasoline or diesel”78 or as flexible fuel vehicles79 because they are “engineered and designed to be operated on any mixture of two or more fuels.” The second is that DOE could require plug-in HEVs to instead meet a definition in federal regulations where “Electric-hybrid vehicle means primarily powered by an electric motor that draws current from rechargeable storage batteries, fuel cells or other sources of electrical current and also relies on a non-electrical source of power.”80 It seems likely that plug-in HEVs could meet the first definition, as well as many interpretations of the second definition. With the second definition, it is unclear how large the all-electric range needs to be, and the interpretations issues (discussed in the federal tax credit section above) become a factor. The lack of clarity creates a commercialization barrier to resolve.
75 Section 3.3.1 explains the many complexities and variations of doing these probabilities. 76 US Code 42 Sections 13212, 13257(o) and 13251). 77 US Code 49 Section 13211. 78 US Code 49 Section 32901. 79 Code of Federal Regulations, Title 10, Chapter 11, Part 490, Section 490.2. 80 Code of Federal Regulations, Title 10, Chapter 11, Part 490, Section 490.2.
6-7

HEV Commercialization Opportunities and Barriers
The mechanism for determining whether plug-in HEVs or HEV 0s would be considered AFVs under either of these criteria is to make a written “request for an interpretative ruling” to the DOE in regard to a specific model and technology. Such a written request would have to include, among other things, specifications, data, and relevant arguments to convince DOE that a given plug-in HEV model should be considered either a dual fuel/flexible fuel vehicle, or a vehicle that derives 50% or more of its power from its electric motor in order to be “primarily powered by an electric motor.” As with the federal tax credits and tax deductions, an alternative mechanism is to eliminate the confusion with legislation, or possibly a broad ruling for all the HEV variations that would send a clear signal to states, manufacturers, and component makers involved with HEV decisions and policy.
6.1.1.1.3 Corporate Average Fuel Economy (CAFE)
The specific provisions that determine the fuel economies for HEVs under the CAFE standards, are discussed below.
Current CAFE Standards
The Corporate Average Fuel Economy81 is a fuel economy standard that vehicle manufacturers must achieve each year. Federal legislation currently sets the value at 27.5 mpg for cars and 20.7 mpg for light duty trucks (under 8,500 lb gross vehicle weight rating). Each manufacturer calculates its passenger vehicle CAFE by harmonically averaging the fuel economy of all cars manufactured during a model year. The light duty truck CAFE is calculated in the same manner. The formula is commonly written in the format below.
(mpg) C Economy FuelC Modelof n ProductioTotal
(mpg) Economy BFuel B Modelof n ProductioTotal
(mpg) A Economy FuelA Modelof n ProductioTotal
turerby Manufac ProducedVehicles ofNumber TotalCAFE��
� [6-1]
The fuel economy of each vehicle is determined by Environmental Protection Agency in accordance with the Federal Test Procedure. This procedure weights the urban driving cycle test with the highway driving cycle test in a 55% to 45% ratio. If a manufacturer fails to meet the CAFE requirement, it must pay $5.50 per vehicle for each 0.1 mpg over the allowance.
CAFE Incentives for Alternative Fuels and Flexible Fuel Vehicles
Through the Alternative Motor Fuels Act (AMFA) of 1998, a section called “Manufacturing Incentives for Automobiles” was added to the CAFE regulations. This section contained incentives to manufacture vehicles designed to operate on alternative fuels, such as alcohols and natural gas. Later, in 1992, the Energy Policy Act broadened the alternative fuel list to include electricity, hydrogen, and several other non-gasoline or petroleum diesel fuels. CAFE, as it stands today, continues to provide incentives for the manufacture of dedicated and dual-fuel alternative vehicles.
81 US Code 42 Sections 32901 through 32919.
6-8

HEV Commercialization Opportunities and Barriers
In general, vehicles that operate on the above sorts of alternative fuels, like electricity, are given special consideration in determining their actual mileage rating. For electricity, the regulations require use of a specific petroleum equivalency factor (PEF) of 82,049 Wh/gal that boosts the fuel economy much higher than the 33,400 Wh/gal PEF used for fuel economy in J1711 or similar calculations discussed in Section 3.3.1.4. This is important because the CAFE fuel economies for plug-in HEVs with significant all-electric range are calculated using this higher petroleum equivalency factor which is essentially a bonus or incentive.
For flexible fuel vehicles like plug-in HEVs, which can be operated on a variable mixture of conventional and alternative fuels, CAFE applies a formula to approximate the percentage that the vehicle operates on an alternative fuel. In the case of plug-in HEVs, CAFE assumes that the vehicle operates on electricity fifty percent of the time as long as the HEV has at least 7.5 miles of city and 10.2 miles of highway all-electric range. An HEV can be charged between the city and highway tests, so most likely an HEV with a 10.2-mile AER could meet both tests. These distances refer to the length of one EPA urban driving cycle and one EPA highway driving cycle. Accordingly, in order for plug-in HEVs to have half of their mileage subject to the above fuel economy calculation using the CAFE petroleum equivalency factor, they only need to have a very limited amount of all-electric range, and, any additional all-electric range above this minimum is not recognized or rewarded under CAFE.
Flexibility for HEVs in CAFE Incentives
The legislation and associated rulings currently treat plug-in HEVs as dual-fuel vehicles. Although one could argue that some HEVs are primarily electric, it is not possible to claim them as dedicated electric vehicles because they are specifically handled as dual-fueled in the 1998 DOT ruling.82 Currently, the legislation and rulings are being reviewed as the dual-fuel regulations are scheduled to sunset in 200483.
Possible Hybrid Vehicle Fuel Economy Calculation for CAFE
There are several methods that could be used to calculate the fuel economy of an HEV as discussed in Section 3.3.1.5. Equation 6-2 gives the current method used under CAFE for vehicles with more than 10.2 miles AER. HEVs with less than the minimum AER have their equivalent fuel economy based upon 100% gasoline only mpg.
operation gasoline FE0.5
operation electric FE PEF0.5
1 hybridin -plug FE�
�
� [6-2]
82 49 CFR Part 538, Federal Register Vol. 63, No. 230, p 66064. 83 49 CFR Part 538, Federal Register Vol. 65, No. 90 p. 26805.
6-9

HEV Commercialization Opportunities and Barriers
Under current CAFE regulations, there is no additional credit given for plug-in HEVs with more all-electric range than the 7.5 miles urban/10.2 miles highway and therefore no additional incentive for manufacturers to build HEVs with high all-electric ranges. Other methods of determining charging frequency and all-electric operation are discussed in detail in Section 3.3.1.3 and 3.3.1.4, and these could be used to increase CAFE credits for plug-in HEVs, thereby providing additional incentive to automobile manufacturers to build these vehicles. A strategy which uses UFs or MWPs based upon national statistics such as the 1995 Nationwide Personal Transportation Survey would provide additional credits for longer all-electric range HEVs.
CAFE Incentives for Manufacturers
The issues surrounding the effect of CAFE on manufacturers and their vehicle mixes are controversial. The common perception is that the 27.5-mpg CAFE regulation requires manufacturers to sell a greater number of smaller, less profitable, but more efficient vehicles than they would in absence of the regulation. Whether or not the perception is correct, the fact is that the high fuel economy of hybrid vehicles would naturally raise manufacturer’s CAFE fleet average. With a manufacturer’s CAFE increased through HEV sales, a manufacturer can either receive credits for CAFE fleet average above 27.5 or it can sell more vehicles that would normally make it difficult to achieve the 27.5 requirement.
6.1.1.1.4 HEVs in HOV Lanes and ZEV-Areas
In several states, permission has been granted to users of low- and zero-emission vehicles to enter High Occupancy Vehicle (HOV) lanes with only one person in the car. These exemptions to the normal HOV lane regulations have been developed to encourage purchases of these types of vehicles, since using HOV lanes can save considerable time. Since HOV lanes are both traffic demand management tools and air quality improvement tools, these policies fit nicely with the HOV lanes’ original purpose.
The various state laws for HOV lane access for single occupant vehicles (Hawaii, Georgia, Arizona, California) depend on a temporary exemption from federal law (U.S. Code 23 Section 102 (b) due to expire on September 30, 2003). Because this law applies only to Inherently Low Emission Vehicles (ILEVs), HEVs fueled with gasoline are not eligible for HOV lane access. The definition of ILEV is strict, such that even if the evaporative emission control system fails, there would not be evaporative emissions. While this is attainable for natural gas and electric vehicles, it is unlikely for gasoline-fueled HEVs. Legislation to extend the sunset clause and extend the exemption to more vehicles (by using an alternative fuel vehicle definition) has been introduced.
6-10

HEV Commercialization Opportunities and Barriers
6.1.1.1.5 Proposed Federal Legislation on HEVs Incentives
Table 6-3 summarizes the proposed federal legislation pending before the prior 106th Congress, which could effect the commercialization of HEVs.
Table 6-3 Proposed Federal Policies as of November 2000 Affecting HEVs
Proposed Federal Policy Measures Relevant to
Hybrids Time Frame Additional Notes
US S. 2591, Jeffords, Hatch, Robb, Chafee, Rockefeller, Bryan, Kerry: May 18, 2000. Alternative Fuels Tax Incentive Act
Credit against individual or business income tax of up to 50% of incremental cost dedicated AFV purchase.
Some tax incentives through 2010
Referred to the Committee on Finance
US HR 4270, Kildee: April 13, 2000. Advanced Technology Motor Vehicle Fuel Economy Act of 2000
Provide tax incentives for production, sale, and use of advanced-technology vehicles, assess methods to encourage use of fuel-efficient vehicles in interstate commerce
Unclear Referred to House Committee on Ways and Means and Committee on Commerce
US HR 2380, June 1999 and Presidential budget 2000; provide tax incentives for hybrid vehicles and extend credits for electric and fuel cell vehicles.
$500-$3000 tax credits for hybrids. Range depends on the percentage of maximum power provided by rechargeable energy storage system and energy provided through regenerative breaking
Hybrid vehicles bought between 2003-2006. Currently, only EV or fuel cell vehicles receive any federal tax credits.
Bill referred to House Committee on Ways and Means in June 1999 but measures placed in President’s budget proposal in Feb. 2000.
White House Executive Order, April 21, 2000: greening the government through federal fleet and transportation efficiency
Any agency with 20 or more vehicles must reduce petroleum use to 20% below FY 1999 levels by FY 2005; encourage leadership by government in use of alternative fuels and vehicles
Complete reductions by end of FY 2005
US S. 1003, May 1999. Alternative Fuels Promotion Act: Tax incentive for the purchase of alternative fuel and electric vehicles, and changes in HOV lane requirements
May or may not affect hybrids due to requirement of 100 mile alternative fuel range; provides up to 10% of cost plus $5000. Allows states flexibility to allow AFVs in HOV lanes
Credit extended to 2010, applies to vehicles purchased after date of enactment of amendment.
Referred to Committee on Finance in May 1999. No action since then – will either move forward or die in committee.
Senate version of HR 2252
US HR 2380, June 1999. Energy Efficient Technology Tax Act
Tax credit up to $2000 for hybrid vehicles plus additional $1000 for regenerative breaking
2003-2006 Referred to House Committee on Ways and Means.
��
��
��
��
��
��
6-11

HEV Commercialization Opportunities and Barriers
6.1.1.2 Current State Incentives
Several states have initiatives or regulations that provide incentives for the purchase of EVs or alternative fuel vehicles. In some cases, HEVs may qualify for incentives and in other cases, they are specifically excluded. It is useful to analyze these programs to determine how HEVs might be treated under the type of regulations that exist today. In addition, some regulations, such as the California ZEV mandate, will act as models for policies in many other states in the future.
6.1.1.2.1 California
California Energy Commission (CEC) EV $5,000 Buy Down Program CEC
Under this current program, the CEC provides $2,500 and the local Air Quality Management Districts (AQMD’s) provide another $2,500 toward the purchase of an electric vehicle by businesses or private individuals. However, this program is only available to dedicated electric vehicles and as such, no HEVs of any type are eligible for this funding.
Zero Emission Vehicle Incentive Program
Assembly Bill 2061, signed by Governor Gray Davis, makes available $18 million over three years to provide incentives for purchasers or lessors of zero emission vehicles (ZEVs). These incentives help defray the incremental cost between ZEVs and conventional vehicles (CVs), particularly while ZEVs are at low production volumes. Unfortunately, HEVs do not qualify under this bill.
Reduced Vehicle Registration Fees
As of 1999, California reduced the state vehicle license fee for owners of certain alternative fuel vehicles. The incremental cost of the purchase of an AFV is exempted from the license fee, which is usually two percent of the vehicle's original sales price. The law applies until December 31, 2002 and is only available to vehicles that are certified by ARB as producing emissions that meet, or are lower than, the emission standards and other specifications for ultra-low-emission vehicles (ULEVs).
Incentives to Lease or Buy Advanced Vehicles
The 2000/2001 California budget included provisions from SB 1344 and AB1740 for $5 million in incentives to lease or buy advanced vehicles, such as hybrids. The specific provisions to include or differentiate between HEV architectures were not developed.
6-12
HEV Commercialization Opportunities and Barriers
Zero Emission Vehicle (ZEV) Mandate
The ARB originally required that, beginning in 1998, 2% of all vehicles offered for sale by major automakers must be zero emission vehicles (ZEVs) and that by 2003, the percentage increase to 10%. In 1996, ARB suspended the 2% requirement for the years 1998-2002. In an effort to give more flexibility to automakers, ARB also modified the 10% requirement for 2003 to include a partial ZEV credit system and to allow 60% of the 10% ZEV requirement to be satisfied by partial ZEV credit vehicles. In January 2001, the ZEV regulations were revised again, and ARB staff is currently preparing a revised regulatory text to reflect those changes. The regulations continue to give larger ZEV credits for those HEVs with larger all electric range. Review of how the ZEV mandate changes might affect HEVs will be part of a Phase 2 effort of this study.
6.1.1.3 Proposed State Incentives
A number of proposed state incentive programs are discussed below.
6.1.1.3.1 CEC Efficient Vehicles Incentive Program
The CEC will be implementing a new vehicle purchase incentive program in the fall of 2001 for which HEVs of all types will be eligible. The new program, called the Efficient Vehicle Incentive Program, would provide around $5,000 of funding toward the purchase price of any vehicle technology type based on the degree that it reduces criteria emissions or increased efficiency. As a technologically neutral program, HEV 0s could potentially qualify for different levels of purchase subsidy funding depending on their criteria pollutant certification, whether they had a zero-evaporative certification, and their fuel efficiency rating. Likewise, HEV 20s and HEV 60s could potentially qualify for more funding than HEV 0s for emitting fewer criteria pollutants and having a higher efficiency per mile of operation.
6.1.1.4 Local Incentives
City and county level initiatives have the potential to affect parking and charging in civic locations. Since EVs have received special parking and charging consideration in some circumstances, HEVs could also possibly incur these benefits. The following section discusses how these local incentives might apply to HEVs and the effects for different stakeholders.
6.1.1.4.1 Parking and Charging Incentives for EVs and HEVs
There is currently a limited amount of free parking and/or charging that is provided to EVs at such locations as city owned parking garages (e.g. Sacramento), airport parking facilities (Los Angeles), and even some private businesses. The nature of these benefits varies depending on the specific location. In general, no EV parking benefits are likely to be extended to HEV 0s. HEV 20s and HEV 60s will usually be offered the same benefits as EVs, although some locations do limit both of these benefits to EVs only.
6-13

HEV Commercialization Opportunities and Barriers
6.2 Technology Barriers and Opportunities
Several technologies can either enhance HEV opportunities in the market or hinder their introduction. The following sections identify and discuss these opportunities and barriers. Among the HEV attributes that are considered opportunities are:
�� Availability of high battery power for on-board and off-board accessories. Battery power allows pre-heating or pre-cooling of the vehicle remotely, as well as powering a wide array of built-in or portable accessories used for recreation or work.
�� Plug-in hybrids, when compared to EVs, have unlimited range and suitability of 120 V charging systems. When compared to many alternative fuel vehicles, HEVs have less infrastructure requirements.
�� When compared to CVs, HEVs offer greater flexibility of using the HEV’s engine as a home generator and/or the battery storage system to supply electricity for the house or even the utility grid.
The opportunities are explored to determine if HEVs are especially suited to these technologies or present an advantage over conventional vehicles. In some cases, HEVs may provide synergistic relationships with new technologies. In addition, there are opportunities to encourage charging through the development of new technologies.
The barriers include the possibility that 120V charging isn’t capable of supporting plug-in HEVs and that battery degradation will significantly lower the lifetime of some HEVs and affect incentives. Nevertheless, this section assesses the severity of the barriers and whether they may be overcome.
6.2.1 Advantages of HEV Infrastructure
When compared to the commercialization requirements of many alternative fuel vehicles, HEVs have far fewer needs. For example, natural gas vehicles, methanol vehicles, propane vehicles, hydrogen fuel cell vehicles, methanol fuel cell vehicles, and hydrogen engine vehicles all require a new fueling infrastructure. A classic “chicken and the egg” commercialization problem of which comes first must be solved, and the infrastructure is generally expensive and risky for investors to install. HEV 0s do not have this infrastructure problem because they rely wholly on the existing gasoline fueling infrastructure. Plug-in HEVs have this problem to a much lesser degree because most of them can rely wholly on inexpensive 120 V plugs, and all plug-in HEVs can rely partially on 120 V plug access.
6.2.2 Battery Life
Like all rechargeable batteries, the batteries of HEVs will lose capacity with repeated cycling. Even the batteries of the type assumed in this study would begin to degrade, albeit NiMH batteries tend to lose capacity more slowly and last for more cycles than other candidates such as lead acid and lithium ion batteries. As a consequence, the electric range of a plug-in HEV will slowly decrease, (by definition) to 80% of its range at the end of the battery’s nominal cycle life.
6-14
HEV Commercialization Opportunities and Barriers
At this point, a HEV with 60 miles all-electric range at the time of its initial sale will only be capable of about 50 all-electric miles. With NiMH batteries, this process will continue after their nominal end-of-life because of the gradual rather than abrupt degradation process– a distinct advantage of this technology. Eventually, the battery will completely lose its ability to be charged with plug-in energy.
As noted in Section 4, one way of deriving value from a nominally “failed” HEV battery could be to operate it in the charge-sustaining mode (that is, like a HEV 0 battery) for some time. Whether this strategy is feasible depends on the battery’s rate of power degradation. For almost all battery types, that rate is higher than the rate with which their storage capacity degrades. However, it may be possible to design excess power into the relatively large batteries needed for plug-in HEVs, especially for HEV 20. In that case, sufficient battery power may still be available for a significant number of vehicle miles after the nominal end of battery cycle life has been reached, but no information appears to be available that could be used to assess the feasibility of this strategy and its cost-benefit trade-off with battery replacement.
The ramifications of battery degradation are several:
a) Consumer/Reaction to a vehicle technology whose all-electric performance (range and power) will decrease over the life of the vehicle and might necessitate costly battery replacement to restore performance.
b) Emissions increase with age: A decrease in an HEV’s all-electric range over its life will result in greater smog precursor and greenhouse gas emissions as the vehicle ages.
c) Regulations/Laws: How should regulators and lawmakers treat HEVs for smog precursor, greenhouse gas, and fuel economy regulations given the slow degradation of all-electric range, fuel economy and emissions?
6.3 Marketing and Public Education/Information
In marketing HEVs to the public, it is important to understand how the public responds to current information about HEVs and what strategies might be used to heighten HEV interest and sales in the future.
6.3.1 Current Marketing and Public Information Efforts
Hybrid vehicle marketing and public information efforts of automobile manufacturers, environmental groups, and the mass media were examined to shed some light on the following issues:
�� In the messages currently being distributed from the above sources about HEVs, are the benefits of hybrid electric vehicles clear to the consumer? What metrics are being used in current public media and outreach?
�� What aspects of the current hybrid electric vehicles are manufacturers addressing in their marketing efforts? What does this tell us about how manufacturers view the market?
6-15

HEV Commercialization Opportunities and Barriers
�� Some experts have argued that environmental issues are not of great concern to buyers – that reliability, performance, style, and price have been and will always be the most important factors in consumer choice. How much room is there for environmental messages to be used when selling a car?
�� In addition, experts have also claimed that the automakers are not in the position to effectively market environmental vehicles because doing so would attack their other products as anti-environment. Is it possible to market hybrid vehicles without creating this polarity and will manufacturers do so?
�� Has any misinformation or misleading information been spread about HEVs to date?
�� Have the above information sources failed to educate or expose the public to any significant aspects about HEVs?
As a result, the following conclusions were drawn:
�� While some information about non-plug-in hybrid vehicles has been made available to the public, the possible existence of plug-in hybrids is not well communicated, if at all. There appears to be no way for a customer to learn about such vehicles because that information doesn’t readily exist, either from automakers, environmentalists, or the mass media.
�� It is unclear if automakers think that consumers would find plugging-in to be disadvantageous. They clearly state that there is no need for their current HEVs to be plugged-in, however, which may initially bias consumers away from the possible advantages of plug-in HEVs.
�� The manufacturers very strongly emphasize the fuel economy and environmental benefits of their HEVs. This is done in a way that never compares them to their other products, but rather to their competitor’s products.
�� The automakers’ messages are also very clear that hybrid vehicles are not a compromise, that their design is only advantageous. They attempt to emphasize the “newness” of the vehicles while still maintaining that they are not simply research experiments.
�� The environmental groups have not come to the same decision about hybrids. They range from neutral to extremely proactive. In addition – possibly because hybrid vehicles are so diverse, both in design and benefit – these groups are publishing information about their advantages and disadvantages that may be misleading or confusing. They also have generally failed to expose the public to HEV plug-in technology.
Table 6-4 summarizes the problems and challenges in HEV marketing/public outreach to date and for the future, and presents possible solutions and strategies for each of those problems. These results can be very useful in developing a marketing/public outreach campaign.
6-16

HEV Commercialization Opportunities and Barriers
Table 6-4 HEV Marketing/Public Outreach Challenges and Strategies
Problem/Challenge Solution/Strategy
Incorrect/misleading/absence of information about HEVs presented by mass media
Educate mass media about HEVs via concerted public/private sector action
Traditional government/public sector/enviro group HEV public outreach ineffective
Publicly funded conventional HEV advertising campaign
Public is generally not aware of HEVs or is misinformed about them
(above two strategies)
Limited mass media attention/coverage given to HEVs
Encourage media attention with: - HEV ad campaign - Celebrity HEV endorsement in above ad campaign
Public receives inconsistent info about HEVs – gets confused
Concerted, joint public/private sector effort to provide consistent HEV info to public and mass media
Public does not respond favorably to guilt or intangible benefits messages about HEVs
HEV ad campaign should focus on positive, tangible benefits of HEVs
Public led to believe that non plug-in HEV design is more convenient
HEV ad campaign and media education should explain convenience aspects of plug-in HEVs
Public wants products that enhance their current lifestyle/values, not attempt to change them
HEV ad campaign should stress HEV’s attributes to serve current values/interest, not change them.
6-17


7 REFERENCES
1. Anderman, Menahem, Fritz Kalhammer, and Donald MacArthur, “Advanced Batteries for Electric Vehicles: An Assessment of Performance, Cost, and Availability,” California Air Resources Board, June 2000.
2. Unnasch, S. and D. Coleman, “Assessment of Current Knowledge of Hybrid Vehicle Characteristics and Impacts,” EPRI Report TR-113201, August 1999.
3. Brooker, A., et al, “ADVISOR 3.0 Documentation,” user’s guide available online at http://www.ctts.nrel.gov/analysis/advisor_doc, August 2000.
4. Senger, R., M. Merkle, and J. Nelson, “Validation of ADVISOR as a Simulation Tool for a Series Hybrid Electric Vehicle,” SAE paper 981133, 1998.
5. Wipke, K, M. Cuddy and S. Burch, “ADVISOR 2.1: A User-Friendly Advanced Powertrain Simulation Using a Combined Backward/Forward Approach,” NREL/JA-540-26839, September 1999.
6. American Iron and Steel Institute, “Ultralight Steel Auto Body Final Report,” Washington D.C., 1998
7. California Air Resources Board, “2000 Zero Emission Vehicle Program, Biennial Review, Staff Report,” August 2000.
8. Browning, L. D. Coleman, and R. Denbow, “Evaporative Emission Reduction Techniques,” presented at the 9th CEC On-Road Vehicle Emissions Workshop, April 1999.
9. Wang, M.Q., “GREET 1.5 – Transportation Fuel Cycle Model”, Report No. ANL/ESD-39, August 1999.
10. Unnasch, S. and L. Browning, “Refinement of Selected Fuel-Cycle Emissions Analyses,” Report No. FR-00-101, August 2000.
11. Lindgren, Leroy H., “Cost Estimations for Emission Control Related Components/Systems and Cost Methodology Description,” Rath & Strong, Inc., Report No. EPA 460/3-78-002, December 1977.
12. Cuenca, R.M., L.L. Gaines, and A.D. Vyas, “Evaluation of Electric Vehicle Production and Operating Costs,” DOE Report Number ANL/ESD-41, November 1999.
7-1

References
13. Lipman, Timothy, “The Cost of Manufacturing Electric Vehicle Drivetrains,” “UCD Report Number UCD-ITS-RR-99-7,” May 1999.
14. Vyas, Anant and Dan Santini, “HEV Cost Analysis for the EPRI Working Group,” presented July 2000.
15. Conversation with Fritz Kalhammer as part of the EPRI Working Group, July 2000.
16. Delucchi, Mark, Andrew Burke, Timothy Lipman, and Marshall Miller, “Electric and Gasoline Vehicle Life cycle Cost and Energy-Use Model,” UCD Report Number UCD-ITS-RR-99-4, April 2000.
17. Borroni-Bird, C., “Automotive Fuel Cell Requirements,” Proceedings of the 1996 Automotive Technology Development Customers’ Coordination Meeting, U.S. Department of Energy, Office of Transportation Technologies, Washington, D.C., 1996.
18. OTA, “Advanced Automotive Technology: Visions of a Super-Efficient Family Car,” United States Congress, Office of Technology Assessment Report OTA-ETT-638, Washington, D.C., 1995.
19. Green Car Institute, “Future EV Pricing,” 2000.
20. Coats, M. et. al., “Pricing for Success: Using Auto Industry Models to Review Electric Vehicle Costing and Pricing,” EPRI Final Report Number TR 107094, October 1996
21. Vyas, a., D. Santini, and R. Cuenca, “Comparison of Indirect Cost Multipliers for Vehicle Manufacturing,” Argonne National Laboratory Technical Memorandum ANL/ES/RP-101898, April 2000.
22. “The Complete Car Care Cost Guide 2000” compiled and published by IntelliChoice Inc., April 2000.
23. Vyas, A., R. Cuenca, and L. Gaines, 1998, An Assessment of Electric Vehicle Lifecycle Costs to Consumers, Proceedings of the 1998 Total Life Cycle Conference, Society of Automotive Engineers International Report P-339, Warrendale, Penn., pp. 161-172.
24. Booz-Allen & Hamilton Inc, “Zero-Emission Vehicle Technology Assessment,” The New York State Energy Research and Development Authority, NYSERDA Report 95-11, August 1995.
25. Kalhammer, Fritz, “Batteries for Electric and Hybrid Vehicles: Recent Development Progress,” November 1999.
26. Sekimori, T., “EV and HEV Battery Development at Toyota”, Proceedings of the 1st Advanced Automotive Battery Conference, Las Vegas, Feb. 5-8, 2001
7-2

8 GLOSSARY
A Ampere(s)
AC Alternating current
ADVISOR NREL’s ADvanced VehIcle SimulatOR – a computer model that simulates conventional, hybrid electric and electric vehicle operation
AE All-electric
AER All-electric range, i.e., the nominal range of a plug-in HEV when operating in electric-only mode
AF Alternative fuel
AFV Alternative fuel vehicle
ANL Argonne National Laboratory
APM Accessory power module
ARB California Air Resources Board
BACT Best Available Control Technology
BPM Brushless permanent magnet
CAFE Corporate Average Fuel Economy
CBMM Choice based market model
Cd Coefficient of drag
CEC California Energy Commission
CO2 Carbon dioxide
CV Conventional Vehicle
8-1

Glossary
CVT Continuously Variable Transmission
DC Direct current
DOD Depth of discharge
DOE Department of Energy
EMI Electromagnetic interference
EPAct Energy Policy Act
EPRI Electric Power Research Institute
EV Electric vehicle
FCT Full charge test. Simulates all-electric mode during ADVISOR modeling
FE Fuel economy
FTP Federal test procedure. A combination of FUDS and HWFET cycles
FUDS Federal Urban Driving Cycle. Used to determine fuel economy and emissions for city driving.
GFCI Ground fault circuit interrupt
g/kWh Grams per kilowatt hour
g/mi Grams per mile
GREET ANL’s Greenhouse Gas Emission Model
HEV Hybrid Electric Vehicle
HEV 0 A parallel hybrid with no all-electric range
HEV 20 A parallel hybrid with “plug-in” capability (that is, capability for battery recharging from an off-board source of electricity) and a battery providing about 20 miles of all-electric range
HEV 60 A parallel hybrid with plug-in capability and a larger battery providing about 60 miles of all-electric range
HVAC Heating, ventilating, and air conditioning
8-2

Glossary
HWFET Highway Fuel Economy Test. Used in determining fuel economy during highway driving
ICE Internal combustion engine
IGBT Insulated-gate bipolar transistor
ILEV Inherently low emission vehicle
kg Kilograms
kW Kilowatt(s)
kWh Kilowatt hour(s)
kWh/mi Kilowatt hours per mile
mg/mi Milligrams per mile
mpeg Miles per equivalent gasoline gallon. Miles per kilowatt hour are converted to mpeg using 33.44 kWh/gasoline gallon
mpg Miles per gasoline gallon
mph Miles per hour
MWP Mileage weighted probability
MSRP Manufacturer suggested retail price
NiMH Nickel metal hydride
NMOG Non-methane organic gases
NOx Oxides of nitrogen
NPTS Nationwide Personal Transportation Survey
NREL National Renewable Energy Laboratory
OEM Original Equipment Manufacturer
OVC Off-vehicle charging
PCT Partial charge test. Simulates charge sustaining mode during ADVISOR modeling
8-3

Glossary
PNGV Partnership for a New Generation of Vehicles
PWM Pulse width modulation
PZEV Partial ZEV
ROG Reactive organic gases
RPE Retail price equivalent
SAE Society of Automotive Engineers
SC03 A driving cycle that captures air conditioning load effects and is part of the supplemental federal test procedure
SCAQMD South Coast Air Quality Management District
SFTP Supplemental Federal Test Procedure. A combination of FUDS, HWFET, US06, and SC03 driving cycles.
SOC State of charge
SULEV Super ultra low emission vehicle
SUV Sports Utility Vehicle
UF Utility Factor
ULEV Ultra Low Emission Vehicle
US06 A driving cycle that captures high speed and aggressive driving and is part of the supplemental federal test procedure
V Volt(s)
W Watt(s)
WG Hybrid Electric Vehicle Working Group
Wh Watt-hour(s)
ZEV Zero Emission Vehicle
8-4

A SUMMARY AND CONCLUSIONS
The following tables support the tables and charts in Section 2. Table A-1 represents the base case modeling runs using ADVISOR and supports Tables 2-1, 2-2, and Figure 2-1. Table A-2 represents fuel-cycle calculations of emissions and energy use and supports Figures 2-2, 2-3 and 2-4. Table A-3 shows the average of the ANL and Base Method fully loaded component costs and supports Figure 2-5. See Table C-2 for the unloaded component costs. Table A-4 shows the Base and ANL method RPEs and supports Figure 2-6. See Tables C-4 and C-5 for build up of vehicle RPE using the two methods. Table A-5 represents battery module costs versus battery power to energy ratio and supports Figure 2-7. Table A-6 shows calculations of fuel costs and supports Figure 2-8. Finally, market preference versus various vehicle price scenarios is given in Table A-7 and support Figure 2-9.
A-1
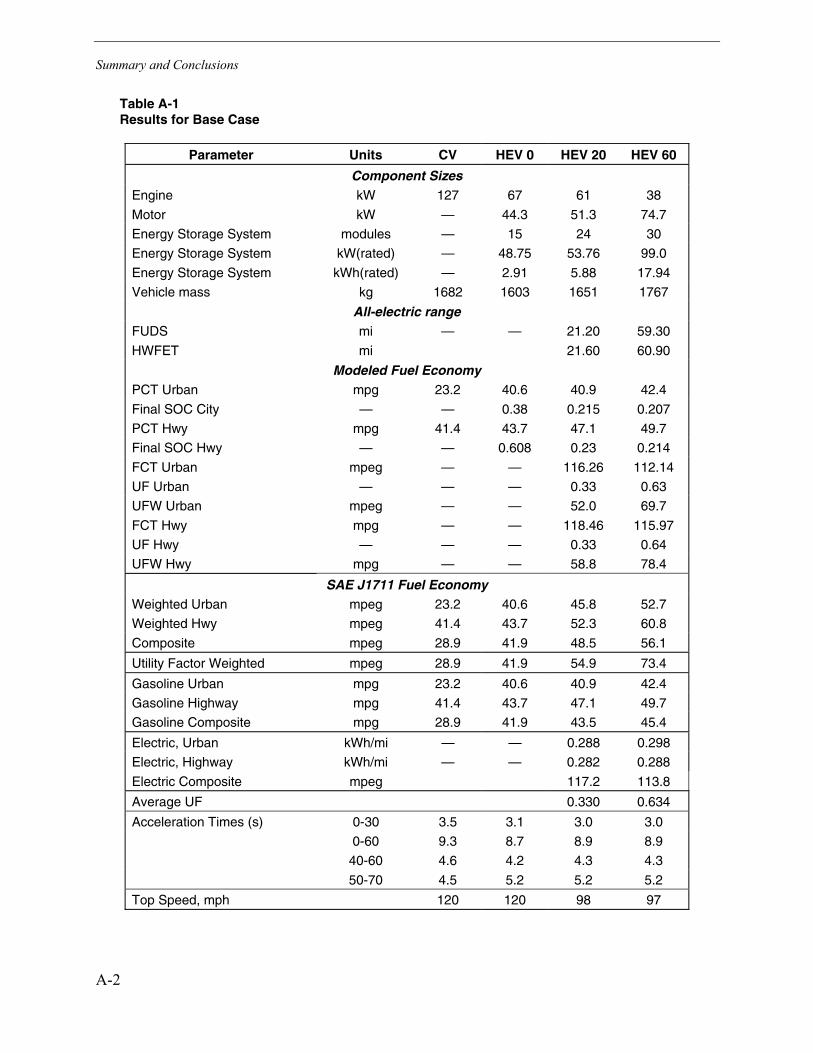
Summary and Conclusions
Table A-1 Results for Base Case
Parameter Units CV HEV 0 HEV 20 HEV 60
Component Sizes Engine kW 127 67 61 38
Motor kW — 44.3 51.3 74.7
Energy Storage System modules — 15 24 30
Energy Storage System kW(rated) — 48.75 53.76 99.0
Energy Storage System kWh(rated) — 2.91 5.88 17.94
Vehicle mass kg 1682 1603 1651 1767
All-electric range FUDS mi — — 21.20 59.30
HWFET mi 21.60 60.90
Modeled Fuel Economy PCT Urban mpg 23.2 40.6 40.9 42.4
Final SOC City — — 0.38 0.215 0.207
PCT Hwy mpg 41.4 43.7 47.1 49.7
Final SOC Hwy — — 0.608 0.23 0.214
FCT Urban mpeg — — 116.26 112.14
UF Urban — — — 0.33 0.63
UFW Urban mpeg — — 52.0 69.7
FCT Hwy mpg — — 118.46 115.97
UF Hwy — — — 0.33 0.64
UFW Hwy mpg — — 58.8 78.4
SAE J1711 Fuel Economy Weighted Urban mpeg 23.2 40.6 45.8 52.7
Weighted Hwy mpeg 41.4 43.7 52.3 60.8
Composite mpeg 28.9 41.9 48.5 56.1
Utility Factor Weighted mpeg 28.9 41.9 54.9 73.4
Gasoline Urban mpg 23.2 40.6 40.9 42.4
Gasoline Highway mpg 41.4 43.7 47.1 49.7
Gasoline Composite mpg 28.9 41.9 43.5 45.4
Electric, Urban kWh/mi — — 0.288 0.298
Electric, Highway kWh/mi — — 0.282 0.288
Electric Composite mpeg 117.2 113.8
Average UF 0.330 0.634
Acceleration Times (s) 0-30 3.5 3.1 3.0 3.0
0-60 9.3 8.7 8.9 8.9
40-60 4.6 4.2 4.3 4.3
50-70 4.5 5.2 5.2 5.2
Top Speed, mph 120 120 98 97
A-2

Summary and Conclusions
Table A-2 Fuel-Cycle Energy and Emission Results for Base Case for the Average Driving Schedule and Charging Nightly
Parameter CV HEV 0 HEV 20 HEV 60
Annual City Electric Miles 2,585 4,959
Annual Hwy Electric Miles 2,691 5,161
Annual City Gasoline Miles 6,528 6,528 3,943 1,569
Annual Hwy Gasoline Miles 6,794 6,794 4,103 1,633
Adjusteda City Electric FE, kWh/mi — — 0.320 0.331
Adjusted Hwy Electric FE, kWh/mi — — 0.362 0.370
Adjusted City Gasoline FE, mpg 20.88 36.54 36.81 38.16
Adjusted Hwy Gasoline FE, mpg 32.29 34.09 36.74 38.77
Annual Gallons of Gasoline Used 523 378 219 83
Annual kWh of Electricity Used — — 1,800 3,551
Annual Fuel-cycle CO2, kg 1,072 775 1,217 1,687
Annual Vehicle CO2, kg 4,446 3,213 1,860 708
Annual Total CO2, kg 5,518 3,988 3,077 2,394
Annual Fuel-cycle HC, grams 663 479 308 168
Annual Tailpipe HC, grams 97 97 59 23
Annual Evaporative HC, grams 187 187 187 187
Annual Total HC, grams 947 763 554 377
Annual Fuel-cycle NOx, grams 78 56 125 195
Annual Tailpipe NOx, grams 333 333 201 80
Annual Total NOx, grams 411 389 326 275
Annual Total Smogb, grams 1,358 1,152 880 652
% CO2 Reduction from CV 0% 28% 44% 57%
% Smog Reduction from CV 0% 15% 35% 52%
CO2 Fuel-cycle g/mi 80 58 91 127
CO2 Vehicle g/mi 334 241 140 53
HC g/mi 0.071 0.057 0.042 0.028
NOx g/mi 0.031 0.029 0.024 0.021
Fuel-cycle Petroleum Energy, kWh/mi 1.653 1.195 0.692 0.263
Fuel-cycle Nat Gas Energy, kWh/mi 0.063 0.046 0.351 0.650 a Adjusted fuel economies use EPA labeling discounts. See Section 4.2.2.3. b Smog is smog precursors (HC plus NOx)
A-3

Summary and Conclusions
Table A-3 Component Retail Price Equivalent Average for Base and ANL Methods
Component CV HEV 0 HEV 20 HEV 60
Glider $11,996 $11,996 $11,996 $11,996
Engine + Exhaust $4,434 $2,745 $2,608 $1,987
Transmission $1,978 $1,212 $1,212 $1,212
Accessory Power $393 $539 $539 $539
Electric Traction $75 $2,369 $2,616 $3,443
Energy Storage System $56 $3,347 $4,239 $7,751
On Vehicle Charging System — — $758 $758
Total Average Vehicle RPE $18,933 $22,208 $23,968 $27,686
Table A-4 Vehicle RPEs and Battery Replacement Costsa for Base and ANL Methods
Base Method ANL Method
Vehicle Type Vehicle RPE
Battery Replacement Cost Vehicle RPE
Battery Replacement Cost
CV $18,984 — $18,890 —
HEV 0 $23,042 $2,103 $21,373 $1,606
HEV 20 $24,966 $3,117 $22,971 $2,193
HEV 60 $29,253 $7,317 $26,519 $4,634 a Cost of battery replacement less salvage value. Battery replacements may be needed in high mileage cases, depending upon the vehicle’s control strategy and charging frequency. For more details see Sections 2.6.2.3 and 4.2.2.7.1.
Table A-5 NiMH Battery Module Costs to OEM
Battery Parameter Unit HEV 0 HEV 20 HEV 60
Power (rated) kW 48.75 53.76 99
Energy (rated) kWh 2.91 5.88 17.94
Power/Energy W/Wh 16.8 9.1 5.5
Specific Cost $/kWh $400 $320 $270
A-4

Summary and Conclusions
Table A-6 Fuel Costs per Mile for Base Case for the Average Driving Schedule and Charging Nightly
Parameter CV HEV 0 HEV 20 HEV 60
Annual City Electric Miles 2,585 4,959
Annual Hwy Electric Miles 2,691 5,161
Annual City Gasoline Miles 6,528 6,528 3,943 1,569
6,794 6,794 4,103 1,633
Adjusted City Electric FE, kWh/mi a — — 0.331
Adjusted Hwy Electric FE, kWh/mi — 0.362 0.370
Adjusted City Gasoline FE, mpg 36.54 36.81 38.16
32.29 34.09 36.74 38.77
Annual Hwy Gasoline Miles
0.320
— 20.88
Adjusted Hwy Gasoline FE, mpg
Annual Gallons of Gasoline Used 523 378 219 83
— — 1,800 3,551
Gasoline Costs , $/gallon b $1.65 $1.65
Annual kWh of Electricity Used
$1.65 $1.65
Electricity Costsc, $/kWh $0.06 $0.06 $0.06 $0.06
Annual Gasoline Costs $863 $624 $361 $137
Annual Electricity Costs — — $108 $213
Gasoline cost per mile 6.48¢ 4.68¢ 2.71¢ 1.03¢
Electricity cost per mile — — 0.81¢ 1.60¢
Total fuel costs per mile 6.48¢ 4.68¢ 3.52¢ 2.63¢ a Adjusted fuel economies use EPA labeling discounts. See Section 4.2.2.3. b Estimated national average gasoline price at time of report. c 5 city average off-peak electricity prices for charging EVs (Boston, Atlanta, Los Angeles,
Phoenix, San Francisco).
Table A-7 Market Preference Versus Vehicle Price Scenario for All Mid-Size Vehicle Segment of Customer Surveya
Low Price ANL Price Base Price High Price
Vehicle Type
Vehicle Price
Market Preference
Vehicle Price
Market Preference
Vehicle Price
Market Preference
Vehicle Price
Market Preference
HEV 0 $21,013 48.1% $21,373 45.9% $23,042 35.4% $25,071 22.8%
HEV 20 $21,975 52.9% $22,971 46.7% $24,966 34.5% $27,957 16.1%
HEV 60 $24,019 51.5% $26,319 32.6% $29,053 16.9% $34,088 7.1%
a Comparisons of one HEV versus CV. CV base price $18,984. Low price scenario is 50% of the incremental cost between Base Price HEV and Base Price CV. High Price case is 150% of the incremental cost between Base Price HEV and Base Price CV.
A-5


B HEV PERFORMANCE, EFFICIENCY, AND EMISSIONS
The following tables and information support the tables and charts in Section 3.
B.1 ADVISOR Modeling Results
Table B-1 shows a summary of ADVISOR modeling results for the base case. These data support Table 3-8, Figure 3-6, Figure 3-7, Figure 3-8, Figure 3-9, Table 3-10, Table 3-11, Figure 3-10 and Table 3-12. Table B-2 shows a summary of ADVISOR modeling results for the low-drag, reduced mass vehicles. These data support Table 3-13 and Table 3-14.
B.2 Mileage Weighted Probabilities Versus Utility Factor
Figure B-1 shows a comparison of mileage-weighted probability (MWP) and utility factor (UF) derived from the 1995 Nationwide Personal Transportation Survey. Both are plotted against all-electric range. As can be seen from Figure B-1, the utility factor produces lower all-electric operation factors than does the mileage-weighted probability. For more discussion on this subject, see Section 3.3.1.3.
MWP weighted and J1711 MWP weighted fuel economies for the base case are shown in Table B-3. MWP weighted and J1711 MWP weighted fuel economies for the low-drag, reduced mass case are shown in Table B-4.
B-1
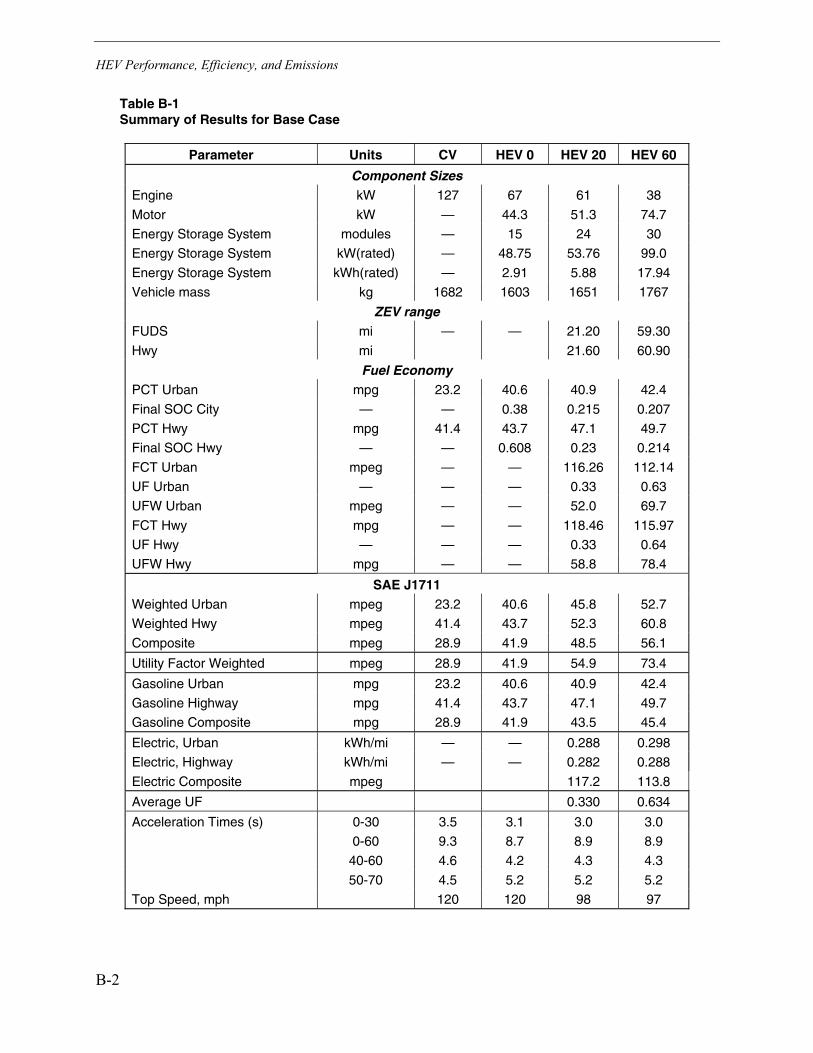
HEV Performance, Efficiency, and Emissions
Table B-1 Summary of Results for Base Case
Parameter Units CV HEV 0 HEV 20 HEV 60
Component Sizes Engine kW 127 67 61 38
Motor kW — 44.3 51.3 74.7
Energy Storage System modules — 15 24 30
Energy Storage System kW(rated) — 48.75 53.76 99.0
Energy Storage System kWh(rated) — 2.91 5.88 17.94
Vehicle mass kg 1682 1603 1651 1767
ZEV range FUDS mi — — 21.20 59.30
Hwy mi 21.60 60.90
Fuel Economy PCT Urban mpg 23.2 40.6 40.9 42.4
Final SOC City — — 0.38 0.215 0.207
PCT Hwy mpg 41.4 43.7 47.1 49.7
Final SOC Hwy — — 0.608 0.23 0.214
FCT Urban mpeg — — 116.26 112.14
UF Urban — — — 0.33 0.63
UFW Urban mpeg — — 52.0 69.7
FCT Hwy mpg — — 118.46 115.97
UF Hwy — — — 0.33 0.64
UFW Hwy mpg — — 58.8 78.4
SAE J1711 Weighted Urban mpeg 23.2 40.6 45.8 52.7
Weighted Hwy mpeg 41.4 43.7 52.3 60.8
Composite mpeg 28.9 41.9 48.5 56.1
Utility Factor Weighted mpeg 28.9 41.9 54.9 73.4
Gasoline Urban mpg 23.2 40.6 40.9 42.4
Gasoline Highway mpg 41.4 43.7 47.1 49.7
Gasoline Composite mpg 28.9 41.9 43.5 45.4
Electric, Urban kWh/mi — — 0.288 0.298
Electric, Highway kWh/mi — — 0.282 0.288
Electric Composite mpeg 117.2 113.8
Average UF 0.330 0.634
Acceleration Times (s) 0-30 3.5 3.1 3.0 3.0
0-60 9.3 8.7 8.9 8.9
40-60 4.6 4.2 4.3 4.3
50-70 4.5 5.2 5.2 5.2
Top Speed, mph 120 120 98 97
B-2

HEV Performance, Efficiency, and Emissions
Table B-2 Summary of Results for Low-Drag, Reduced Mass Case
Parameter Units CV HEV 0 HEV 60
Component Sizes
Engine kW 98 55 34
Motor kW — 39.7 65.3
Energy Storage System Modules — 13 25
Energy Storage System kW(rated) — 39 82.5
Energy Storage System kWh(rated) — 2.21 14.95
Vehicle mass kg 1408 1392 1531
ZEV Range
FUDS mi — — 60.50
Hwy mi 66.90
Fuel Economy
PCT Urban mpg 27.7 58 56.3
Final SOC City — — 0.51 0.207
PCT Hwy mpg 50.5 69.7 67.3
FCT Urban mpeg — — 135.98
UF Urban — — — 0.63
UFW Urban mpeg — — 89.2
FCT Hwy mpg — — 150.36
UF Hwy — — — 0.66
UFW Hwy mpg — — 105.9
SAE J1711
Weighted Urban mpeg 27.7 58.0 69.0
Weighted Hwy mpeg 50.5 69.7 82.3
Composite mpeg 34.8 62.7 74.4
Utility Factor Weighted mpeg 34.8 62.7 96.0
Gasoline Urban mpg 27.7 58.0 56.3
Gasoline Highway mpg 50.5 69.7 67.3
Gasoline Composite mpg 34.8 62.7 60.8
Electric Only, Urban kWh/mi — — 0.246
Electric Only, Highway kWh/mi — — 0.222
Electric Composite mpeg 142.1
Average UF 0.643
Acceleration Times (s) 0-30 3.2 3.1 3.05
0-60 9.3 8.9 8.79
40-60 4.2 4.2 4.18
50-70 5.3 5.2 5.09
Top Speed, mph 120 111 99
B-3

HEV Performance, Efficiency, and Emissions
Figure B-1 Mileage Weighted Probability and Utility Factor Versus all Electric Range (derived from 1995 NPTS)
Table B-3 Mileage Weighted Probability Fuel Economies for the Base Case
Parameter Units HEV 20 HEV 60
FCT Urban mpeg 116.26 112.14
MWP — 0.39 0.74
MWP Urban mpeg 54.7 78.5
FCT Hwy mpg 118.46 115.97
MWP — 0.39 0.74
MWP Hwy mpg 61.6 86.1
SAE J1711 MWP
Weighted Urban mpeg 46.8 55.1
Weighted Hwy mpeg 53.4 63.0
Composite mpeg 49.6 58.4
MWP Weighted mpeg 57.6 81.8
B-4

HEV Performance, Efficiency, and Emissions
Table B-4 Mileage Weighted Probability Fuel Economies for the Low-Drag, Reduced Mass Case
Parameter Units HEV 60
FCT Urban mpeg 136.0
MWP — 0.74
MWP Urban mpeg 99.4
FCT Hwy mpg 150.4
MWP — 0.74
MWP Hwy mpg 113.8
SAE J1711 MWP
Weighted Urban mpeg 71.9
mpeg 84.6
Composite mpeg 77.1
MWP Weighted mpeg 105.4
Weighted Hwy
B.3 Fuel Economy Formulas
The following formulas describe the calculations of the 6 fuel economies described in Section 3.3.1.5.
Gasoline Only
HU PCTPCT
onlyGasoline45.055.0
1
�
�
Where PCTU is the urban fuel economy for the partial charge test in mpg and PCTH is the highway fuel economy for the partial charge test in mpg.
Electric Only
HU FCTFCTonlyElectric *45.0*55.0 ��
Where FCTU is the urban fuel economy for the full charge test in kWh/mi and FCTH is the highway fuel economy for the full charge test in kWh/mi. This can be converted to miles per equivalent gasoline gallon (mpeg) by dividing the electric-only fuel economy in kWh/mi into the conversion factor of 33.44 kWh/equivalent gasoline gallon.
B-5

HEV Performance, Efficiency, and Emissions
UF Weighted
U
UUU
PCTUFFCTUF
UrbanUF�
�
�
144.33
*1
Where FCTU is the urban fuel economy for the full charge test in kWh/mi and PCTU is the urban fuel economy for the partial charge test in mpg, UFU is the urban utility factor and 33.44 is the conversion factor for converting kWh into equivalent gasoline gallons. The UF Urban is in mpeg.
H
HHH
PCTUFFCTUF
HwyUF�
�
�
144.33
*1
Where FCTH is the highway fuel economy for the full charge test in kWh/mi and PCTH is the urban fuel economy for the partial charge test in mpg, UFH is the highway utility factor and 33.44 is the conversion factor for converting kWh into equivalent gasoline gallons. The UF Hwy is in mpeg.
HwyUFUrbanUF
WeightedUF45.055.0
1
�
�
The resultant UF Weighted fuel economy is in mpeg.
J1711 UF Weighted
UPCTUrbanUF
UrbanUFJ11
21711�
�
J1711 UF Urban is in mpeg.
HPCTHwyUF
HwyUFJ11
21711�
�
J1711 UF Hwy is in mpeg.
B-6

HEV Performance, Efficiency, and Emissions
HwyUFJUrbanUFJ
WeightedUFJ
171145.0
171155.0
11711�
�
J1711 UF Weighted fuel economy is in mpeg.
MWP Weighted
U
UUU
PCTMWPFCTMWP
UrbanMWP�
�
�
144.33*
1
Where FCTU is the urban fuel economy for the full charge test in kWh/mi and PCTU is the urban fuel economy for the partial charge test in mpg, MWPU is the urban mileage weighted probability factor and 33.44 is the conversion factor for converting kWh into equivalent gasoline gallons. The MWP Urban is in mpeg.
H
HHH
PCTMWPFCTMWP
HwyMWP�
�
�
144.33*
1
Where FCTH is the highway fuel economy for the full charge test in kWh/mi and PCTH is the urban fuel economy for the partial charge test in mpg, MWPH is the highway mileage weighted probability factor and 33.44 is the conversion factor for converting kWh into equivalent gasoline gallons. The MWP Hwy is in mpeg.
HwyMWPUrbanMWP
WeightedMWP45.055.0
1
�
�
The resultant MWP Weighted fuel economy is in mpeg.
J1711 MWP Weighted
UPCTUrbanMWP
UrbanMWPJ 1121711
�
�
J1711 MWP Urban is in mpeg.
B-7

HEV Performance, Efficiency, and Emissions
HPCTHwyMWP
HwyMWPJ11
21711�
�
J1711 MWP Hwy is in mpeg.
HwyMWPJUrbanMWPJ
WeightedMWPJ
171145.0
171155.0
11711�
�
J1711 MWP Weighted fuel economy is in mpeg.
B.4 Emissions
Table B-5 provides fuel-cycle, tailpipe, and evaporative emissions for the base case vehicles operating on the average driving schedule and charging nightly. These data support Table 3-10 and Figures 3-11 and 3-12. Table B-6 provides fuel-cycle, tailpipe, and evaporative emissions for the base case vehicles operating on the average driving schedule and never charging. These data also support Table 3-10. Table B-7 provides fuel-cycle, tailpipe, and evaporative emissions for the base case vehicles operating on the low commute driving schedule and charging nightly. Table B-8 provides fuel-cycle, tailpipe, and evaporative emissions for the base case vehicles operating on the mid commute driving schedule and charging nightly. Table B-9 provides fuel-cycle, tailpipe, and evaporative emissions for the base case vehicles operating on the high commute driving schedule and charging nightly. Table B-10 provides fuel-cycle, tailpipe, and evaporative emissions for the low-drag, reduced mass case vehicles operating on the average driving schedule and charging nightly. Driving schedules are defined in Section 4.2.2.2.
B-8

HEV Performance, Efficiency, and Emissions
Table B-5 Fuel-Cycle Emission Results for Base Case for the Average Driving Schedule and Charging Nightly
Parameter CV HEV 0 HEV 20 Limited
HEV 20 Unlimited HEV 60
Annual City Electric Miles 1,921 2,585 4,959
Annual Hwy Electric Miles 1,999 2,691 5,161
Annual City Gasoline Miles 6,528 6,528 4,607 3,943 1,569
Annual Hwy Gasoline Miles 6,794 6,794 4,795 4,103 1,633
Adjusteda City Electric FE, kWh/mi — — 0.320 0.320 0.331
Adjusted Hwy Electric FE, kWh/mi — — 0.362 0.362 0.370
Adjusted City Gasoline FE, mpg 20.88 36.54 36.81 36.81 38.16
Adjusted Hwy Gasoline FE, mpg 32.29 34.09 36.74 36.74 38.77
Annual Gallons of Gasoline Used 523 378 256 219 83
Annual kWh of Electricity Used — — 1,337 1,800 3,551
Annual Fuel-cycle CO2, kg 1,072 775 1,095 1,217 1,687
Annual Vehicle CO2, kg 4,446 3,213 2,173 1,860 708
Annual Total CO2, kg 5,518 3,988 3,268 3,077 2,394
Annual Fuel-cycle HC, grams 663 479 347 309 168
Annual Tailpipe HC, grams 97 97 69 59 23
Annual Evaporative HC, grams 187 187 187 187 187
Annual Total HC, grams 947 763 603 554 377
Annual Fuel-cycle NOx, grams 78 56 107 125 195
Annual Tailpipe NOx, grams 333 333 235 201 80
Annual Total NOx, grams 411 389 342 326 275
Annual Total Smogb, grams 1,358 1,152 944 880 652
% CO2 Reduction from CV 0% 28% 41% 44% 57%
% Smog Reduction from CV 0% 15% 30% 35% 52%
CO2 Fuel-cycle g/mi 80 58 82 91 127
CO2 Vehicle g/mi 334 241 163 140 53
HC g/mi 0.071 0.057 0.045 0.042 0.028
NOx g/mi 0.031 0.029 0.026 0.024 0.021 a Adjusted fuel economies use EPA labeling discounts. See Section 4.2.2.3. b Smog is smog precursors (HC plus NOx).
B-9
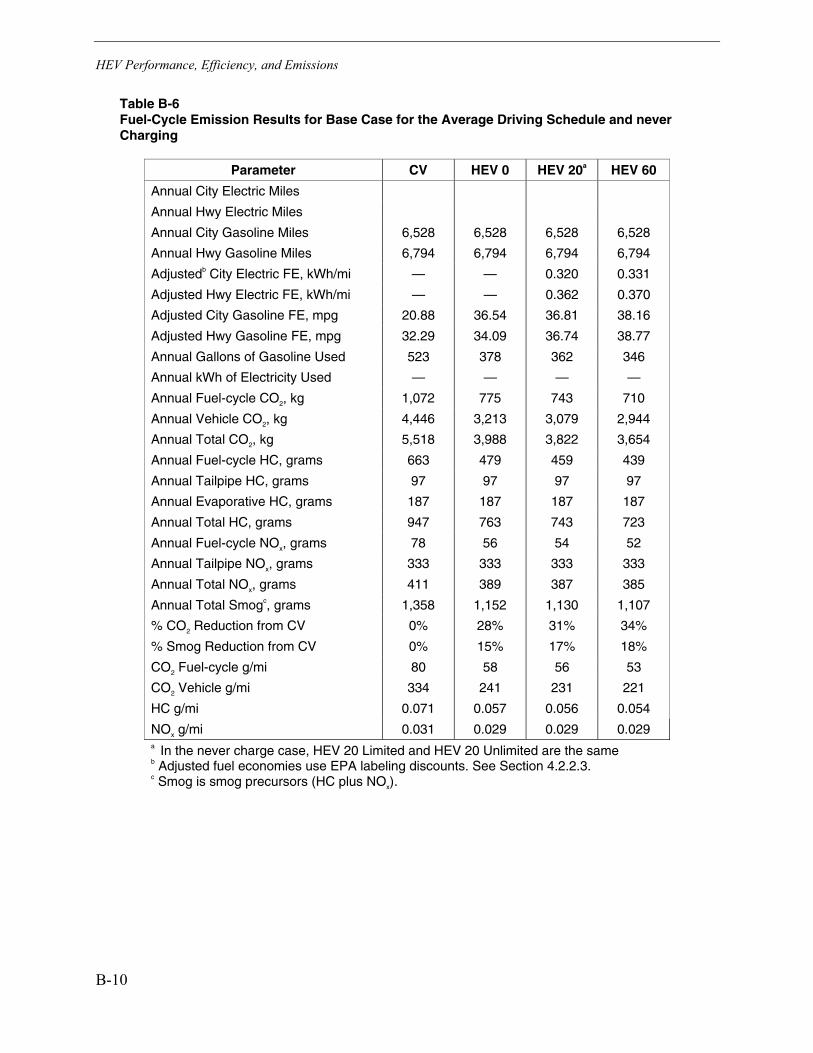
HEV Performance, Efficiency, and Emissions
Table B-6 Fuel-Cycle Emission Results for Base Case for the Average Driving Schedule and never Charging
Parameter CV HEV 0 HEV 20a HEV 60
Annual City Electric Miles
Annual Hwy Electric Miles
Annual City Gasoline Miles 6,528 6,528 6,528 6,528
Annual Hwy Gasoline Miles 6,794 6,794 6,794 6,794
Adjustedb City Electric FE, kWh/mi — — 0.320 0.331
Adjusted Hwy Electric FE, kWh/mi — — 0.362 0.370
Adjusted City Gasoline FE, mpg 20.88 36.54 36.81 38.16
Adjusted Hwy Gasoline FE, mpg 32.29 34.09 36.74 38.77
Annual Gallons of Gasoline Used 523 378 362 346
Annual kWh of Electricity Used — — — —
Annual Fuel-cycle CO2, kg 1,072 775 743 710
Annual Vehicle CO2, kg 4,446 3,213 3,079 2,944
Annual Total CO2, kg 5,518 3,988 3,822 3,654
Annual Fuel-cycle HC, grams 663 479 459 439
Annual Tailpipe HC, grams 97 97 97 97
Annual Evaporative HC, grams 187 187 187 187
Annual Total HC, grams 947 763 743 723
Annual Fuel-cycle NOx, grams 78 56 54 52
Annual Tailpipe NOx, grams 333 333 333 333
Annual Total NOx, grams 411 389 387 385
Annual Total Smogc, grams 1,358 1,152 1,130 1,107
% CO2 Reduction from CV 0% 28% 31% 34%
% Smog Reduction from CV 0% 15% 17% 18%
CO2 Fuel-cycle g/mi 80 58 56 53
CO2 Vehicle g/mi 334 241 231 221
HC g/mi 0.071 0.057 0.056 0.054
NOx g/mi 0.031 0.029 0.029 0.029 a In the never charge case, HEV 20 Limited and HEV 20 Unlimited are the same b Adjusted fuel economies use EPA labeling discounts. See Section 4.2.2.3. c Smog is smog precursors (HC plus NOx).
B-10

HEV Performance, Efficiency, and Emissions
Table B-7 Fuel-Cycle Emission Results for Base Case for the Low Commute Driving Schedule and Charging Nightly
Parameter CV HEV 0 HEV 20 Limited
HEV 20 Unlimited HEV 60
Annual City Electric Miles 1,389 2,330 2,768
Annual Hwy Electric Miles 1,547 2,595 3,085
Annual City Gasoline Miles 3,648 3,648 2,259 1,318 879
Annual Hwy Gasoline Miles 4,064 4,064 2,517 1,469 980
Adjusteda City Electric FE, kWh/mi — — 0.320 0.320 0.331
Adjusted Hwy Electric FE, kWh/mi — — 0.362 0.362 0.370
Adjusted City Gasoline FE, mpg 20.88 36.54 36.81 36.81 38.16
Adjusted Hwy Gasoline FE, mpg 32.29 34.09 36.74 36.74 38.77
Annual Gallons of Gasoline Used 301 219 130 76 48
Annual kWh of Electricity Used — — 1,003.90 1,683.81 2,057.59
Annual Fuel-cycle CO2, kg 616 449 695 874 978
Annual Vehicle CO2, kg 2,555 1,862 1,104 644 411
Annual Total CO2, kg 3,171 2,311 1,799 1,519 1,388
Annual Fuel-cycle HC, grams 381 125 278 182 97
Annual Tailpipe HC, grams 56 56 35 20 14
Annual Evaporative HC, grams 108 108 108 108 108
Annual Total HC, grams 545 442 325 254 219
Annual Fuel-cycle NOx, grams 45 33 71 98 113
Annual Tailpipe NOx, grams 193 193 119 70 46
Annual Total NOx, grams 238 225 190 167 159
Annual Total Smogb, grams 783 667 515 421 378
% CO2 Reduction from CV 0% 27% 43% 52% 56%
% Smog Reduction from CV 0% 15% 34% 46% 52%
CO2 Fuel-cycle g/mi 80 58 90 113 127
CO2 Vehicle g/mi 331 241 143 84 53
HC g/mi 0.071 0.057 0.042 0.033 0.028
NOx g/mi 0.031 0.029 0.025 0.022 0.021 a Adjusted fuel economies use EPA labeling discounts. See Section 4.2.2.3. b Smog is smog precursors (HC plus NOx).
B-11

HEV Performance, Efficiency, and Emissions
Table B-8 Fuel-Cycle Emission Results for Base Case for the Mid Commute Driving Schedule and Charging Nightly
Parameter CV HEV 0 HEV 20 Limited
HEV 20 Unlimited HEV 60
Annual City Electric Miles 1,867 2,867 5,309
Annual Hwy Electric Miles 1,662 2,552 4,727
Annual City Gasoline Miles 6,315 6,315 4,448 3,448 1,006
Annual Hwy Gasoline Miles 5,622 895 5,622 3,960 3,070
Adjusteda City Electric FE, kWh/mi — — 0.320 0.320 0.331
Adjusted Hwy Electric FE, kWh/mi — — 0.362 0.362 0.370
Adjusted City Gasoline FE, mpg 20.88 36.54 36.81 36.81 38.16
Adjusted Hwy Gasoline FE, mpg 32.29 34.09 36.74 36.74 38.77
Annual Gallons of Gasoline Used 477 338 229 177 49
Annual kWh of Electricity Used — — 1,198 1,840 3,507
Annual Fuel-cycle CO2, kg 977 692 980 1,149 1,599
2 4,051 2,871 1,943 1,506 420
Annual Total CO2, kg 5,027 3,563 2,924 2,655 2,019
Annual Fuel-cycle HC, grams 604 428 311 257 124
Annual Tailpipe HC, grams 87 87 61 48 14
Annual Evaporative HC, grams 167 167 167 167 167
Annual Total HC, grams 858 682 539 471 305
Annual Fuel-cycle NOx, grams 71 50 96 121 188
Annual Tailpipe NOx, grams 298 298 210 163 48
Annual Total NOx, grams 369 349 306 284 235
Annual Total Smogb, grams 1,357 1,123 907 804 553
% CO2 Reduction from CV 0% 29% 42% 47% 60%
% Smog Reduction from CV 0% 17% 33% 41% 59%
CO2 Fuel-cycle g/mi 82 58 82 96 134
CO2 Vehicle g/mi 339 241 163 126 35
HC g/mi 0.072 0.057 0.045 0.039 0.026
NOx g/mi 0.031 0.029 0.026 0.024 0.020 a Adjusted fuel economies use EPA labeling discounts. See Section 4.2.2.3. b Smog is smog precursors (HC plus NOx).
Annual Vehicle CO , kg
B-12

HEV Performance, Efficiency, and Emissions
Table B-9 Fuel-Cycle Emission Results for Base Case for the High Commute Driving Schedule and Charging Nightly
Parameter CV HEV 0 HEV 20 Limited
HEV 20 Unlimited HEV 60
Annual City Electric Miles 2,491 2,544 6,094
Annual Hwy Electric Miles 2,786 2,845 6,818
Annual City Gasoline Miles 8,484 8,484 5,993 5,941 2,390
Annual Hwy Gasoline Miles 9,491 9,491 6,704 6,645 2,673
Adjusteda City Electric FE, kWh/mi — — 0.320 0.320 0.331
Adjusted Hwy Electric FE, kWh/mi — — 0.362 0.362 0.370
Adjusted City Gasoline FE, mpg 20.88 36.54 36.81 36.81 38.16
Adjusted Hwy Gasoline FE, mpg 32.29 34.09 36.74 36.74 38.77
Annual Gallons of Gasoline Used 700 511 345 342 132
Annual kWh of Electricity Used — — 1,805 1,843 4,540
Annual Fuel-cycle CO2, kg 1,435 1,047 1,478 1,488 2,208
Annual Vehicle CO2, kg 5,952 4,340 2,935 2,909 1,118
Annual Total CO2, kg 7,388 5,387 4,414 4,398 3,327
Annual Fuel-cycle HC, grams 887 647 469 466 246
Annual Tailpipe HC, grams 131 131 93 92 37
Annual Evaporative HC, grams 252 252 252 252 252
Annual Total HC, grams 1,270 1,030 813 810 535
Annual Fuel-cycle NOx, grams 104 76 144 146 253
Annual Tailpipe NOx, grams 449 449 317 315 127
Annual Total NOx, grams 554 525 462 460 379
Annual Total Smogb, grams 2,015 1,695 1,369 1,363 950
% CO2 Reduction from CV 0% 27% 40% 40% 55%
% Smog Reduction from CV 0% 15% 30% 30% 50%
CO2 Fuel-cycle g/mi 80 58 82 83 123
CO2 Vehicle g/mi 331 241 163 162 62
HC g/mi 0.071 0.057 0.045 0.045 0.030
NOx g/mi 0.031 0.029 0.026 0.026 0.021 a Adjusted fuel economies use EPA labeling discounts. See Section 4.2.2.3. b Smog is smog precursors (HC plus NOx).
B-13

HEV Performance, Efficiency, and Emissions
Table B-10 Fuel-Cycle Emission Results for Low-Drag, Reduced Mass Case for the Average Driving Schedule and Charging Nightly
Parameter CV HEV 0 HEV 60
Annual City Electric Miles 4,959
Annual Hwy Electric Miles 5,161
Annual City Gasoline Miles 6,528 6,528 1,569
Annual Hwy Gasoline Miles 6,794 6,794 1,633
Adjusteda City Electric FE, kWh/mi — — 0.229
Adjusted Hwy Electric FE, kWh/mi — — 0.234
Adjusted City Gasoline FE, mpg 24.93 52.20 50.67
Adjusted Hwy Gasoline FE, mpg 39.39 54.37 52.49
Annual Gallons of Gasoline Used 434 250 62
Annual kWh of Electricity Used — — 2,341
Annual Fuel-cycle CO2, kg 890 513 1,127
Annual Vehicle CO2, kg 3,692 2,125 528
Annual Total CO2, kg 4,582 2,638 1,655
Annual Fuel-cycle HC, grams 550 317 120
Annual Tailpipe HC, grams 97 97 23
Annual Evaporative HC, grams 187 187 187
Annual Total HC, grams 834 601 329
Annual Fuel-cycle NOx, grams 65 37 130
Annual Tailpipe NOx, grams 333 333 80
Annual Total NOx, grams 398 370 210
Annual Total Smogb, grams 1,232 971 539
% CO2 Reduction from CV 0% 42% 64%
% Smog Reduction from CV 0% 21% 56%
CO2 Fuel-cycle g/mi 67 38 85
CO2 Vehicle g/mi 277 160 40
HC g/mi 0.072 0.045 0.025
NOx g/mi 0.030 0.028 0.016 a Adjusted fuel economies use EPA labeling discounts. See Section 4.2.2.3. b Smog is smog precursors (HC plus NOx).
B-14

C HEV COSTS
Detailed information on vehicle component cost formulas, vehicle component costs, vehicle RPE, and maintenance costs are provided in this appendix. The data and information contained in this appendix support the tables and charts in Section 4.
C.1 Formulas for Computing Vehicle Component Costs
Table C-1 lists the formulas used in computing vehicle component costs. More details on component costs can be found in Section 4.2.1.2.
Table C-1 Component Cost Formulas
Component Formula
V-6 Engine $10.90 x engine peak kW + $693.00
L-4 Engine $12.00 x engine peak kW + $424.00
Engine Thermal $0.236 x engine peak power
Traction Motor $13.70 x motor peak kW + $190.00
Power Electronics $7.075 x motor peak kW + $165.00
PE Thermal $1.00 x motor peak kW + $70.00
HEV 0 Battery $400 x kWh battery
HEV 20 Battery $320 x kWh battery
HEV 60 Battery $270 x kWh battery
Pack Hardware $5.00 x kWh battery + $460.00
Pack Tray $5.00 x kWh battery + $130.00
$3.00 x kWh battery + $90.00 Pack Thermal
C.2 Component Cost Summary for Mid-Size Vehicles
A summary of component costs for the base case mid-size vehicle is shown in Table C-2. A summary of component costs for the low-drag, low mass vehicle is shown in Table C-3.
C-1

HEV Costs
Table C-2 Component Costs for the Base Case Vehicles
Vehicle Type CV HEV 0 HEV 20 HEV 60
Engine $2,077 $1,228 $1,156 $880
Engine Thermal $30 $16 $14 $9
Engine Total $2,107 $1,244 $1,170 $889
Exhaust System $250 $200 $200 $150
Transmission $1,045 $625 $625 $625
Power Steering Pump $50 $50 $50 $50
Generator/Alternator $40
A/C Compressor $100 $100 $100 $100
A/C Condenser $20 $20 $20 $20
APM $130 $130 $130
Accessory Power Total $210 $300 $300 $300
Starter Motor $40
Electric Motor $797 $893 $1,213
Power Inverter $478 $528 $694
Electronics Thermal $114 $121 $145
Electric Traction Total $40 $1,390 $1,542 $2,052
Fuel Storage (tank) $10 $10 $10 $10
Accessory Battery $20 $15 $15 $15
Energy Batteries $1,164 $1,882 $4,844
Pack Tray $145 $159 $220
Pack Hardware $475 $489 $550
Battery Thermal $99 $108 $144
Energy Storage Total $30 $1,907 $2,663 $5,782
Charger $380 $380
Cable $80 $80
Infrastructure Upgrade $0 $200
Charging Total $0 $0 $460 $660
Total $3,682 $5,665 $6,960 $10,458
C-2

HEV Costs
Table C-3 Component Costs for Low-Drag, Reduced-Mass Vehicles
Vehicle Type CV HEV 0 HEV 60
Engine $1,761 $1,084 $832
Engine Thermal $30 $13 $8
Engine Total $1,791 $1,097 $840
Exhaust System $250 $200 $150
Transmission $1,045 $625 $625
Power Steering Pump $50 $50 $50
Generator/Alternator $40
A/C Compressor $100 $100 $100
A/C Condenser $20 $20 $20
APM $0 $130 $130
Accessory Power Total $210 $300 $300
Starter Motor $40
Electric Motor $734 $1,085
Power Inverter $446 $627
Electronics Thermal $110 $135
Electric Traction Total $40 $1,289 $1,847
Fuel Storage (tank) $10 $10 $10
Accessory Battery $20 $15 $15
Energy Batteries $884 $4,037
Pack Tray $141 $205
Pack Hardware $471 $535
Battery Thermal $97 $135
Energy Storage Total $30 $1,618 $4,936
Charger $380
Cable $80
Infrastructure Upgrade $200
Charging Total $0 $0 $660
Total $3,366 $5,129 $9,358
C.3 Vehicle RPE Calculations
A summary of the RPE calculation using the Base Method for the base vehicle is given in Table C-4. A summary of the RPE calculation using the ANL Method for the base vehicle is give in Table C-5. A summary of the vehicle RPE calculation using the Base Method for the low drag, reduced mass vehicles is shown in Table C-6. A summary of the vehicle RPE calculation using the ANL Method for the low drag, reduced mass vehicles is shown in Table C-7.
C-3
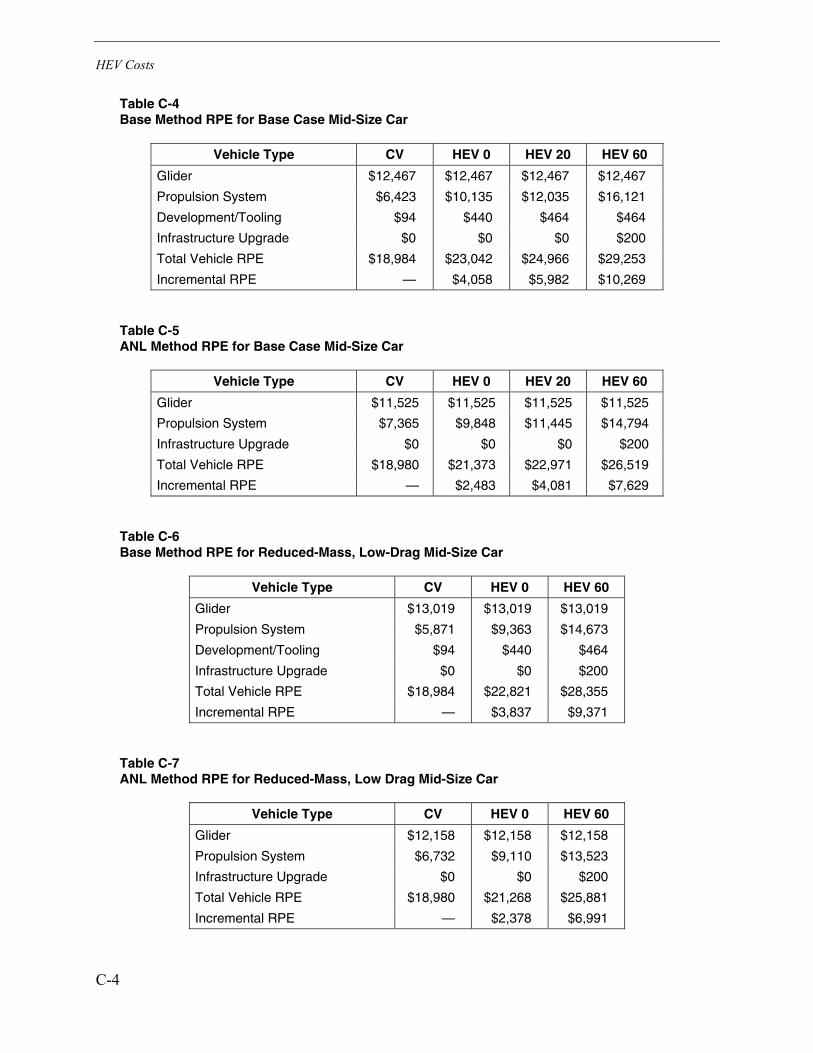
HEV Costs
Table C-4 Base Method RPE for Base Case Mid-Size Car
Vehicle Type CV HEV 0 HEV 20 HEV 60
Glider $12,467 $12,467 $12,467 $12,467
Propulsion System $6,423 $10,135 $12,035 $16,121
Development/Tooling $94 $440 $464 $464
Infrastructure Upgrade $0 $0 $0 $200
Total Vehicle RPE $18,984 $23,042 $24,966 $29,253
Incremental RPE — $4,058 $5,982 $10,269
Table C-5 ANL Method RPE for Base Case Mid-Size Car
Vehicle Type CV HEV 0 HEV 20 HEV 60
Glider $11,525 $11,525 $11,525 $11,525
Propulsion System $7,365 $9,848 $11,445 $14,794
Infrastructure Upgrade $0 $0 $0 $200
Total Vehicle RPE $18,980 $21,373 $22,971 $26,519
Incremental RPE — $2,483 $4,081 $7,629
Table C-6 Base Method RPE for Reduced-Mass, Low-Drag Mid-Size Car
Vehicle Type CV HEV 0 HEV 60
Glider $13,019 $13,019 $13,019
Propulsion System $5,871 $9,363 $14,673
Development/Tooling $94 $440 $464
Infrastructure Upgrade $0 $0 $200
Total Vehicle RPE $18,984 $22,821 $28,355
Incremental RPE — $3,837 $9,371
Table C-7 ANL Method RPE for Reduced-Mass, Low Drag Mid-Size Car
Vehicle Type CV HEV 0 HEV 60
Glider $12,158 $12,158 $12,158
Propulsion System $6,732 $9,110 $13,523
$0
$25,881
Infrastructure Upgrade $0 $200
Total Vehicle RPE $18,980 $21,268
Incremental RPE — $2,378 $6,991
C-4

HEV Costs
C.4 Details on ANL Method
A methodology developed at Argonne National Laboratory (ANL) to model costs associated with hybrid electric vehicles (HEVs) has been used to produce alternative cost estimates. The methodology is a direct extension of the manufacturing and retailing cost analysis for conventional and electric vehicles described in Cuenca et al. [12] and Vyas et al. [23]. ANL has adapted certain aspects of the EV cost analysis for HEV cost modeling. The analysis relies on first identifying those vehicle components that would be common between a conventional vehicle (CV) and a hybrid electric vehicle, and then estimating the CV retail price share of these common components. A separate estimate of the cost of those components unique to the HEV – primarily the power train – is then developed. Through a relationship between vehicle component manufacturing cost and retail price developed by the ANL team, the retail price of the HEV components (mostly the power train) is determined and added to the price of the shared components to yield total vehicle price.
The cost estimation methodology is applicable only to medium- to high-volume (more than 25,000) production of hybrid electric vehicles. The body and chassis components of a hybrid electric vehicle are assumed to be very similar to the conventional vehicle and to be mass-produced (in volumes of 100,000 or more) by an original equipment manufacturer (OEM).
C.4.1 Common Components Retail Price Equivalent
The ANL methodology separates the conventional vehicle into four groups: (1) body, (2) chassis, (3) engine, and (4) transmission. The body group is expected to remain practically the same between a CV and an HEV. The two exceptions are the instrument panel and the heating, ventilating, and air-conditioning (HVAC) system. The HEV will have a slightly different instrument panel that has specific displays for new components and HEV operation. Its HVAC system will have ducts and blowers very similar to those of a CV, but the system will be powered and configured differently. Even though the initial HEVs are expected to have an internal combustion engine (ICE) power plant, the entire engine group is identified as “not common,” because the proposed HEV engine systems more often than not differ from the engine systems used in CVs. Aside from having lower power ratings than their CV counterparts, HEV engines are not likely to have a separate alternator and a starter. They may have one alternator/starter, or they may use a motor/generator for starting the engine. HEV engines may operate within a narrower range of speeds than a CV engine and may use combustion cycles, such as the Atkinson cycle, that a CV engine would not.
The transmission group, too, is identified as “not common.” The parallel HEV’s transmission has to coordinate two power sources, an ICE and an electric motor. Several novel approaches, much different from the present CV transmissions, are being proposed for this configuration. In the
During the early part of the project, the HEV Working Group (WG) decided to keep the vehicle glider common between a CV and the three HEV types being analyzed. The ANL methodology is also based on a similar assumption. The ANL model can analyze grid-independent (power-assist) and grid-connected (dual-mode) hybrids in both parallel and series configurations. Under this project, the WG analyzed both grid-independent and grid-connected parallel hybrids.
C-5

HEV Costs
series configuration, the motor will be connected to a simple gear drive to transmit its power. In either configuration, a separate cost estimate is required. Within the chassis group, a few subgroups would be partially common. The exhaust system, fuel storage, and fluids subgroups are likely to be smaller and perhaps different from the CV’s systems. The steering and brake subgroups may differ in their power source and design. The chassis electric system may use a different power source and voltage, depending upon the OEM’s preference.
With the assumption that the common body and chassis components will be mass-produced and assembled the same way for both CVs and HEVs, the methodology also lends itself to estimating the retail price of the glider. The analysis adds the cost of power train components to the glider price to yield an estimate of the potential HEV retail price.
C.4.2 Allocation of Indirect Costs
A vehicle’s retail price includes costs that are not directly associated with its manufacturing, but are incurred in other areas of vehicle manufacturing and retailing. These costs comprise production-related overhead, including research and development, engineering, depreciation and amortization, and warranty; corporate overhead, including management costs and retirement and health benefits; vehicle-sales-related costs, including vehicle distribution, advertising, dealer support, and dealer margin; and profit. A vehicle’s retail price structure can be broken down as shown in Figure C-1.
Figure C-1 Typical Breakdown of Vehicle Direct and Indirect Costs
C-6

HEV Costs
The cost of manufacturing, including assembly, typically accounts for about 50% of the retail price. Thus, a 100% mark-up would be applied to the manufacturing cost to arrive at the retail price. If vehicle components are procured from outside and the suppliers incur fixed production costs, the mark-up would be 50%. These mark-ups or cost multipliers are similar to those resulting from two other methodologies [17,18], which are compared in an ANL analysis [21]. This relationship can be extended to individual components. The analysis doubles the cost of a component manufactured by an OEM to arrive at its contribution to the vehicle retail price. However, several components of the HEV, such as motor, motor controller, and power electronics, are unlikely to be produced by an OEM. These components would likely be procured from independent suppliers, who would include warranty, R&D and engineering, and depreciation and amortizing costs in their component prices. The component prices are multiplied by a factor of 1.5 to arrive at their contributions to the vehicle retail price.
The module battery pack is a unique component. The mark-up factors are generally based on prior experience with the exception of batteries. Batteries are a large cost item that are likely to be from an outsource supplier(s). Batteries could follow the example of aircraft jet engines and heavy truck engines, which are large cost items from outsource suppliers that are assembled by the plane or truck manufacturer with a low mark-up. It did not seem that a full 74% mark-up (dealer and manufacturer) on the largest batteries seemed reasonable. Instead an equal mark-up was applied to the first 3 kWh for all batteries. However, since manufacturer overhead costs (e.g. labor, pensions, health care, plant) do not increase with battery size, a smaller mark-up for the pack size increment above 3 kWh was the compromise. In addition, carmaker costs for battery assembly, testing and storage vary little by size, and the warranty cost is already charged to the battery maker (with the risk it could also fall on the carmaker). The first cost and the battery system R&D costs for the carmaker, however, would increase with increased battery pack size. The WG compromise results in a 69% (or flat $800) battery mark-up for the HEV 0, a 45% (or flat $850 mark-up) for the HEV 20, and a 19 % (or flat $950 mark-up) for the HEV 60, with an additional 16.3% dealer mark-up applied only in the Base method. ANL in its own reports uses a relatively low multiplication factor of 1.15 to 1.3 for the battery module cost. This low factor is more reasonable than the 1.50 factor applied to the other outsource components, following the example of heavy truck and airplane manufacturing. A truck manufacturer installs an externally procured diesel engine in a heavy truck, adding a minimal mark-up. The airplane manufacturers install jet engines procured from outside suppliers, and they also apply a limited mark-up.
Substantial differences exist among vehicle manufacturers in allocating indirect costs and determining retail prices. The prices derived by this analysis should be viewed as representative of average prices in a market operating in a manner similar to today’s retail market, with the implicit assumption that manufacturers do not have to artificially subsidize HEVs in order to make them more acceptable to a risk-averse buying population.
C.4.3 Component Cost Information
ANL researchers analyzed material and manufacturing requirements for various vehicle components. They estimated material and manufacturing costs and then added indirect costs to estimate individual component cost. A database of component performance and cost was developed and incorporated in the methodology. The database contained data from published
C-7

HEV Costs
sources, as well as data developed through internal analyses. It was then expanded to project future costs, using technical judgment on learning and production-volume-related improvements. The resulting database contains cost data for four levels of production volumes. The first level is for an annual production of 25,000 vehicles. The next three levels represent annual production levels of 50,000-100,000, 100,000-200,000, and 250,000 or more vehicles. Thus, the cost estimation methodology does not estimate a potential HEV price for the initial production phase, when several components would be manufactured in small quantities by using less-than-optimal methods.
The component cost data shown in Figures C-2 through C-5 below are applicable at the OEM factory gate (what the manufacturer would pay for a component supplied by an outside vendor). The retail price equivalent to the consumer is computed through application of the above-mentioned mark-up factors, as shown in Table C-8.
Table C-8 Functions used for Estimating HEV Component Costs
Component Cost Function
Type Cost Function
Form Markup Factor
Engine Linear a + b • kW 2.0 Engine support system Step (a) 2.0 Transmission and gear drive Step (b) 2.0
Traction motor Linear c + d • kW 1.5 Power electronics & inverter Linear e + f • kW 1.5 Other (HVAC, auxiliary, and other) Fixed (c) 2.0 Battery pack housing and hardware Fixed (d) 2.0
Battery Linear g • kWh 1.15 to 1.3 Glider Fixed (e) 2.0
(a) Based on rating of the power unit. (b) The variable cost is zero up to 50 kW. (c) Based on vehicle size, mass, and interior volume. (d) Based on battery pack size, power, mass, and volume. (e) The glider cost was computed such that the CV RPE, after mark up, is the same under both
Base and ANL methods.
C.4.4 Component Cost Functions
The vehicle glider, engine and associated system, transmission and/or gear drive, system control, HVAC drive, auxiliary drives and related components, and battery pack tray and hardware are assumed to be manufactured by the OEM. All electric power train components, including the motor/generator and inverter/controller with power electronics, are procured from outside suppliers. Table C-8 shows various cost functions used within the cost methodology.
The second column in the table, “cost function type,” indicates the method of cost computation. The methods are (1) linear, in which fixed plus variable cost per kilowatt values are used; (2) step, in which the cost remains unchanged until a minimum power rating is reached, and thereafter a variable cost per each additional kilowatt is added; and (3) fixed, in which the cost changes with vehicle size or battery pack size.
C-8

HEV Costs
The cost function for the engine has a fixed component and a per kilowatt component. The parameters for these engine cost functions were estimated by ANL staff through an analysis of spark-ignition engine cost data and current premium for a diesel engine. The WG decided to use the cost equations developed at General Motors for four- and six-cylinder engines in this analysis. Within the ANL methodology, engine supporting system cost is computed by using step-functions, as shown in Figure C-2. These systems include those for cooling, exhaust, and fuel. The ANL step functions were not used by the HEV Working Group. Fixed values were assigned and appropriate mark-up factors were applied.
The transmission and gear drive cost functions within the ANL methodology reflect fixed costs up to 50 kW and a variable cost for each additional kilowatt as shown in Figure C-3. These cost functions were not used by the HEV Working Group. The Group selected fixed cost values and applied appropriate mark-up factors to them.
Figure C-2 Engine Support System Cost Curves
C-9
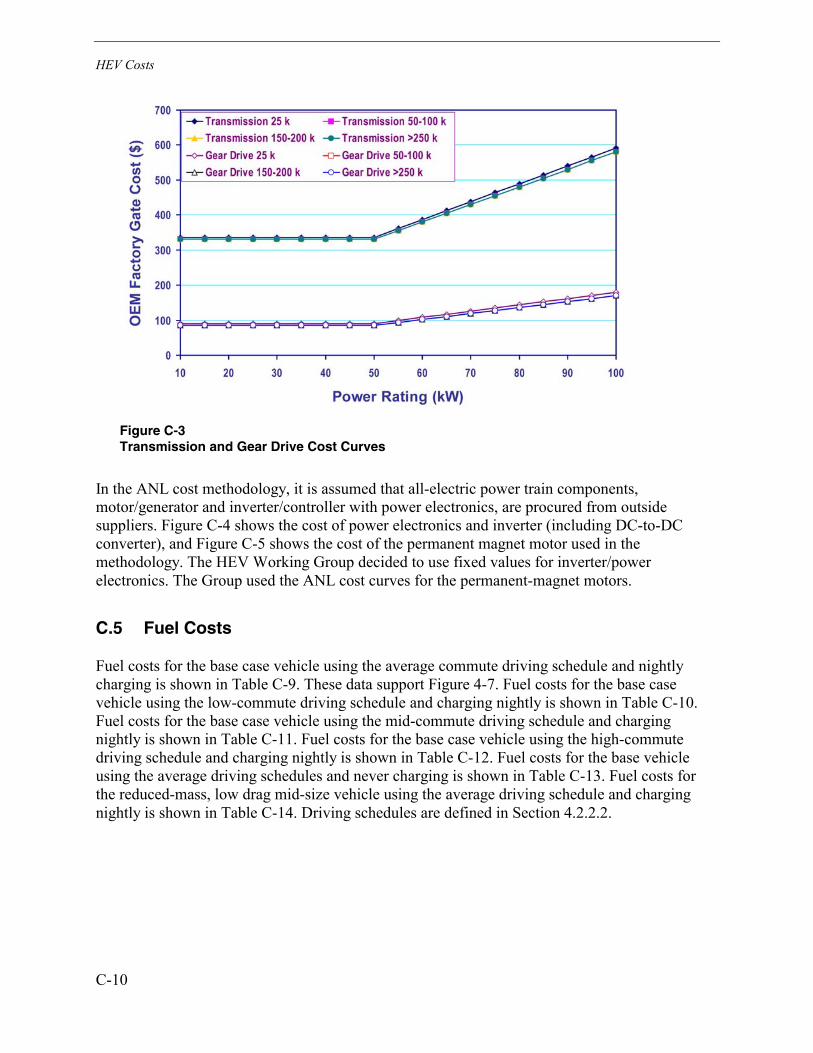
HEV Costs
Figure C-3 Transmission and Gear Drive Cost Curves
In the ANL cost methodology, it is assumed that all-electric power train components, motor/generator and inverter/controller with power electronics, are procured from outside suppliers. Figure C-4 shows the cost of power electronics and inverter (including DC-to-DC converter), and Figure C-5 shows the cost of the permanent magnet motor used in the methodology. The HEV Working Group decided to use fixed values for inverter/power electronics. The Group used the ANL cost curves for the permanent-magnet motors.
C.5 Fuel Costs
Fuel costs for the base case vehicle using the average commute driving schedule and nightly charging is shown in Table C-9. These data support Figure 4-7. Fuel costs for the base case vehicle using the low-commute driving schedule and charging nightly is shown in Table C-10. Fuel costs for the base case vehicle using the mid-commute driving schedule and charging nightly is shown in Table C-11. Fuel costs for the base case vehicle using the high-commute driving schedule and charging nightly is shown in Table C-12. Fuel costs for the base vehicle using the average driving schedules and never charging is shown in Table C-13. Fuel costs for the reduced-mass, low drag mid-size vehicle using the average driving schedule and charging nightly is shown in Table C-14. Driving schedules are defined in Section 4.2.2.2.
C-10

HEV Costs
Figure C-4 High-Voltage Inverter and Power Electronics Cost Curves
Figure C-5 Permanent Magnet Motor/Generator Cost Curves
C-11
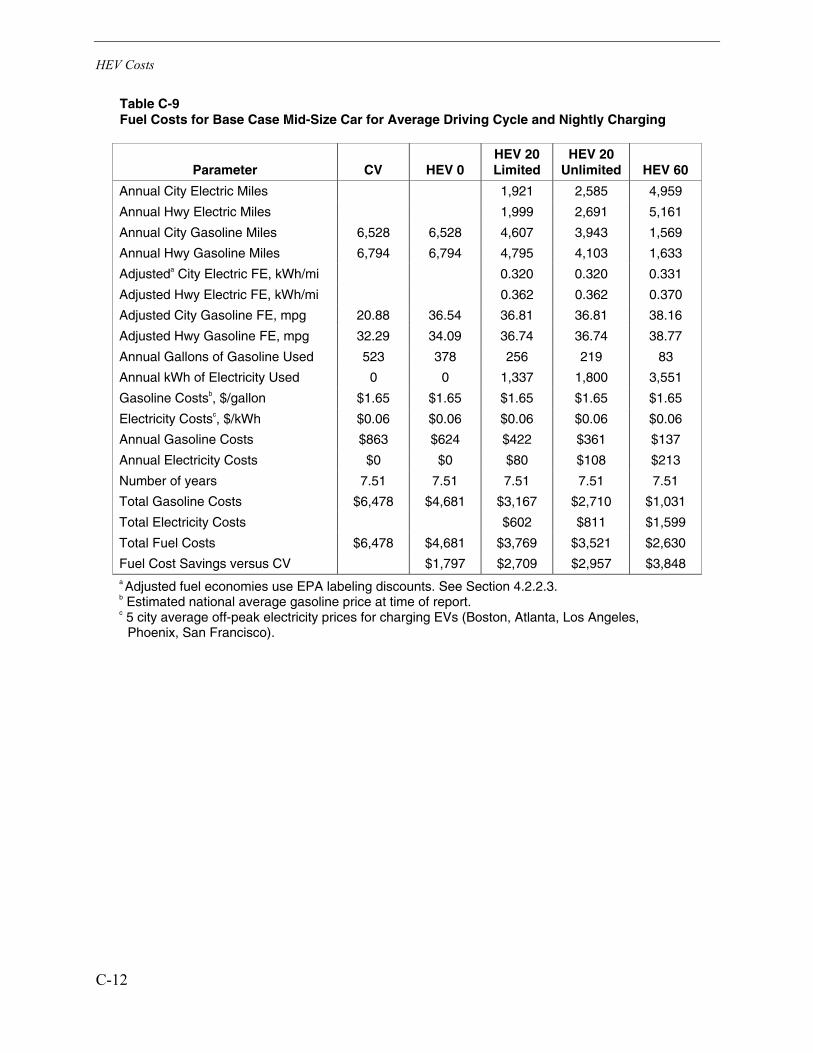
HEV Costs
Table C-9 Fuel Costs for Base Case Mid-Size Car for Average Driving Cycle and Nightly Charging
Parameter CV HEV 0 HEV 20 Limited
HEV 20 Unlimited HEV 60
Annual City Electric Miles 1,921 2,585 4,959
Annual Hwy Electric Miles 1,999 2,691 5,161
Annual City Gasoline Miles 6,528 6,528 4,607 3,943 1,569
Annual Hwy Gasoline Miles 6,794 6,794 4,795 4,103 1,633
Adjusteda City Electric FE, kWh/mi 0.320 0.320 0.331
Adjusted Hwy Electric FE, kWh/mi 0.362 0.362 0.370
Adjusted City Gasoline FE, mpg 20.88 36.54 36.81 36.81 38.16
Adjusted Hwy Gasoline FE, mpg 32.29 34.09 36.74 36.74 38.77
Annual Gallons of Gasoline Used 523 378 256 219 83
Annual kWh of Electricity Used 0 0 1,337 1,800 3,551
Gasoline Costsb, $/gallon $1.65 $1.65 $1.65 $1.65 $1.65
Electricity Costsc, $/kWh $0.06 $0.06 $0.06 $0.06 $0.06
Annual Gasoline Costs $863 $624 $422 $361 $137
Annual Electricity Costs $0 $0 $80 $108 $213
Number of years 7.51 7.51 7.51 7.51 7.51
Total Gasoline Costs $6,478 $4,681 $3,167 $2,710 $1,031
Total Electricity Costs $602 $811 $1,599
Total Fuel Costs $6,478 $4,681 $3,769 $3,521 $2,630
Fuel Cost Savings versus CV $1,797 $2,709 $2,957 $3,848 a Adjusted fuel economies use EPA labeling discounts. See Section 4.2.2.3. b Estimated national average gasoline price at time of report. c 5 city average off-peak electricity prices for charging EVs (Boston, Atlanta, Los Angeles,
Phoenix, San Francisco).
C-12

HEV Costs
Table C-10 Fuel Costs for Base Case Mid-Size Car for Low Commute Driving Cycle and Nightly Charging
Parameter CV HEV 0 HEV 20 Limited
HEV 20 Unlimited HEV 60
Annual City Electric Miles 1,389 2,330 2,768
Annual Hwy Electric Miles 1,547 2,595 3,085
Annual City Gasoline Miles 3,648 3,648 2,259 1,318 879
Annual Hwy Gasoline Miles 4,064 4,064 2,517 1,469 980
Adjusteda City Electric FE, kWh/mi 20.88 36.54 36.81 36.81 38.16
Adjusted Hwy Electric FE, kWh/mi 32.29 34.09 36.74 36.74 38.77
Adjusted City Gasoline FE, mpg 0.320 0.320 0.331
Adjusted Hwy Gasoline FE, mpg 0.362 0.362 0.370
Annual Gallons of Gasoline Used 301 219 130 76 48
Annual kWh of Electricity Used 0 0 1,004 1,684 2,058
Gasoline Costsb, $/gallon $1.65 $1.65 $1.65 $1.65 $1.65
Electricity Costsc, $/kWh $0.06 $0.06 $0.06 $0.06 $0.06
Annual Gasoline Costs $496 $361 $214 $125 $80
Annual Electricity Costs $0 $0 $60 $101 $123
Number of years 10.00 10.00 10.00 10.00 10.00
Total Gasoline Costs $4,959 $3,615 $2,143 $1,251 $797
Total Electricity Costs $0 $0 $602 $1,010 $1,235
Total Fuel Costs $4,959 $3,615 $2,745 $2,261 $2,032
Fuel Cost Savings versus CV $1,345 $2,214 $2,698 $2,928 a Adjusted fuel economies use EPA labeling discounts. See Section 4.2.2.3. b Estimated national average gasoline price at time of report. c 5 city average off-peak electricity prices for charging EVs (Boston, Atlanta, Los Angeles, Phoenix,
San Francisco).
C-13

HEV Costs
Table C-11 Fuel Costs for Base Case Mid-Size Car for Mid Commute Driving Cycle and Nightly Charging
Parameter CV HEV 0 HEV 20 Limited
HEV 20 Unlimited HEV 60
Annual City Electric Miles 1,867 2,867 5,309
Annual Hwy Electric Miles 1,662 2,552 4,727
Annual City Gasoline Miles 6,315 6,315 4,448 3,448 1,006
Annual Hwy Gasoline Miles 5,622 5,622 3,960 3,070 895
Adjusteda City Electric FE, kWh/mi 20.88 36.54 36.81 36.81 38.16
Adjusted Hwy Electric FE, kWh/mi 32.29 34.09 36.74 36.74 38.77
Adjusted City Gasoline FE, mpg 0.320 0.320 0.331
Adjusted Hwy Gasoline FE, mpg 0.362 0.362 0.370
Annual Gallons of Gasoline Used 477 338 229 177 49
Annual kWh of Electricity Used 0 0 1,198 1,840 3,507
Gasoline Costsb, $/gallon $1.65 $1.65 $1.65 $1.65 $1.65
Electricity Costsc, $/kWh $0.06 $0.06 $0.06 $0.06 $0.06
Annual Gasoline Costs $786 $557 $377 $292 $82
Annual Electricity Costs $0 $0 $72 $110 $210
Number of years 8.38 8.38 8.38 8.38 8.38
Total Gasoline Costs $6,587 $4,669 $3,160 $2,450 $684
Total Electricity Costs $0 $0 $602 $925 $1,763
$6,587 $4,669 $3,762 $3,375 $2,446
Fuel Cost Savings versus CV $1,918 $2,825 $3,212 $4,141 a Adjusted fuel economies use EPA labeling discounts. See Section 4.2.2.3. b Estimated national average gasoline price at time of report.
Total Fuel Costs
c 5 city average off-peak electricity prices for charging EVs (Boston, Atlanta, Los Angeles, Phoenix, San Francisco).
C-14

HEV Costs
Table C-12 Fuel Costs for Base Case Mid-Size Car for High Commute Driving Cycle and Nightly Charging
Parameter CV HEV 0 HEV 20 Limited
HEV 20 Unlimited HEV 60
Annual City Electric Miles 2,491 2,544 6,094
Annual Hwy Electric Miles 2,786 2,845 6,818
Annual City Gasoline Miles 8,484 8,484 5,993 5,941 2,390
Annual Hwy Gasoline Miles 9,491 9,491 6,704 6,645 2,673
Adjusteda City Electric FE, kWh/mi 20.88 36.54 36.81 36.81 38.16
Adjusted Hwy Electric FE, kWh/mi 32.29 34.09 36.74 36.74 38.77
Adjusted City Gasoline FE, mpg 0.320 0.320 0.331
Adjusted Hwy Gasoline FE, mpg 0.362 0.362 0.370
Annual Gallons of Gasoline Used 700 511 345 342 132
Annual kWh of Electricity Used 0 0 1,805 1,843 4,540
Gasoline Costsb, $/gallon $1.65 $1.65 $1.65 $1.65 $1.65
Electricity Costsc, $/kWh $0.06 $0.06 $0.06 $0.06 $0.06
Annual Gasoline Costs $1,155 $843 $570 $565 $217
Annual Electricity Costs $0 $0 $108 $111 $272
Number of years 5.56 5.56 5.56 5.56 5.56
Total Gasoline Costs $6,428 $4,687 $3,170 $3,142 $1,208
Total Electricity Costs $0 $0 $602 $615 $1,515
Total Fuel Costs $6,428 $4,687 $3,772 $3,757 $2,723
Fuel Cost Savings versus CV $1,741 $2,656 $2,671 $3,705 a Adjusted fuel economies use EPA labeling discounts. See Section 4.2.2.3. b Estimated national average gasoline price at time of report. c 5 city average off-peak electricity prices for charging EVs (Boston, Atlanta, Los Angeles, Phoenix, San Francisco).
C-15

HEV Costs
Table C-13 Fuel Costs for Base Case Mid-Size Car for Average Driving Cycle and Never Charging
Parameter CV HEV 0 HEV 20a HEV 60
Annual City Electric Miles
Annual Hwy Electric Miles
Annual City Gasoline Miles 6,528 6,528 6,528 6,528
Annual Hwy Gasoline Miles 6,794 6,794 6,794 6,794
Adjustedb City Electric FE, kWh/mi 20.88 36.54 36.81 38.16
Adjusted Hwy Electric FE, kWh/mi 32.29 34.09 36.74 38.77
Adjusted City Gasoline FE, mpg 0.320 0.331
Adjusted Hwy Gasoline FE, mpg 0.362 0.370
Annual Gallons of Gasoline Used 523 378 362 346
Annual kWh of Electricity Used 0 0 0 0
Gasoline Costsc, $/gallon $1.65 $1.65 $1.65 $1.65 d, $0.06 $0.06 $0.06 $0.06
Annual Gasoline Costs $863 $624 $598 $571
Annual Electricity Costs $0 $0 $0 $0
Number of years 7.51 7.51 7.51 7.51
Total Gasoline Costs $6,478 $4,681 $4,487 $4,289
Total Electricity Costs $0 $0 $0 $0
Total Fuel Costs $6,478 $4,681 $4,487 $4,289
Fuel Cost Savings versus CV $1,797 $1,991 $2,189 a In the never charge case, HEV 20 Limited and HEV 20 Unlimited are the same. b Adjusted fuel economies use EPA labeling discounts. See Section 4.2.2.3. c Estimated national average gasoline price at time of report. d 5 city average off-peak electricity prices for charging EVs (Boston, Atlanta, Los Angeles,
Phoenix, San Francisco).
Electricity Costs $/kWh
C-16

HEV Costs
Table C-14 Fuel Costs for Low-Drag, Reduced Mass Mid-Size Car for Average Driving Cycle and Nightly Charging
Parameter CV HEV 0 HEV 60
Annual City Electric Miles 4,959
Annual Hwy Electric Miles 5,161
Annual City Gasoline Miles 6,528 6,528 1,569
Annual Hwy Gasoline Miles 6,794 6,794 1,633
Adjusteda City Electric FE, kWh/mi 24.93 52.20 50.67
Adjusted Hwy Electric FE, kWh/mi 39.39 54.37 52.49
Adjusted City Gasoline FE, mpg 0.229
Adjusted Hwy Gasoline FE, mpg 0.234
Annual Gallons of Gasoline Used 434 250 62
Annual kWh of Electricity Used 0 0 2,341
Gasoline Costsb, $/gallon $1.65 $1.65 $1.65
Electricity Costsc, $/kWh $0.06 $0.06 $0.06
Annual Gasoline Costs $717 $413 $102
Annual Electricity Costs $0 $0 $140
Number of years 7.51 7.51 7.51
Total Gasoline Costs $5,379 $3,097 $769
Total Electricity Costs $0 $0 $1,054
Total Fuel Costs $5,379 $3,097 $1,823
Fuel Cost Savings versus CV $2,283 $3,556 a Adjusted fuel economies use EPA labeling discounts. See Section 4.2.2.3. b Estimated national average gasoline price at time of report. c 5 city average off-peak electricity prices for charging EVs (Boston, Atlanta,
Los Angeles, Phoenix, San Francisco).
C.6 Maintenance Costs
Maintenance costs for the base case mid-size car using the average driving schedule and nightly charging is shown in Table C-15. These data support Figure 4-8. Maintenance costs for the base case mid-size car using the low-commute driving schedule and charging nightly is shown in Table C-16. Maintenance costs for the base case mid-size car using the mid-commute driving schedule and charging nightly is shown in Table C-17. Maintenance costs for the base case mid-size car using the high-commute driving schedule and charging nightly is shown in Table C-18. Maintenance costs for the base case mid-size car using the average commute driving schedule and never charging is shown in Table C-19. Maintenance costs for the low mass, low drag mid-size car using the average commute driving schedule and charging nightly is shown in Table C-20.
C-17

HEV Costs
Table C-15 Scheduled Maintenance Costs for Base Case Mid-Size Car using Average Driving Schedule and Nightly Charginga
Vehicle Type CV HEV 0 HEV 20 Limited
HEV 20 Unlimited HEV 60
Number of Lifetime Oil Changes 16 16 11 10 7
Oil and Filter Costs per Oil Change $28 $23 $23 $23 $20
Oil Change Labor per Oil Change $21 $21 $21 $21 $21
Interval between Oil Changes, years 0.45 0.45 0.64 0.75 1.00
Lifetime Oil Change Cost $776 $696 $479 $435 $287
Number of Lifetime Air Filter Replacements 3 3 2 2 0
Air Filter Costs per Replacement $25 $20 $20 $20 $15
Air Filter Replacement Labor per Replacement $6 $6 $6 $6 $6
Interval Between Replacements, years 2.25 2.25 3.19 3.73 9.37
Lifetime Air Filter Replacement Costs $92 $77 $51 $51 $0
Number of Lifetime Spark Plug Replacements 1 1 1 1 0
Spark Plug Costs per Replacement $51 $34 $34 $34 $26
$34 $22 $22 $22 $17
Interval Between Replacements, years 3.75 3.75 5.32 6.21 15.62
Lifetime Spark Plug Replacement Costs $85 $56 $56 $56 $0
Number of Lifetime Timing Chain Adjustments 1 1 0 0 0
Timing Chain Adjustment Labor per Adjustment $140 $140 $140 $140 $140
Interval Between Adjustments, years 6.76 6.76 9.57 11.19 28.11
Lifetime Timing Chain Adjustment Costs $140 $140 $0 $0 $0
Number of Lifetime Front Brake Replacements 2 1 1 1 1
Front Brake Costs per Replacement $100 $100 $100 $100 $100
Front Brake labor costs per Replacement $140 $140 $140 $140 $140
Interval Between Replacements, years 3.00 6.01 6.01 6.01 6.01
Lifetime Front Brake Replacement Costs $480 $240 $240 $240 $240
Additional Scheduled Maintenance Costs at 2.828 cents per mileb
$2,830 $2,830 $2,830 $2,830 $2,830
Lifetime Scheduled Costs $4,402 $4,039 $3,656 $3,613 $3,357
Maintenance Savings versus CV $363 $746 $790 $1,045 a See Table C-9 for annual miles in gasoline only and electric only modes and number of years. b Represents other maintenance items that are common between CVs and HEVs. Difference between CV
scheduled maintenance costs detailed in the above table and the average 4.4 cents per mile maintenance costs for mid-size cars found in the Complete Car Cost Guide 2000. See Section 4.2.2.4.
Spark Plug Replacement Labor per Replacement
C-18

HEV Costs
Table C-16 Scheduled Maintenance Costs for Base Case Mid-Size Car using Low-Commute Driving Schedule and Nightly Charginga
Vehicle Type CV HEV 0 HEV 20 Limited
HEV 20 Unlimited HEV 60
Number of Lifetime Oil Changes 12 12 10 10 10
Oil and Filter Costs per Oil Change $28 $23 $23 $23 $20
Oil Change Labor per Oil Change $21 $21 $21 $21 $21
Interval between Oil Changes, years 0.78 0.78 1.00 1.00 1.00
Lifetime Oil Change Cost $582 $522 $435 $435 $410
Number of Lifetime Air Filter Replacements 2 2 1 0 0
Air Filter Costs per Replacement $25 $20 $20 $20 $15
Air Filter Replacement Labor per Replacement $6 $6 $6 $6 $6
Interval Between Replacements, years 3.89 3.89 6.28 10.76 16.14
Lifetime Air Filter Replacement Costs $61 $51 $26 $0 $0
Number of Lifetime Spark Plug Replacements 1 1 0 0 0
Spark Plug Costs per Replacement $51 $34 $34 $34 $26
Spark Plug Replacement Labor per Replacement $34 $22 $22 $22 $17
Interval Between Replacements, years 6.48 6.48 10.47 17.94 26.90
Lifetime Spark Plug Replacement Costs $85 $56 $0 $0 $0
Number of Lifetime Timing Chain Adjustments 0 0 0 0 0
Timing Chain Adjustment Labor per Adjustment $140 $140 $140 $140 $140
Interval Between Adjustments, years 11.67 11.67 18.85 32.29 48.41
Lifetime Timing Chain Adjustment Costs $0 $0 $0 $0 $0
Number of Lifetime Front Brake Replacements 1 0 0 0 0
Front Brake Costs per Replacement $100 $100 $100 $100 $100
Front Brake labor costs per Replacement $140 $140 $140 $140 $140
Interval Between Replacements, years 5.19 10.37 10.37 10.37 10.37
Lifetime Front Brake Replacement Costs $240 $0 $0 $0 $0
Additional Scheduled Maintenance Costs at 2.828 cents per mileb
$2,182 $2,182 $2,182 $2,182 $2,182
Lifetime Scheduled Costs $3,150 $2,812 $2,643 $2,617 $2,592
Maintenance Savings versus CV $338 $507 $533 $558 a See Table C-10 for annual miles in gasoline only and electric only modes and number of years. b Represents other maintenance items that are common between CVs and HEVs. Difference between
CV scheduled maintenance costs detailed in the above table and the average 4.4 cents per mile maintenance costs for mid-size cars found in the Complete Car Cost Guide 2000. See Section 4.2.2.4.
C-19
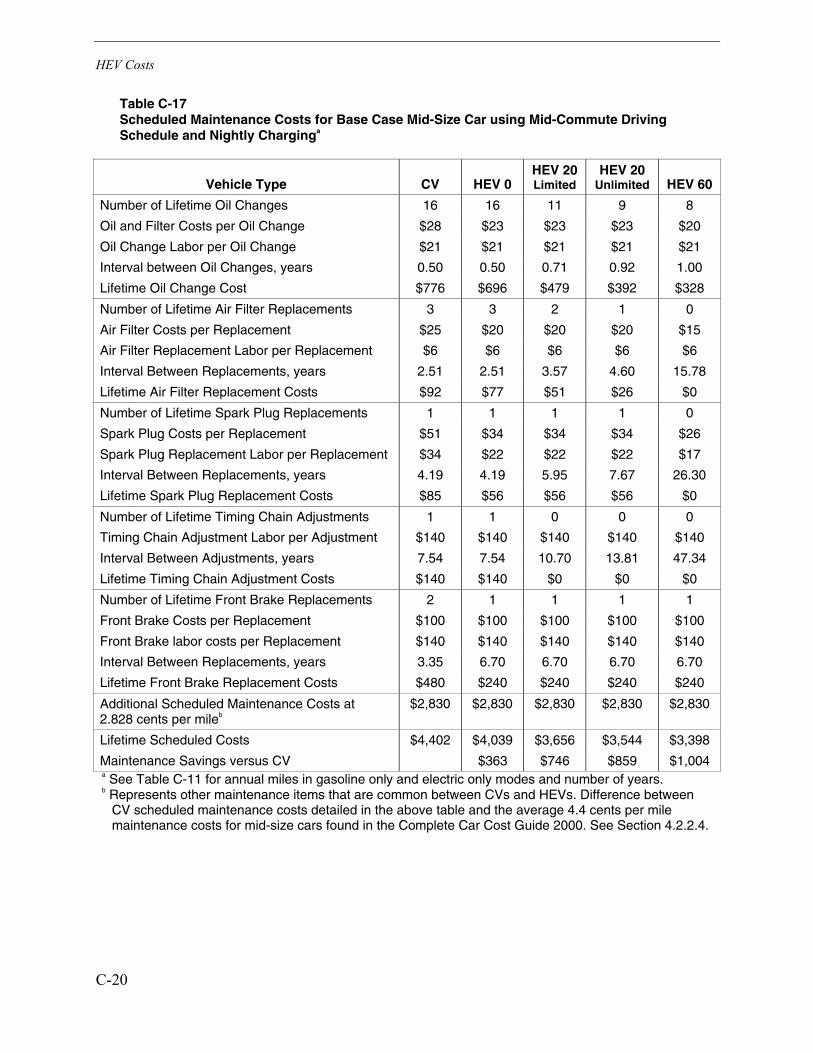
HEV Costs
Table C-17 Scheduled Maintenance Costs for Base Case Mid-Size Car using Mid-Commute Driving Schedule and Nightly Charginga
Vehicle Type CV HEV 0 HEV 20 Limited
HEV 20 Unlimited HEV 60
Number of Lifetime Oil Changes 16 16 11 9 8
Oil and Filter Costs per Oil Change $28 $23 $23 $23 $20
Oil Change Labor per Oil Change $21 $21 $21 $21 $21
Interval between Oil Changes, years 0.50 0.50 0.71 0.92 1.00
Lifetime Oil Change Cost $776 $696 $479 $392 $328
Number of Lifetime Air Filter Replacements 3 3 2 1 0
Air Filter Costs per Replacement $25 $20 $20 $20 $15
Air Filter Replacement Labor per Replacement $6 $6 $6 $6 $6
Interval Between Replacements, years 2.51 2.51 3.57 4.60 15.78
Lifetime Air Filter Replacement Costs $92 $77 $51 $26 $0
Number of Lifetime Spark Plug Replacements 1 1 1 1 0
$51 $34 $34 $34 $26
Spark Plug Replacement Labor per Replacement $34 $22 $22 $22 $17
4.19 4.19 5.95 7.67 26.30
Lifetime Spark Plug Replacement Costs $85 $56 $56 $56 $0
Number of Lifetime Timing Chain Adjustments 1 1 0 0 0
Timing Chain Adjustment Labor per Adjustment $140 $140 $140 $140 $140
Interval Between Adjustments, years 7.54 7.54 10.70 13.81 47.34
Lifetime Timing Chain Adjustment Costs $140 $140 $0 $0 $0
Number of Lifetime Front Brake Replacements 2 1 1 1 1
Front Brake Costs per Replacement $100 $100 $100 $100 $100
Front Brake labor costs per Replacement $140 $140 $140 $140 $140
Interval Between Replacements, years 3.35 6.70 6.70 6.70 6.70
Lifetime Front Brake Replacement Costs $480 $240 $240 $240 $240
Additional Scheduled Maintenance Costs at 2.828 cents per mileb
$2,830 $2,830 $2,830 $2,830 $2,830
Lifetime Scheduled Costs $4,402 $4,039 $3,656 $3,544 $3,398
Maintenance Savings versus CV $363 $746 $859 $1,004 a See Table C-11 for annual miles in gasoline only and electric only modes and number of years. b Represents other maintenance items that are common between CVs and HEVs. Difference between
CV scheduled maintenance costs detailed in the above table and the average 4.4 cents per mile maintenance costs for mid-size cars found in the Complete Car Cost Guide 2000. See Section 4.2.2.4.
Spark Plug Costs per Replacement
Interval Between Replacements, years
C-20

HEV Costs
Table C-18 Scheduled Maintenance Costs for Base Case Mid-Size Car using High-Commute Driving Schedule and Nightly Charginga
Vehicle Type CV HEV 0 HEV 20 Limited
HEV 20 Unlimited HEV 60
Number of Lifetime Oil Changes 16 16 11 11 5
Oil and Filter Costs per Oil Change $28 $23 $23 $23 $20
Oil Change Labor per Oil Change $21 $21 $21 $21 $21
Interval between Oil Changes, years 0.33 0.33 0.47 0.48 1.00
Lifetime Oil Change Cost $776 $696 $479 $479 $205
Number of Lifetime Air Filter Replacements 3 3 2 2 0
Air Filter Costs per Replacement $25 $20 $20 $20 $15
Air Filter Replacement Labor per Replacement $6 $6 $6 $6 $6
Interval Between Replacements, years 1.67 1.67 2.36 2.38 5.93
Lifetime Air Filter Replacement Costs $92 $77 $51 $51 $0
Number of Lifetime Spark Plug Replacements 1 1 1 1 0
Spark Plug Costs per Replacement $51 $34 $34 $34 $26
Spark Plug Replacement Labor per Replacement $34 $22 $22 $22 $17
Interval Between Replacements, years 2.78 2.78 3.94 3.97 9.88
Lifetime Spark Plug Replacement Costs $85 $56 $56 $56 $0
Number of Lifetime Timing Chain Adjustments 1 1 0 0 0
Timing Chain Adjustment Labor per Adjustment $140 $140 $140 $140 $140
Interval Between Adjustments, years 5.01 5.01 7.09 7.15 17.78
Lifetime Timing Chain Adjustment Costs $140 $140 $0 $0 $0
Number of Lifetime Front Brake Replacements 2 1 1 1 1
Front Brake Costs per Replacement $100 $100 $100 $100 $100
Front Brake labor costs per Replacement $140 $140 $140 $140 $140
Interval Between Replacements, years 2.23 4.45 4.45 4.45 4.45
Lifetime Front Brake Replacement Costs $480 $240 $240 $240 $240
Additional Scheduled Maintenance Costs at 2.828 cents per mileb
$2,830 $2,830 $2,830 $2,830 $2,830
Lifetime Scheduled Costs $4,402 $4,039 $3,656 $3,656 $3,275
Maintenance Savings versus CV $363 $746 $746 $1,127 a See Table C-12 for annual miles in gasoline only and electric only modes and number of years. b Represents other maintenance items that are common between CVs and HEVs. Difference between
CV scheduled maintenance costs detailed in the above table and the average 4.4 cents per mile maintenance costs for mid-size cars found in the Complete Car Cost Guide 2000. See Section 4.2.2.4.
C-21

HEV Costs
Table C-19 Scheduled Maintenance Costs for Base Case Mid-Size Car using Average Driving Schedule and Never Charginga
Vehicle Type CV HEV 0 HEV 20b HEV 60
Number of Lifetime Oil Changes 16 16 16 16
Oil and Filter Costs per Oil Change $28 $23 $23 $20
Oil Change Labor per Oil Change $21 $21 $21 $21
Interval between Oil Changes, years 0.45 0.45 0.45 0.45
Lifetime Oil Change Cost $776 $696 $696 $656
Number of Lifetime Air Filter Replacements 3 3 3 3
Air Filter Costs per Replacement $25 $20 $20 $15
Air Filter Replacement Labor per Replacement $6 $6 $6 $6
Interval Between Replacements, years 2.25 2.25 2.25 2.25
Lifetime Air Filter Replacement Costs $92 $77 $77 $62
Number of Lifetime Spark Plug Replacements 1 1 1 1
Spark Plug Costs per Replacement $51 $34 $34 $26
Spark Plug Replacement Labor per Replacement $34 $22 $22 $17
Interval Between Replacements, years 3.75 3.75 3.75 3.75
Lifetime Spark Plug Replacement Costs $85 $56 $56 $42
Number of Lifetime Timing Chain Adjustments 1 1 1 1
Timing Chain Adjustment Labor per Adjustment $140 $140 $140 $140
Interval Between Adjustments, years 6.76 6.76 6.76 6.76
Lifetime Timing Chain Adjustment Costs $140 $140 $140 $140
Number of Lifetime Front Brake Replacements 2 1 1 1
Front Brake Costs per Replacement $100 $100 $100 $100
Front Brake labor costs per Replacement $140 $140 $140 $140
Interval Between Replacements, years 3.00 6.01 6.01 6.01
Lifetime Front Brake Replacement Costs $480 $240 $240 $240
Additional Scheduled Maintenance Costs at 2.828 cents per milec
$2,828 $2,828 $2,828 $2,828
Lifetime Scheduled Costs $4,400 $4,037 $4,037 $3,968
Maintenance Savings versus CV $363 $363 $432 a See Table C-13 for annual miles in gasoline only and electric only modes and number of years. b In the never charge case, HEV 20 Limited and HEV 20 Unlimited are the same. c Represents other maintenance items that are common between CVs and HEVs. Difference
between CV scheduled maintenance costs detailed in the above table and the average 4.4 cents per mile maintenance costs for mid-size cars found in the Complete Car Cost Guide 2000. See Section 4.2.2.4.
C-22

HEV Costs
Table C-20 Scheduled Maintenance Costs for Low-Drag, Reduced Mass Mid-Size Car using Average Driving Schedule and Nightly Charginga
Vehicle Type CV HEV 0 HEV 60
Number of Lifetime Oil Changes 16 16 7
Oil and Filter Costs per Oil Change $28 $23 $20
Oil Change Labor per Oil Change $21 $21 $21
Interval between Oil Changes, years 0.45 0.45 1.00
Lifetime Oil Change Cost $776 $696 $287
Number of Lifetime Air Filter Replacements 3 3 0
Air Filter Costs per Replacement $25 $20 $15
$6 $6 $6
Interval Between Replacements, years 2.25 2.25 9.37
Lifetime Air Filter Replacement Costs $92 $77 $0
Number of Lifetime Spark Plug Replacements 1 1 0
Spark Plug Costs per Replacement $51 $34 $26
Spark Plug Replacement Labor per Replacement $34 $22 $17
Interval Between Replacements, years 3.75 3.75 15.62
Lifetime Spark Plug Replacement Costs $85 $56 $0
Number of Lifetime Timing Chain Adjustments 1 1 0
Timing Chain Adjustment Labor per Adjustment $140 $140 $140
Interval Between Adjustments, years 6.76 6.76 28.11
Lifetime Timing Chain Adjustment Costs $140 $140 $0
Number of Lifetime Front Brake Replacements 2 1 1
Front Brake Costs per Replacement $100 $100 $100
$140 $140 $140
Interval Between Replacements, years 3.00 6.01 6.01
Lifetime Front Brake Replacement Costs $480 $240 $240
Additional Scheduled Maintenance Costs at 2.828 cents per mileb
$2,830 $2,830 $2,830
Lifetime Scheduled Costs $4,402 $4,039 $3,357
Maintenance Savings versus CV $363 $1,045 a See Table C-14 for annual miles in gasoline only and electric only modes and number
of years. b Represents other maintenance items that are common between CVs and HEVs.
Difference between CV scheduled maintenance costs detailed in the above table and the average 4.4 cents per mile maintenance costs for mid-size cars found in the Complete Car Cost Guide 2000. See Section 4.2.2.4.
Air Filter Replacement Labor per Replacement
Front Brake labor costs per Replacement
C-23

HEV Costs
C.7 Petroleum Displacement
Tables C-21 and C-22 show petroleum displacement calculations for the base case and reduced mass, low-drag case vehicles when operated on the average driving schedule and charged nightly.
Table C-21 Petroleum Displacement for Base Case Mid-Size Car for Average Driving Cycle and Nightly Charging
Parameter CV HEV 0 HEV 20 Limited
HEV 20 Unlimited HEV 60
Annual City Electric Miles 1,921 2,585 4,959
1,999 2,691 5,161
Annual City Gasoline Miles 6,528 6,528 4,607 3,943 1,569
Annual Hwy Gasoline Miles 6,794 6,794 4,795 4,103 1,633
Adjusteda City Electric FE, kWh/mi — — 0.320 0.320 0.331
Adjusted Hwy Electric FE, kWh/mi — — 0.362 0.362 0.370
Adjusted City Gasoline FE, mpg 20.88 36.54 36.81 36.81 38.16
Adjusted Hwy Gasoline FE, mpg 32.29 34.09 36.74 36.74 38.77
Annual Gallons of Gasoline Used 523 378 256 219 83
Number of years 7.51 7.51 7.51 7.51 7.51
Lifetime Gallons of Gasoline Used 3,926 2,837 1,919 1,642 625
Fuel Tank Size, gallonsb 14.1 10.2 9.5 9.5 9.1 b 37 37 27 23 9
Fuel Tank Size, gallonsc 14.1 14.1 14.1 14.1 14.1
Annual Trips to the Gas Stationc 37 27 18 16 6 a Adjusted fuel economies use EPA labeling discounts. See Section 4.2.2.3. b Fuel tank size for 350 gasoline-only miles for CV and HEV designs. c Fuel tank size held constant for CV and HEV designs.
Annual Hwy Electric Miles
Annual Trips to the Gas Station
C-24

HEV Costs
Table C-22 Petroleum Displacement for Low-Drag, Reduced Mass Mid-Size Car for Average Driving Cycle and Nightly Charging
Parameter CV HEV 0 HEV 60
Annual City Electric Miles 4,959
Annual Hwy Electric Miles 5,161
Annual City Gasoline Miles 6,528 6,528 1,569
Annual Hwy Gasoline Miles 6,794 6,794 1,633
Adjusteda City Electric FE, kWh/mi 24.93 52.20 50.67
Adjusted Hwy Electric FE, kWh/mi 39.39 54.37 52.49
Adjusted City Gasoline FE, mpg 0.229
Adjusted Hwy Gasoline FE, mpg 0.234
Annual Gallons of Gasoline Used 434 250 62
Number of years 7.51 7.51 7.51
Lifetime Gallons of Gasoline Used 3,260 1,877 466
Fuel Tank Size, gallonsb 11.7 10.2 6.8
Annual Trips to the Gas Stationb 37 25 9
Fuel Tank Size, gallonsc 11.7 11.7 11.7
Annual Trips to the Gas Stationc 37 21 5 a Adjusted fuel economies use EPA labeling discounts. See Section 4.2.2.3. b Fuel tank size for 350 gasoline-only miles for CV and HEV designs. c Fuel tank size held constant for CV and HEV designs.
C-25


D CUSTOMER PREFERENCE
This appendix provides additional information relative to Section 5. It contains the HEV Discussion Guide that was used for the Focus Groups, the HEV Interview Questions for the Interviews, the HEV Frequently Asked Questions, and the HEV Education Slides.
D.1 HEV Discussion Guide
The HEV Discussion Guide was used in the Focus Groups. Focus Group leaders had 2 FLIP CHARTS – multi-colored pens; prepare intro questions; HANDOUTS, POSTERS – show the technologies; and PADS and PENCILS for each person. The discussions were organized as follows:
1. Introduction 10 MIN; 0:10 TOTAL
Goal: Explain the purpose of the group to the participants and get them to feel comfortable speaking out.
THANKS!! Purpose is to discuss new vehicle technologies.
Mirror, videocamera, colleagues. Encourage opposing opinions. Explain show of hands.
GO AROUND – Introduce yourselves. Mention car you currently drive, whether you purchased outright, financed or leased, approximate miles driven per day, mix of city/freeway driving, other driving needs.
2. Initial perceptions of HEVs 15 MIN; 0:25 TOTAL
Goal: Capture initial perceptions of HEVs – issues, concerns, hopes.
SHOW OF HANDS – How many of you had heard of hybrid electric vehicles (HEVs) before you were invited to this study? FOR THOSE WHO RAISE HANDS – What do you know about HEVs?
EXPLAIN AS NEEDED – HEVs are vehicles that have both a battery-powered electric motor and a gasoline engine. There are several technologies – some can be plugged-in, some can’t.
ALL – Based on what you’ve heard through the media so far, what makes you interested in HEVs? What would you need to know before you could decide to purchase one?
COLLECT ON FLIP CHART (free-response to capture initial list of issues)
D-1

Customer Preference
�� Cost
�� Fuel efficiency, recharging
�� Performance
�� Reduced emissions – How would the environmental benefits of hybrids influence your decision?
�� Resale Value
�� Reduced dependence on foreign oil, reduced sensitivity to fuel price fluctuations – see if it comes up independently
�� Other issues
List if the topic comes up, but don’t probe. Reassure so that we don’t waste time on these topics.
�� Complexity of gasoline engine/electric motor; reliability
�� Availability of trained mechanics
�� Brand/Manufacturer
�� Body style
�� Safety
PROBE EACH ATTRIBUTE OF INTEREST – What do you expect from HEVs? What do you hope for? What minimum requirements do you have before you would purchase an HEV?
If there’s time: What image do you associate with HEVs?
SPECIFICALLY, PROBE: How do you think about cost of fuel, fuel efficiency, and vehicle cost? Why do you value fuel efficiency? Cost savings? Reduced trips to gas station? Reduced emissions? Reduced dependence on foreign oil?
3. Cost of HEVs, Gasoline, Recharging 30 MIN; 0:55 TOTAL
Goal: Capture the way respondents think about HEV costs – initial, fuel, charging, etc.
First Education Session (10 minutes) – All HEVs have the option of using gasoline for fuel. In addition, some HEV designs can be plugged-in – that is, you can recharge them using electricity. Show posters to indicate difference between HEV designs; talk through 1st Education script.
ALL – How do you think about the cost of operating HEVs?
Get initial unbiased language first, then probe.
�� Are you willing to pay more for a fuel-efficient car? Why? (Probe: is the important thing cost savings, reduced emissions, going to the gas station less often?)
D-2

Customer Preference
�� How much fuel economy improvement do you see as significant? (1, 5, 10+ mpg)?
Given what we’ve told about charging at night and trips to the gas station, which do you see as more convenient – recharging your vehicle or getting gasoline? (Can they charge at work? Yes, but wouldn’t necessarily have to – gas covers need for extra range.)
ALL – How would you think about the cost of operating an HEV that you can plug in? Probe:
�� Mile per gallon equivalent (gasoline plus electricity)
�� Cost per mile (gas + electricity)
�� Annual fuel bill (gas + electricity)
�� Gasoline cost (per refill? per month? per year?) plus increase in monthly electric bill
�� Mile per gallon plus increase in monthly electric bill
�� Mile per gallon plus kilowatt-hours per mile
Would cost influence your decision about whether or not to recharge directly? If so, how?
Do you think about total cost of ownership? Payback time for increased initial vehicle cost? (Important – see if these ideas come out naturally, or if they think about costs some other way.)
4. Alternative HEV technologies, reactions 45 MIN; 1:40 TOTAL
Goal: Show HEV alternatives (rechargeable, not rechargeable), capture reactions.
Second Education Session (10 minutes) – Now, I’d like to tell you a bit more about the two HEV technologies and the ways that they differ.
Show posters on attributes and features of two types of hybrids. Explain non-obvious benefits and features (EV-smile, quiet at stops, auto-docking, pre-trip heating/cooling/defrosting, etc.)
ALL – Now that you know a bit more, what additional questions or issues do you have?
ADD TO FLIP CHART (free-response, then probe)
�� Performance — What kind of performance is most important to you?
– Starting from a stop sign? Passing or merging on the freeway? Climbing hills?
– How important is towing capability (SUV owners)?
– How important is additional total driving range?
�� All-Electric Range – What benefits would a larger all-electric range have for you?
– How much all-electric range do you need? Are you willing to pay more for it?
D-3

Customer Preference
– Suppose you had to choose between 2 cars: one with a 20-mile all-electric range, and the other with a 60-mile all-electric range. How much more would you pay for the larger range?
– How would you use an HEV that can be recharged electrically? (Free response, then probe)
�� Recharge every night at home
�� Recharge once per week or so
�� Don’t bother to recharge; allow gas engine to charge the batteries
�� Would the availability of auto-docking change your opinion?
�� Environmental Benefits/Emissions – Would environmental benefits influence your car choice? How?
– What kinds of environmental benefits are important to you? (smog, greenhouse gases, resource conservation, local vs. distant pollution, etc.)
– Which EV type seems more environmentally friendly?
�� Other New Features – Which EV features are most appealing to you? Are you willing to pay more for these?
– VOTE: If an HEV offered only one of these features, which would you choose?
– Would the availability of these features change your likelihood of buying an HEV?
ALL – Which of these features and benefits are most important to you? IF THERE’S TIME: VOTE!
5. Acceptance 20 MIN; 2:00 TOTAL
Goal: Get an overall read on acceptance for the hybrid alternatives
WRITE ON PAD, SHOW OF HANDS – Assuming the vehicle cost is the same, if you had to choose one of these two hybrids to replace your current vehicle, which one would you choose? Why? (Capture the main differences the respondents see between the two hybrids.) What if your preferred vehicle was more expensive?
WRITE ON PAD, SHOW OF HANDS – Now, compare your favorite hybrid to a conventional vehicle. Which would you choose? Why? What if your preferred vehicle was more expensive?
GO AROUND – For those who wouldn’t choose the hybrid, what would need to change to make it more appealing? PROBE:
�� Cost (Payback expectations – 1 year, 2 years, 3 years, more). Do sensitivities/what-ifs as time allows.
�� Government incentives
D-4

Customer Preference
�� Tax credits? Reduction in sales tax/licensing fees?
�� HOV-lane access?
�� Prime parking spaces at mass-transit stations?
�� Free charging stations
NOT ENOUGH TIME, BUT INTERESTING – If government incentives were available for EVs but not for HEVs, would you consider purchasing an EV instead?
6. Wrap-up 5 MIN; 2:05 TOTAL
Thank you for participating.
D.2 HEV Interview Questions
WELCOME TO THIS MARKET RESEARCH INTERVIEW ON HYBRID ELECTRIC VEHICLES
In this interview, you will be asked questions about hybrid electric vehicles. Please take the interview at your own pace, thinking about each question carefully. Your answers will help influence the design of new vehicles.
Whenever you are ready to continue with the next screen or question, use the mouse to click on the Fwd button in the lower right hand corner of the screen, or press the Page Down key on the keyboard.
Many of the questions in this interview will be multiple choice. To answer these questions, simply use the mouse to click on the button next to the answer or press the up or down arrow key to select your choice, and then click the “Fwd” button or press the Page Down key to continue.
For example: Are you ready to continue?
1. Yes 2. No
To answer “Yes,” click on “Yes.” Then click on the “Fwd” button.
To answer “No,” click on “No.” Then click on the “Fwd” button.
If the Fwd button is not illuminated, this indicates that you have not answered the question completely.
D-5

Customer Preference
If at any point in the interview you need to review or change your previous answers, you may do so by using the Back button in the lower left hand corner of the screen, or press the Page Up key on the keyboard.
Please ask an attendant for assistance if you have any questions or problems in taking this interview.
AN OVERVIEW OF THIS INTERVIEW
The questions in this interview are divided into six parts:
Section 1. Introduction
Section 2. Refueling
Section 3. Other HEV Benefits
Section 4. HEV Technologies
Section 5. Your HEV Choices
Section 6. Influences, Attitudes and Demographics
In this study, we are interested in understanding your opinions of a new vehicle technology called a Hybrid Electric Vehicle, or HEV. HEVs are a relatively new technology that are just starting to be sold on the market today.
Before we tell you more about HEVs, we would like to learn a little about your familiarity with them. Using the scale below, please indicate how much you have heard about HEVs:
1 2 3 4 5 6 7 8 9
Absolutely no knowledge
Heard a bit about them
Expertknowledge
Where have you learned about HEVs? (Please select all that apply.)
1. Articles in newspapers or general magazines (e.g. Time, Newsweek)
2. Articles in consumer magazines (e.g. Consumer Reports)
3. Articles in specialty car magazines (e.g. Car && Driver)
4. Articles in environmental magazines/newsletters (e.g. Sierra Club)
5. Brochures from automotive manufacturers
D-6

Customer Preference
6. TV, newspaper or magazine advertisements
7. Automotive manufacturer web sites
8. Environmental web sites
9. Other
In the market today, there are two main approaches that are used to provide power to the wheels of a vehicle:
– A conventional system uses a gasoline engine to power the wheels, running on gasoline stored in a fuel tank.
– An electric system uses an electric motor to power the wheels, running on electricity stored in a battery.
An electric vehicle is different from a conventional vehicle in several ways:
– It produces no tailpipe emissions.
– You never have to go to the gas station since you “refill” the batteries by plugging in the vehicle to charge the batteries.
– Total driving range is up to 150 miles, depending on the vehicle design and your driving habits. Beyond that range, the batteries must be recharged.
Most people who own an electric vehicle today use them for commuting to work or for local trips.
Hybrid Electric Vehicles (HEVs) are designed to take advantage of the best features of both conventional and electric vehicles.
All HEVs have both a combustion engine system (gasoline engine, gas tank) and an electric motor system (electric motor, batteries).
Some hybrids are designed to run exclusively off gasoline like a conventional vehicle, using the electric system to improve fuel economy. There is no plug.
Other hybrids are designed to be plugged in like an electric vehicle, using the gasoline system to extend the vehicle range if the battery charge is low. At night, you plug in the vehicle, and in the morning, it is charged and ready to go, in “electric vehicle” mode. For longer trips (or whenever a plug isn’t available), the vehicle runs off gasoline like a gasoline-only hybrid.
Both types of hybrids are designed to have at least a 350-mile range before having to refuel, the same as in a conventional car.
D-7

Customer Preference
With any new technology like HEVs, we realize that you might have concerns about whether the technology will actually live up to its promise.
In this interview, we would like you to assume that HEVs have been out on the market for about 10 years. In particular, you can feel confident that:
– The technology is safe and reliable
– Skilled mechanics are available
– Resale value is comparable to the equivalent conventional vehicle
– Performance is comparable to the equivalent conventional vehicle
– Interior roominess and convenience/comfort features are comparable to the equivalent conventional vehicle
– HEVs are produced by many manufacturers in a wide range of styles
Now, we would like you to think about replacing your current vehicle.
Please assume that you have to replace your vehicle today, and that an HEV version of the vehicle you own is available as a replacement. Remember to assume that HEVs have been available for the last 10 years, and you can feel confident about the technology.
The HEV comes with certain features. Vehicle manufacturers, however, have a choice of how to design the vehicle, and want to know which features you value the most.
In the next section, we will present each possible HEV feature, and ask you to choose between vehicle designs with greater and lesser degrees of each feature. Please think about each question carefully, and answer as though you are spending your own money.
PRICE is the purchase or lease price that you could expect to pay for the vehicle, after any discounts or rebates you may receive.
If you were to PURCHASE your next vehicle, you would have full ownership of the vehicle.
If you were to LEASE your next vehicle, you would have to either return the vehicle to the dealer or finance the residual value of the vehicle when the lease matured (after a few years). However, the lease payments would be less than the payments for a vehicle purchase.
Do you expect to purchase or lease the vehicle you will acquire to replace your current vehicle?
1. Purchase 2. Lease 3. Not sure
D-8

Customer Preference
You can think of the purchase price of a new vehicle in terms of the total price or in terms of the monthly payments you would have to make if you took out a loan to finance the vehicle purchase.
For instance, a vehicle that cost ________ would be ________ month assuming no down payment, a 48-month loan, and a 4% interest rate.
When you purchase a new vehicle, do you plan to purchase the vehicle for cash or finance it?
1. Pay cash 2. Finance (pay monthly)
For a vehicle that cost _________, about how much would you expect to pay as a down payment?
If you were buying a vehicle that costs about _________, which of the following best represents the loan you would expect to get?
1. 3 year loan (_____/month for 36 months with ______ down) 2. 4 year loan (_____/month for 48 months with ______ down) 3. 5 year loan (_____/month for 60 months with ______ down)
If you were leasing a vehicle that cost about _______, which of the following best represents the lease you would expect to get?
1. 2 year lease (_____/month for 24 months) 2. 3 year lease (_____/month for 36 months)
FUEL COST is the total cost per month (or per year) that you spend in fueling your vehicle. For a conventional vehicle, you can think of fuel cost as the total cost of gasoline. For a hybrid vehicle, this cost includes not only gasoline, but also the cost of electricity for directly plugging in the vehicle (if desired).
In this interview, we will consider fuel cost separately from the other advantages of reduced gasoline usage (trips to the gas station and environmental benefits).
Please assume that vehicles can be designed with higher or lower fuel cost without necessarily changing trips to the gas station or pollution levels. For example, fuel costs depend on the price of gasoline and electricity, which may change over the next 10 years. The US Department of Energy is currently predicting modest increases in gasoline prices, with occasional fluctuations, and small, fairly stable decreases for electricity prices.
D-9

Customer Preference
Remember, our goal in this section of the interview is to understand which features you value the most.
In order to compute your current fuel costs, we must ask you a few questions about yourself and your driving patterns.
Are you male or female?
1. Male 2. Female
On the next few screens, we will be asking several questions about how you drive your vehicle. When we are done, we hope to have a good understanding of all the miles driven in your vehicle, so please answer all questions as they apply to this vehicle.
In a typical workweek, how many days does someone commute to work in your vehicle? ________ days/week
(NOTE: You may enter a decimal value.)
What is the driving distance from home to work for your vehicle? _________ miles
– If no one commutes to work in your vehicle, please enter “0”.
– If someone else commutes regularly in your vehicle, please enter the miles that the other driver commutes to work in this vehicle.
– If you carpool to work in your vehicle, please enter the total one-way distance you drive in your vehicle between home and work (on days when your carpool rides in this vehicle).
– If you use alternative transportation on some days, but commute in your vehicle on other days, please enter the one-way driving distance from home to work (for the days that you drive).
About what percentage of those miles are on surface streets (not on the freeway)? _________ %
D-10

Customer Preference
For the part of your vehicle's daily miles that are on the freeway, about what percentage of the time are you typically slowed by traffic congestion? (moving at less than 50 mph)? _________ %
How many long driving trips does your vehicle make per year? _________ trips/year
NOTE: For the purposes of this interview, a “long driving trip” is a trip with a round-trip distance of over 60 miles that is not part of your regular weekly work/errand driving.
On average, what is the distance traveled in your vehicle's long driving trips? _________ miles (round trip)
What is your vehicle's annual mileage? __________ miles/year
How much do you typically pay for gasoline for your vehicle? __________ per gallon
Would you rather think about fuel cost in terms of:
1. Monthly cost 2. Annual cost
Based on your answers, we estimate that you currently spend _______/month (___________/year) on gasoline.
Does that seem about right?
1. Yes 2. No
On average, how much do you pay for a refill? (enter dollar amount)
Note: You may enter a decimal number.
D-11

Customer Preference
On average, how many refills do you get per month? (enter number of refills per month)
Note: You may enter a decimal number.
Based on your answers, we estimate that you currently spend ________/month (________/year) on gasoline.
Does that seem about right?
1. Yes 2. No
Based on your driving patterns, in this interview, we will consider the following levels of fuel cost:
Fuel costs _______ (about 15% more than your current costs) Fuel costs _______ (about 30% less than your current costs) Fuel costs _______ (about 90% less than your current costs)
The next screen will present two vehicle options that differ only in price and fuel cost. Please indicate which vehicle you prefer, assuming that everything else about the vehicles is exactly the same.
Remember to assume that you are choosing a vehicle to replace your current vehicle today, and to choose as if you are spending your own money.
Our goal in this section of the interview is to understand which features you value the most, so that manufacturers can produce the vehicles that you and other customers prefer.
TRIPS TO THE GAS STATION refers to how often you need to get gasoline for your vehicle. Both conventional vehicles and HEVs require gasoline, but HEVs require less.
When you consider this attribute, please think about all the advantages that making fewer trips to the gas station would have for you. For example, some people value convenience, others like avoiding fumes and spillage, others like the comfort of avoiding any personal security issues at gas stations.
In this interview, we will consider trips to the gas station separately from the other advantages of reduced gasoline usage (reduced fuel cost and reduced tailpipe emissions).
D-12

Customer Preference
Please assume that vehicles can be designed to reduce trips to the gas station without necessarily reducing fuel cost or tailpipe emissions. For example, one way to reduce trips to the gas station would be to increase the fuel tank size.
Remember, our goal in this section of the interview is to understand which features you value the most.
In this interview, we will consider the following levels of trips to the gas station:
Get gasoline once (or twice, etc) per week Get gasoline once (or twice, etc) per month Get gasoline once (or twice, etc) per year
ENVIRONMENTAL BENEFITS refer to the way that HEVs benefit the environment, through reducing tailpipe emissions, vapor emissions, and global warming gases.
Tailpipe and vapor emissions are an important component of urban smog. Government standards demand very low emissions even for conventional vehicles, and 10 years from now, we anticipate that new conventional vehicles will be significantly cleaner than the average conventional vehicle today.
Even with the new government standards, however, HEVs can provide anywhere from a little to a lot of additional benefit. Some HEVs can run with their gasoline engine shut off for some or all of their daily miles, acting as a “zero-emission vehicle” (ZEV). Within their daily ZEV range, these HEVs produce no tailpipe and vapor emissions.
Taking into account all the factors that contribute to smog (including “elsewhere emissions,” such as those at gasoline refineries and power plants), HEVs will reduce smog emissions up to 90% from the new very low standards.
An additional environmental issue that some people are concerned about is global warming.
Currently, vehicles are responsible for 20% of the global production of energy-related carbon emissions, including carbon dioxide. Carbon dioxide is a "greenhouse gas" that is present in the atmosphere anyway, but imbalances, such as those caused by the use of fossil fuels, are believed to have an effect on the global climate. Some places are getting hotter and drier, others cooler and wetter, others suffering more extremes.
Thinking about the environmental issues that are of concern to you, which of the following alternatives would you prefer for your next vehicle?
1. 30% lower smog emissions, no reduction in global warming gases
2. 25% lower smog emissions, 5% less global warming gases
D-13

Customer Preference
3. 20% lower smog emissions, 10% less global warming gases
4. 15% lower smog emissions, 15% less global warming gases
5. 10% lower smog emissions, 20% less global warming gases
6. 5% lower smog emissions, 25% less global warming gases
7. No reduction in smog emissions, 30% less global warming gases
In this interview we will be considering environmental benefits separately from the other advantages of reduced gasoline usage (reduced fuel cost and reduced trips to the gas station).
Please assume that vehicles can be designed to reduce emissions and global warming gases without necessarily reducing fuel cost or trips to the gas station. For example, better tailpipe cleaning systems could be designed to capture both smog and global warming gases.
Remember, our goal in this section of the interview is to understand which features you value the most.
In this interview, we will consider the following levels of environmental benefits:
0% lower smog emissions, no reduction in global warming gases
30% lower smog emissions, 30% less global warming gases
90% lower smog emissions, 90% less global warming gases
The next questions will ask you to trade off different combinations of vehicle fuel cost, trips to the gas station, and environmental benefits.
Please assume the vehicles are identical except for the differences stated. In particular, please assume that the vehicles have the same price.
Please feel free to refer to the Attribute Definition Sheet to refresh your memory about the features at any time.
Thank you.
For the remainder of the interview, we will consider the overall reduction in gasoline use as a single attribute: reducing total fuel cost, trips to the gas station, and the production of tailpipe emissions and global warming gases. Lower gas usage also has the benefit of reducing U.S. dependence on foreign oil.
We will consider the following levels of gasoline use:
D-14

Customer Preference
– Conventional gasoline use: fuel costs $/month (or year), get gasoline (number of times), 0% lower smog/global warming
– Reduced gasoline use: fuel costs $/month (or year), get gasoline (number of times), 30% lower smog/global warming
– Low gasoline use: fuel costs $/month (or year), get gasoline (number of times), 60% lower smog/global warming
– Lowest gasoline use: fuel costs $/month (or year), get gasoline (number of times), 90% lower smog/global warming
In the next section of the interview, we will introduce some additional features of HEVs, and ask you to answer trade-off questions like those you just completed.
Please feel free to refer to the Attribute Definition Sheet if you have questions about any of the attributes at any point. Or ask an attendant for assistance if you have any trouble.
MAINTENANCE COSTS refer to the costs of the scheduled and unscheduled maintenance required to keep your vehicle in good operating condition.
Although electric motors have only been used for powering full-size vehicles for the last five to ten years, in other applications electric motors have proven to be very reliable, requiring no maintenance for periods of up to twenty years. In the last ten years, electric vehicles (HEVs) have been shown to need little maintenance, confirming this experience.
Conventional vehicles, of course, require regular oil changes and tune-ups, and other scheduled and unscheduled maintenance.
Reducing maintenance also means that you will spend less time getting your vehicle serviced.
The maintenance costs for HEVs are predicted to lie somewhere between those for an HEV and those for a conventional vehicle. Although HEVs have both a conventional engine and an electric motor, each system is used less than it would be in a pure conventional or electric vehicle, resulting in less overall wear and tear on each system.
In this interview, we will consider the following levels of maintenance costs:
Maintenance costs _____ per year Maintenance costs _____ per year
D-15

Customer Preference
BATTERY LIFE refers to the useful life of the battery that provides the energy for powering the electric drive motor.
HEVs use a superior battery technology that can be charged and discharged thousands of times before the battery capacity/peak power output begins to degrade. The batteries can also take a partial charge with no difficulty. At the end of the battery life, the battery can be sold for use in less demanding applications, or recycled almost completely and turned into a new battery.
In this interview, we will consider the following levels of battery life:
Battery should be replaced at 5 years/50K miles; Costs $_____ Battery lasts the life of the vehicle (10 yrs/100K miles)
COMFORT/CONVENIENCE FEATURES refers to having extra power available for running comfort/convenience options even when the gasoline engine is off.
In some HEVs, the large battery can be used to pre-heat or pre-cool your vehicle before you start the engine. Using a remote or timer, you can turn on the climate control systems in advance, so that your car can be at a comfortable temperature when you enter it. In addition, the large battery can keep the car at a comfortable temperature without running the engine if you want to sit in it while parked. Vehicles with a smaller battery can still provide this pre-heat/pre-cool feature, but must start the engine first.
In addition, some HEVs will include a 110V plug that will allow you to use electrical appliances in your vehicle when the engine is off. Within town, the vehicle could be used to run a small refrigerator, a toaster oven, a TV, a computer, or anything you desire. This capability might be useful when you're sitting in or near your vehicle for a while for any reason (when another person is running into a store, when you're hosting a tailgate party, etc.)
A handyman might use this capability to power tools at a work site.
Far from home, even a large battery will have less power available, but can still be used for running small appliances such as a coffee maker, toaster, cell-phone or digital camera battery re-charger, etc. This capability might be useful when you are away from conventional power sources but still want to have some of the comforts of home.
Please think about the way you might use pre-heat/pre-cool, climate control systems, and a 110V plug in your vehicle.
On the next two screens, we would like you indicate how likely you would be to choose to purchase a pre-heat/pre-cool system or 110V plug as an option with the vehicle you acquire to replace your vehicle:
– Rate once assuming that the system runs only with the gasoline engine on (cannot run when the gasoline engine is off)
D-16

Customer Preference
– Rate again assuming that the system can run off battery alone (can run when the gasoline engine is off)
Use the scale below to indicate how likely you would be to select each optional feature at the listed price.
1 2 3 4 5 6 7 8 9
Definitely would not purchase
Might purchase
Definitelywould
purchase
Based on your responses, we have selected a set of options that you might select with the vehicle you acquire to replace your vehicle.
In both cases, these extra features carry an additional price that adds to the base price of the vehicle.
In this interview, we will consider the following levels of extra features:
– Includes your choices for pre-heat/cool and 110V plug Can run with gas engine off
– Includes your choices for pre-heat/cool and 110V plug Can run with gas engine off
ELECTRICAL UPGRADE COST refers to the cost of upgrading the electrical system near the place you park your vehicle, so that you could charge an HEV there.
HEVs can be designed so that they do not need to be plugged in at all. For these HEVs, you can park anywhere, and there is no need to upgrade your electrical system.
Even for HEVs that can be plugged in, you do not always need to have access to a plug. When charging the battery directly is inconvenient, these HEVs run just like the other HEVs, using surplus power from the gasoline engine to charge the battery, so the electric motor has a continuous supply of power.
For HEVs that are designed to be plugged in, however, you will only get the full benefits if you plan to charge the vehicle every night that you're at home. Depending on the HEV design and your parking situation, you may have to upgrade your electrical system to make charging your vehicle feasible.
D-17

Customer Preference
In order to estimate the costs for upgrading the electrical system where you park, we need to understand your current living situation, and how easy it would be for you to upgrade the electrical system near the place you park your vehicle.
Which of the following best describes your residence?
1. Rent an apartment, condo or townhouse 2. Rent a house 3. Own a condo or townhouse 4. Own a house 5. Other
Where do you typically park each night when you're at home?
1. On the street (various places) 2. On the street in a consistent space (same space ~6 nights a week) 3. In an outdoor parking lot (various places) 4. In a consistent outdoor parking space (e.g. an assigned space in a lot or a driveway) 5. In a parking space in an enclosed parking lot (various places) 6. In a consistent enclosed parking space (e.g. an assigned parking space in a garage or
carport, or a garage in a house) 7. Other
Even if you rent, please assume that it will be feasible for you to upgrade the electrical systems near the place that you park your vehicle, so that you could charge an HEV directly. The cost of this upgrade will depend on the design of the HEV.
In this interview, we will consider the following levels of electrical upgrade:
– Significant electrical upgrade required (costs $1000)
– Minimal electrical upgrade required (costs $150)
– No electrical upgrade required (costs $0)
TECHNOLOGY refers to the technology that an HEV uses to achieve the benefits discussed earlier. In this interview, we will consider two fundamental designs:
– HYBRID X (Gasoline-only hybrid) Conventional system with a supplemental electric system to improve fuel economy, especially in city driving and stop-and-go traffic
– HYBRID Y (Dual fuel hybrid) Electric system with a supplemental gasoline system, to capture all the benefits of an
D-18
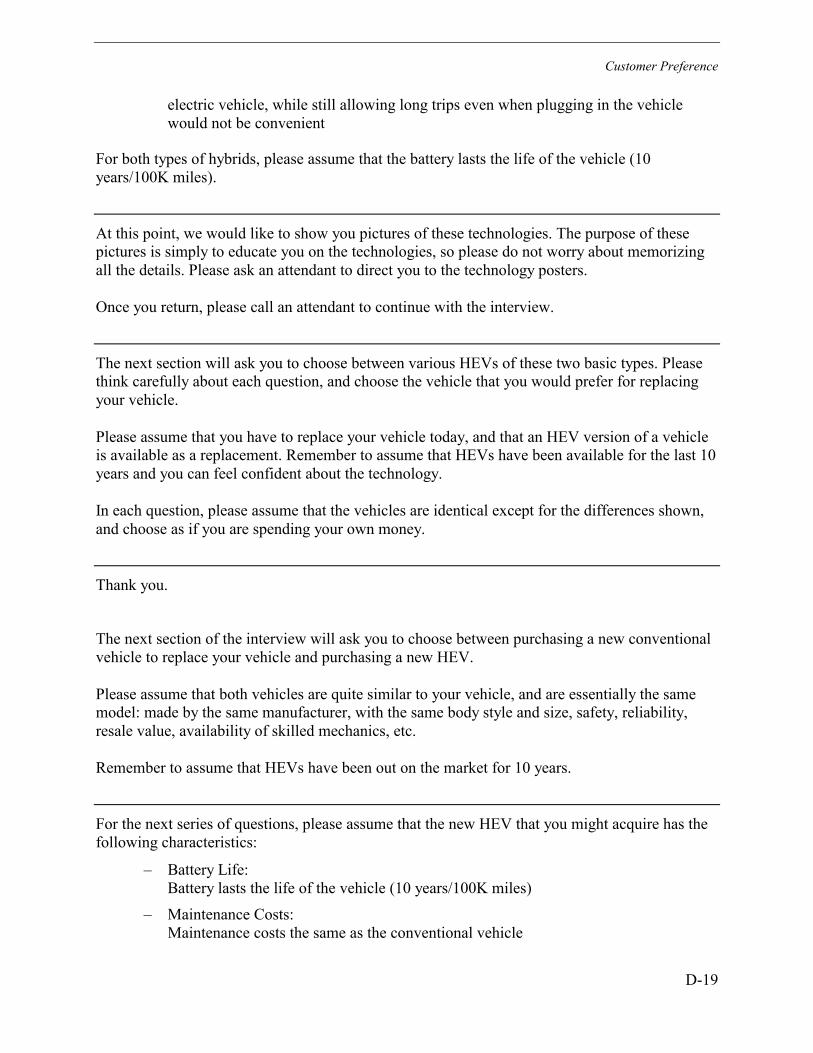
Customer Preference
electric vehicle, while still allowing long trips even when plugging in the vehicle would not be convenient
For both types of hybrids, please assume that the battery lasts the life of the vehicle (10 years/100K miles).
At this point, we would like to show you pictures of these technologies. The purpose of these pictures is simply to educate you on the technologies, so please do not worry about memorizing all the details. Please ask an attendant to direct you to the technology posters.
Once you return, please call an attendant to continue with the interview.
The next section will ask you to choose between various HEVs of these two basic types. Please think carefully about each question, and choose the vehicle that you would prefer for replacing your vehicle.
Please assume that you have to replace your vehicle today, and that an HEV version of a vehicle is available as a replacement. Remember to assume that HEVs have been available for the last 10 years and you can feel confident about the technology.
In each question, please assume that the vehicles are identical except for the differences shown, and choose as if you are spending your own money.
Thank you.
The next section of the interview will ask you to choose between purchasing a new conventional vehicle to replace your vehicle and purchasing a new HEV.
Please assume that both vehicles are quite similar to your vehicle, and are essentially the same model: made by the same manufacturer, with the same body style and size, safety, reliability, resale value, availability of skilled mechanics, etc.
Remember to assume that HEVs have been out on the market for 10 years.
For the next series of questions, please assume that the new HEV that you might acquire has the following characteristics:
– Battery Life: Battery lasts the life of the vehicle (10 years/100K miles)
– Maintenance Costs: Maintenance costs the same as the conventional vehicle
D-19

Customer Preference
– Performance: Comparable to a conventional vehicle, with slightly improved overall 0-30 and 0-60 mph acceleration. HEVs produce their maximum horsepower and torque below 1000 rpm, giving a peppy feel.
Please refer to the Attribute Definition Sheet and HEV FAQ Sheet if you have any questions about these assumptions, and page back to refresh your memory as needed as you answer the following questions.
Feel free to ask an attendant for assistance at any time.
GOVERNMENT INCENTIVES refer to the various policies that governmental regulatory agencies might implement to encourage the purchase of vehicles that provide benefits to the environment.
On the next screen, we will present a list of governmental incentives that might be available for HEVs. Please think carefully about each possible incentive, and rate the incentives to indicate how much influence each would have on your purchase decision.
Please rate the following government incentives using the scale below.
When you consider free charging, please assume that you would still pay for parking if you pay for parking today. If free charging is not available, please assume that you would charge your vehicle at home at night.
1 2 3 4 5 6 7 8 9
No influence on my decision
Strong influenceon my decision
Carpool (HOV) lane access (legal use with 1 person in vehicle) ___
Free, reserved parking at work ___
Free, reserved parking at train stations ___
Free, reserved parking at the mall ___
Free charging at work ___
Free charging at train stations ___
Free charging at the mall ___
D-20

Customer Preference
Based on your responses, in this interview, we will consider the following levels of government incentives:
Favorite 2 incentives No incentives
The next questions will ask you to choose between purchasing a conventional vehicle and purchasing an HEV with government incentives.
As in the previous questions, please assume that the new HEV that you might acquire has the following characteristics:
– Battery Life: Battery lasts the life of the vehicle (10 years/100K miles)
– Maintenance Costs: Maintenance costs the same as the conventional vehicle
– Performance: Comparable to a conventional vehicle, with slightly improved overall 0-30 and 0-60 mph acceleration. HEVs produce their maximum horsepower and torque below 1000 rpm, giving a peppy feel.
Please refer to the Attribute Definition Sheet and HEV FAQ Sheet as needed, and feel free to ask an attendant for assistance at any time.
The previous questions have presented most of the “quantifiable” benefits of HEVs. However, there are a number of qualitative benefits that only become apparent when customers get to drive an HEV.
Here's what people are saying:
“I love this car! I can’t believe how quiet and smooth it is, and how I leave everyone behind when I start from a stoplight. And the handling is fabulous.”
“The HEV was so popular that I had to wait 2 months before I got mine, but it was worth it. It’s like getting over 100 MPG, paying only 30 cents per gallon for electricity. Of course, I plug in each night to get all the benefits.”
“$2 a gallon gas prices! Outrageous! With my HEV, I don't have to worry.”
“I hate the fumes and security issues at gas stations. With my HEV, I go once a year. I also save time with carpool lane access and fewer oil changes.”
D-21

Customer Preference
The next series of questions will ask you to choose again between a conventional vehicle and an HEV, taking these benefits into account.
Thank you. You have finished the trade-off section of the interview.
In the next section, we will ask you some additional questions about your attitudes and values when you purchase a vehicle.
Please think about the influence that each factor would have on your purchasing decision, and rate the factors according to the scale:
1 2 3 4 5 6 7 8 9
No influence on my decision
Strong influenceon my decision
Fuel cost savings ___
50% longer fuel range ___
Avoiding exposure to fumes/spills at gas stations ___
Avoiding personal security issues at gas stations ___
Reducing air pollution and global warming gases ___
Reducing dependence on foreign oil ___
Leaving every morning with a fully-charged battery ___
Carpool lane access ___
Tax breaks ___ Price ___ 1 2 3 4 5 6 7 8 9
No influence on my decision
Strong influenceon my decision
Improved 0-30 and 0-60 mph acceleration ___
Less vibration/fatigue (at stops and acceleration) ___
Quietness (at stops and acceleration) ___
Better handling: lower center of gravity ___
Better handling: balanced weight distribution ___
Reducing maintenance (cost and personal time) ___
Pre-heat/pre-cool with engine off ___
D-22

Customer Preference
Using 110V plug to run electric items with engine off ___
Attention/pioneer image/prestige ___
Thank you.
The next set of questions will ask you to indicate your preferences between several vehicle options.
Please think about your preferences in each case, and choose the point on the scale that best reflects your attitudes.
1 2 3 4 5 6 7 8 9
Strongly Prefer left
StronglyPrefer right
Which vehicle would you buy to replace your vehicle?
Biggest vehicle available Smallest vehicle available
Traditional styling Futuristic styling
Designed with emphasis on Designed with emphasis on practicality and affordability luxury and prestige
Greater performance, Greater fuel economy, less fuel economy less performance
1 2 3 4 5 6 7 8 9Strongly Prefer left
StronglyPrefer right
Which statement do you agree with more?
I want to be among the I want to buy first to own a new design a proven vehicle
I check out consumer I normally guides and magazines buy a vehicle before I buy a vehicle on impulse
D-23

Customer Preference
D-24
I would prefer to fuel I would prefer to fuel my vehicle with gas my vehicle by plugging at the gas station it in at home
Thank you.
The next set of questions will present a number of statements that may or may not reflect your attitudes. You will be asked how strongly you agree or disagree with each statement.
Please think about your preferences in each case, and enter the rating that best reflects your attitudes according to the scale:
1 2 3 4 5
Strongly Strongly
disagree agree
I like being the first to use new innovative products or services. ___
I'm willing to pay more for the latest technology. ___
Today's technology is too hard for me to use. ___
I don't trust information on the Internet. ___
I frequently access the World Wide Web. ___
I prefer to learn on my own instead of having someone explain things. ___
I like to help people by providing them with information about products. ___
I think change is healthy. ___
I like to see what others think of a product before I buy it. ___
1 2 3 4 5
Strongly Strongly disagree agree
I often get irritated by things that are inconvenient. ___
If a company gives me good service, I try hard to give them more business. ___
I have less time than money. ___
I need to simplify my life. ___
My family is by far the most important thing in my life. ___
I put a lot of time and energy into my career. ___
Having fun is the whole point of life. ___
I enjoy belonging to elite or exclusive clubs and organizations. ___
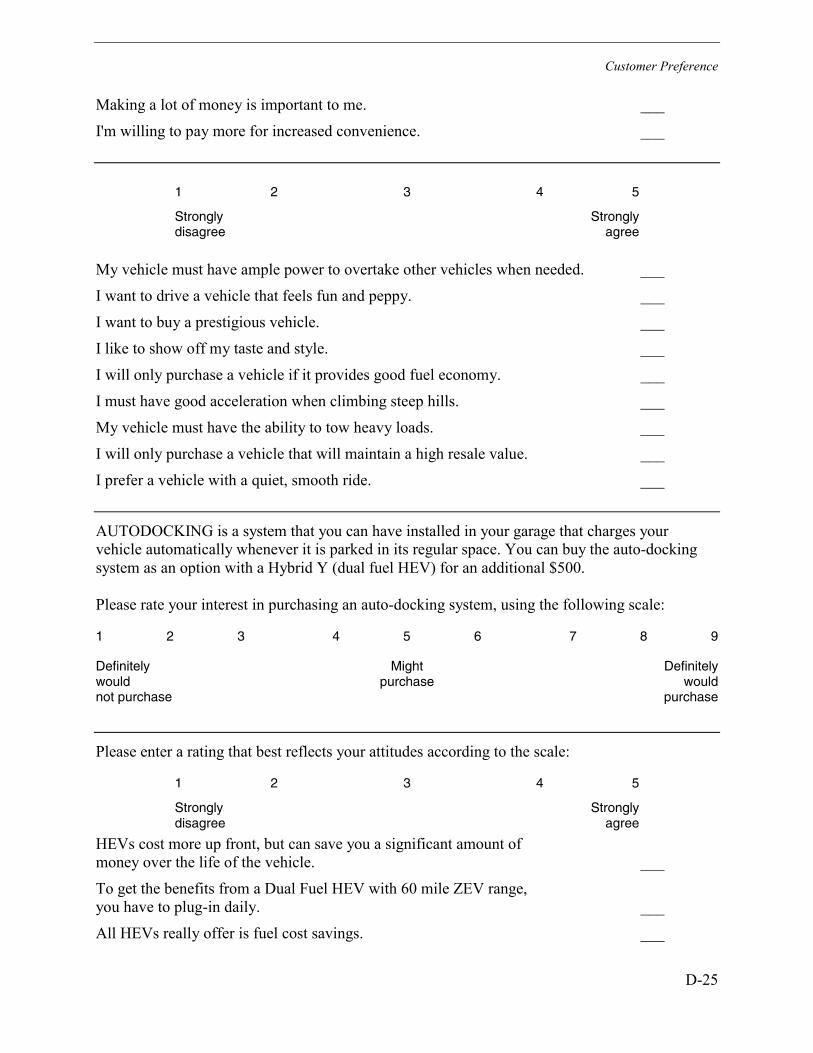
Customer Preference
D-25
Making a lot of money is important to me. ___
I'm willing to pay more for increased convenience. ___
1 2 3 4 5
Strongly Strongly disagree agree
My vehicle must have ample power to overtake other vehicles when needed. ___
I want to drive a vehicle that feels fun and peppy. ___
I want to buy a prestigious vehicle. ___
I like to show off my taste and style. ___
I will only purchase a vehicle if it provides good fuel economy. ___
I must have good acceleration when climbing steep hills. ___
My vehicle must have the ability to tow heavy loads. ___
I will only purchase a vehicle that will maintain a high resale value. ___
I prefer a vehicle with a quiet, smooth ride. ___
AUTODOCKING is a system that you can have installed in your garage that charges your vehicle automatically whenever it is parked in its regular space. You can buy the auto-docking system as an option with a Hybrid Y (dual fuel HEV) for an additional $500.
Please rate your interest in purchasing an auto-docking system, using the following scale:
1 2 3 4 5 6 7 8 9
Definitely would not purchase
Might purchase
Definitely would
purchase
Please enter a rating that best reflects your attitudes according to the scale:
1 2 3 4 5
Strongly Strongly disagree agree
HEVs cost more up front, but can save you a significant amount of money over the life of the vehicle. ___
To get the benefits from a Dual Fuel HEV with 60 mile ZEV range, you have to plug-in daily. ___
All HEVs really offer is fuel cost savings. ___

Customer Preference
You save significantly on fuel with a Dual Fuel HEV, since electricity costs a lot less than gasoline. ___
Dual Fuel HEVs are not really that good for the environment, since 60 miles per day ZEV is not enough. ___
A Dual Fuel HEV runs just like a gasoline-only HEV when it is not running in EV mode. ___
Thank you. You are nearly done with this interview.
The final set of questions will ask you for some general demographic information. These answers will be used for statistical purposes only.
What is your marital status?
1. Single (divorced, widowed, or never married) 2. Married (married or living together)
Including yourself, how many people are now living in your household? Please enter zero to indicate there is no one in a certain age group.
Adults ___
Children under 2 years old ___
Children 2-5 years old ___
Children 6-17 years old ___
Children 18 years old or older ___
What is the highest level of education that you have completed?
1. Some high school 2. High school graduate 3. Technical/Vocational school 4. Some College 5. College Graduate 6. Post-graduate work 7. Post-graduate degree
Which ethnic group do you consider yourself a member of?
1. Asian/Pacific Islander
D-26

Customer Preference
2. African (Black) 3. Caucasian (White) 4. Hispanic 5. Native American 6. Other
Are you retired?
1. Yes 2. No
Which of the following classifications best describes your current occupation?
(If retired, please indicate your most recent occupation.)
1. Professional (e.g. law, accounting, consulting) 2. Upper management / executive 3. Administrative / clerical worker 4. Engineering / technical 5. Marketing / sales (e.g. insurance, realtor, retail sales, stockbroker) 6. Skilled craft or trade (e.g. nursing, artistic crafts, etc.) 7. Laborer (farmer, machine operator, etc) 8. Student 9. Homemaker 10. Other
What model year is your current vehicle?
1. 2000 2. 1999 3. 1998 4. 1997 5. 1996 or earlier
Did you purchase or lease your current vehicle?
1. Purchase 2. Lease
D-27
Customer Preference
At what vehicle age/mileage do you plan to replace your vehicle?
_______ years old _______ miles
Where do you typically get information when you are shopping for a new vehicle? (Please select all that apply.)
1. Articles in newspapers or general magazines (e.g. Time, Newsweek) 2. Articles in consumer magazines (e.g. Consumer Reports) 3. Articles in specialty car magazines (e.g. Car && Driver) 4. Articles in environmental magazines/newsletters (e.g. Sierra Club) 5. Brochures from automotive manufacturers 6. TV advertisements 7. Automotive manufacturer web sites 8. Independent web sites 9. Other
Considering all sources of income (such as wages, salaries, dividends, and other compensation), what is your total family household income before taxes?
1. Under $20,000 2. $20,000 $29,999 3. $30,000 $39,999 4. $40,000 $49,999 5. $50,000 $59,999 6. $60,000 $69,999 7. $70,000 $79,999 8. $80,000 $89,999 9. $90,000 $99,999 10. $100,000 $124,999 11. $125,000 $149,999 12. $150,000 $174,999 13. $175,000 or more
For statistical purposes, please enter your age:
________
D-28

Customer Preference
THANK YOU FOR PARTICIPATING IN THIS STUDY!
Your answers will be very valuable in determining the design of vehicles sold in the future.
You are finished with this interview. Please call an attendant at this time.
D.3 HEV Frequently Asked Questions
�� Will HEVs really work?
With any new technology like HEVs, we realize that you might have concerns about whether the technology will actually live up to its promise.
In this interview, we would like you to assume that HEVs have been out on the market for about 10 years. In particular, you can feel confident that:
– The technology is safe and reliable
– Skilled mechanics are available
– Resale value is comparable to the equivalent conventional vehicle
– Performance is comparable to the equivalent conventional vehicle
– Interior roominess and convenience/comfort features are comparable to the equivalent conventional vehicle
– HEVs are produced by many manufacturers in a wide range of styles
�� Can I buy an HEV in any body style I want?
Yes, please assume that HEVs are quite similar to your current vehicle – essentially the same model. Assume you can buy an HEV made by the same manufacturer, with the same body style and size.
�� How long have HEVs been out? Can I really get one today?
For this interview, we would like you to assume that HEVs have been out for 10 years. The question we are really trying to answer is “if you had to replace your current vehicle today, and you had a choice of an HEV that was just like it, would you purchase one?” Assume that you are spending money today, and choose as though you are spending your own money.
�� Do HEVs really handle the same as conventional vehicles?
HEVs will be quite similar to conventional vehicles. In fact, since designers have a choice of where to put the batteries and other power train components, the handling could even be better.
�� Do HEVs really perform the same as conventional vehicles? Can I tow my boat to the mountains?
D-29

Customer Preference
HEVs are being designed so that they have comparable performance to conventional cars in the most demanding performance environments, including hill-climbing, towing, carrying large payloads, and accelerating at high speeds. This design gives HEVs a performance advantage at low speeds, giving a “peppy” feel.
�� What is “ZEV range”?
ZEV (zero-emissions vehicle) range is the distance the vehicle can travel with the gasoline engine completely shut off (before the engine turns on). While operating in the ZEV range, the vehicle produces no tailpipe emissions.
�� What is a “Dual Fuel HEV”?
A Dual Fuel HEV is an HEV that you can plug-in, to fuel the vehicle with electricity directly. (Gasoline-only HEVs use only gasoline as a fuel, and do not plug-in to charge the battery directly.) Even with a dual fuel HEV, though, it is important to have some gas in your gas-tank to provide additional range beyond the vehicle’s ZEV range.
�� What do you mean by “elsewhere emissions”?
“Elsewhere emissions” refers to the emissions that are produced in creating the fuel that your vehicle uses. “Tailpipe” and “vapor” emissions are the emissions that are produced by your vehicle directly. Taking into account all the factors that contribute to smog (including elsewhere emissions) HEVs will reduce smog emissions up to 90% from the new very low standards. Please look at the “Environmental Comparison” for a picture of this reduction.
�� Could a battery in an HEV have “memory” problems?
No, the batteries are NiMH, and do not suffer the “memory” problems that you may have experienced with your cell phone (NiCad batteries). To get optimum battery and vehicle performance in a Dual Fuel HEV, just plug in the vehicle each night and leave it plugged in until you leave in the morning.
�� What kind of warranty will HEVs have?
Assume that the HEV warranty will be similar to the one you have for your current vehicle. The warranty covers all parts of the vehicle, including the battery, electric motor, engine, etc.
�� Will HEVs be safe?
HEVs are just as safe as conventional vehicles. Remember to assume that HEVs have been out on the market for 10 years, so you can feel confident about safety.
D.4 HEV Education Slides
The following slides were used during the Focus Groups and Interviews to inform the participants about HEVs.
D-30
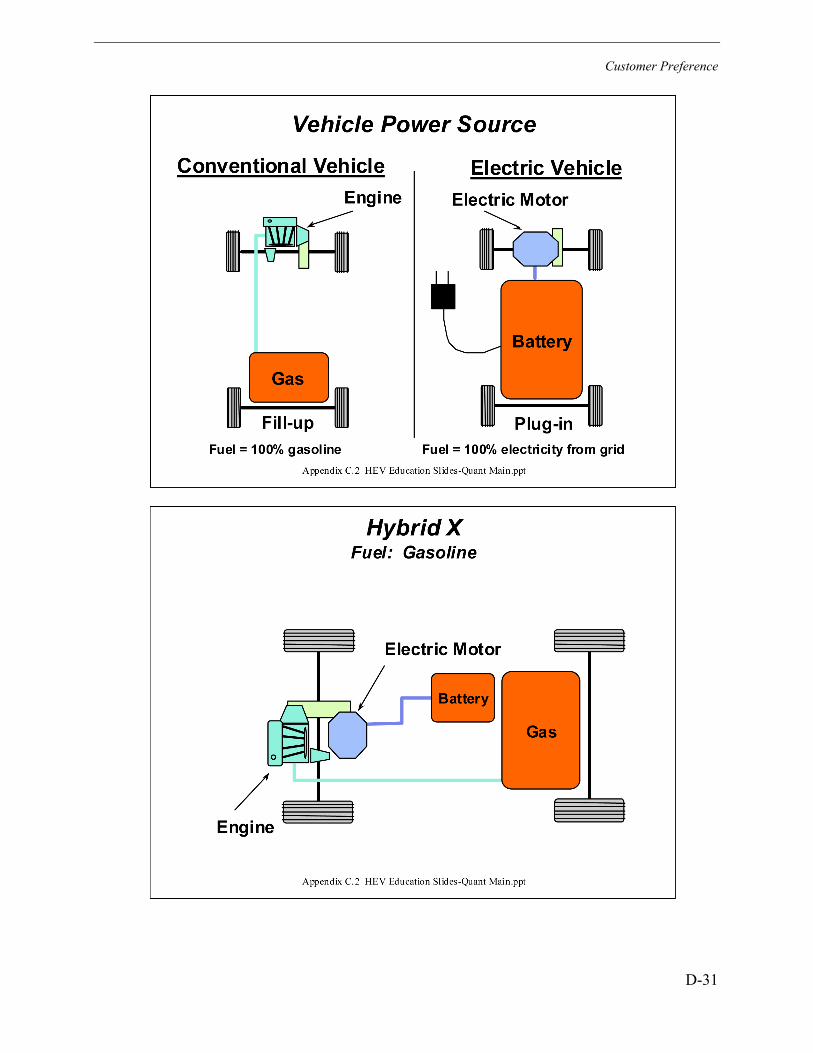
Customer Preference
D-31

Customer Preference
D-32

Customer Preference
D-33

Customer Preference
D-34
D.5 HEV Screener Quantification Document
SCREENER – CENTRAL SITE INTERVIEWS
Hybrid Electric Vehicles June – July, 2000
CONTACT A HOUSEHOLD DECISION MAKER FROM LIST OF PEOPLE WITH APPROPRIATE VEHICLES. ASK TO SPEAK TO THE PRIMARY DRIVER OF THE VEHICLE ON THE LIST.
Hello. This is __________________ from ___________, an independent market research company. We are conducting a research study on hybrid electric vehicles, that is, vehicles that have both a battery-powered electric motor and a gasoline engine. I assure you that absolutely no sales effort is involved.
IF THE PERSON IS UNCOOPERATIVE OR WANTS MORE INFORMATION:
This study is being conducted for research purposes only, and at no time will anyone attempt to sell you anything as a result of your participation. At past studies, participants have found the opportunity to express their opinions on new products to be an interesting and informative experience.
1a. To begin, we’d like to ask you about your current primary vehicle. What make and model of vehicle do you drive most often?
Vehicle Make & Model: _________________________________________
(ENTER VEHICLE –MATCH WITH LIST)
(Check if vehicle is on list on page 4. If yes, enter category, else terminate. DO NOT ACCEPT VEHICLES/DRIVERS UNLESS THE VEHICLE THAT THE DRIVER DRIVES MOST OFTEN IS A VEHICLE OF THE APPROPRIATE TYPE.)
� Yes – ENTER VEHICLE CATEGORY – SEE LIST ON PAGE 4: � Compact – CONTINUE � Midsize – CONTINUE � SUV – CONTINUE � Luxury – CONTINUE
� No – THANK, TERMINATE AND TALLY
GOAL: 25 RESPONDENTS OF EACH TYPE IN EACH CITY.
1b. What is the model year of this vehicle? ____________
TERMINATE IF OLDER THAN 1996.

Customer Preference
D-35
1c. If you had to replace this vehicle today, would you consider purchasing a _______ again? (FILL IN “compact car”, “midsize car”, “SUV” or “luxury car” USING TO CURRENT VEHICLE TYPE)
� Yes – CONTINUE � No – THANK, TERMINATE AND TALLY
1d. Did you purchase this vehicle new?
� Yes – CONTINUE � No – THANK, TERMINATE AND TALLY
2. Into which of the following age groups do you fall?
� Under 18 – THANK, TERMINATE AND TALLY � 18-35 – CONTINUE � 36-50 – CONTINUE � 51 and over – CONTINUE
GOAL: GET A MIX, BEING SURE TO INCLUDE SOME YOUNGER DRIVERS.
3. Do you work for any of the following types of companies?
�� an organization that manufactures, sells, distributes, or repairs automobiles?
�� a market research firm, an advertising agency, or a public relations firm?
�� a publication that covers the automotive industry?
�� an organization involved in automobile industry regulation?
� Yes – THANK, TERMINATE AND TALLY � No – CONTINUE
4. Have you participated in a market research study of any type within the last 6 months?
� Yes – THANK, TERMINATE AND TALLY � No – CONTINUE
5. A Hybrid Electric Vehicle (HEV) is a vehicle that has both a battery-powered electric motor and a gasoline engine. There are many possible ways to design these vehicles, with differing results in cost, fuel economy, environmental benefit and vehicle performance.
All HEV designs can run on gasoline alone when you’re on a long trip or don’t have access to an electrical outlet. But to get the most fuel cost savings and environmental benefit, some designs need to be plugged-in to recharge the batteries overnight whenever you’re at home at night.
Please think about your current living situation and whether or not you would be able to park at night within 25 feet of an electrical outlet. Most people can park within 25 feet

Customer Preference
D-36
of an electrical outlet if they park in the same parking space every night (for example a garage, a driveway, or an assigned space in an apartment complex). If you don’t have a plug near your parking space right now, assume that you can have one installed if there is an electric circuit nearby: for example, electric lights above or near the parking space.
IF THE RESPONDENT ASKS ABOUT COSTS OF INSTALLING A CIRCUIT, SAY “It would be a few hundred dollars, assuming that there’s an electric circuit nearby.”
Do you think you would be able to park within 25 feet of an electrical outlet?
� Yes – CONTINUE � No – THANK, TERMINATE AND TALLY
NOTE: THIS TALLY WILL BE USED IN THE STUDY AND IS EXTREMELY IMPORTANT!
6. On a typical weekday, how many miles do you drive?
� 10 miles or less – CONTINUE � 11 to 20 miles – CONTINUE| � 21 to 30 miles – CONTINUE � 31 to 40 miles – CONTINUE � 41 to 50 miles – CONTINUE � More than 50 miles – CONTINUE
GOAL: GET A MIX.
7. Roughly what percentage of your miles are driven on the freeway at 50 mph or more?
� 25% or less – CONTINUE � 26% to 50% – CONTINUE � 51% to 75% – CONTINUE � More than 75% – CONTINUE
GOAL: GET A MIX.
8. IF QUALIFIED, INVITE TO PARTICIPATE IN THE STUDY.
We would like to invite you to a market research study about your attitudes toward Hybrid Electric Vehicles and the vehicle designs that would best meet your needs. If you agree to participate, we will ask you to come to our site in ___________ (location) for an interview. The interview will last about an hour, and you will be paid $_______ in appreciation for your time. This is an opportunity for you to express your opinions and to influence the design of new vehicles.

Customer Preference
IF MORE PERSUADING IS REQUIRED:
This study is being conducted for research purposes only, and at no time will anyone attempt to sell you anything as a result of your participation. At past studies, participants have found the opportunity to express their opinions on new products to be an interesting and informative experience.
The interview is being held in (location)____________________ on (dates)________________ at (times)________________, and will take about 1 hour. May I schedule you to participate?
� Yes – CONTINUE � No – THANK, TERMINATE AND TALLY
Because this study is being conducted by invitation only, I will need your correct name and address. (PLEASE ASK FOR CORRECT SPELLING AND FILL IN THE NAME, ADDRESS, AND SCHEDULING INFORMATION BELOW. BE SURE THE RESPONDENT GIVES YOU AN ADDRESS FOR MAILING AND CONFIRMATION LETTER, EVEN IF THERE IS AN ADDRESS ON THE LIST.)
Name_______________________________________________________________________________ Address: ____________________________________________________________________________ Telephone: ( )_______________________________________ Extension: _______________ Interview Date:_______________________________________ Time: ___________________________
Thank you for your interest in the study. In a few days, you will be receiving a confirmation letter and a phone call. Please be sure to bring the invitation and a photo ID with you to the study. And if you use reading glasses, please remember to bring them.
9. DO NOT ASK. Fill in gender:
� Male � Female
Thanks for being so cooperative. We'll see you at (time)_______ on (date)
D-37
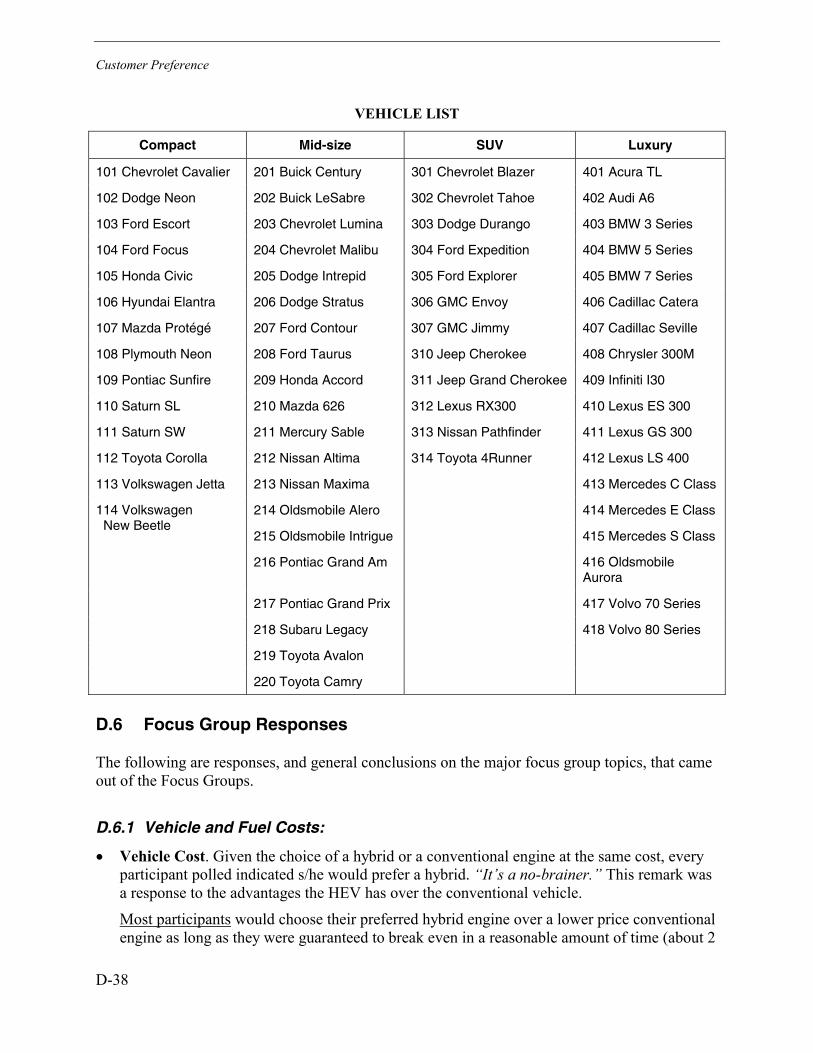
Customer Preference
VEHICLE LIST
Compact Mid-size SUV Luxury
101 Chevrolet Cavalier 201 Buick Century 301 Chevrolet Blazer 401 Acura TL
102 Dodge Neon 202 Buick LeSabre 302 Chevrolet Tahoe 402 Audi A6
103 Ford Escort 203 Chevrolet Lumina 303 Dodge Durango 403 BMW 3 Series
104 Ford Focus 204 Chevrolet Malibu 304 Ford Expedition 404 BMW 5 Series
105 Honda Civic 205 Dodge Intrepid 305 Ford Explorer 405 BMW 7 Series
106 Hyundai Elantra 206 Dodge Stratus 306 GMC Envoy 406 Cadillac Catera
107 Mazda Protégé 207 Ford Contour 307 GMC Jimmy 407 Cadillac Seville
108 Plymouth Neon 208 Ford Taurus 310 Jeep Cherokee 408 Chrysler 300M
109 Pontiac Sunfire 209 Honda Accord 311 Jeep Grand Cherokee 409 Infiniti I30
110 Saturn SL 210 Mazda 626 312 Lexus RX300 410 Lexus ES 300
111 Saturn SW 211 Mercury Sable 313 Nissan Pathfinder 411 Lexus GS 300
112 Toyota Corolla 212 Nissan Altima 314 Toyota 4Runner 412 Lexus LS 400
213 Nissan Maxima 413 Mercedes C Class
214 Oldsmobile Alero 414 Mercedes E Class 114 Volkswagen New Beetle
215 Oldsmobile Intrigue 415 Mercedes S Class
216 Pontiac Grand Am 416 Oldsmobile Aurora
217 Pontiac Grand Prix 417 Volvo 70 Series
218 Subaru Legacy 418 Volvo 80 Series
219 Toyota Avalon
220 Toyota Camry
113 Volkswagen Jetta
D.6 Focus Group Responses
The following are responses, and general conclusions on the major focus group topics, that came out of the Focus Groups.
D.6.1 Vehicle and Fuel Costs:
Vehicle Cost. Given the choice of a hybrid or a conventional engine at the same cost, every participant polled indicated s/he would prefer a hybrid. “It’s a no-brainer.” This remark was a response to the advantages the HEV has over the conventional vehicle.
��
Most participants would choose their preferred hybrid engine over a lower price conventional engine as long as they were guaranteed to break even in a reasonable amount of time (about 2
D-38

Customer Preference
years) “If you can show that the payback is in the first year, then fine.” “Idealistically, if it all balanced out, you’d like to think that you’d do it. But for something new, you’re looking for some benefit or reward.” Many participants also said that they would be willing to pay 10% more for the plug-in HEV initially, assuming significant cost savings on fuel (enough to make up the difference in two to three years)
It is important to note here that vehicle studies, according to ADA, indicate consumers do not typically do this type of payback period arithmetic when purchasing vehicles. Instead, fuel prices and other necessary activities, such as maintenance, tend to be more significant in consumer’s minds than their costs would indicate on a payback basis. This implies that a cost-of-ownership argument will not be the most effective way of marketing HEVs.
Others said they would only choose a hybrid over a conventional vehicle if they were guaranteed to net “ahead” financially. “If I’m never going to come out ahead, I don’t know how interested I would be.”
�� Fuel costs. ADA asked participants how they think about the cost of using a plug-in HEV (out of about 10 ways of explaining fuel costs). Somewhat more than half of respondents expressed an interest in knowing the per-mile, monthly, or annual fuel cost for an HEV. “I like simplicity. I want the calculation done out for me.” Most of the other participants would rather know miles per gallon (mpg) combined with a value that sheds light on electricity costs (increase to monthly bill, kWh per mile, etc). Many participants also expressed interest in a “custom profile” that calculates specific cost savings associated with their personal driving habits. These were important findings because they helped the WG determine how to express fuel costs in the quantitative study. But given the complexity of the ways in which fuel economy can be expressed (especially for the plug-in HEVs), more focus group work is needed to identify the best way(s) of characterizing HEV “fuel” efficiency and costs.
Most respondents named the HEV’s associated fuel cost savings as one of its most attractive features. While fuel economy was important to everyone, it was used primarily to differentiate among those vehicles that met primary requirements. “I’m more concerned about space in my vehicle than mpg.” Compact and mid-size car owners had fewer primary requirements and were thus more cost-focused than SUV and minivan owners.
�� Willingness to pay for AER. The respondents were asked one of three questions about their willingness to pay for greater all-electric range. When asked to choose between an HEV 20 and an HEV 60, which would cost $5,000 more, slightly more people stated they would rather buy the more expensive HEV 60. Another group was asked to chose between the HEV 20 or HEV 40, costing $3,000 more, and the HEV 60, costing $5,000 more. A slim majority again opted for the more expensive HEV 60, with most of the rest preferring the less expensive HEV 40, and a few preferring the least expensive plug-in HEV 20. Interestingly, if the prices were $1,500 more for the HEV 40 and the HEV 20 and $3,000 more for the HEV 60, a slim majority favored the HEV 40, followed by the HEV 60 and HEV 20. Although these results are for small groups and should not be used to draw quantitative conclusions, they do indicate that consumers weigh option packages in a perceived inconsistent and nonlinear nature. However, the results and other comments made in the focus groups indicate that participants understood benefits to increase as the all-electric range increases.
D-39

Customer Preference
D.6.2 Vehicle Attributes:
�� Physical Appeal. “If it’s ugly, forget it…” “I buy the car I want. When you buy a Cadillac, you don’t check the gas mileage.” “I like to drive certain cars, but the good side of me wants something that I don’t fill up all the time. It would be nice to have the best of both worlds.” General sentiment was that the vehicle must be attractive in order to sell. At least one respondent asserted that it would be good to sell the conventional vehicle models in HEV versions. This comment was carried into the assumptions for the quantitative model.
��
Driving Range. In general, participants expressed that although the greater range of HEVs was a benefit (“If I was driving to Las Vegas, I would definitely like not having to stop.”), it was not one of the two most important factors in purchasing an HEV. Specifically, increased range was valued less than fuel economy benefits. Only about a quarter of respondents valued “range” as one of the two most attractive features of HEVs. “It’s not deal-busting, but it [more range] is a big plus.” Participants agreed that simply increasing the fuel tank size in a conventional vehicle to achieve a greater driving range was not an attractive option due to weight and perceived increase in cost.
�� 0-30 mph vs. 50-70 mph acceleration. Roughly half of the respondents valued 0-30 mph performance more while the other half valued the 50-70 mph performance. This issue was brought up in order to understand how to design the vehicle for optimum market share and to determine if there were market niches. After the focus group studies were already complete, modeling results (Section 4.3.2.3) found the HEVs to have slightly better 0-30 mph, 40–60 mph, and 0-60 mph acceleration but slightly less 50-70 mph acceleration than the conventional mid-size car.84 One driver most interested in the 0-30 mph acceleration, for example, wanted to “leave everyone back at the stop sign” while another was concerned about making left turns in traffic. “I don’t take highway trips as much so [higher speed passing] are not as important.” The respondents valuing the 50-70 mph acceleration were concerned about the safety at on-ramps and when passing. “A lot of my driving is on highway. I need passing.” “Higher speeds are more dangerous if you can’t do what you want.”
�� Stopping for fuel versus plugging in. Most participants were intrigued by the idea of avoiding gas stations and considered plugging in much more convenient. A few stated that it is difficult to pump gas with small children waiting in the car. One respondent asserted that plugging in was better because “the car just sits there at night anyway…” Another said, “I just hate stopping.” One respondent said “It’s not a big deal to plug-in. We learned to plug-in our cell-phones,” and pointed out that even if she forgets to plug-in she can still drive the car. “I don’t know why anyone wouldn’t want a plug-in HEV. Except if it was a problem to plug-in.” The few respondents who preferred gasoline stations feared forgetting to plug in their car, some likening it to forgetting to charge their cell-phones. Another said “I’m lazy. I wouldn’t be organized enough to remember to plug-in.” (In the survey, people were asked about willingness to pay for systems that automatically plug-in the car.) There were also some concerns that acts of vandalism in the neighborhood could damage the plug or power cord. “Will the kids next door unplug you?” Participants were educated that there would be more benefits associated with plugging in and having a full battery and less benefit if the
84 The modelers of the mid-size car did not expect this, and modeling results for the SUV and compact cars might not follow this trend.
D-40

Customer Preference
battery was not plugged-in. The focus group participants understood that the plug-in HEVs (also called dual fuel HEVs) could be operated either way, but that more benefits come when the battery pack is fully charged.
�� Flexibility to choose between motor and engine vs. automatic switching in HEV 20 and HEV 60. Some participants expressed an interest in being able to control the use of electric motor or gasoline operation. Others sought reassurance that the vehicle would be “smart enough” to optimize the hybrid system. Some of these respondents were concerned about experiencing a different level of power during battery and gasoline modes.
�� Plug-in (Hybrid Y) vs. Non-plug-in (Hybrid X). If both vehicles were offered at the same initial price, 45 out of 53 participants would choose Hybrid Y over Hybrid X. A ‘Y’ preferrer said, “Y is definitely the better car. Why is there an X?” while an ‘X’ preferrer said, “Y you have to plug in and fuel. I like simple. I don’t like the two steps in [fueling] the Y.” In addition to the simplicity of the non-grid-connected or gasoline-only HEV, some felt that, since some apartments and condos did not have access to a plug, Hybrid X would have broader appeal that would help bring a higher resale value. Also, out of 16 participants polled, 9 chose the plug-in over the non-plug-in if both cars ‘netted’ the same (after accounting for fuel cost savings for the plug-in).
�� Extra features of pre-heat/ pre-cool and running “appliances” with the engine-off. Participants expressed interest in these features, which are discussed in more detail in Section 6.2.4.1.2. “My husband could use them in his line of work.” “These features are really cool and should be used in advertising.” However, the large majority of participants claimed they would have little impact on their purchase decision. The focus groups placed less importance on these various extra features than the results of the quantitative, choice-based market model, which found including these features almost doubles the market potential of the HEV 20 and HEV 60. This difference of opinion should be explored in future study phases.
D.6.3 Societal and Policy Changes:
�� Environmental benefits (less smog forming pollution, global warming gases, noise, etc.) . Overall, respondents expressed an interest in the environmental benefits but did not want to pay a premium for them. One participant stated, “It would only influence me if all else were equal.” Others stated that the environment was only one factor among many. “I want fancy features more.” There were significant differences between locations regarding the perceived importance of environmental factors. Among 60% of minivan drivers in Los Angeles, the positive environmental impact was the most attractive feature of an HEV (outranking even fuel cost savings). “Buying this type of car is a psychological thing like voting. It’s a small contribution, but it is a contribution.” Only 20% of Orlando minivan drivers, however, ranked “environment” as one of their two favorite HEV features out of a long list of benefits. “We’ll only think about the environment when the last tree is left standing”
�� Tax and policy incentives, rebates, and carpool lanes. Respondents said they liked the idea of incentives for consumers but not requirements to use HEVs. In Orlando, of 16 participants who were asked if they would vote for a law to require the use of low emission vehicles like HEVs, 4 indicated they would support the mandate. One participant summed it up in stating, “I want the Econobox, but I want the option to buy a Ferrari.” Support for carpool lane access was lukewarm.
D-41

Customer Preference
Although these results indicate that the respondents did not want to be required to use HEVs, they do not relate to consumers’ opinions of a mandate for manufacturers to produce and sell HEVs. This issue would have required a different set of discussion questions.
In addition to the items above, participants discussed special needs associated with their driving patterns. SUV and minivan drivers, more than in other vehicle classes, are likely to have specific requirements for space, passenger capacity, and hauling ability. As a result, in designing the vehicles, attention must be paid to these special need groups. For the mid-size respondents, these special requirements were less of an issue.
The focus groups also shed light on the sources of information that consumers use when researching a vehicle. It was found that respondents generally seek car information from the following sources (not in order): Internet, car magazines, Consumer Reports, TV ads, and dealer brochures.
D.7 Willingness to Pay More for HEVS
Another sensitivity consideration of interest is to take Scenario 1 data and determine what incremental price is necessary to achieve 18%, 25%, and 45% market potentials for each of the three HEVs. See Figure D-1. These groups of HEV purchase intenders are willing to pay about $3,000 more for the HEV 60 than the HEV 0, about $1,800 more for the HEV 20 than the HEV 0, and about $1,200 more for the HEV 60 than the HEV 20. Analyzing the scenario 1 data also indicates greater interest in the HEV 60 if all HEVs are priced at $24,000 or alternatively at $27,500. See Figure D-2. Why are consumers willing to pay more for the HEV 0 than the conventional car, and more for the HEV 20 than the HEV 0, and more for the HEV 60 than the HEV 20? The direct assessment section of the survey provides clues but does not definitively answer that question. However, the interview takers by the time they answered the full-profile trade-off questions had first answered narrowly focused trade-off questions on each of nine attributes. In doing so, they were educated that HEVs can provide many benefits beyond saving fuel. The WG believed this education was justified and necessary and assumed that 10 years from now the wide use of the internet will substantially change the car shopping process, and tremendously assist in the consumer process of researching the different types of HEVs. If consumers are educated only a little about HEV benefits, the market potential for all HEVs is expected to be less. More analysis of the existing data can be done in phase 2. However, the consumer responses to direct assessment questions about HEVs show that benefits other than fuel savings are important to consumers, indicating these benefits should be marketed.
D-42

Customer Preference
Figure D-1 Constant Market Potential Versus HEV Price
Figure D-2 HEV Market Potential at Constant Price
D-43

Customer Preference
D.8 120 V Plug for Electric Appliances; Pre-heat/Pre-cool as Option
In Section 5.2.4.2 (Sensitivity Analysis), a brief summary of marketing preferences for two types of optional equipment was presented. One option was to provide pre-heating or pre-cooling, so that the vehicle would be comfortable when entered. The other option was to provide a 110V outlet so that various home, work, office, or recreational appliances could be used. It was assumed that both plug-in HEVs could provide these both with the engine on or engine off, the HEV 0 or conventional vehicle could only provide these when the engine was on.85 The cost of these options was set at $300 for the pre-heat/pre-cool and $300 for the 110V outlet. Details on how these options were explained to survey participants can be found in Appendix D, pages D-15 and D-16.
The survey results showed about 40% had a strong negative reaction to these options with the engine on86, and about 10% had strong negative reactions to these options with the engine off. The pre-heat/pre-cool option was the most attractive with 62% indicating a strong positive reaction with the engine off and 12% indicating a strong positive reaction with the engine on. Survey results for the 110V outlet for appliances indicated 47% had a strong positive reaction with the engine off and 7% with the engine on. This interest was much larger than indicated by the focus groups. Further study of how optional equipment might influence purchasing decisions for HEVs might be warranted.
85 Under some circumstances, a conventional vehicle could provide these options with the engine off, however, there would need to be an additional battery so that starting the vehicle was not impacted. 86 On a scale of 1-9, strong negative reactions were 1-3, strong positive reactions were 7-9, and neutral reactions were 4-6. With the engine on only a few were in the strong positive category in desiring extra features.
D-44


![Impact of hybrid optimization strategies on distributed ... · Not comparing di↵erent computing platforms [1] No custom distributed computing Prateek Gaur Hybrid Optimization September](https://img.pdfslide.us/doc/110x75/5f1e50af79782533df2cdb8b/impact-of-hybrid-optimization-strategies-on-distributed-not-comparing-diaerent.jpg)