Embed Size (px)
Citation preview
Munich Personal RePEc Archive
Comparing risk elicitation in lotteries
with visual or contextual framing aids
Estepa-Mohedano, Lorenzo and Espinosa, Maria Paz
LoyolaBehLab, ETEA-Development Institute, Universidad Loyola
Andalucía, Spain, Department of Economics, University of the
Basque Country, Spain
8 June 2021
Online at https://mpra.ub.uni-muenchen.de/108440/
MPRA Paper No. 108440, posted 25 Jun 2021 05:04 UTC
Comparing risk elicitation in lotteries with visual
or contextual framing aids ∗
Lorenzo Estepa-Mohedano†, Marıa Paz Espinosa‡
June 8, 2021
Abstract
Eliciting risk preferences usually involves tasks that subjects may find
complex, such as calculations of expected values and assessment of prob-
abilities in multiple price lists (MPL). There is a serious concern that the
decisions of the subjects may be driven by miscalculations or miscalibra-
tion of probabilities, rather than by their risk preferences. In this paper,
we test whether introducing aids to the usual lottery choices would help
to reduce the error rate and possibly change risk aversion elicitation. The
experiment was run with subjects from a rural area in Honduras. We com-
pare the risk elicitation results of a multiple price list and two different
treatments, one with visual aids (graphical representation of probabilities)
and the other with contextual framing aids (bills to represent rewards and
a distribution of ten beans between the two rewards to represent a lot-
tery). Our results indicate that risk attitudes elicitation was affected with
contextual framing aids, reducing risk aversion. For the treatment with
visual aids we observe no effect.
∗Financial support from MINECO (PGC2018-093506-B-I00 and PID2019-108718GB-I00),the Basque Government (IT 1336-19) and Andalucıa Government (PY-18-FR-0007) is grate-fully acknowledged. We also thank ETEA Development Institute for their support.
†Corresponding author: LoyolaBehLab, ETEA-Development Institute, Universidad Loy-ola Andalucıa, Spain
‡Department of Economics, University of the Basque Country, Spain
1
1 Introduction
One of the critical issues in risk elicitation is the complexity of dealing with
probabilities and the fact that individuals very often miscalibrate their chances
(Camerer et al., 2004; Dessalles, 2006). The traditional elicitation methods,
such as Multiple Price Lists (MPL) (Holt and Laury, 2002) allow the estima-
tion of risk preference parameters in a model that makes particular functional
form assumptions, but these methods based on MPL may be very demanding
for some subjects. This complexity may translate into errors and inconsisten-
cies, so that choices may not correspond to the subject’s true attitude towards
risk. For laboratory experiments with university students the complexity of
choosing lotteries in an MPL framework may not be a serious concern, but in
different populations the difficulty of the task may be too high for results to be
reliable. For example, in Charness and Viceisza (2016) 75% of Senegalese farm-
ers made inconsistent choices; Hirschauer et al. (2014) found 57% inconsistent
answers amongst Kazakh farmers; and Jacobson and Petrie (2009) found a 55%
inconsistency rate for adults in Ruanda. Inconsistencies have been found also
in developed countries, Holt and Laury (2002) reported 13% of inconsistencies
among students in the USA and Dave et al. (2010) found 8.5% of inconsistent
answers in a sample of Canadian citizens.
These differences in the rate of inconsistencies suggest that the ability to
make correct probabilistic evaluations may depend on education. Fontanari
et al. (2014) have tested this hypothesis and they find that preliterate and
prenumerate Mayan adults are able to solve a variety of probabilistic problems
and their performance is equivalent to that of the western controls. For their
experiment they used chips of several colors and shapes to represent probabilities
so that the elicitation instrument would not interfere or be a barrier to the
probabilistic assessment of the subjects. They conclude that the human mind
possesses a basic probabilistic knowledge.
However, the previous results on the differences in inconsistent choices across
populations suggest that the cognitive requirements of the usual elicitation in-
struments may be a barrier to the correct elicitation of risk preferences. In this
paper we test whether the introduction of (a) visual aids or (b) contextual fram-
ing aids in the usual lottery choices, may reduce inconsistencies and/or change
2
choices. Visual and contextual framing aids are designed to help subjects un-
derstand probabilities and lotteries in a more intuitive way and our hypothesis
is that they should reduce inconsistencies and provide a more accurate measure-
ment of risk attitudes. According to Alekseev et al. (2017), it is typically more
difficult for most people to operate with abstract rather than concrete terms,
especially when a task requires sophisticated reasoning. Thus, the influence of
context may be determinant in reducing errors (inconsistencies) in measuring
risk preferences (Meraner et al., 2018).
Regarding the ability of subjects to accurately assess quantitative magni-
tudes from visual referents, Cleveland and McGill (1984) analyze how people
extract quantitative information from graphs. One example of these visual rep-
resentation is the dots method employed by Krupnick et al. (2002), that provides
a graphic image to complement the direct fractional, numerical representation
of probability. Visual ladders have been used in previous research on mortality
risk by Gerking et al. (1988) and Gegax et al. (1991).
No single task representation for lotteries seems to be equally effective for
all subjects and the existing literature points to important differences between
experts and non-experts (Cleveland et al. 1983 and 1982). Harrison et al. (2008)
summarize visual aids used to represent probabilities in risk elicitation. They
find that a careful experimental design that includes these representations may
generate some robustness and convergence in subjective and perceived proba-
bilities, but there is no single task representation for lotteries that is optimal
for all subjects.
Previous literature has addressed the question of the influence of risk mea-
surement instruments (Csermely and Rabas, 2016; Drichoutis and Lusk, 2016).
Among other dimensions, instruments may differ according to the complexity of
the elicitation method and this complexity may be related to the framing of the
task. For example, simple elicitation methods such as the Ballon Analogue Risk
task, tend to be easier for participants to understand (Charness et al., 2013).
Dave et al. (2010) compare two elicitation methods with different degree of dif-
ficulty and find that with more complex instruments subjects exhibit noisier
behavior.
Experimental studies have found a negative relationship between cognitive
abilities and risk aversion. Andersson et al. (2016) and (2020) and Amador-
3
Hidalgo et al. (2021) explore whether the negative correlation is due to prefer-
ences or noisy decision making in tasks to elicit risk attitudes.1 They conclude
that when computations are hard, random decision making by subjects with
lower cognitive ability may lead to an overestimation of risk aversion for these
individuals. Therefore, we should expect that an elicitation procedure that im-
proves the understanding of the task, by decreasing the cognitive requirements,
would lead to a lower elicited risk aversion. Indeed, in our experiment we find
that for the treatment with contextual framing aids, with lower cognitive de-
mand, the elicited risk aversion is lower.
For our experiment, we have chosen a subject pool in a rural developing-
country, not used to dealing explicitly with probabilities, so that the effect of
visual aids and contextual framing aids could be more apparent. The question
is whether using traditional MPLs may generate different outcomes than using
other instruments with the same lottery choices but adding visual or contextual
framing aids. In a between-subjects design, we test whether the estimated risk
aversion coefficient, the number of inconsistent decisions and the subjects’ time
response differ across treatments.
We find that a graphical representation of probabilities (visual aids) did not
have any effect. However, contextual framing aids (bills to represent rewards
and a distribution of ten beans between the two rewards to represent a lot-
tery) decreased inconsistencies and affected the risk attitudes elicitation when
compared to traditional MPL in a reduced version of Holt and Laury lotteries.
The paper is organized as follows. Section 2 describes the methods and main
hypotheses. Section 3 contains the experimental design and procedures. Section
4 presents the results concerning differences between the treatments and Section
5 concludes with a discussion of the results and directions for future research.
2 Methods
2.1 Experimental design and hypotheses
The experiment was carried out in conjunction with data collection for a larger
World Bank project implemented in Nigeria, aiming to test how an educational
1See also Benjamin et al. (2013), Taylor (2013) and Dohmen et al. (2018).
4
intervention may influence literacy rates of children and parental attitudes to-
wards education. It was run between May 1st and 14th of 2019, in eleven school
districts in Santa Rosa de Copan (Honduras), where 360 households were ran-
domly selected to be interviewed. The eligibility criteria for households was
having at least one child between 6 and 9 years old registered at one of 11
different public schools.
The experiment was conducted by 12 field enumerators who were trained in
a three-day workshop. All the enumerators (1 man and 11 women) were over
20 years old and had university studies. They received a list of households they
had to visit, and the type of paper-based questionnaire they had to apply to
each household. In the experiment, instructions were read and explained by the
enumerator.
The authors conducted the random allocation of treatments prior to the
visit and the interviewers did not have any influence on such selection. To
ensure the enumerators were applying the corresponding questionnaire to the
households, a field coordinator supervised the correct use of the lists created by
the researchers. Prior to the experiment, we run a pilot of the risk preference
questionnaire with around 20 subjects to ensure the translation into Spanish
was appropriate to the context. All questionnaires and instructions were orig-
inally written in English. Enumerators conducted all face-to-face interviews
in the households of the participants and only one experimental subject was
interviewed per household.2
To elicit risk preferences, we used a between-subject design where partici-
pants were randomly assigned to one of 3 treatments (arms), each with prob-
ability 13 : (a) a simplified Holt-Laury MPL with 5 decisions (Holt and Laury,
2002), hereafter baseline treatment HL; (b) a visual aid mechanism using a pie
chart, implementing the same 5-item MPL, treatment PC, and (c) a contextual
framing aid mechanism using beans and copies of local money bills, implement-
ing again the same 5-item MPL, treatment BB. The distribution of subjects
resulting from the random assignment was as follows: HL (116 subjects), PC
2The study was approved by University Loyola Andalucıa Ethics Committee. Allparticipants signed an informed consent form. The field study was pre-registeredin AsPredicted before conducted. The documentation can be consulted here:https://aspredicted.org/6qh4a.pdf.
5

(122) and BB (122).3
For each treatment, we estimate the risk aversion coefficient assuming a
CRRA utility function (constant relative risk aversion):
u(x) =x1−r
1− r
for r > 0, r 6= 1 and
u(x) = lnx
for r = 1, where x is the money earned and r is the relative risk aversion
coefficient, the parameter to be estimated.
We use maximum likelihood (ML) structural estimation with the Luce er-
ror specification (Harrison et al., 2008; Harrison, 2008; Luce, 1959). In MPL
lotteries it is often the case that subjects show inconsistencies by switching op-
tions multiple times (Charness et al., 2013). These observations are usually
eliminated from the analysis, but with a ML structural estimation we are able
to account for these “mistakes” by adding a stochastic component that mod-
els errors.4 The CRRA coefficient is determined by individual and treatment
characteristics.
In the ML regressions the dependent variable is ρ = (1− r). The treatment
effects will be identified by the coefficients of the treatment dummies, and this
will allow us to test the following two hypotheses:
• Hypothesis 1. Visual aids (treatment PC ) impact the outcome of risk
preferences parameter elicitation compared to a MPL (baseline treatment
HL)
• Hypothesis 2. Contextual framing aids (treatment BB) impact the out-
come of risk preferences parameter elicitation compared to a MPL (base-
line treatment HL)
We also look at the treatment effects on the number of inconsistent choices
and the time spent in the decision:
3The risk aversion elicitation task was part of an experiment with 4 tasks: coordination,expectations, risk aversion and time discount, in that order.
4See also Carbone and Hey (2000) and Loomes et al. (2002).
6
• Hypothesis 3. Visual aids (treatment PC ) reduce the number of inconsis-
tent choices compared to the baseline treatment HL
• Hypothesis 4. Contextual framing aids (treatment BB) reduce the number
of inconsistent choices compared to the baseline treatment HL
• Hypothesis 5. Visual aids (treatment PC ) does not require additional time
to make a decision compared to the baseline treatment HL
• Hypothesis 6. Contextual framing aids (treatment BB) does not require
additional time to make a decision compared to the baseline treatment HL
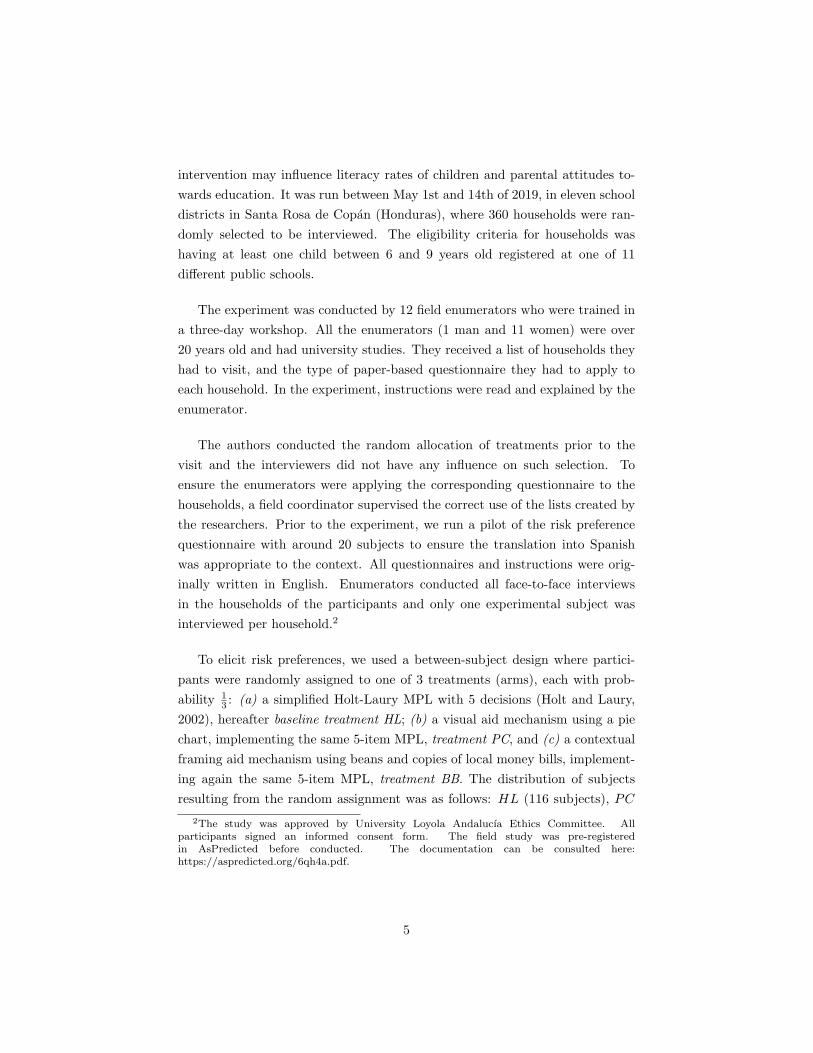
2.2 Subject pool
First, we present some descriptive statistics of the subject pool. Table 1 con-
tains for each treatment the proportion of male and female subjects, the average
number of years of schooling, average age of the subjects and the socio economic
status of the school district. Subjects were randomly assigned to the treatments
and the sub samples are balanced in socio-demographic characteristics and eth-
nic composition.
Table 1: Subject pool in different treatments
HL PC PC −HL p(PC−HL) BB BB −HL p(BB−HL) n
Men 0.181 0.139 -0.041 0.353 0.098 -0.082 0.066 50Women 0.818 0.860 0.041 0.353 0.901 0.082 0.066 310Educ 9.4 9.2 -0.221 0.700 8.7 -0.723 0.208 358SES 2.189 2.098 -0.091 0.377 2.182 -0.007 0.945 360Age 33.8 35.6 1.699 0.178 33.6 -0.231 0.854 359Mayachorti 0.230 0.164 -0.068 0.174 0.164 -0.068 0.174 67Lenca 0.086 0.087 0.004 0.908 0.048 -0.037 0.280 27n 116 122 122 360
Note: Educ is the average number of years of schooling; SES is the socio economicstatus of the school district: 1 (high), 2 (medium), 3 (low); Age is the average ageof participants; p is the p-value of the corresponding test of differences betweenmeans.
7
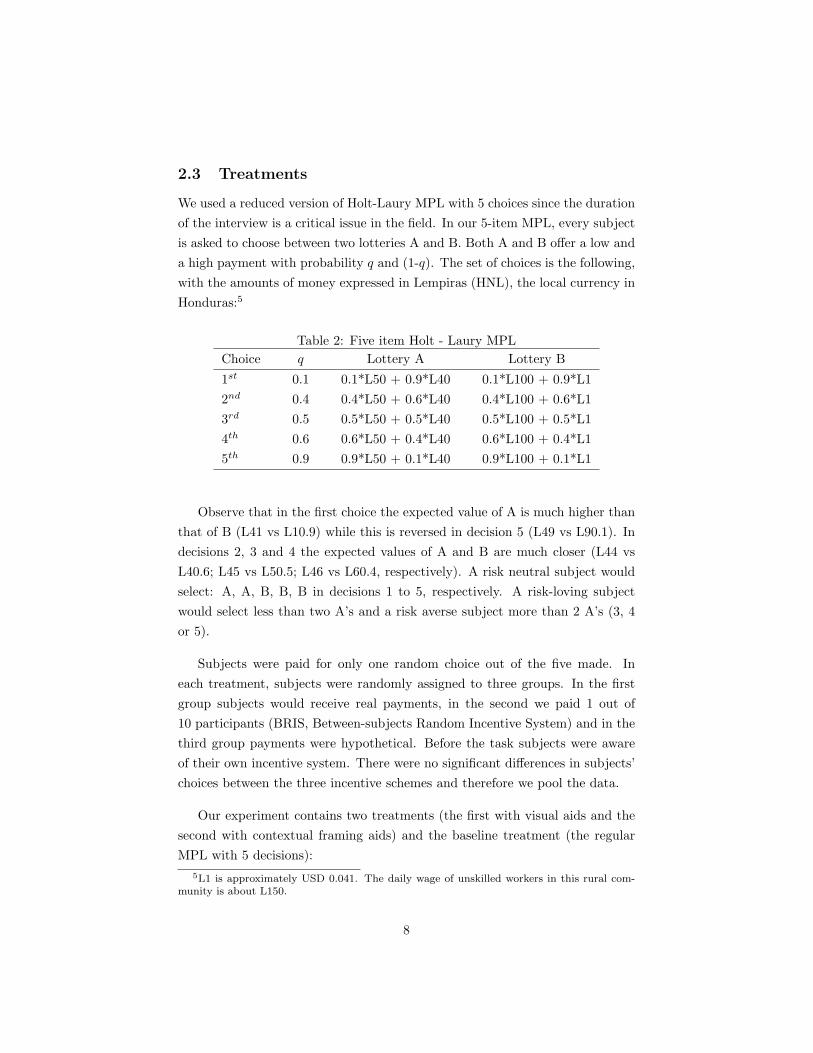
2.3 Treatments
We used a reduced version of Holt-Laury MPL with 5 choices since the duration
of the interview is a critical issue in the field. In our 5-item MPL, every subject
is asked to choose between two lotteries A and B. Both A and B offer a low and
a high payment with probability q and (1-q). The set of choices is the following,
with the amounts of money expressed in Lempiras (HNL), the local currency in
Honduras:5
Table 2: Five item Holt - Laury MPL
Choice q Lottery A Lottery B
1st 0.1 0.1*L50 + 0.9*L40 0.1*L100 + 0.9*L1
2nd 0.4 0.4*L50 + 0.6*L40 0.4*L100 + 0.6*L1
3rd 0.5 0.5*L50 + 0.5*L40 0.5*L100 + 0.5*L1
4th 0.6 0.6*L50 + 0.4*L40 0.6*L100 + 0.4*L1
5th 0.9 0.9*L50 + 0.1*L40 0.9*L100 + 0.1*L1
Observe that in the first choice the expected value of A is much higher than
that of B (L41 vs L10.9) while this is reversed in decision 5 (L49 vs L90.1). In
decisions 2, 3 and 4 the expected values of A and B are much closer (L44 vs
L40.6; L45 vs L50.5; L46 vs L60.4, respectively). A risk neutral subject would
select: A, A, B, B, B in decisions 1 to 5, respectively. A risk-loving subject
would select less than two A’s and a risk averse subject more than 2 A’s (3, 4
or 5).
Subjects were paid for only one random choice out of the five made. In
each treatment, subjects were randomly assigned to three groups. In the first
group subjects would receive real payments, in the second we paid 1 out of
10 participants (BRIS, Between-subjects Random Incentive System) and in the
third group payments were hypothetical. Before the task subjects were aware
of their own incentive system. There were no significant differences in subjects’
choices between the three incentive schemes and therefore we pool the data.
Our experiment contains two treatments (the first with visual aids and the
second with contextual framing aids) and the baseline treatment (the regular
MPL with 5 decisions):
5L1 is approximately USD 0.041. The daily wage of unskilled workers in this rural com-munity is about L150.
8
• Treatment PC: Implementing a reduced version of HL lotteries with a
visual aid. For each of the five decisions, two pie charts are presented to
the subject with the circles divided in two parts that contain the respective
rewards for each lottery. The enumerator explains that the size of each
part of the circle represents how large is the possibility of winning the
amount written.
• Treatment BB: Implementing a reduced version of HL lotteries with a
contextual framing aid mechanism. For each of the five decisions, the
lotteries involved were explained as follows: the enumerator shows two
images with copies of money bills representing the rewards of each lottery
and distribute ten beans between the two images, to represent the chances
of winning that amount. The interviewers explained that the more beans
are placed on a certain quantity, the higher the possibility of winning that
amount.
Each subject was randomly assigned to one of the three treatments: HL
denotes the MPL mechanism, PC the Pie chart mechanism and BB the beans
and bills mechanism. In the Appendix we provide more information on these
visual and contextual framing aids. For the measurement of the time spent on
the tasks, and after having explained to the subjects the use of each mechanism,
the enumerator recorded the time at the beginning of the task, and again after
the task was completed.
Table 3 provides information on the average number of safe choices in dif-
ferent subsamples and for each treatment, for consistent subjects (n=280 ; 95 in
HL, 93 in PC and 92 in BB). Risk neutrality would corresponds to 2 safe choices
and the mean of the different treatments is not far from that reference point.
For the baseline HL and treatment PC we cannot reject that the mean is 2.
However, for treatment BB the mean is statistically different (see the p-values
in Table 3).
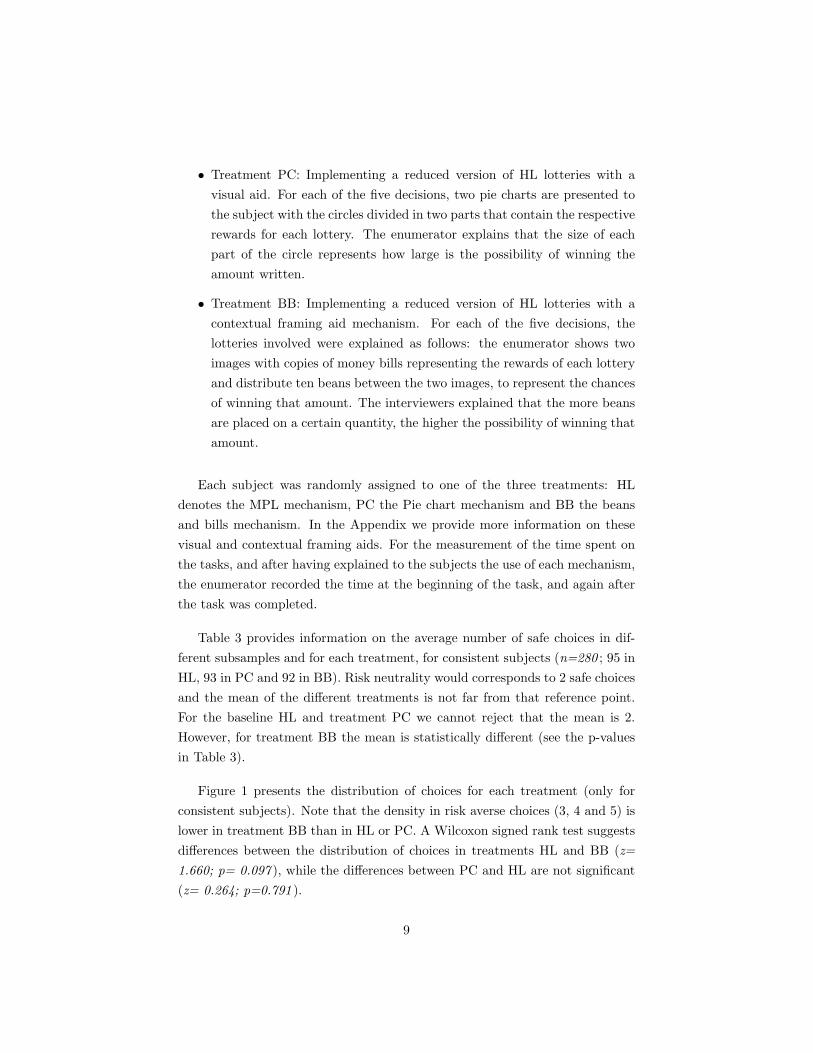
Figure 1 presents the distribution of choices for each treatment (only for
consistent subjects). Note that the density in risk averse choices (3, 4 and 5) is
lower in treatment BB than in HL or PC. A Wilcoxon signed rank test suggests
differences between the distribution of choices in treatments HL and BB (z=
1.660; p= 0.097 ), while the differences between PC and HL are not significant
(z= 0.264; p=0.791 ).
9
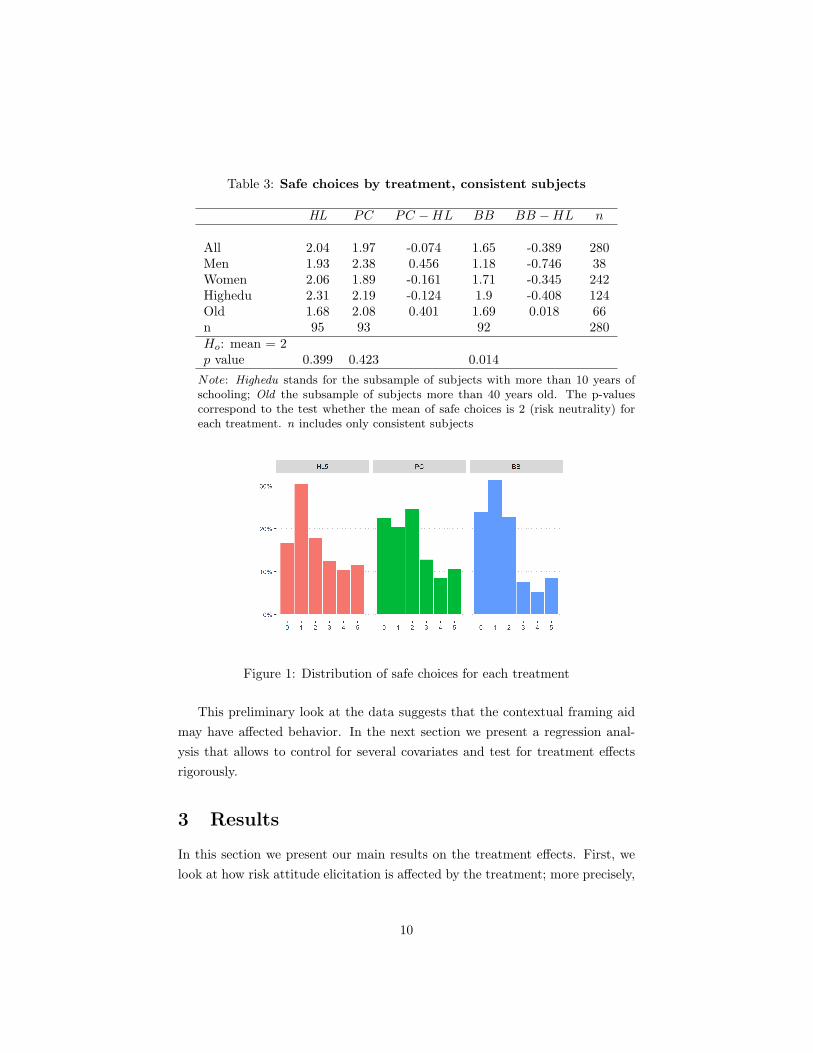
Table 3: Safe choices by treatment, consistent subjects
HL PC PC −HL BB BB −HL n
All 2.04 1.97 -0.074 1.65 -0.389 280Men 1.93 2.38 0.456 1.18 -0.746 38Women 2.06 1.89 -0.161 1.71 -0.345 242Highedu 2.31 2.19 -0.124 1.9 -0.408 124Old 1.68 2.08 0.401 1.69 0.018 66n 95 93 92 280Ho: mean = 2p value 0.399 0.423 0.014
Note: Highedu stands for the subsample of subjects with more than 10 years ofschooling; Old the subsample of subjects more than 40 years old. The p-valuescorrespond to the test whether the mean of safe choices is 2 (risk neutrality) foreach treatment. n includes only consistent subjects
Figure 1: Distribution of safe choices for each treatment
This preliminary look at the data suggests that the contextual framing aid
may have affected behavior. In the next section we present a regression anal-
ysis that allows to control for several covariates and test for treatment effects
rigorously.
3 Results
In this section we present our main results on the treatment effects. First, we
look at how risk attitude elicitation is affected by the treatment; more precisely,
10
we look at the treatment effects in the estimation of the risk aversion coefficient
by maximum likelihood. Then, we look at the effect of the treatment on the
number of inconsistent choices and the time of response.
3.1 Treatment effects on the elicited risk aversion coeffi-
cient
First, we present the treatment effects on the estimated risk aversion coefficient
in Table 4.
Table 4: Treatment effects on the risk aversion coefficient (1− r)
Indep Variables (1) (2) (3) (4)treatBB 0.648*** [1.760] 0.173 0.661** [1.825] 0.689** [1.976]
(0.001) (0.267) (0.025) (0.033)treatPC -0.336 [0.644] -0.008 -0.335 [0.643] -0.354 [0.675]
0.121 (0.953) (0.254) (0.233)
Age -0.004 -0.002 0.002(0.521) (0.717) (0.755)
Education -0.004 -0.002 0.002(0.521) (0.717) (0.755)
Female -0.019 -0.005 0.012(0.926) (0.981) (0.954)
Mayachorti -0.328*** -0.339*** -0.322***(0.004) (0.001) (0.001)
TreatBB x fem -0.490* -0.536 -0.567(0.091) (0.160) (0.172)
TreatPC x fem 0.402 0.381 0.398(0.183) (0.351) (0.326)
Constant 1.431*** 1.678*** 1.640*** 1.366(0.000) (0.000) (0.000) (0.000)
Observations 1,795 1,780 1,780 1,780Subjects 359 356 356 356
SESs FE No No No YesAIC 2148.27 2130.16 2128.94 2126.16
Notes: p-values in parentheses.*** p< 0.01, ** p< 0.05, * p< 0.1. Cohen‘s d valuein brackets. Boot clustered by enumerators in all models.
We present four models in Table 4. In all the models but the second one,
we include the treatments and their interactions with gender to check whether
there is a differential effect for males and females. In models (2), (3) and (4) we
include demographic covariates. In the last model we introduce socio economic
11
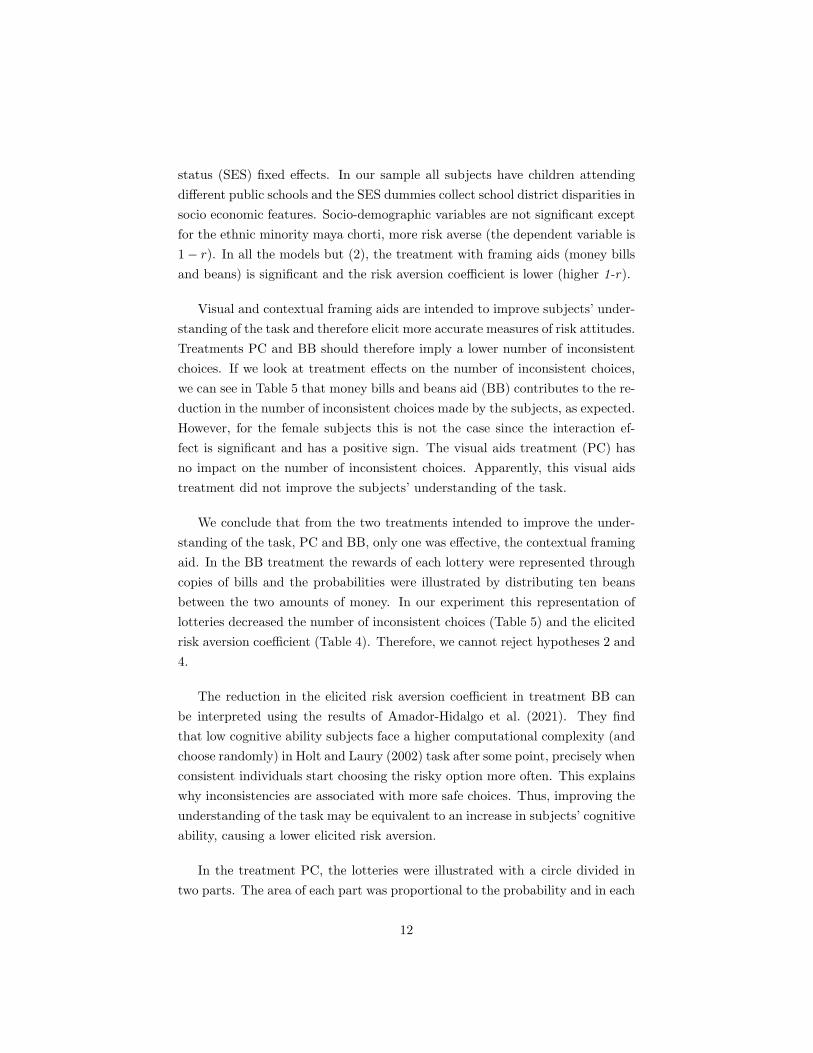
status (SES) fixed effects. In our sample all subjects have children attending
different public schools and the SES dummies collect school district disparities in
socio economic features. Socio-demographic variables are not significant except
for the ethnic minority maya chorti, more risk averse (the dependent variable is
1− r). In all the models but (2), the treatment with framing aids (money bills
and beans) is significant and the risk aversion coefficient is lower (higher 1-r).
Visual and contextual framing aids are intended to improve subjects’ under-
standing of the task and therefore elicit more accurate measures of risk attitudes.
Treatments PC and BB should therefore imply a lower number of inconsistent
choices. If we look at treatment effects on the number of inconsistent choices,
we can see in Table 5 that money bills and beans aid (BB) contributes to the re-
duction in the number of inconsistent choices made by the subjects, as expected.
However, for the female subjects this is not the case since the interaction ef-
fect is significant and has a positive sign. The visual aids treatment (PC) has
no impact on the number of inconsistent choices. Apparently, this visual aids
treatment did not improve the subjects’ understanding of the task.
We conclude that from the two treatments intended to improve the under-
standing of the task, PC and BB, only one was effective, the contextual framing
aid. In the BB treatment the rewards of each lottery were represented through
copies of bills and the probabilities were illustrated by distributing ten beans
between the two amounts of money. In our experiment this representation of
lotteries decreased the number of inconsistent choices (Table 5) and the elicited
risk aversion coefficient (Table 4). Therefore, we cannot reject hypotheses 2 and
4.
The reduction in the elicited risk aversion coefficient in treatment BB can
be interpreted using the results of Amador-Hidalgo et al. (2021). They find
that low cognitive ability subjects face a higher computational complexity (and
choose randomly) in Holt and Laury (2002) task after some point, precisely when
consistent individuals start choosing the risky option more often. This explains
why inconsistencies are associated with more safe choices. Thus, improving the
understanding of the task may be equivalent to an increase in subjects’ cognitive
ability, causing a lower elicited risk aversion.
In the treatment PC, the lotteries were illustrated with a circle divided in
two parts. The area of each part was proportional to the probability and in each
12
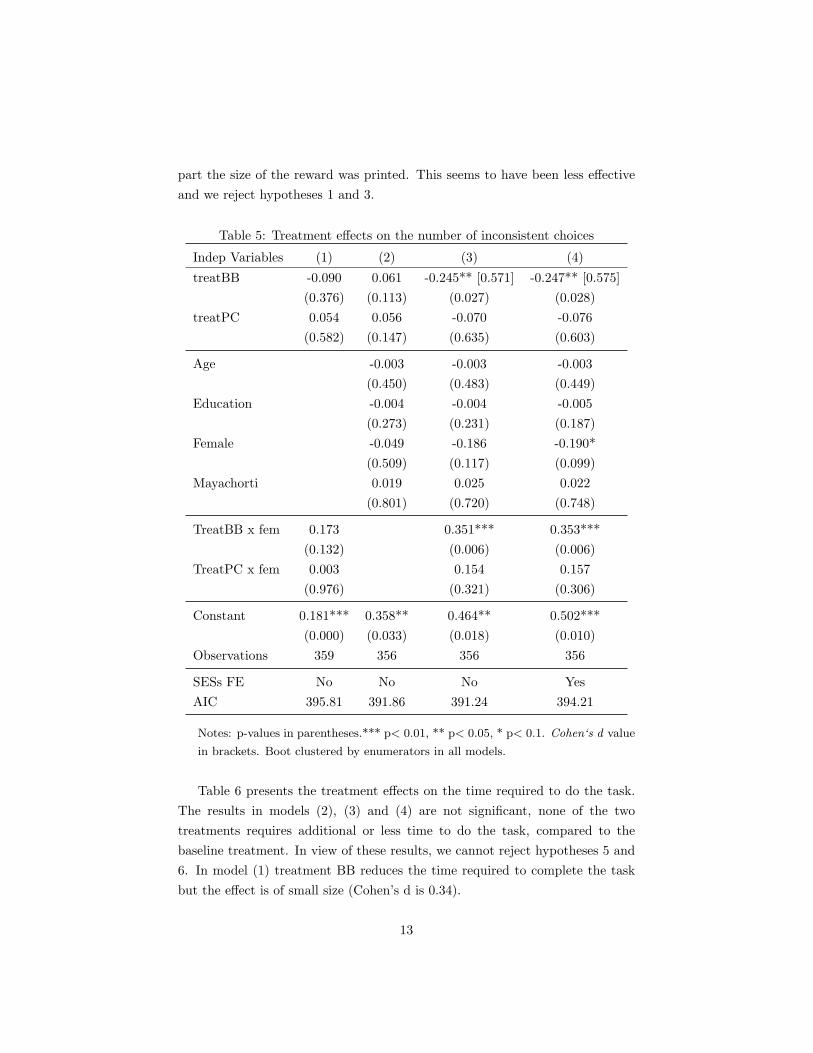
part the size of the reward was printed. This seems to have been less effective
and we reject hypotheses 1 and 3.
Table 5: Treatment effects on the number of inconsistent choices
Indep Variables (1) (2) (3) (4)
treatBB -0.090 0.061 -0.245** [0.571] -0.247** [0.575]
(0.376) (0.113) (0.027) (0.028)
treatPC 0.054 0.056 -0.070 -0.076
(0.582) (0.147) (0.635) (0.603)
Age -0.003 -0.003 -0.003
(0.450) (0.483) (0.449)
Education -0.004 -0.004 -0.005
(0.273) (0.231) (0.187)
Female -0.049 -0.186 -0.190*
(0.509) (0.117) (0.099)
Mayachorti 0.019 0.025 0.022
(0.801) (0.720) (0.748)
TreatBB x fem 0.173 0.351*** 0.353***
(0.132) (0.006) (0.006)
TreatPC x fem 0.003 0.154 0.157
(0.976) (0.321) (0.306)
Constant 0.181*** 0.358** 0.464** 0.502***
(0.000) (0.033) (0.018) (0.010)
Observations 359 356 356 356
SESs FE No No No Yes
AIC 395.81 391.86 391.24 394.21
Notes: p-values in parentheses.*** p< 0.01, ** p< 0.05, * p< 0.1. Cohen‘s d value
in brackets. Boot clustered by enumerators in all models.
Table 6 presents the treatment effects on the time required to do the task.
The results in models (2), (3) and (4) are not significant, none of the two
treatments requires additional or less time to do the task, compared to the
baseline treatment. In view of these results, we cannot reject hypotheses 5 and
6. In model (1) treatment BB reduces the time required to complete the task
but the effect is of small size (Cohen’s d is 0.34).
13
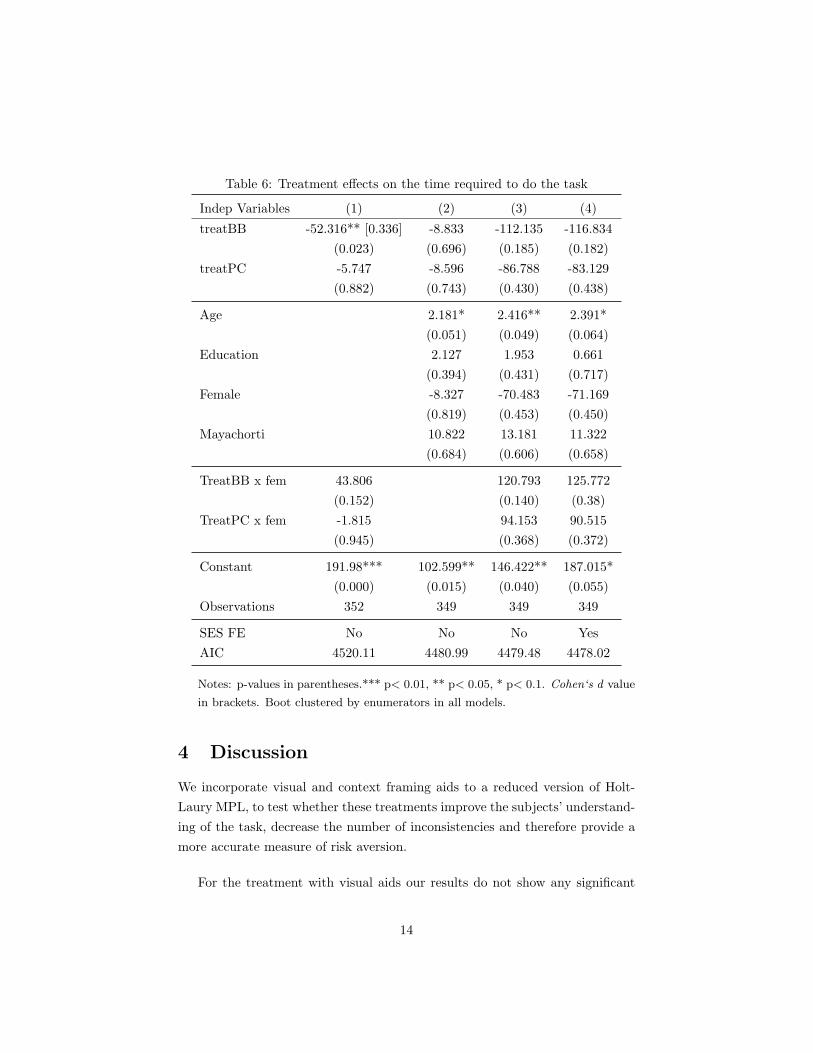
Table 6: Treatment effects on the time required to do the task
Indep Variables (1) (2) (3) (4)
treatBB -52.316** [0.336] -8.833 -112.135 -116.834
(0.023) (0.696) (0.185) (0.182)
treatPC -5.747 -8.596 -86.788 -83.129
(0.882) (0.743) (0.430) (0.438)
Age 2.181* 2.416** 2.391*
(0.051) (0.049) (0.064)
Education 2.127 1.953 0.661
(0.394) (0.431) (0.717)
Female -8.327 -70.483 -71.169
(0.819) (0.453) (0.450)
Mayachorti 10.822 13.181 11.322
(0.684) (0.606) (0.658)
TreatBB x fem 43.806 120.793 125.772
(0.152) (0.140) (0.38)
TreatPC x fem -1.815 94.153 90.515
(0.945) (0.368) (0.372)
Constant 191.98*** 102.599** 146.422** 187.015*
(0.000) (0.015) (0.040) (0.055)
Observations 352 349 349 349
SES FE No No No Yes
AIC 4520.11 4480.99 4479.48 4478.02
Notes: p-values in parentheses.*** p< 0.01, ** p< 0.05, * p< 0.1. Cohen‘s d value
in brackets. Boot clustered by enumerators in all models.
4 Discussion
We incorporate visual and context framing aids to a reduced version of Holt-
Laury MPL, to test whether these treatments improve the subjects’ understand-
ing of the task, decrease the number of inconsistencies and therefore provide a
more accurate measure of risk aversion.
For the treatment with visual aids our results do not show any significant
14
effect. These aids did not affect the number of inconsistencies, the risk aver-
sion coefficient nor the response time. However, the treatment with contextual
framing aids did have an effect. In this treatment, subjects see a lottery as
two amounts of money (represented by copies of bills) and the probabilities are
represented by distributing ten beans between the two possible rewards. This
intuitive representation of lotteries (treatment BB) was able to reduce the num-
ber of inconsistent choices, mainly in the subsample of males, and at the same
time, generated a lower elicited risk aversion.
Since treatment BB reduces inconsistencies, we conclude that the risk aver-
sion measurement is more accurate under this treatment than in the baseline.
This conclusion is also supported by previous research on the negative relation-
ship between cognitive abilities and risk aversion. If treatment BB provides
more clarity, and subjects consider the task less complex than HL, this may be
equivalent to subjects having more cognitive ability, therefore making fewer er-
rors (less inconsistencies) and showing less risk aversion (Amador-Hidalgo et al.,
2021). Our results may be particularly relevant for risk elicitation experiments
in developing countries, where the percentage of inconsistencies is usually high.
15
References
Alekseev, A., Charness, G., and Gneezy, U. (2017). Experimental methods:
When and why contextual instructions are important. Journal of Economic
Behavior & Organization, 134:48–59.
Amador-Hidalgo, L., Branas-Garza, P., Espın, A. M., Garcıa-Munoz, T., and
Hernandez-Roman, A. (2021). Cognitive abilities and risk-taking: Errors, not
preferences. European Economic Review, 134:1–17.
Andersson, O., Holm, H. J., Tyran, J.-R., and Wengstrom, E. (2016). Risk
aversion relates to cognitive ability: Preferences or noise? Journal of the
European Economic Association, 14(5):1129–1154.
Andersson, O., Holm, H. J., Tyran, J.-R., and Wengstrom, E. (2020). Robust
inference in risk elicitation tasks. Journal of Risk and Uncertainty, 61(3):195–
209.
Benjamin, D., Brown, S., and Shapiro, J. (2013). Who is ’behavioral’? cogni-
tive ability and anomalous preferences. Journal of the European Economic
Association, 11(6):1231–1255.
Camerer, C. F., Loewenstein, G., and Rabin, M. (2004). Advances in Behavioral
Economics. Princeton University Press.
Carbone, E. and Hey, J. (2000). Which error story is best? Journal of Risk and
Uncertainty, 20(2):161–176.
Charness, G., Gneezy, U., and Imas, A. (2013). Experimental methods: Eliciting
risk preferences. Journal of Economic Behavior & Organization, 87:43–51.
Charness, G. and Viceisza, A. (2016). Three risk-elicitation methods in the field:
Evidence from rural Senegal. Review of Behavioral Economics, 3(2):145–171.
Cleveland, W. S., Harris, C. S., and McGill, R. (1982). Judgments of circle
sizes on statistical maps. Journal of the American Statistical Association,
77(379):541–547.
Cleveland, W. S., Harris, C. S., and McGill, R. (1983). Human factors and
behavioral science: Experiments on quantitative judgments of graphs and
maps. The Bell System Technical Journal, 62(6):1659–1674.
16
Cleveland, W. S. and McGill, R. (1984). Graphical perception: Theory, experi-
mentation, and application to the development of graphical methods. Journal
of the American Statistical Association, 79(387):531–554.
Csermely, T. and Rabas, A. (2016). How to reveal people’s preferences: Compar-
ing time consistency and predictive power of multiple price list risk elicitation
methods. Journal of Risk and Uncertainty, 53(2-3):107–136.
Dave, C., Eckel, C. C., Johnson, C. A., and Rojas, C. (2010). Eliciting risk pref-
erences: When is simple better? Journal of Risk and Uncertainty, 41(3):219–
243.
Dessalles, J.-L. (2006). A structural model of intuitive probability. In D. Fum,
F. Del Missier & A. Stocco (eds). Trieste, IT: Edizioni Goliardiche: 86-91.
Dohmen, T., Falk, A., Huffman, D., and Sunde, U. (2018). On the relationship
between cognitive ability and risk preference. Journal of Economic Perspec-
tives, 32(2):115–134.
Drichoutis, A. and Lusk, J. (2016). What can multiple price lists really tell us
about risk preferences? Journal of Risk and Uncertainty, 53(2):89–106.
Fontanari, L., Gonzalez, M., Vallortigara, G., and Girotto, V. (2014). Proba-
bilistic cognition in two indigenous mayan groups. Proceedings of the National
Academy of Sciences, 111(48):17075–17080.
Gegax, D., Gerking, S., and Schulze, W. (1991). Perceived risk and the marginal
value of safety. The Review of Economics and Statistics, 73(4):589–596.
Gerking, S., De Haan, M., and Schulze, W. (1988). The marginal value of
job safety: a contingent valuation study. Journal of Risk and Uncertainty,
1(2):185–199.
Harrison, G. W. (2008). Maximum likelihood estimation of utility functions
using stata. University of Central Florida, Working Paper.
Harrison, G. W., Rutstrom, E. E., et al. (2008). Risk aversion in the laboratory.
Research in Experimental Economics, 12(8):41–196.
Hirschauer, N., Musshoff, O., Maart-Noelck, S. C., and Gruener, S. (2014).
Eliciting risk attitudes–how to avoid mean and variance bias in holt-and-laury
lotteries. Applied Economics Letters, 21(1):35–38.
17
Holt, C. A. and Laury, S. K. (2002). Risk aversion and incentive effects. The
American Economic Review, 92(5):1644–1655.
Jacobson, S. and Petrie, R. (2009). Learning from mistakes: What do inconsis-
tent choices over risk tell us? Journal of Risk and Uncertainty, 38(2):143–158.
Krupnick, A., Alberini, A., Cropper, M., Simon, N., O’Brien, B., Goeree, R.,
and Heintzelman, M. (2002). Age, health and the willingness to pay for
mortality risk reductions: a contingent valuation survey of ontario residents.
Journal of Risk and Uncertainty, 24(2):161–186.
Loomes, G., Moffatt, P., and Sudgen, R. (2002). A microeconometric test of al-
ternative stochastic theories of risky choice. Journal of Risk and Uncertainty,
24(2):103–130.
Luce, R. (1959). Response latencies and probabilities. In Arrow, Kenneth J.;
Karlin, Samuel; Suppes, Patrick (eds). Stanford University Press: 298-311.
Meraner, M., Musshoff, O., and Finger, R. (2018). Using involvement to re-
duce inconsistencies in risk preference elicitation. Journal of Behavioral and
Experimental Economics, 73:22–33.
Taylor, M. (2013). Bias and brains: Risk aversion and cognitive ability across
real and hypothetical settings. Journal of Risk and Uncertainty, 46(9):299–
320.
18
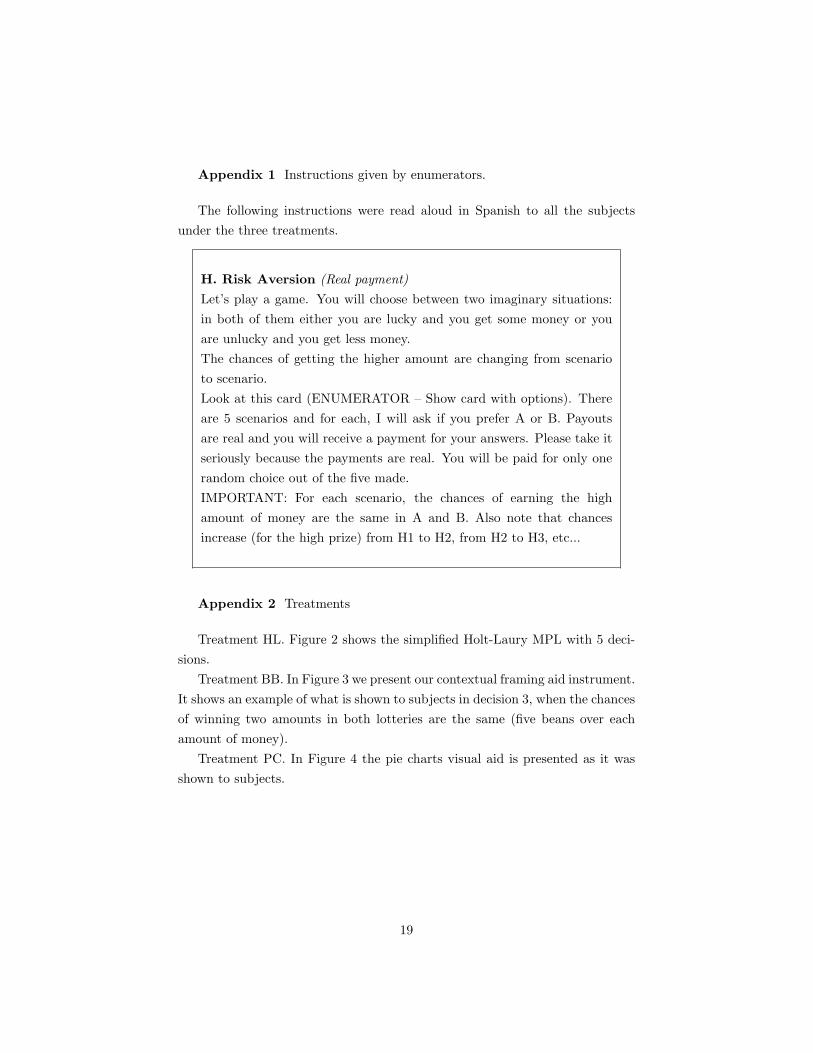
Appendix 1 Instructions given by enumerators.
The following instructions were read aloud in Spanish to all the subjects
under the three treatments.
H. Risk Aversion (Real payment)
Let’s play a game. You will choose between two imaginary situations:
in both of them either you are lucky and you get some money or you
are unlucky and you get less money.
The chances of getting the higher amount are changing from scenario
to scenario.
Look at this card (ENUMERATOR – Show card with options). There
are 5 scenarios and for each, I will ask if you prefer A or B. Payouts
are real and you will receive a payment for your answers. Please take it
seriously because the payments are real. You will be paid for only one
random choice out of the five made.
IMPORTANT: For each scenario, the chances of earning the high
amount of money are the same in A and B. Also note that chances
increase (for the high prize) from H1 to H2, from H2 to H3, etc...
Appendix 2 Treatments
Treatment HL. Figure 2 shows the simplified Holt-Laury MPL with 5 deci-
sions.
Treatment BB. In Figure 3 we present our contextual framing aid instrument.
It shows an example of what is shown to subjects in decision 3, when the chances
of winning two amounts in both lotteries are the same (five beans over each
amount of money).
Treatment PC. In Figure 4 the pie charts visual aid is presented as it was
shown to subjects.
19
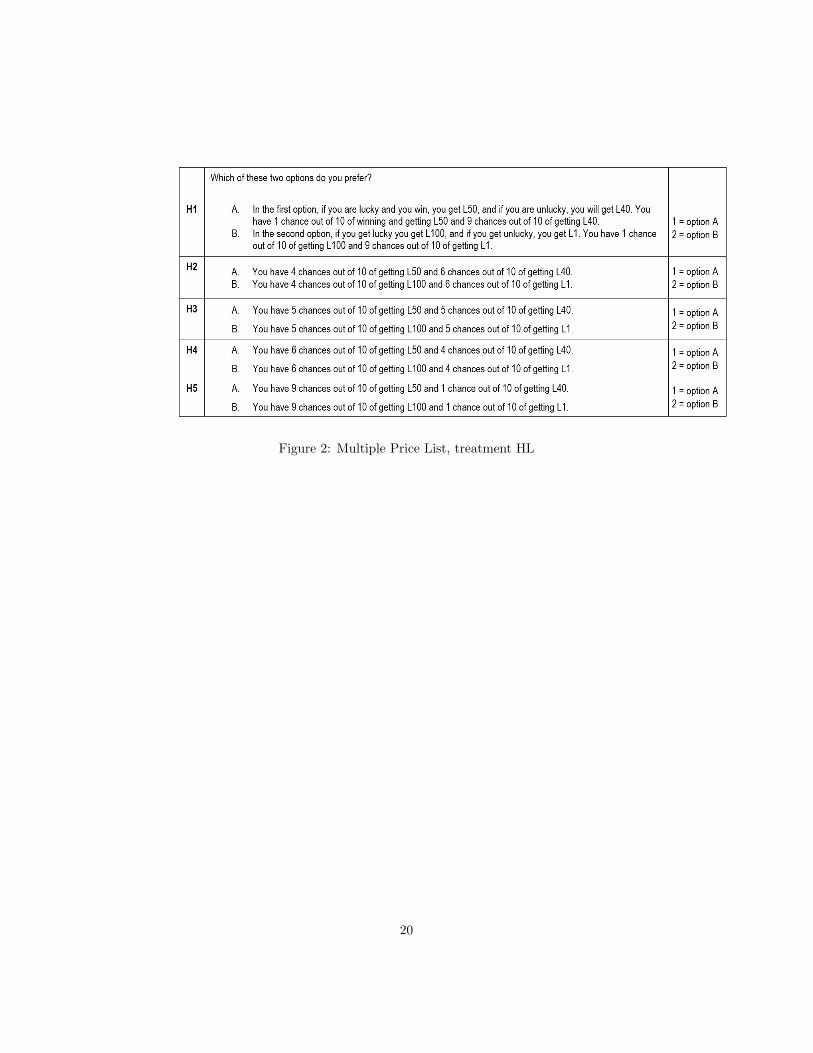
Figure 2: Multiple Price List, treatment HL
20
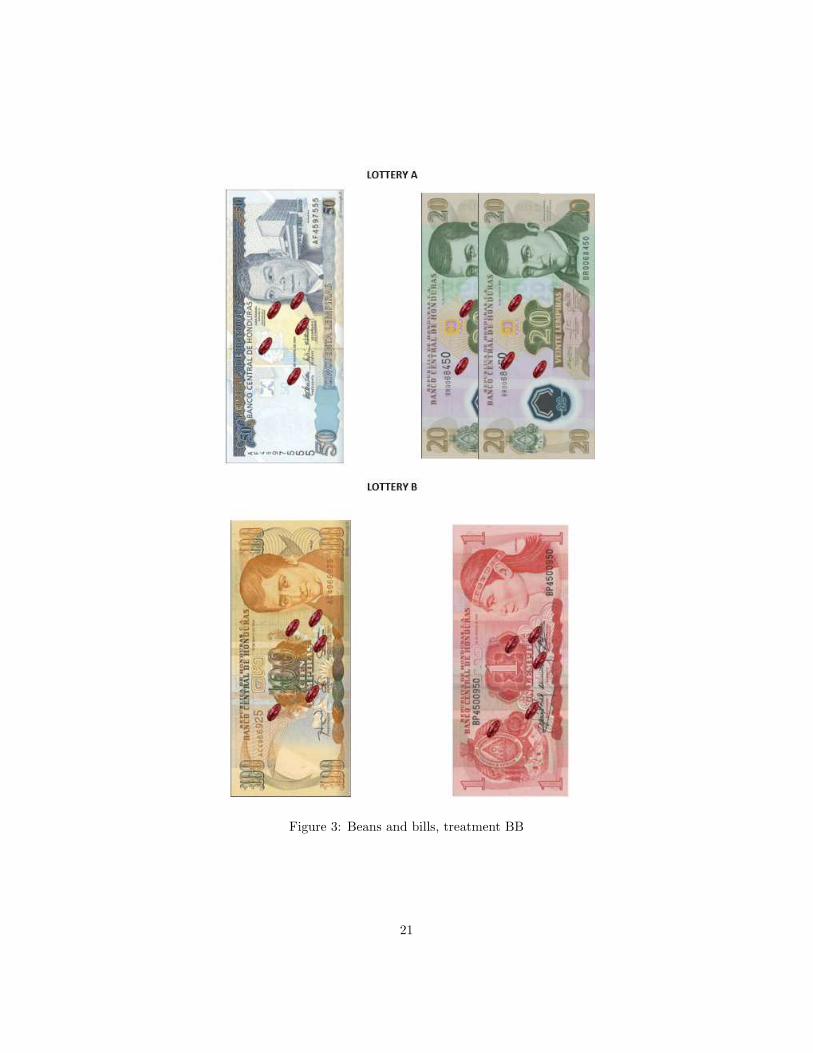
Figure 3: Beans and bills, treatment BB
21
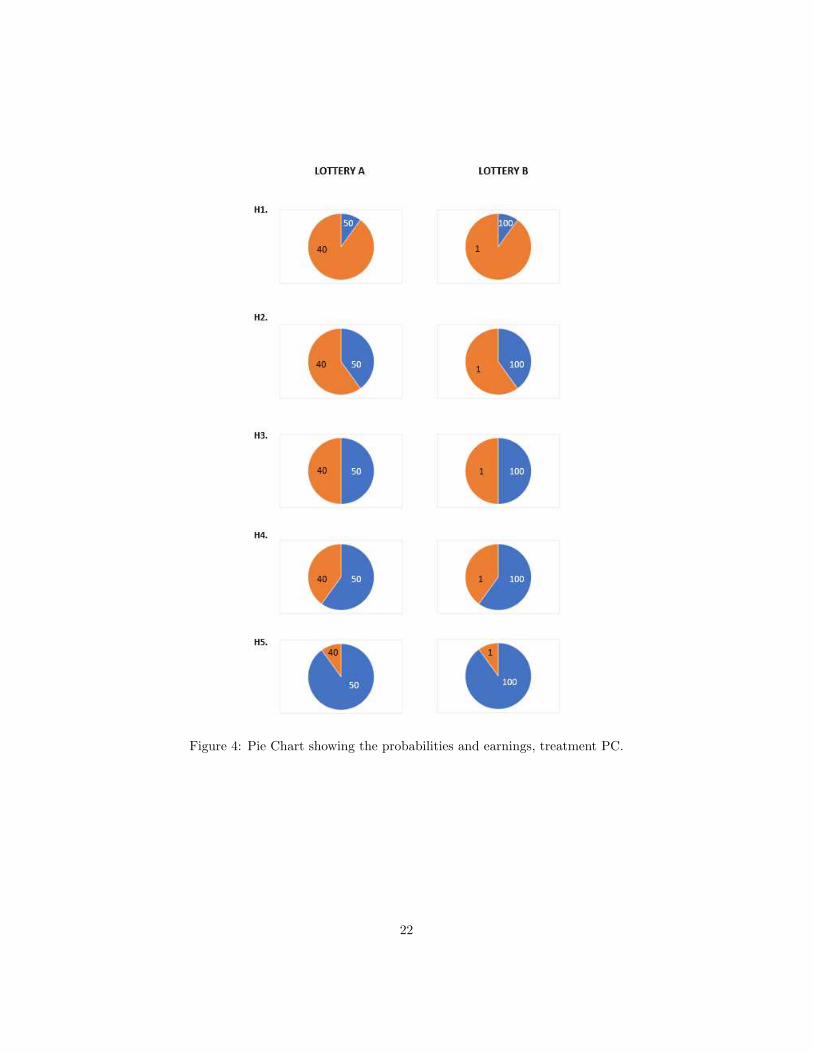
Figure 4: Pie Chart showing the probabilities and earnings, treatment PC.
22


![Comparing Risky Prospects - Lecture Slides › ... › lecture-slides › MIT14_121F15_7S.pdf · Complete Dominance Orderings [Optional] FOSD and SOSD are partial orders on lotteries:](https://img.pdfslide.us/doc/110x75/5f1cabf61eef2c169556386d/comparing-risky-prospects-lecture-slides-a-a-lecture-slides-a-mit14121f157spdf.jpg)