Embed Size (px)
Citation preview
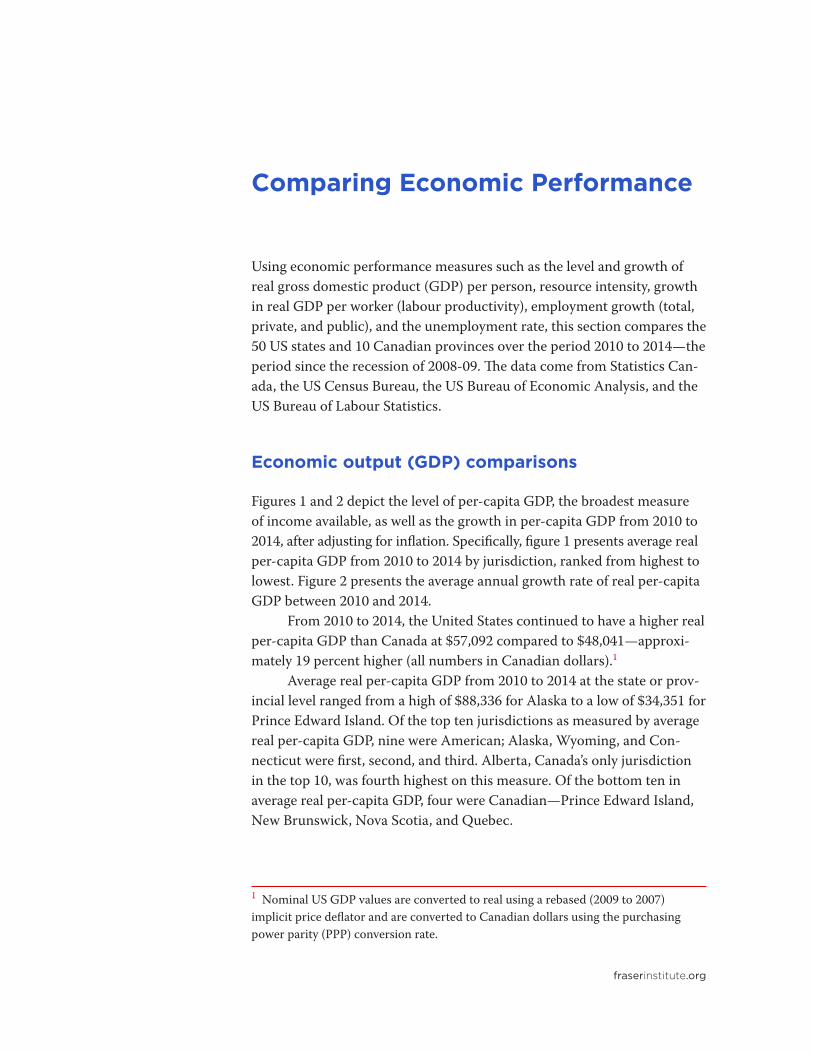
Comparing Recent Economic Performance in Canada and The United States:
Livio Di Matteo, Joel Emes, Charles Lammam, and Ben Eisen
April 2016
A Provincial and State-level Analysis

fraserinstitute.org
April 2016 • Fraser Institute
Comparing Recent Economic Performance in Canada
and the United States: A Provincial and State-Level Analysis
by Livio Di Matteo, Joel Emes, Charles Lammam, and Ben Eisen

fraserinstitute.org
Contents
Executive summary / i
Introduction / 1
Comparing Economic Performance / 3
Analysis and Implications / 18
References / 22
About the authors / 26
Acknowledgments / 27
Publishing information / 28
Supporting the Fraser Institute / 29
Purpose, funding, and independence / 29
About the Fraser Institute / 30
Editorial Advisory Board / 31

fraserinstitute.org
Executive summary
Conventional wisdom holds that Canada weathered the global financial crisis and recession better than most industrialized countries, particularly the United States. It is certainly true that overall, Canada has performed better economically than the United States immediately since the 2008-09 recession. For example, from 2010 to 2014 real (inflation-adjusted) gross domestic product (GDP) per person in the United States grew at an annual average rate of 1.2 percent while in Canada the rate was 1.4 percent.
At a glance, this seems to support the prevailing narrative of post-recession Canadian economic superiority (until the recent collapse in oil prices and weakness in the Canadian economy). However, an examination of sub-national data complicates this narrative considerably. There is sub-stantial variation in the economic performance of the individual provinces and states within each of the two countries.
This study analyzes various sub-national economic indicators in-cluding the level and growth of real GDP per person, resource intensity, growth in real GDP per worker (labour productivity), employment growth (total, private, and public), the unemployment rate and business invest-ment (the latter for Canada only due to data availability). It demonstrates that while Canada’s overall economic performance has been relatively strong in recent years, specific regions and several individual provinces have in fact struggled.
Specifically, Ontario, Quebec, and the Maritimes have performed relatively weakly in the years following the recent recession. In fact, key economic metrics in these provinces and regions are closely aligned with, or are in some cases well below, the anemic American average.
For example, from 2010 to 2014, although relatively weak at just 1.2 percent annually, real per-capita growth in the United States was higher than in every Canadian province east of Manitoba. Average real per per-son growth in regions east of the Prairies ranged from a low of 0.1 percent in New Brunswick to a high of just 1.1 percent in Ontario. While Canada as a whole may have outperformed the United States over the period, some provinces and regions have had levels of economic growth that have either matched, or been significantly below those in the United States.
fraserinstitute.org
ii / Comparing Recent Economic Performance in Canada and the United States
Instead of a simple narrative of Canadian economic superiority, the story that emerges from our analysis of the sub-national data is that very strong economic performance in specific resource-intensive jurisdictions (especially Alberta and Saskatchewan) are largely responsible for Canada’s comparatively strong overall economic record relative to the United States. The very strong performance of these jurisdictions pulls up Canada’s na-tional average, and masks economic weakness elsewhere in the country.
The sub-national data from the United States tells a similar story: resource-intensive states generally show much stronger performance than other states. However, for Canada as a whole, the resource sector makes up a substantially larger share of total economic output (14.2 percent) than that of the US (5.9 percent). The result is that the strong growth rates in Canada’s high performing, resource-intensive jurisdictions raise the national average much more than is the case south of the border, where the resource-intensive jurisdictions represent a comparatively small share of economic output.
Given the marked economic slowdown underway in Canada’s resource-intensive provinces due to depressed commodity prices, there are important implications for Canada’s future growth prospects. The resource boom, with its associated output, employment generation, and capital formation, has halted; at the same time, relatively weak growth in Central and Atlantic Canada persists despite lower commodity prices and a lower Canadian dollar. The key question remains: if energy-intensive provinces are struggling too, which provinces and regions will propel Canada’s future economic growth?
fraserinstitute.org
Introduction
Overall, Canada as a whole has performed better economically (on various measures) than the United States since the recession of 2008-09. However, there is substantial variation in the economic performance of sub-national jurisdictions (provinces and states) within each of the two countries. By focusing only on national statistics, important regional and provincial or state level differences and trends can be overlooked. A closer look at the sub-national statistics demonstrates that while Canada’s overall economic performance may have been comparatively strong in recent years, specific regions and individual provinces have, in fact, struggled.
Specifically, the data show that Ontario, Quebec, and the Maritimes have not performed strongly in the years following the recent recession. In fact, key economic metrics in these jurisdictions are closely aligned with the anemic American average. This complicates the straightforward narra-tive of Canadian economic superiority that was—until the recent collapse in oil prices and weakness in the Canadian economy—prevalent for several years. In other words, national statistics alone give an incomplete picture of the economic picture in Canada and the United States.
This study moves beyond national-level comparisons and examines recent economic performance in individual Canadian provinces and US states. For the 50 US states and 10 Canadian provinces, this paper exam-ines recent state or provincial economic indicators for the post-recession period from 2010 to 2014. Including all US states and Canadian prov-inces allows for a comprehensive comparison among regional economies. Key indicators examined include the growth rates of real gross domestic product (GDP), employment (in total, and within the private and public sectors), and labour productivity. We also compare unemployment rates across the various jurisdictions.
The analysis of the sub-national data shows that rather than a straightforward story of superior Canadian economic performance, the very strong economic performance in Canada’s energy and resource-in-tensive jurisdictions is largely responsible for the country’s comparatively strong overall economic performance in recent years relative to the United States. A focus on national statistics alone hides the economic strength of
fraserinstitute.org
2 / Comparing Recent Economic Performance in Canada and the United States
Canada’s resource-intensive jurisdictions and the considerable economic weakness in other areas of the country.
The sub-national American data tell a somewhat similar story: economic performance is much stronger in resource-intensive states and much weaker in most other states. The key difference between the two countries is that energy producers in the US make up a substantially smaller share of total output than they do in Canada. As a result, the strong economic performance of energy-intensive jurisdictions in Canada has raised Canada’s national economic performance metrics more than is the case in the United States.
The analysis raises pressing concerns about Canada’s near-term economic prospects. Given that depressed commodity prices have led to a marked economic slowdown in Canada’s resource dependent provinces, there are questions about where Canada’s future growth and economic strength will come from. Moreover, the continuing slow real growth of the US economy also raises concerns about Canada’s near- and longer-term economic prospects. This is especially troubling given the recent weak eco-nomic performance of Central and Atlantic Canada. The analysis also dem-onstrates that the prevalent narrative of a thriving Canada outperforming a struggling America is, at best, a serious oversimplification.
This study’s first section compares economic performance in Canada and the United States both at the national and sub-national levels using a host of different measures. The following section analyzes these results and briefly discusses their policy implications.
fraserinstitute.org
Comparing Economic Performance
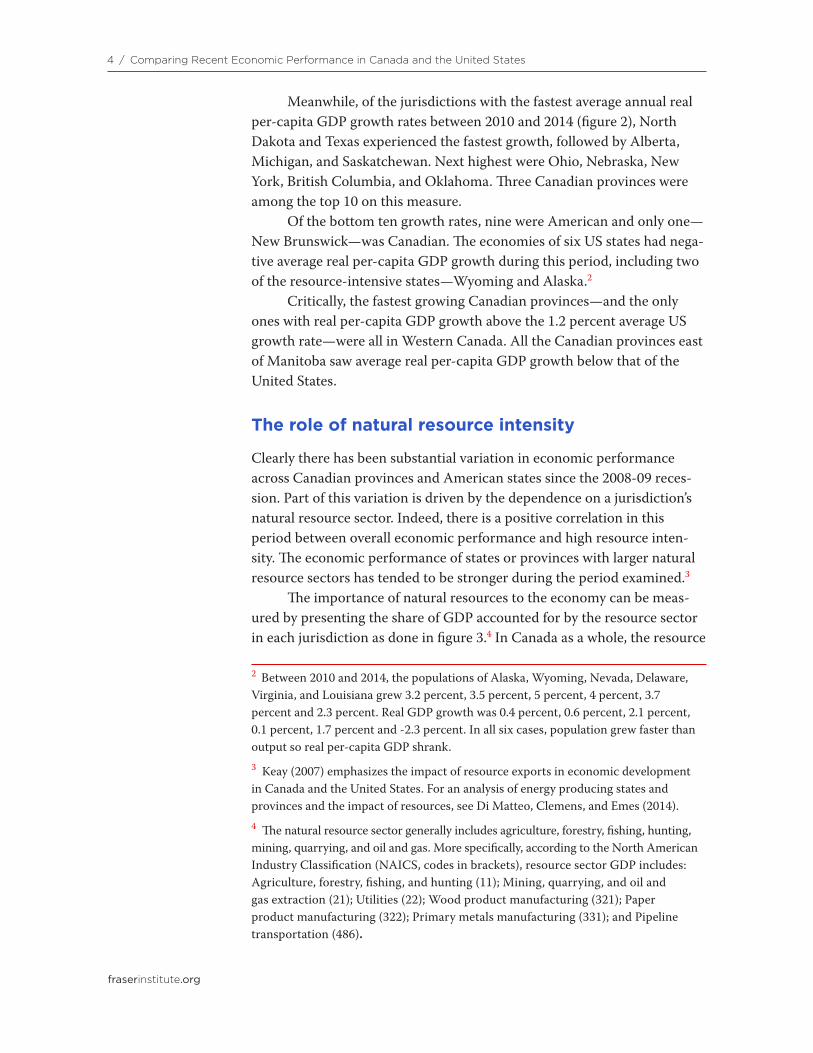
Using economic performance measures such as the level and growth of real gross domestic product (GDP) per person, resource intensity, growth in real GDP per worker (labour productivity), employment growth (total, private, and public), and the unemployment rate, this section compares the 50 US states and 10 Canadian provinces over the period 2010 to 2014—the period since the recession of 2008-09. The data come from Statistics Can-ada, the US Census Bureau, the US Bureau of Economic Analysis, and the US Bureau of Labour Statistics.
Economic output (GDP) comparisons
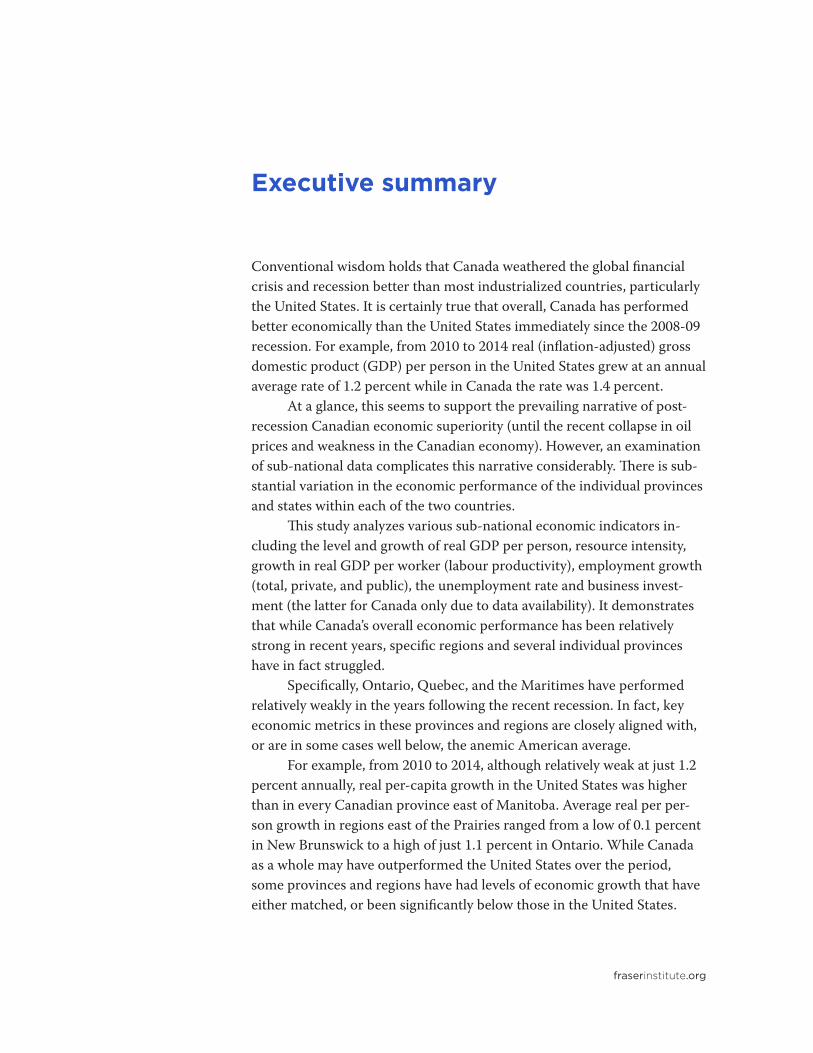
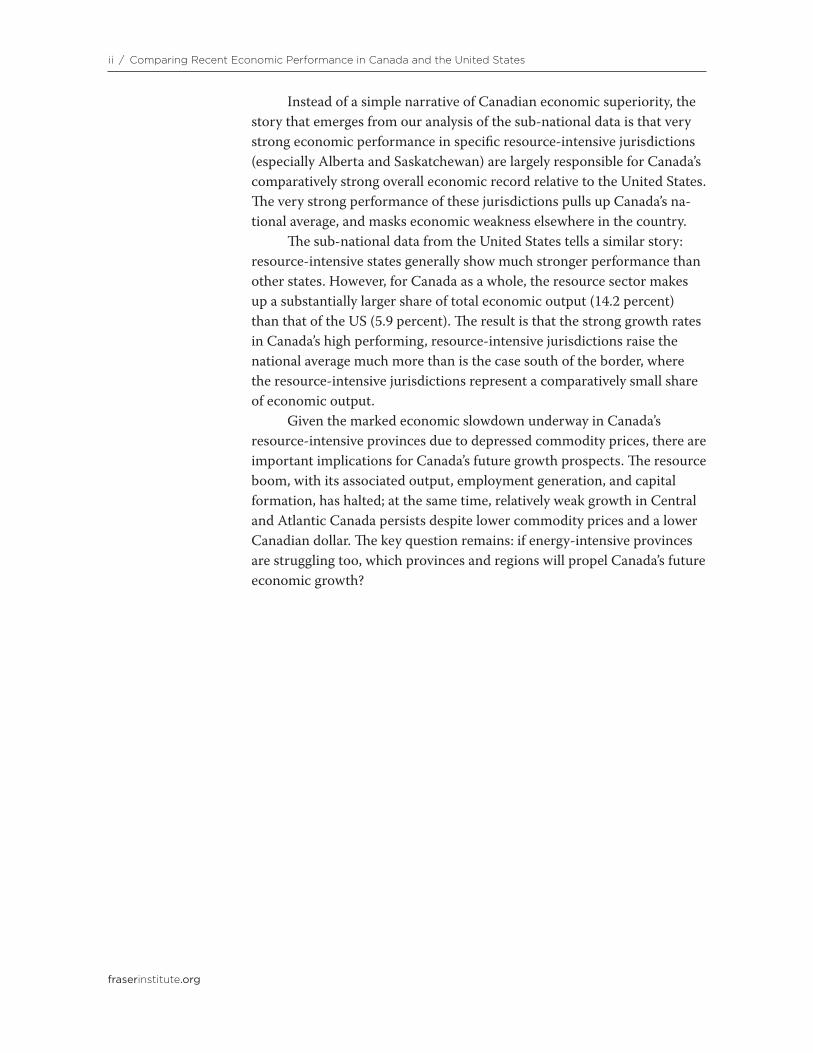
Figures 1 and 2 depict the level of per-capita GDP, the broadest measure of income available, as well as the growth in per-capita GDP from 2010 to 2014, after adjusting for inflation. Specifically, figure 1 presents average real per-capita GDP from 2010 to 2014 by jurisdiction, ranked from highest to lowest. Figure 2 presents the average annual growth rate of real per-capita GDP between 2010 and 2014.
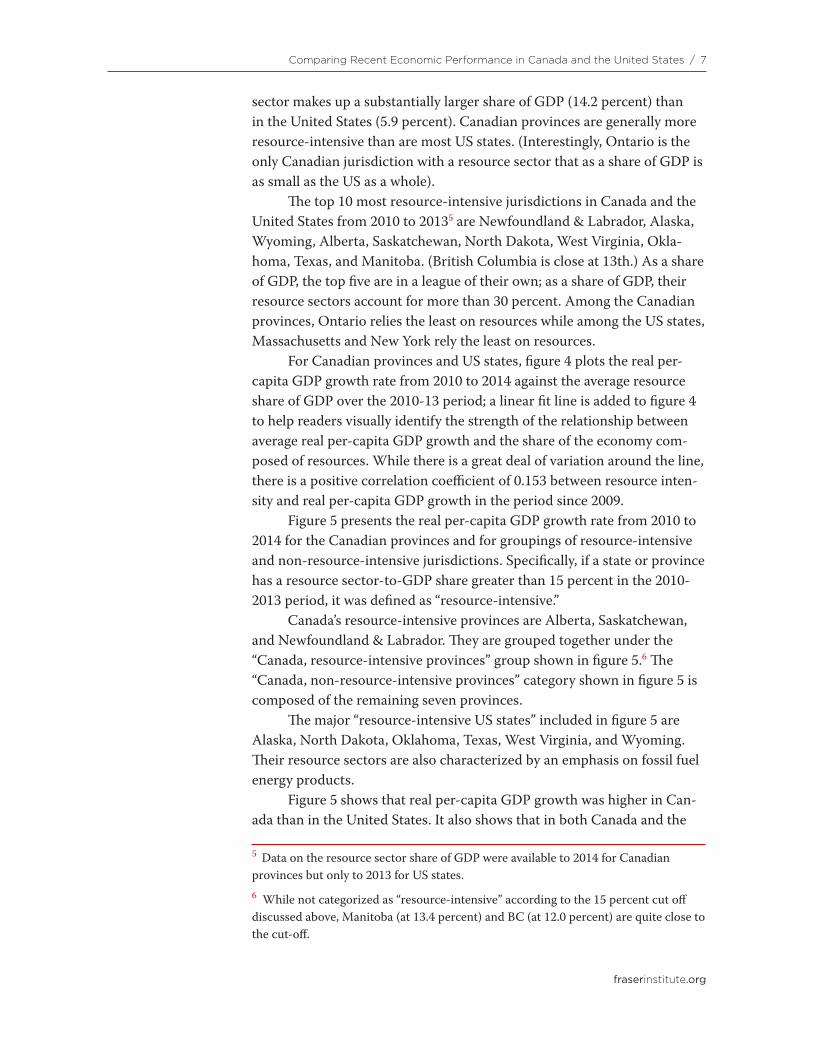
From 2010 to 2014, the United States continued to have a higher real per-capita GDP than Canada at $57,092 compared to $48,041—approxi-mately 19 percent higher (all numbers in Canadian dollars).1
Average real per-capita GDP from 2010 to 2014 at the state or prov-incial level ranged from a high of $88,336 for Alaska to a low of $34,351 for Prince Edward Island. Of the top ten jurisdictions as measured by average real per-capita GDP, nine were American; Alaska, Wyoming, and Con-necticut were first, second, and third. Alberta, Canada’s only jurisdiction in the top 10, was fourth highest on this measure. Of the bottom ten in average real per-capita GDP, four were Canadian—Prince Edward Island, New Brunswick, Nova Scotia, and Quebec.
1 Nominal US GDP values are converted to real using a rebased (2009 to 2007) implicit price deflator and are converted to Canadian dollars using the purchasing power parity (PPP) conversion rate.
fraserinstitute.org
4 / Comparing Recent Economic Performance in Canada and the United States
Meanwhile, of the jurisdictions with the fastest average annual real per-capita GDP growth rates between 2010 and 2014 (figure 2), North Dakota and Texas experienced the fastest growth, followed by Alberta, Michigan, and Saskatchewan. Next highest were Ohio, Nebraska, New York, British Columbia, and Oklahoma. Three Canadian provinces were among the top 10 on this measure.
Of the bottom ten growth rates, nine were American and only one—New Brunswick—was Canadian. The economies of six US states had nega-tive average real per-capita GDP growth during this period, including two of the resource-intensive states—Wyoming and Alaska.2
Critically, the fastest growing Canadian provinces—and the only ones with real per-capita GDP growth above the 1.2 percent average US growth rate—were all in Western Canada. All the Canadian provinces east of Manitoba saw average real per-capita GDP growth below that of the United States.
The role of natural resource intensity
Clearly there has been substantial variation in economic performance across Canadian provinces and American states since the 2008-09 reces-sion. Part of this variation is driven by the dependence on a jurisdiction’s natural resource sector. Indeed, there is a positive correlation in this period between overall economic performance and high resource inten-sity. The economic performance of states or provinces with larger natural resource sectors has tended to be stronger during the period examined.3
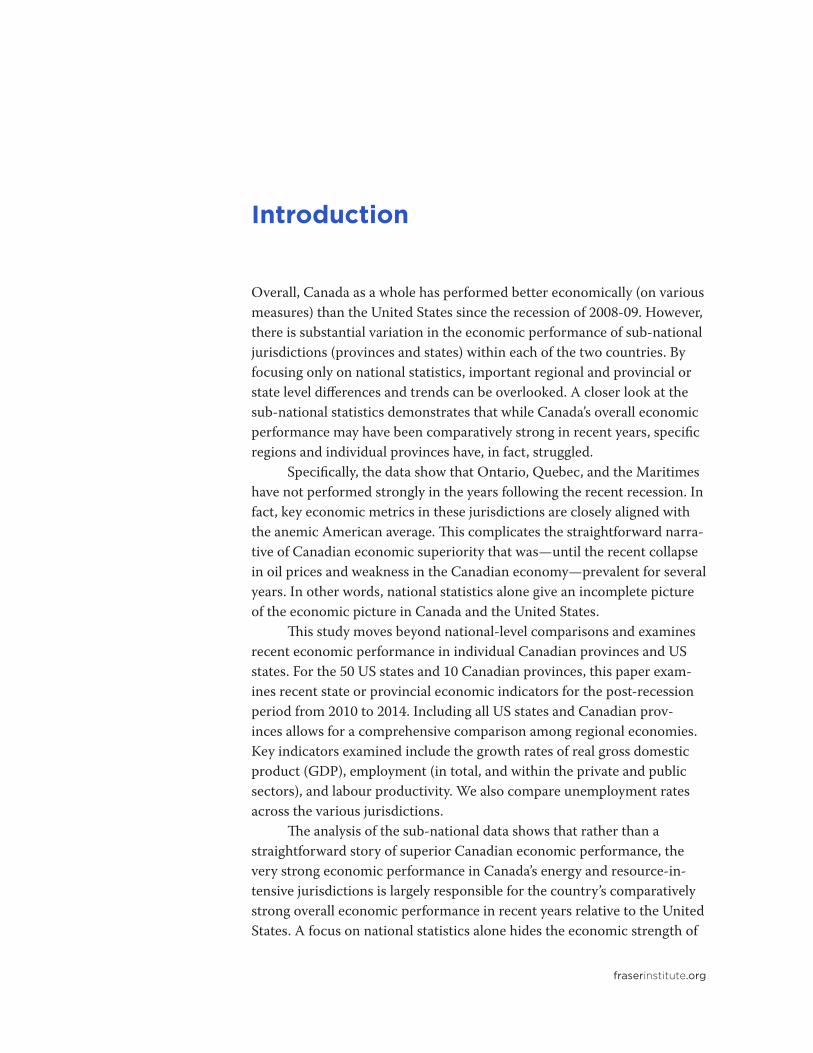
The importance of natural resources to the economy can be meas-ured by presenting the share of GDP accounted for by the resource sector in each jurisdiction as done in figure 3.4 In Canada as a whole, the resource
2 Between 2010 and 2014, the populations of Alaska, Wyoming, Nevada, Delaware, Virginia, and Louisiana grew 3.2 percent, 3.5 percent, 5 percent, 4 percent, 3.7 percent and 2.3 percent. Real GDP growth was 0.4 percent, 0.6 percent, 2.1 percent, 0.1 percent, 1.7 percent and -2.3 percent. In all six cases, population grew faster than output so real per-capita GDP shrank.3 Keay (2007) emphasizes the impact of resource exports in economic development in Canada and the United States. For an analysis of energy producing states and provinces and the impact of resources, see Di Matteo, Clemens, and Emes (2014). 4 The natural resource sector generally includes agriculture, forestry, fishing, hunting, mining, quarrying, and oil and gas. More specifically, according to the North American Industry Classification (NAICS, codes in brackets), resource sector GDP includes: Agriculture, forestry, fishing, and hunting (11); Mining, quarrying, and oil and gas extraction (21); Utilities (22); Wood product manufacturing (321); Paper product manufacturing (322); Primary metals manufacturing (331); and Pipeline transportation (486).
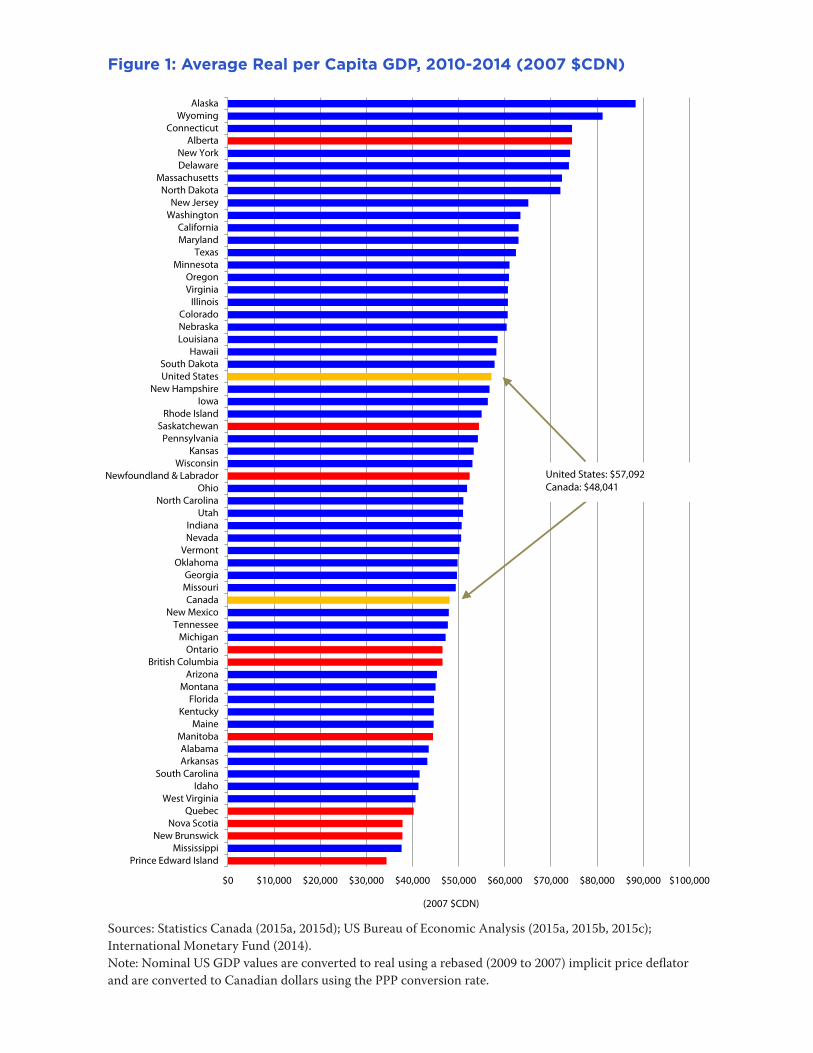
Figure 1: Average Real per Capita GDP, 2010-2014 (2007 $CDN)
Sources: Statistics Canada (2015a, 2015d); US Bureau of Economic Analysis (2015a, 2015b, 2015c); International Monetary Fund (2014). Note: Nominal US GDP values are converted to real using a rebased (2009 to 2007) implicit price deflator and are converted to Canadian dollars using the PPP conversion rate.
$0 $10,000 $20,000 $30,000 $40,000 $50,000 $60,000 $70,000 $80,000 $90,000 $100,000
Prince Edward IslandMississippi
New BrunswickNova Scotia
QuebecWest Virginia
IdahoSouth Carolina
ArkansasAlabama
ManitobaMaine
KentuckyFlorida
MontanaArizona
British ColumbiaOntario
MichiganTennessee
New MexicoCanada
MissouriGeorgia
OklahomaVermont
NevadaIndiana
UtahNorth Carolina
OhioNewfoundland & Labrador
WisconsinKansas
PennsylvaniaSaskatchewan
Rhode IslandIowa
New HampshireUnited StatesSouth Dakota
HawaiiLouisianaNebraskaColorado
IllinoisVirginiaOregon
MinnesotaTexas
MarylandCalifornia
WashingtonNew Jersey
North DakotaMassachusetts
DelawareNew York
AlbertaConnecticut
WyomingAlaska
(2007 $CDN)
United States: $57,092Canada: $48,041
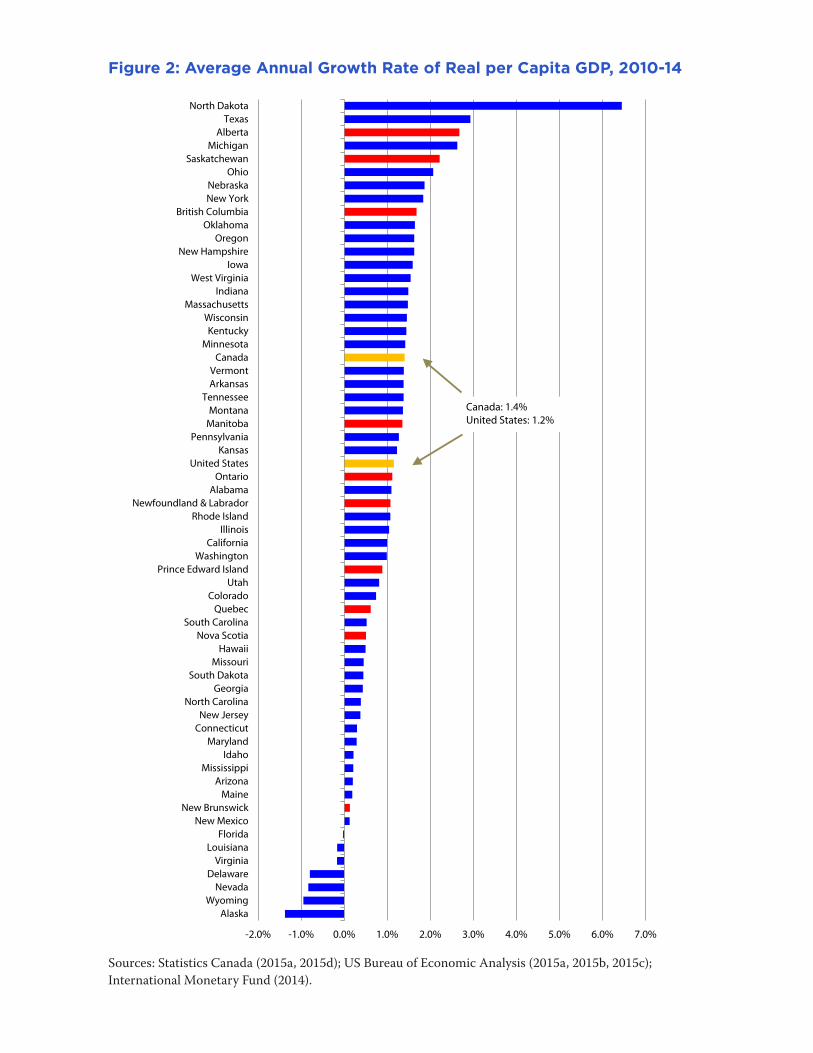
Figure 2: Average Annual Growth Rate of Real per Capita GDP, 2010-14
Sources: Statistics Canada (2015a, 2015d); US Bureau of Economic Analysis (2015a, 2015b, 2015c); International Monetary Fund (2014).
-2.0% -1.0% 0.0% 1.0% 2.0% 3.0% 4.0% 5.0% 6.0% 7.0%
AlaskaWyoming
NevadaDelaware
VirginiaLouisiana
FloridaNew Mexico
New BrunswickMaine
ArizonaMississippi
IdahoMaryland
ConnecticutNew Jersey
North CarolinaGeorgia
South DakotaMissouri
HawaiiNova Scotia
South CarolinaQuebec
ColoradoUtah
Prince Edward IslandWashington
CaliforniaIllinois
Rhode IslandNewfoundland & Labrador
AlabamaOntario
United StatesKansas
PennsylvaniaManitobaMontana
TennesseeArkansasVermont
CanadaMinnesota
KentuckyWisconsin
MassachusettsIndiana
West VirginiaIowa
New HampshireOregon
OklahomaBritish Columbia
New YorkNebraska
OhioSaskatchewan
MichiganAlberta
TexasNorth Dakota
Canada: 1.4%United States: 1.2%
fraserinstitute.org
Comparing Recent Economic Performance in Canada and the United States / 7
sector makes up a substantially larger share of GDP (14.2 percent) than in the United States (5.9 percent). Canadian provinces are generally more resource-intensive than are most US states. (Interestingly, Ontario is the only Canadian jurisdiction with a resource sector that as a share of GDP is as small as the US as a whole).
The top 10 most resource-intensive jurisdictions in Canada and the United States from 2010 to 20135 are Newfoundland & Labrador, Alaska, Wyoming, Alberta, Saskatchewan, North Dakota, West Virginia, Okla-homa, Texas, and Manitoba. (British Columbia is close at 13th.) As a share of GDP, the top five are in a league of their own; as a share of GDP, their resource sectors account for more than 30 percent. Among the Canadian provinces, Ontario relies the least on resources while among the US states, Massachusetts and New York rely the least on resources.
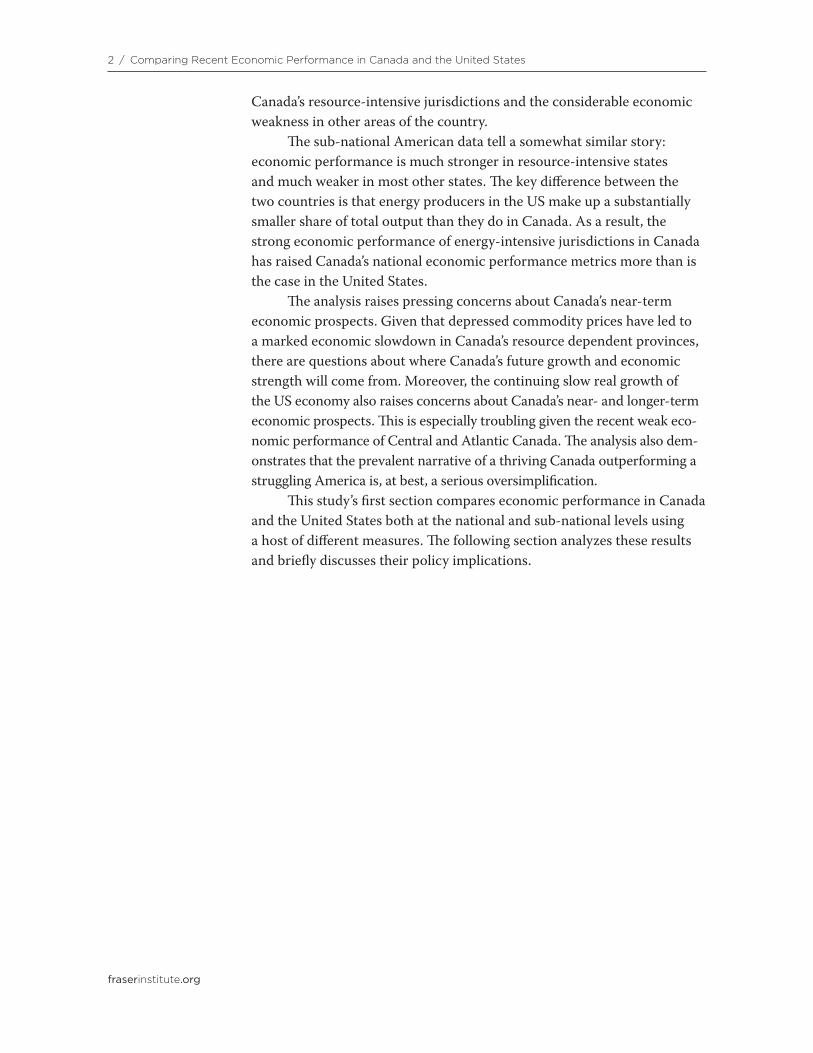
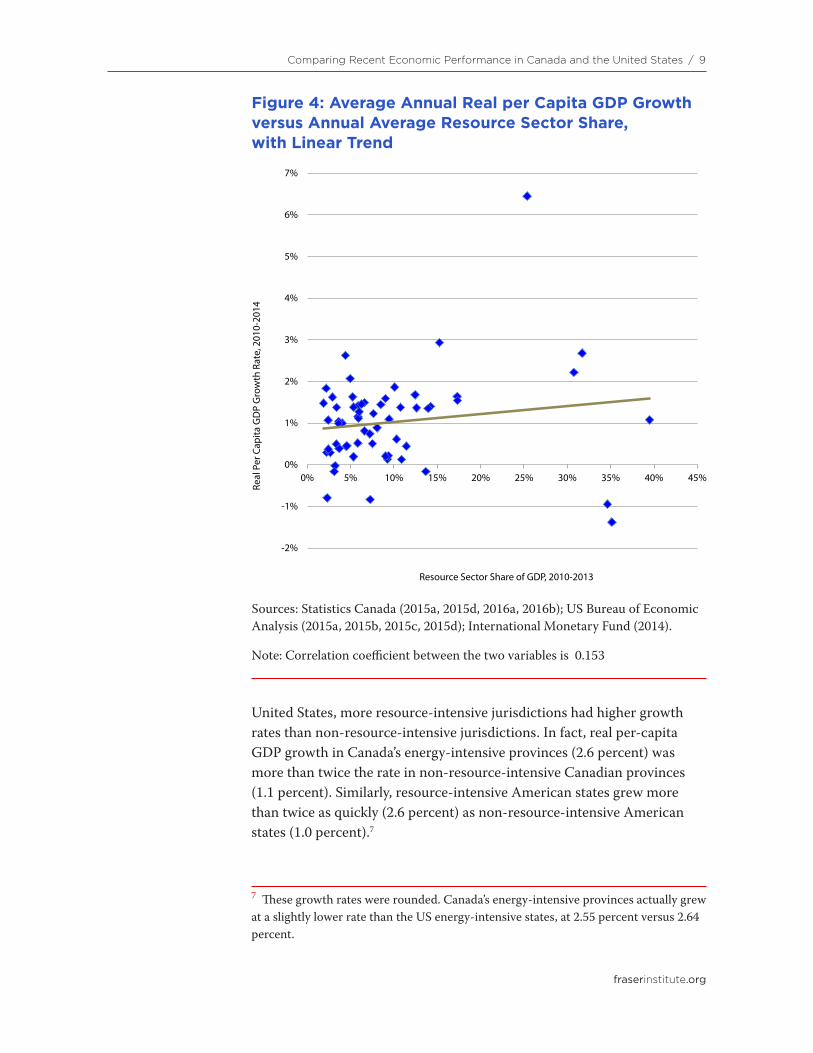
For Canadian provinces and US states, figure 4 plots the real per-capita GDP growth rate from 2010 to 2014 against the average resource share of GDP over the 2010-13 period; a linear fit line is added to figure 4 to help readers visually identify the strength of the relationship between average real per-capita GDP growth and the share of the economy com-posed of resources. While there is a great deal of variation around the line, there is a positive correlation coefficient of 0.153 between resource inten-sity and real per-capita GDP growth in the period since 2009.
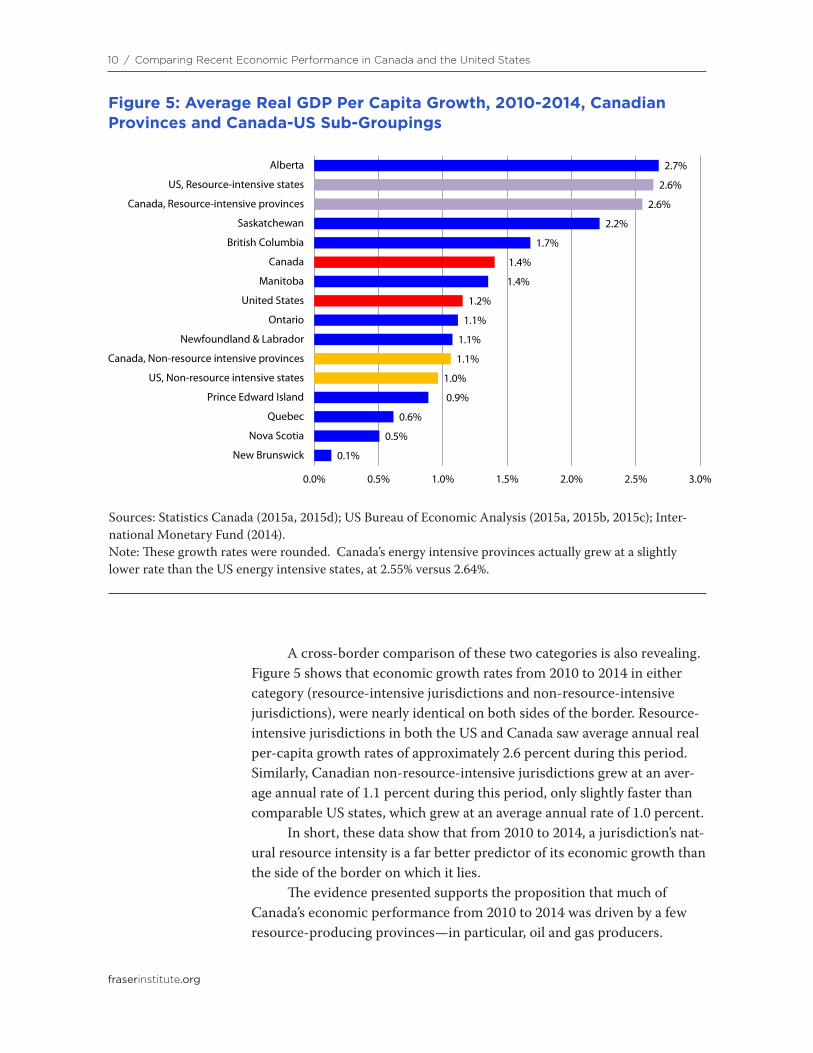
Figure 5 presents the real per-capita GDP growth rate from 2010 to 2014 for the Canadian provinces and for groupings of resource-intensive and non-resource-intensive jurisdictions. Specifically, if a state or province has a resource sector-to-GDP share greater than 15 percent in the 2010-2013 period, it was defined as “resource-intensive.”
Canada’s resource-intensive provinces are Alberta, Saskatchewan, and Newfoundland & Labrador. They are grouped together under the “Canada, resource-intensive provinces” group shown in figure 5.6 The “Canada, non-resource-intensive provinces” category shown in figure 5 is composed of the remaining seven provinces.
The major “resource-intensive US states” included in figure 5 are Alaska, North Dakota, Oklahoma, Texas, West Virginia, and Wyoming. Their resource sectors are also characterized by an emphasis on fossil fuel energy products.
Figure 5 shows that real per-capita GDP growth was higher in Can-ada than in the United States. It also shows that in both Canada and the
5 Data on the resource sector share of GDP were available to 2014 for Canadian provinces but only to 2013 for US states.6 While not categorized as “resource-intensive” according to the 15 percent cut off discussed above, Manitoba (at 13.4 percent) and BC (at 12.0 percent) are quite close to the cut-off.
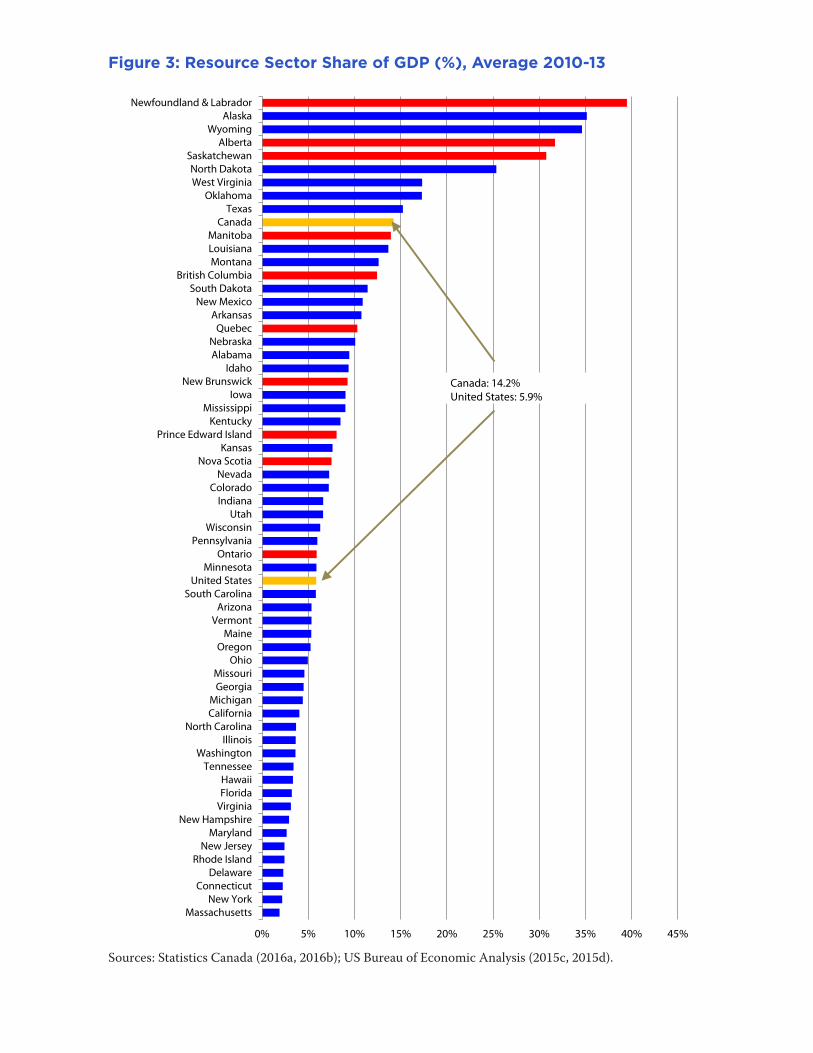
Figure 3: Resource Sector Share of GDP (%), Average 2010-13
Sources: Statistics Canada (2016a, 2016b); US Bureau of Economic Analysis (2015c, 2015d).
0% 5% 10% 15% 20% 25% 30% 35% 40% 45%
MassachusettsNew York
ConnecticutDelaware
Rhode IslandNew Jersey
MarylandNew Hampshire
VirginiaFloridaHawaii
TennesseeWashington
IllinoisNorth Carolina
CaliforniaMichigan
GeorgiaMissouri
OhioOregon
MaineVermont
ArizonaSouth Carolina
United StatesMinnesota
OntarioPennsylvania
WisconsinUtah
IndianaColorado
NevadaNova Scotia
KansasPrince Edward Island
KentuckyMississippi
IowaNew Brunswick
IdahoAlabamaNebraska
QuebecArkansas
New MexicoSouth Dakota
British ColumbiaMontanaLouisianaManitoba
CanadaTexas
OklahomaWest VirginiaNorth Dakota
SaskatchewanAlberta
WyomingAlaska
Newfoundland & Labrador
Canada: 14.2%United States: 5.9%
fraserinstitute.org
Comparing Recent Economic Performance in Canada and the United States / 9
United States, more resource-intensive jurisdictions had higher growth rates than non-resource-intensive jurisdictions. In fact, real per-capita GDP growth in Canada’s energy-intensive provinces (2.6 percent) was more than twice the rate in non-resource-intensive Canadian provinces (1.1 percent). Similarly, resource-intensive American states grew more than twice as quickly (2.6 percent) as non-resource-intensive American states (1.0 percent).7
7 These growth rates were rounded. Canada’s energy-intensive provinces actually grew at a slightly lower rate than the US energy-intensive states, at 2.55 percent versus 2.64 percent.
Figure 4: Average Annual Real per Capita GDP Growth versus Annual Average Resource Sector Share, with Linear Trend
Sources: Statistics Canada (2015a, 2015d, 2016a, 2016b); US Bureau of Economic Analysis (2015a, 2015b, 2015c, 2015d); International Monetary Fund (2014).
Note: Correlation coefficient between the two variables is 0.153
-2%
-1%
0%
1%
2%
3%
4%
5%
6%
7%
0% 5% 10% 15% 20% 25% 30% 35% 40% 45%
Real
Per
Cap
ita G
DP
Gro
wth
Rat
e, 2
010-
2014
Resource Sector Share of GDP, 2010-2013
fraserinstitute.org
10 / Comparing Recent Economic Performance in Canada and the United States
A cross-border comparison of these two categories is also revealing. Figure 5 shows that economic growth rates from 2010 to 2014 in either category (resource-intensive jurisdictions and non-resource-intensive jurisdictions), were nearly identical on both sides of the border. Resource-intensive jurisdictions in both the US and Canada saw average annual real per-capita growth rates of approximately 2.6 percent during this period. Similarly, Canadian non-resource-intensive jurisdictions grew at an aver-age annual rate of 1.1 percent during this period, only slightly faster than comparable US states, which grew at an average annual rate of 1.0 percent.
In short, these data show that from 2010 to 2014, a jurisdiction’s nat-ural resource intensity is a far better predictor of its economic growth than the side of the border on which it lies.
The evidence presented supports the proposition that much of Canada’s economic performance from 2010 to 2014 was driven by a few resource-producing provinces—in particular, oil and gas producers.
Figure 5: Average Real GDP Per Capita Growth, 2010-2014, Canadian Provinces and Canada-US Sub-Groupings
Sources: Statistics Canada (2015a, 2015d); US Bureau of Economic Analysis (2015a, 2015b, 2015c); Inter-national Monetary Fund (2014). Note: These growth rates were rounded. Canada’s energy intensive provinces actually grew at a slightly lower rate than the US energy intensive states, at 2.55% versus 2.64%.
0.1%
0.5%
0.6%
0.9%
1.0%
1.1%
1.1%
1.1%
1.2%
1.4%
1.4%
1.7%
2.2%
2.6%
2.6%
2.7%
0.0% 0.5% 1.0% 1.5% 2.0% 2.5% 3.0%
New Brunswick
Nova Scotia
Quebec
Prince Edward Island
US, Non-resource intensive states
Canada, Non-resource intensive provinces
Newfoundland & Labrador
Ontario
United States
Manitoba
Canada
British Columbia
Saskatchewan
Canada, Resource-intensive provinces
US, Resource-intensive states
Alberta
fraserinstitute.org
Comparing Recent Economic Performance in Canada and the United States / 11
While resource-intensive American states also demonstrated good eco-nomic performance, natural resource producers in the US make up a much smaller share of that country’s total output than they do in Canada. Consequently, Canada’s resource-intensive provinces made a propor-tionally greater contribution to national economic growth than did their US counterparts. The question now, however, is this: in light of recent depressed commodity prices and weakening economies in Canada’s resource-intensive provinces, where will Canada’s future robust growth come from, given the general lacklustre performance east of Manitoba in recent years?
Productivity comparisons
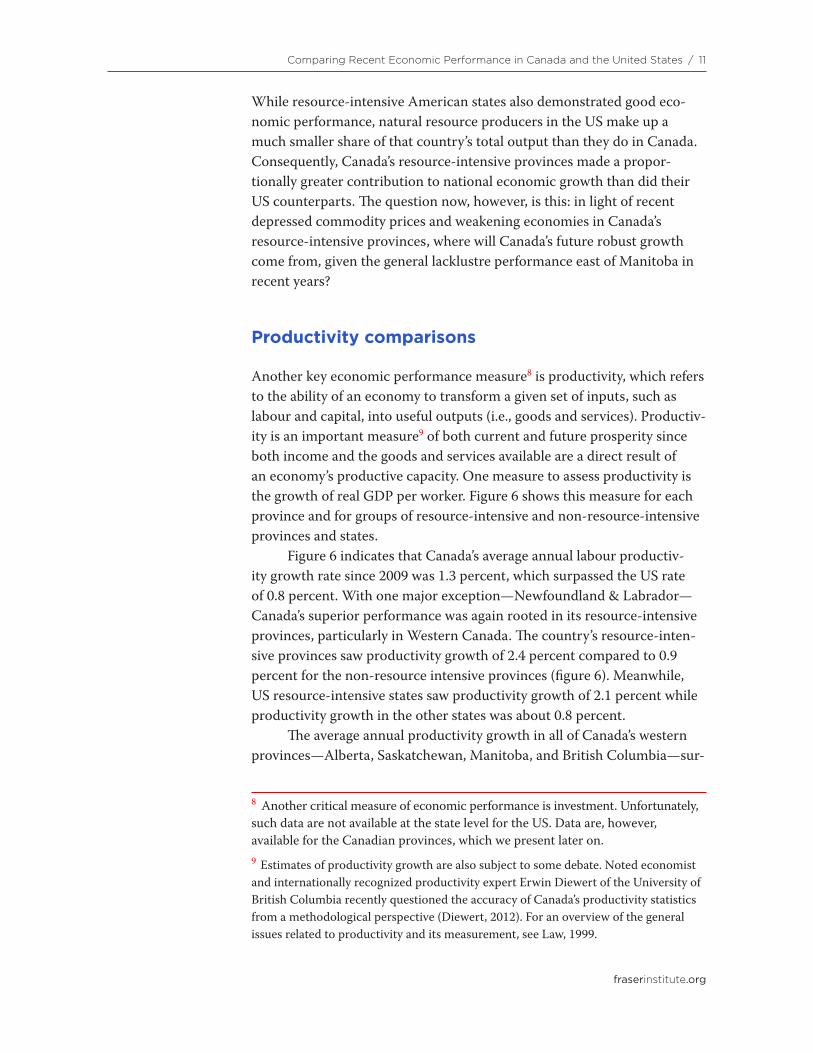
Another key economic performance measure8 is productivity, which refers to the ability of an economy to transform a given set of inputs, such as labour and capital, into useful outputs (i.e., goods and services). Productiv-ity is an important measure9 of both current and future prosperity since both income and the goods and services available are a direct result of an economy’s productive capacity. One measure to assess productivity is the growth of real GDP per worker. Figure 6 shows this measure for each province and for groups of resource-intensive and non-resource-intensive provinces and states.
Figure 6 indicates that Canada’s average annual labour productiv-ity growth rate since 2009 was 1.3 percent, which surpassed the US rate of 0.8 percent. With one major exception—Newfoundland & Labrador—Canada’s superior performance was again rooted in its resource-intensive provinces, particularly in Western Canada. The country’s resource-inten-sive provinces saw productivity growth of 2.4 percent compared to 0.9 percent for the non-resource intensive provinces (figure 6). Meanwhile, US resource-intensive states saw productivity growth of 2.1 percent while productivity growth in the other states was about 0.8 percent.
The average annual productivity growth in all of Canada’s western provinces—Alberta, Saskatchewan, Manitoba, and British Columbia—sur-
8 Another critical measure of economic performance is investment. Unfortunately, such data are not available at the state level for the US. Data are, however, available for the Canadian provinces, which we present later on.9 Estimates of productivity growth are also subject to some debate. Noted economist and internationally recognized productivity expert Erwin Diewert of the University of British Columbia recently questioned the accuracy of Canada’s productivity statistics from a methodological perspective (Diewert, 2012). For an overview of the general issues related to productivity and its measurement, see Law, 1999.
fraserinstitute.org
12 / Comparing Recent Economic Performance in Canada and the United States
Figure 7: Average Growth Rate of Total Employment, 2010-2014, Canadian Provinces and Canada-US Sub-Groupings
Sources: Statistics Canada (2015b); U.S. Department of Labor (2010-2014a, 2015a).
Figure 6: Average Growth Rate of Real GDP per Worker, 2010-2014, Canadian Provinces and Canada-US Sub-Groupings
Sources: Statistics Canada (2015b, 2015d); US Bureau of Economic Analysis (2015b, 2015c); US Department of Labor (2010-2014a, 2015a); International Monetary Fund (2014).
-0.3%
-0.1%
0.8%
0.8%
0.9%
1.0%
1.1%
1.2%
1.3%
1.3%
1.7%
1.7%
2.0%
2.1%
2.2%
2.3%
-0.5% 0.0% 0.5% 1.0% 1.5% 2.0% 2.5%
New Brunswick .
Nova Scotia .
British Columbia
US, Non-resource intensive states
Manitoba
Quebec
Canada, Non-resource intensive provinces
United States
Canada
Ontario
Saskatchewan
Prince Edward Island
US, Resource-intensive states
Newfoundland and Labrador
Canada, Resource-intensive provinces
Alberta
-0.5%
0.1%
0.5%
0.6%
0.7%
0.8%
0.8%
0.8%
0.9%
1.3%
1.7%
1.9%
2.1%
2.2%
2.4%
2.7%
-1.0% -0.5% 0.0% 0.5% 1.0% 1.5% 2.0% 2.5% 3.0%
Newfoundland & Labrador .
Prince Edward Island
Quebec
New Brunswick
Nova Scotia
United States
Ontario
US, Non-resource intensive states
Canada, Non-resource intensive provinces
Canada
Manitoba
British Columbia
US, Resource-intensive states
Saskatchewan
Canada, Resource-intensive provinces
Alberta
fraserinstitute.org
Comparing Recent Economic Performance in Canada and the United States / 13
passed 1.7 percent. On the other hand, Ontario, Quebec, and the Atlan-tic provinces all had poor productivity growth compared to the western provinces. Newfoundland & Labrador, despite being resource-intensive, actually saw negative productivity growth (that is, a drop in productiv-ity). This geographically lopsided economic performance is particularly troubling given the current downturn in Canada’s energy sector, which is affecting Alberta and Saskatchewan in particular.
When it comes to labour productivity, US states account for seven of the top 10 productivity growth jurisdictions: North Dakota is in first place, recording an average annual growth in real GDP per worker of 5.6 percent from 2010 to 2014. Alberta, Saskatchewan, and British Columbia are the only Canadian provinces amongst the top ten on this measure. Aside from Manitoba, which placed 14th, all the remaining Canadian provinces rank in the bottom half.
Labour market performance
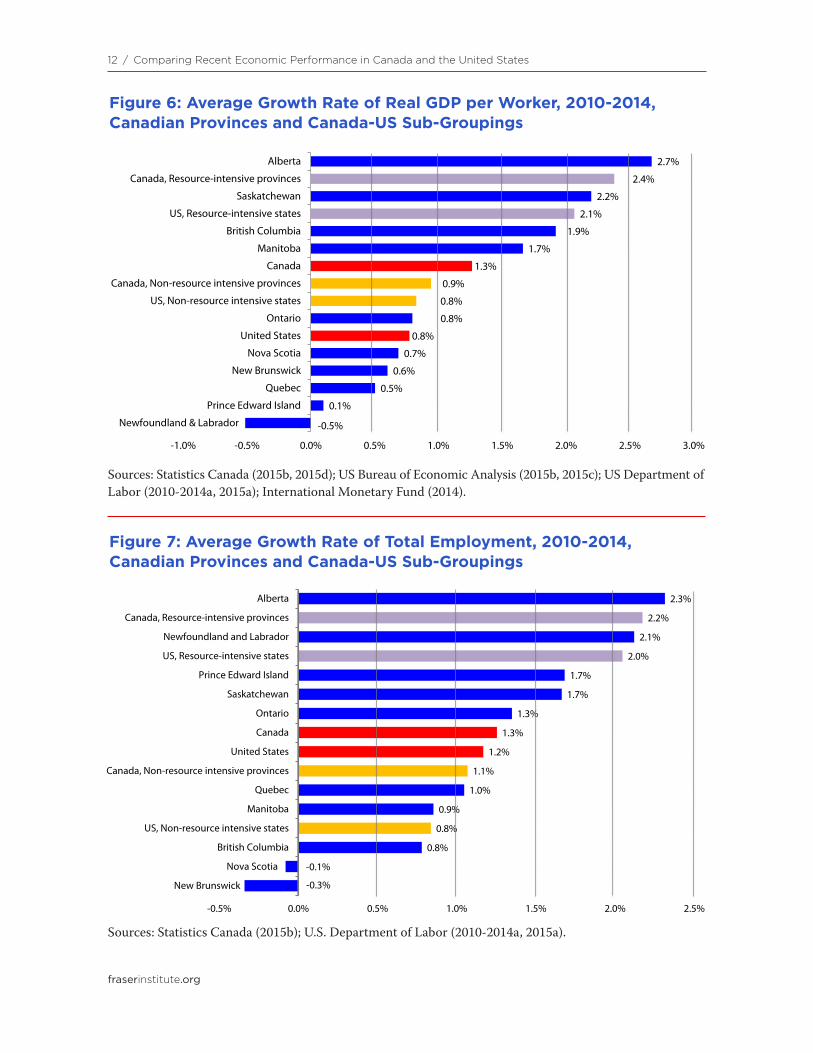
The next set of indicators focus on labour market performance, specific-ally job creation and the unemployment rate.10 These indicators assess the degree to which jurisdictions were able to generate jobs. The job creation numbers, as demonstrated by the average annual growth rates in total employment (figure 7) show differences across the jurisdictions.
Between 2010 and 2014, total employment in Canada grew at an annual average rate of 1.3 percent compared to 1.2 percent for the United States.
Employment in Canada’s resource-intensive provinces grew at 2.2 percent while for the equivalent US states it grew at 2.0 percent. Mean-while, Canadian provinces that were not resource-intensive saw their employment grow at 1.1 percent annually while their US counterparts had employment growth of 0.8 percent. Across Canada’s provinces em-ployment growth varied greatly, rising to highs of 2.3 and 2.1 percent in Alberta and Newfoundland & Labrador and falling to -0.1 and -0.3 percent in Nova Scotia and New Brunswick.
These employment numbers also shed some light on Newfound-land & Labrador’s insipid labour productivity performance. From 2010 to 2014, the province saw its total employment grow at an average annual rate of 2.1 percent while its real GDP expanded by an average rate of only 1.6 percent, resulting in falling productivity. Newfoundland & Labrador
10 Canadian data are from Statistics Canada’s “R3” supplemental unemployment rate, which the organization says is “comparable to the United States rate.” The main difference between the two is that R3 excludes full-time students.
fraserinstitute.org
14 / Comparing Recent Economic Performance in Canada and the United States
was the only province where average employment growth exceeded real GDP growth. Given the overall robust economic growth as a result of its resource sector, this poor productivity performance suggests the province has not capitalized well on its resource sector and has retained an ineffi-cient labour market structure.
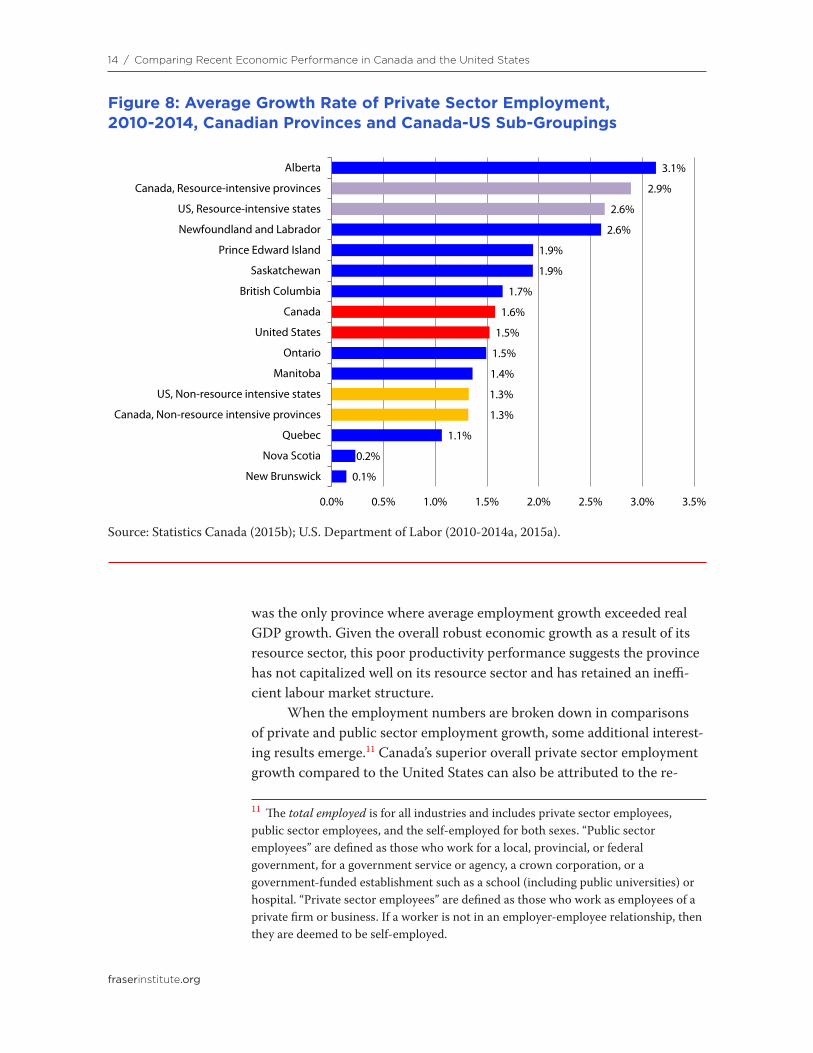
When the employment numbers are broken down in comparisons of private and public sector employment growth, some additional interest-ing results emerge.11 Canada’s superior overall private sector employment growth compared to the United States can also be attributed to the re-
11 The total employed is for all industries and includes private sector employees, public sector employees, and the self-employed for both sexes. “Public sector employees” are defined as those who work for a local, provincial, or federal government, for a government service or agency, a crown corporation, or a government-funded establishment such as a school (including public universities) or hospital. “Private sector employees” are defined as those who work as employees of a private firm or business. If a worker is not in an employer-employee relationship, then they are deemed to be self-employed.
Figure 8: Average Growth Rate of Private Sector Employment, 2010-2014, Canadian Provinces and Canada-US Sub-Groupings
Source: Statistics Canada (2015b); U.S. Department of Labor (2010-2014a, 2015a).
0.1%
0.2%
1.1%
1.3%
1.3%
1.4%
1.5%
1.5%
1.6%
1.7%
1.9%
1.9%
2.6%
2.6%
2.9%
3.1%
0.0% 0.5% 1.0% 1.5% 2.0% 2.5% 3.0% 3.5%
New Brunswick
Nova Scotia
Quebec
Canada, Non-resource intensive provinces
US, Non-resource intensive states
Manitoba
Ontario
United States
Canada
British Columbia
Saskatchewan
Prince Edward Island
Newfoundland and Labrador
US, Resource-intensive states
Canada, Resource-intensive provinces
Alberta
fraserinstitute.org
Comparing Recent Economic Performance in Canada and the United States / 15
source sector. Figure 8 shows that Alberta and Newfoundland & Labrador led private sector employment growth in Canada, while Nova Scotia and New Brunswick were at the bottom. Private sector annual employment growth in the resource-intensive jurisdictions was robust in both Canada and the United States at 2.9 percent and 2.6 percent, respectively. When the non-resource-intensive jurisdictions are compared, the United States growth rate matches Canada’s at 1.3 percent.
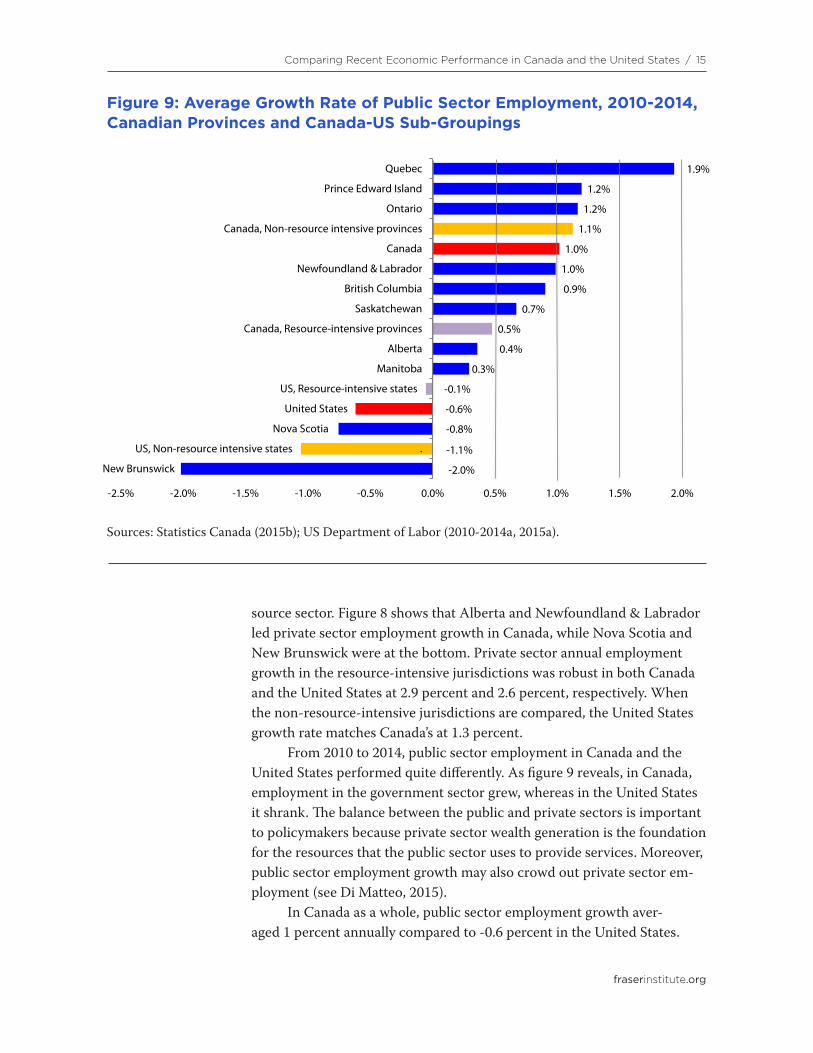
From 2010 to 2014, public sector employment in Canada and the United States performed quite differently. As figure 9 reveals, in Canada, employment in the government sector grew, whereas in the United States it shrank. The balance between the public and private sectors is important to policymakers because private sector wealth generation is the foundation for the resources that the public sector uses to provide services. Moreover, public sector employment growth may also crowd out private sector em-ployment (see Di Matteo, 2015).
In Canada as a whole, public sector employment growth aver-aged 1 percent annually compared to -0.6 percent in the United States.
Figure 9: Average Growth Rate of Public Sector Employment, 2010-2014, Canadian Provinces and Canada-US Sub-Groupings
Sources: Statistics Canada (2015b); US Department of Labor (2010-2014a, 2015a).
-2.0%
-1.1%
-0.8%
-0.6%
-0.1%
0.3%
0.4%
0.5%
0.7%
0.9%
1.0%
1.0%
1.1%
1.2%
1.2%
1.9%
-2.5% -2.0% -1.5% -1.0% -0.5% 0.0% 0.5% 1.0% 1.5% 2.0%
New Brunswick .
US, Non-resource intensive states .
Nova Scotia .
United States .
US, Resource-intensive states
Manitoba
Alberta
Canada, Resource-intensive provinces
Saskatchewan
British Columbia
Newfoundland & Labrador
Canada
Canada, Non-resource intensive provinces
Ontario
Prince Edward Island
Quebec
fraserinstitute.org
16 / Comparing Recent Economic Performance in Canada and the United States
Public sector employment growth was generally greater in Canada’s non-resource-intensive provinces at 1.1 percent versus 0.5 percent in the resource-intensive provinces. Leading the pack in Canada were Quebec, Prince Edward Island, and Ontario, with average annual public sec-tor growth rates of 1.9, 1.2, and 1.2 percent respectively. In the United States, government sector employment shrank by -0.1 percent annually in resource-intensive jurisdictions, while in non-resource-intensive ones it shrank by -1.1 percent.12
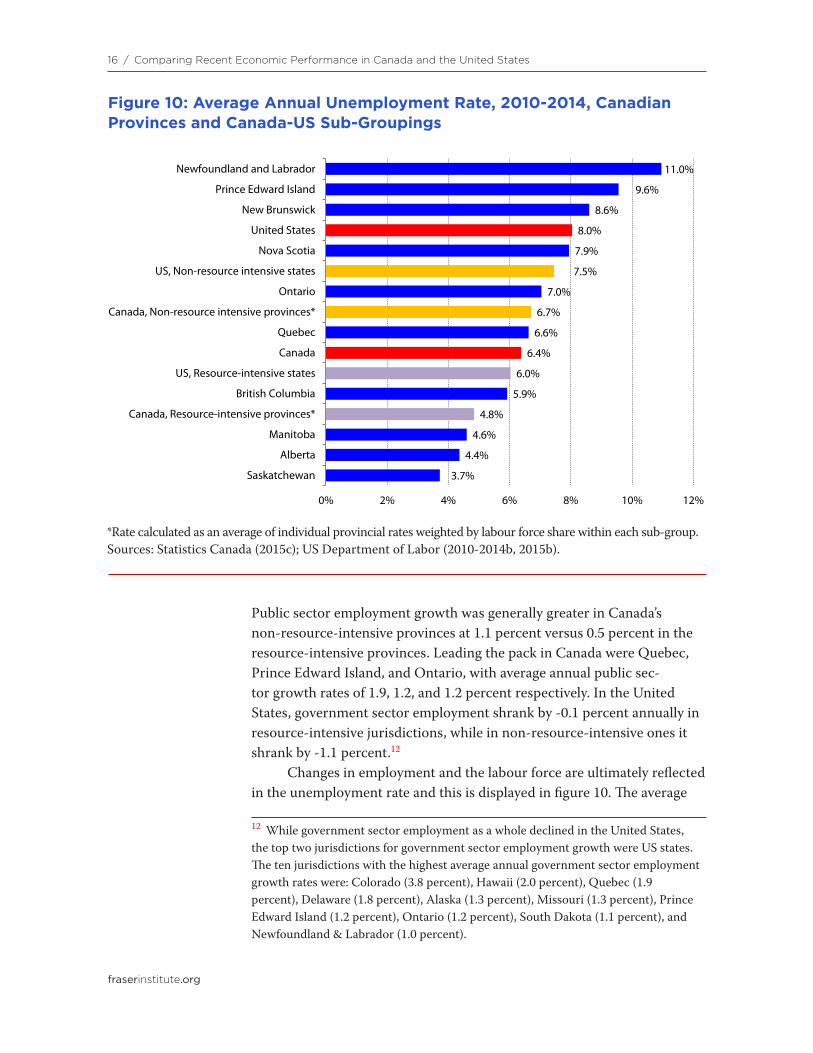
Changes in employment and the labour force are ultimately reflected in the unemployment rate and this is displayed in figure 10. The average
12 While government sector employment as a whole declined in the United States, the top two jurisdictions for government sector employment growth were US states. The ten jurisdictions with the highest average annual government sector employment growth rates were: Colorado (3.8 percent), Hawaii (2.0 percent), Quebec (1.9 percent), Delaware (1.8 percent), Alaska (1.3 percent), Missouri (1.3 percent), Prince Edward Island (1.2 percent), Ontario (1.2 percent), South Dakota (1.1 percent), and Newfoundland & Labrador (1.0 percent).
Figure 10: Average Annual Unemployment Rate, 2010-2014, Canadian Provinces and Canada-US Sub-Groupings
*Rate calculated as an average of individual provincial rates weighted by labour force share within each sub-group. Sources: Statistics Canada (2015c); US Department of Labor (2010-2014b, 2015b).
3.7%
4.4%
4.6%
4.8%
5.9%
6.0%
6.4%
6.6%
6.7%
7.0%
7.5%
7.9%
8.0%
8.6%
9.6%
11.0%
0% 2% 4% 6% 8% 10% 12%
Saskatchewan
Alberta
Manitoba
Canada, Resource-intensive provinces*
British Columbia
US, Resource-intensive states
Canada
Quebec
Canada, Non-resource intensive provinces*
Ontario
US, Non-resource intensive states
Nova Scotia
United States
New Brunswick
Prince Edward Island
Newfoundland and Labrador
fraserinstitute.org
Comparing Recent Economic Performance in Canada and the United States / 17
annual unemployment rate was higher in the United States than Canada at 8.0 percent versus 6.4 percent. However, with the exception of Newfound-land & Labrador—which had the highest average unemployment rate of all these jurisdictions—all of the resource-intensive jurisdictions gener-ally had unemployment rates in the bottom half. Again, this reinforces the observation that resource-intensive jurisdictions, whether in Canada or the United States, generally did a better job of weathering the aftermath of the 2008-09 downturn.
Analysis and Implications
The conventional wisdom regarding Canada’s performance in the post 2009 period asserts that Canada weathered the global financial crisis and recession well and had the best performance of the G-7 countries. This superior performance has been attributed to Canada’s strong fiscal position at the start of the recession, its strong banking sector, positive fiscal and monetary policy as well the strength of the resource-intensive sector (The Economist, 2014, May 3).
This positive performance has certainly been part of the Canadian government’s narrative about the economy in numerous federal docu-ments and budgets.13 Accounts of Canada’s performance have stressed how the decline in output in Canada during the recession was the smallest of the G-7 countries, how Canada was the only country in the G-7 to have quickly recouped the loss in output and employment, and particularly how the Canadian labour market fared significantly better than that in the United States (Canada, 2010).
The aggregate evidence comparing economic output, employment, and productivity in Canada and the United States since 2009 does suggest that Canada performed better. Average annual real per-capita GDP growth from 2010 to 2014 was 1.4 percent in Canada and 1.2 percent in the United States, while real GDP per worker grew at 1.3 percent in Canada and 0.8 percent in the United States. Total employment growth in Canada averaged 1.3 percent versus 1.2 percent in the United States, while the average unemployment rate was 6.4 percent in Canada versus 8.0 percent in the United States.
Yet these aggregate numbers mask some substantial regional varia-tion that, when accounted for, suggests that Canada’s national economic
13 For example: “Since the beginning of the recovery, the Canadian economy has continued to create jobs, with over 1 million more Canadians working today than during the worst part of the recession—the best job creation record of any Group of Seven (G-7) country… Despite significant global weakness emanating in particular from the United States, our largest trading partner, the Canadian economy has continued to expand modestly, enjoying one of the best performances among G-7 countries over the recovery” (Canada, 2014: 1).
fraserinstitute.org
Comparing Recent Economic Performance in Canada and the United States / 19
metrics look as good as they do largely because of the positive economic effects of the country’s resource-intensive provinces, particularly their economies’ energy sectors. When we set these provinces aside and look at the rest of the country, we see that the economic performance of import-ant provinces and regions has been lacklustre. In fact, the economic per-formance of many of Canada’s non-energy jurisdictions has been closely aligned with, and in some cases worse than, the anemic American average in recent years.
Indeed, the sub-national data suggest that, over the period under review, a particular state or province’s economic performance is better predicted by the amount of natural resources it produces than on which side of the border it lies. The economic performance of resource-intensive states in the US closely matched that of Canadian resource-intensive prov-inces, while the performance of Canada’s non-resource-intensive prov-inces more closely matched that of their US counterparts.
Since energy/resource-intensive states in the US make up a smaller share of total output than in Canada, their overall impact on the US econ-omy was more muted. Thus, the overall “superior” performance attrib-uted to Canada is more the artifact of weighting due to the larger share of natural resources and energy in the Canadian economy. On the one hand, this means that resources are indeed important to Canada’s economic performance, a source of its economic strength and not something to be downplayed. On the other hand, it also signals that the non-resource-intensive regions have some serious economic deficiencies.
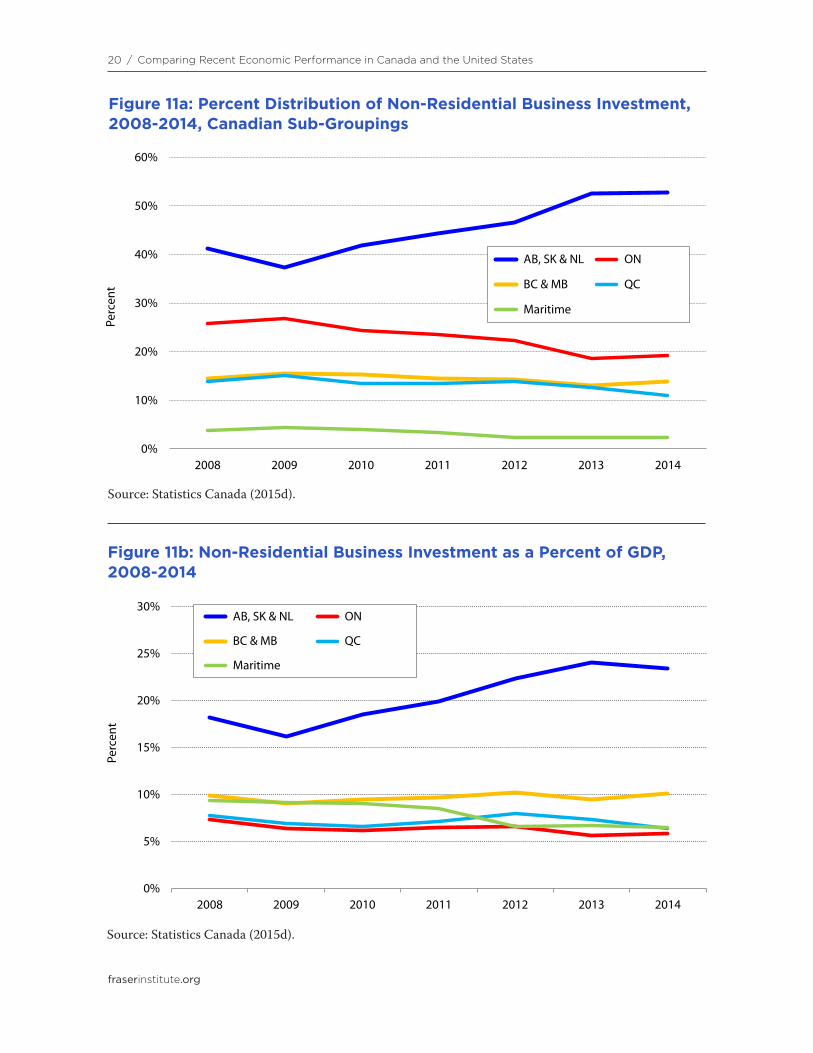
The contribution of the three major energy/resource producers to Canada’s economic performance is also clearly evident when it comes to investment spending and capital formation. Figure 11 plots the distribu-tion of non-residential business investment across Canadian provincial groupings as well as the percentage shares of GDP. From 2008 to 2014, Alberta, Saskatchewan, and Newfoundland & Labrador accounted for an average of 23 percent of national output (GDP) and 16 percent of national population. Yet, between 2008 and 2014, their share of non-residential business investment grew from 41.3 to 52.7 percent. Moreover, as a share of GDP, by 2014, this investment spending amounted to nearly a quarter of their economies. Unfortunately, investment data for the Unites States are not available by state.
This period saw the economies of Newfoundland & Labrador, Saskatchewan, and Alberta propelled by a massive investment boom and associated private sector employment growth, which had a significant spillover on the performance of the Canadian economy overall. In con-
fraserinstitute.org
20 / Comparing Recent Economic Performance in Canada and the United States
Figure 11b: Non-Residential Business Investment as a Percent of GDP, 2008-2014
Source: Statistics Canada (2015d).
Figure 11a: Percent Distribution of Non-Residential Business Investment, 2008-2014, Canadian Sub-Groupings
Source: Statistics Canada (2015d).
0%
10%
20%
30%
40%
50%
60%
2008 2009 2010 2011 2012 2013 2014
Perc
ent
AB, SK & NL ON
BC & MB QC
Maritime
0%
5%
10%
15%
20%
25%
30%
2008 2009 2010 2011 2012 2013 2014
Perc
ent
AB, SK & NL ON
BC & MB QC
Maritime
fraserinstitute.org
Comparing Recent Economic Performance in Canada and the United States / 21
trast, and compared to those provinces, private sector employment growth in Quebec and Ontario was poorer.14
Given the marked economic slowdown now underway in Canada’s resource dependent provinces due to depressed commodity prices, the fundamental question is which provinces and regions will propel Can-ada’s future economic growth? This is especially concerning if the anemic economic performance in central Canada and Atlantic Canada persists. The resource boom with its associated output and employment generation and capital formation is currently over. Central Canada and the Maritimes have yet to see their economies spurred even though commodity prices and the Canadian dollar are both lower. It remains to be seen where the future impetus will come for the Canadian economy.
Moreover, while sound economic policy is important for all of Can-ada, it is particularly vital east of Manitoba where provinces have pursued fiscal policies in recent years that are damaging to future growth pros-pects. Ontario in particular has taken on a massive debt burden at a time of high economic uncertainty, sluggish growth, and severely depressed commodity prices. Moreover, the federal government is also substantially increasing its deficit financing. In general, these governments, along with Alberta, are engaged in deficit spending, increasing government debt, and higher taxes. Such fiscal paths will only unsettle business and investor confidence at a time when productivity-boosting private sector investment in the economy is needed.
14 While Canada’s government sector employment growth was higher than that in the United States, this is not a positive long-term development given the accompanying deficits required to produce the spending that enabled the employment expansion.
References
Baldwin, J.R., and R. MacDonald (2012). Natural Resources, the Terms of Trade, and Real Income Growth in Canada: 1870 to 2010. Economic Analysis (EA) Research Paper Series, No. 11F0027M – No. 7. Statistics Canada.
Baldwin, J.R. and W. Gu (2007). Long-term productivity growth in Canada and the United States. The Canadian Productivity Review 13. Catalogue no. 15-206-X. Statistics Canada.
Baldwin, R. (2009). Integration of the North American Economy and New-paradigm Globalization. Policy Horizons Canada WP049 (September).
Blecker, R.A. (2003). The North American Economies After NAFTA. In-ternational Journal of Political Economy 33, 3 (Fall): 5–27.
Canada, Ministry of Finance (2014). Federal Budget 2014. The Road to Bal-ance: Creating Jobs and Opportunities. Government of Canada.
Canada, Ministry of Finance (2010). Canada’s Global Economic Leader-ship: A Report to Canadians (June). Government of Canada.
Di Matteo, L. (2015). An Analysis of Public and Private Sector Employment Trends in Canada, 1990-2013. Fraser Institute.
Di Matteo, L., J. Clemens, and J. Emes (2014). An Economic and Fiscal Comparison of Alberta and Other North American Energy Producing Prov-inces and States. Fraser Institute.
Diewart, Erwin (2012). The Challenge of Total Factor Productivity Mea-surement. Centre for the Study of Living Standards. <http://www.csls.ca/ipm/1/diewert-un-en.pdf>, as of March 15, 2016.
Economist, The (2014, May 3). Maple, Resting on Laurels. The Economist.
fraserinstitute.org
Comparing Recent Economic Performance in Canada and the United States / 23
Florida, R., T. Gulden, and C. Mellander (2007). The Rise of the Mega Re-gion. Martin Prosperity Institute.
Garreau, J. (1992). The Nine Nations of North America. Harper-Collins.
International Monetary Fund (2014). World Economic Outlook Database, Implied PPP Conversion Rate. IMF.
Karabogovic, A. (2009). Institutions, Economic Growth and the “Curse” of Natural Resources. Fraser Institute.
Keay, I. (2007). The Engine or the Caboose? Resource Industries and Twentieth-Century Canadian Economic Performance. The Journal of Eco-nomic History 67, 1: 1–32.
Law, Marc (1999). Productivity and Economic Performance: An Over-view of the Issues. Fraser Institute. <http://oldfraser.lexi.net/publications/pps/37/>, as of March 15, 2016.
Lindert, P., and J.G. Williamson (2003). Does Globalization Make the World more Unequal? In M.D. Bordo, A.M. Taylor and J.G. Williamson (eds.). Globalization in Historical Perspective NBER (University of Chicago Press): 227–275.
Macdonald, R. (2007). Canadian and U.S. Real Income Growth Pre and Post 2000: A Reversal of Fortunes. Economic Analysis Research Paper Se-ries. No. 48. Catalogue no. 11F0027M. Statistics Canada.
MacDonald, R. (2011). Economic Growth in North America: Is Canada Outperforming the United States? Catalogue no. 11-626-X-No. 001. Statis-tics Canada.
Macdonald, R. (2010). Real Gross Domestic Income, Relative Prices and Economic Performance across the OECD. Review of Income and Wealth 56, 3: 498–518.
McCallum, J. (1995). National Borders Matter: Canada–U.S. Regional Trade Patterns. American Economic Review 85, 3: 615–623.
Mendelsohn, M., and J. Medow (2010). Help Wanted: How Well Did the EI Program Respond During Recent Recessions? Mowat Note (Sep-tember). Mowat Centre for Policy Innovation, University of Toronto.
fraserinstitute.org
24 / Comparing Recent Economic Performance in Canada and the United States
<http://mowatcentre.ca/wp-content/uploads/publications/10_help_want-ed.pdf>, as of March 15, 2016.
Proulx, P.P. (2013) Economic Regions of North America. Policy Horizons Canada, Government of Canada. <http://www.horizons.gc.ca/eng/con-tent/feature-article-economic-regions-north-america>, as of March 15, 2016.
Sachs, J.D., and A.M. Warner (1999). The Big Push, Natural Resource Booms and Growth. Journal of Development Economics 59: 43–76.
Sachs, J.D., and A.M. Warner (2001). Natural Resources and Economic Development: The Curse of Natural Resources. European Economic Re-view 45: 827–838.
Statistics Canada (2015a). Table 051-0001 – Estimates of population, by age group and sex for July 1, Canada, provinces and territories, annual. Government of Canada.
Statistics Canada (2015b). Table 282-0012 – Labour force survey estimates (LFS), employment by class of worker, North American Industry Classifica-tion System (NAICS) and sex, annual (persons x 1,000). Government of Canada.
Statistics Canada (2015c). Table 282-0086 – Labour force survey estimates (LFS), supplementary unemployment rates by sex and age group, annual (rate). Government of Canada.
Statitsics Canada (2015d). Table 384-0038 – Gross domestic product, expenditure-based, provincial and territorial, annual (dollars x 1,000,000). Government of Canada.
Statistics Canada (2016a). Table 379-0030 – Gross domestic product (GDP) at basic prices, by North American Industry Classification System (NAICS), provinces and territories, annual (dollars). Government of Canada.
Statistics Canada (2016b). Table 379-0031 – Gross domestic product (GDP) at basic prices, by North American Industry Classification System (NAICS), annual (dollars). Government of Canada.
fraserinstitute.org
Comparing Recent Economic Performance in Canada and the United States / 25
US Bureau of Economic Analysis (2015a). Regional Data, GDP & Personal Income, Personal Income Summary, Population. United States Govern-ment.
US Bureau of Economic Analysis (2015b). Gross Domestic Product (GDP) by State (millions of current dollars). United States Government.
US Bureau of Economic Analysis (2015c). Real GDP by State (millions of chained 2009 dollars). United States Government.
US Bureau of Economic Analysis (2015d). NAICS Real GDP. United States Government.
US Department of Labor, Bureau of Labor Statistics (2010-2014a). Table 21. Geographic Profile of Employment and Unemployment. United States Government.
US Department of Labor, Bureau of Labor Statistics (2010-2014b). Table 19. Geographic Profile of Employment and Unemployment. United States Government.
US Department of Labor, Bureau of Labor Statistics (2015a). Current Em-ployment Statistics. United States Government.
US Department of Labor, Bureau of Labor Statistics (2015b). Unemploy-ment Rate. United States Government.
Vanek, J. (1963). The Natural Resource Content of United States Foreign Trade, 1870-1955. MIT Press.
Wright, G. (1990). The Origins of American Industrial Success, 1879-1940. American Economic Review 80: 651–68.
About the authors
Livio Di Matteo
Professor Livio Di Matteo is a Senior Fellow at the Fraser Institute and Professor of Economics at Lakehead University in Thunder Bay, Ontario, where he specializes in public policy, health economics, public finance, and economic history. His recent research has focused on health care spending and its sustainability. Di Matteo is a member of the CIHI Na-tional Health Expenditure Advisory Panel, the Evidence Network (Eviden-ceNetwork.ca), and is a contributor to the economics blog Worthwhile Canadian Initiative. He has been listed in Canadian Who’s Who since 1995 and holds a PhD from McMaster University, an MA from the University of Western Ontario, and a BA from Lakehead University.
Joel Emes
Joel Emes is Fraser Institute Senior Fellow who rejoined the Institute after a stint as a senior advisor to British Columbia’s provincial government. He previously served as a senior analyst, then as executive director (2009 to 2011), at the BC Progress Board. Prior to that, Joel was a senior research economist at the Fraser Institute, where he initiated and led several flag-ship projects in the areas of tax freedom and government performance, spending, debt, and unfunded liabilities. Joel holds a BA and an MA in economics from Simon Fraser University.
Charles Lammam
Charles Lammam is Director of Fiscal Studies at the Fraser Institute. He holds an MA in public policy and a BA in economics with a minor in busi-ness administration from Simon Fraser University. Since joining the Insti-tute, Mr. Lammam has published over 70 studies and 260 original articles on a wide range of economic policy issues including taxation, government finances, pensions, investment, income mobility, labour, entrepreneurship, public-private partnerships, and charitable giving. His articles have ap-peared in every major national and regional newspaper in Canada (includ-ing the Globe and Mail and National Post) as well as prominent US-based
fraserinstitute.org
Comparing Recent Economic Performance in Canada and the United States / 27
publications (including Forbes and The American). Mr. Lammam’s career in public policy spans nearly a decade. He regularly gives presentations to various groups, comments in print media, and appears on radio and television broadcasts across the country to discuss the Institute’s research. He has also appeared before committees of the House of Commons as an expert witness.
Ben Eisen
Ben Eisen is the Associate Director of Provincial Prosperity Studies at the Fraser Institute. He holds a BA from the University of Toronto and an MPP from the University of Toronto’s School of Public Policy and Govern-ance. Prior to joining the Fraser Institute Mr. Eisen was the Director of Research and Programmes at the Atlantic Institute for Market Studies in Halifax. He also worked for the Citizens Budget Commission in New York City, and in Winnipeg as the Assistant Research Director for the Frontier Centre for Public Policy. Mr. Eisen has published influential studies on sev-eral policy topics, including intergovernmental relations, public finance, and higher education policy. He has been widely quoted in major news-papers including the National Post, Chronicle Herald, Winnipeg Free Press and Calgary Herald.
AcknowledgmentsThe authors would like to acknowledge the anonymous reviewers for their comments, suggestions, and insights. Any remaining errors or oversights are the sole respon sibility of the authors. As the researchers have worked independently, the views and conclusions expressed in this paper do not necessarily reflect those of the Board of Di rectors of the Fraser Institute, the staff, or supporters.
fraserinstitute.org
28 / Comparing Recent Economic Performance in Canada and the United States
Publishing informationDistributionThese publications are available from http://www.fraserinstitute.org in Portable Document Format (PDF) and can be read with Adobe Acrobat® or Adobe Reader®, versions 8 or later. Adobe Reader® DC, the most recent version, is available free of charge from Adobe Systems Inc. at http://get.adobe.com/reader/. Readers having trouble viewing or printing our PDF files using applications from other manufacturers (e.g., Apple’s Preview) should use Reader® or Acrobat®.
Ordering publicationsTo order printed publications from the Fraser Institute, please contact:
• e-mail:[email protected] • telephone:604.688.0221ext.580or,tollfree,1.800.665.3558ext.580 • fax:604.688.8539.
MediaFor media enquiries, please contact Aanand Radia:
• 416-363-6575xt238 • e-mail:[email protected].
CopyrightCopyright © 2016 by the Fraser Institute. All rights reserved. No part of this publication may be reproduced in any manner whatsoever without written permission except in the case of brief passages quoted in critical articles and reviews.
Date of issueApril 2016
ISBN978-0-88975-399-0
CitationLivio Di Matteo, Joel Emes, Charles Lammam, and Ben Eisen (2016). Com-paring Recent Economic Performance in Canada and the United States: A Provincial and State-Level Analysis. Fraser Institute. http://www.fraserin-stitute.org.
fraserinstitute.org
Comparing Recent Economic Performance in Canada and the United States / 29
Supporting the Fraser InstituteTo learn how to support the Fraser Institute, please contact
•Development Department, Fraser Institute Fourth Floor, 1770 Burrard Street Vancouver, British Columbia, V6J 3G7 Canada
•telephone,toll-free:1.800.665.3558ext.548
•e-mail:[email protected]
•website:http://www.fraserinstitute.org/donate
Purpose, funding, and independenceThe Fraser Institute provides a useful public service. We report objective in-formation about the economic and social effects of current public policies, and we offer evidence-based research and education about policy options that can improve the quality of life.
The Institute is a non-profit organization. Our activities are funded by charitable donations, unrestricted grants, ticket sales, and sponsorships from events, the licensing of products for public distribution, and the sale of publications.
All research is subject to rigorous review by external experts, and is conducted and published separately from the Institute’s Board of Trustees and its donors.
The opinions expressed by authors are their own, and do not neces-sarily reflect those of the Institute, its Board of Trustees, its donors and sup-porters, or its staff. This publication in no way implies that the Fraser Insti-tute, its trustees, or staff are in favour of, or oppose the passage of, any bill; or that they support or oppose any particular political party or candidate.
As a healthy part of public discussion among fellow citizens who de-sire to improve the lives of people through better public policy, the Institute welcomes evidence-focused scrutiny of the research we publish, including verification of data sources, replication of analytical methods, and intelli-gent debate about the practical effects of policy recommendations.
fraserinstitute.org
30 / Comparing Recent Economic Performance in Canada and the United States
About the Fraser InstituteOur mission is to improve the quality of life for Canadians, their families, and future generations by studying, measuring, and broadly communicat-ing the effects of government policies, entrepreneurship, and choice on their well-being.
Notre mission consiste à améliorer la qualité de vie des Canadiens et des générations à venir en étudiant, en mesurant et en diffusant les effets des poli-tiques gouvernementales, de l’entrepreneuriat et des choix sur leur bien-être.
Peer review —validating the accuracy of our research
The Fraser Institute maintains a rigorous peer review process for its re-search. New research, major research projects, and substantively modified research conducted by the Fraser Institute are reviewed by experts with a recognized expertise in the topic area being addressed. Whenever possible, external review is a blind process. Updates to previously reviewed research or new editions of previously reviewed research are not reviewed unless the update includes substantive or material changes in the methodology.
The review process is overseen by the directors of the Institute’s research departments who are responsible for ensuring all research pub-lished by the Institute passes through the appropriate peer review. If a dispute about the recommendations of the reviewers should arise during the Institute’s peer review process, the Institute has an Editorial Advisory Board, a panel of scholars from Canada, the United States, and Europe to whom it can turn for help in resolving the dispute.
fraserinstitute.org
Comparing Recent Economic Performance in Canada and the United States / 31
Members
Past members
Editorial Advisory Board
* deceased; † Nobel Laureate
Prof. Terry L. Anderson
Prof. Robert Barro
Prof. Michael Bliss
Prof. Jean-Pierre Centi
Prof. John Chant
Prof. Bev Dahlby
Prof. Erwin Diewert
Prof. Stephen Easton
Prof. J.C. Herbert Emery
Prof. Jack L. Granatstein
Prof. Herbert G. Grubel
Prof. James Gwartney
Prof. Ronald W. Jones
Dr. Jerry Jordan
Prof. Ross McKitrick
Prof. Michael Parkin
Prof. Friedrich Schneider
Prof. Lawrence B. Smith
Dr. Vito Tanzi
Prof. Armen Alchian*
Prof. James M. Buchanan* †
Prof. Friedrich A. Hayek* †
Prof. H.G. Johnson*
Prof. F.G. Pennance*
Prof. George Stigler* †
Sir Alan Walters*
Prof. Edwin G. West*