Embed Size (px)
Citation preview

Comparing Real Wages: the McWage Index
Professor Orley AshenfelterJoseph Douglas Green 1895 Professor of Economics, Princeton UniversityDirector, Industrial Relations Section, Princeton University
Professor Lord LayardChair, LSE
Centre for Economic Performance 21st Birthday Lecture Series
Suggested hashtag for Twitter users: #lsemcwage

Comparing Real Wages
Orley AshenfelterPrinceton University

TABLE 1: REAL WAGE RATES IN LONDON AND CANTON, 1704
English Price/Chinese Price
English Budget Shares
Chinese Budget Shares
Starch 4.79 0.48 0.6
Meat 1.66 0.13 0.05Milk 0.89 0.13 0.01Tea 26.6 0.03 0.05Sugar 15.24 0.04 0.12Charcoal 0.19 0.04 0.02Lighting 1.96 0.05 0.03Cotton 3.38 0.05 0.08ClothIron Work 3.12 0.02 0.02Nails 1.45 0.02 0.02
CPI 3 4.91Wage Rate 3.67 3.67 3.67Real Wage 1.22 0.75

0
5
10
15
20
25
30
35
1890 1895 1900 1905 1910
Cents
Rees Average HourlyEarnings
Douglas Average HourlyEarnings
FIGURE 1: AVERAGE HOURLY EARNING IN CENTS, 1890-1914
Source: Douglas (1930), Rees (1962)

60
65
70
75
80
85
90
95
100
105
110
1890 1895 1900 1905 1910
Rees PriceIndex
Douglas PriceIndex
FIGURE 2: CONSUMER PRICE INDEXES, 1890-1914 (1914=100)
Source: Douglas (1930), Rees (1962)

55.00
56.00
57.00
58.00
59.00
60.00
61.00
60
65
70
75
80
85
90
95
100
105
1890 1895 1900 1905 1910
Weekly HourReal Wage Index
Rees Real Wage Index
Douglas Real Wage Index
Average Hour/Week
FIGURE 3: REAL WAGE INDEXES AND WEEKLY HOURS WORKED, 1890-1914 (1914=100)
Source: Douglas (1930), Rees (1962)

TABLE 2: REAL WAGE RATES IN VARIOUS PARTS OF THE WORLD, 1900-1914
Wage Relative to "Barebones Subsistence" Cost (1900-1914)
Japan 1.36Canton 1.01Beijing 1.39Delhi 1.43
Florence 1.8Bengal 1.51London 7.49Oxford 6.06
Amsterdam 5.07Mexico City 1.51
Bogota 1.33Chicago 6.08

Interpreting Real Wage Measures:A Constant Utility Index
The solution of the indirect utility function v(w,p,y) for w*=w*(p,y,v*) provides the basis for a constant-utility index number of real wages. Pencavel (1977)
A comparison of the observed w with w* indicates whether the worker’s real wage has increased. w/w* is thus a real wage index from the worker’s point of view. It decreases with increased prices and non-work income.
The interpretation is not affected by market distortions or wage regulation.

DCO-ZXE089-20040200-jgfPP1
9
The Real Wage as Marginal Product of Labor
• Assuming workers are paid the marginal product of their labor, real wage rates for comparable workers can be used to control for skill differences (hi) and measure Total Factor Productivity (Ai ). Hall and Jones (1999) write (Cobb-Douglas) production as
Yi/Li = yi = (Ki/Yi) α/(1-α)Aihi
Selecting h0i identically in each location , and ASSUMING that wages are not distorted by regulation implies that
• w0i/w00= [Ai (Ki/ Yi) α/(1- α)]/ A0 (K0/ Y0) α/(1- α).
• Relative wages adjusted for capital/output ratios measure relative TFP.

Prices with Tradable and Non-Tradable GoodsIf a quasi-tradable good is produced with (Cobb-Douglas) technology
using non-tradable labor paid wage w0i , and if the tradable good is
priced p, then
pni=w0iap1-a,
describes the price of the quasi-tradable good (pn ) as a concave
function of the local wage, where a is the share of the non-tradable in
total cost.
A real wage defined as
w0i/pni=(w0i/p)1-a,
Is a purchasing-power-parity adjusted wage where the weights in the
puchasing power basket are a and 1-a, and it is concave function of the
real wage measured in tradables.


DCO-ZXE089-20040200-jgfPP1
12

DCO-ZXE089-20040200-jgfPP1
13


DCO-ZXE089-20040200-jgfPP1
15

DCO-ZXE089-20040200-jgfPP1
16


DCO-ZXE089-20040200-jgfPP1
18
Why McWages?
Focus on entry-level basic-crew job at McDonald’s because these are virtually identical jobs in terms of
– labor input– hedonic job qualities– producing identical product with identical
technology
• Operations are monitored using the 600-page Operations and Training Manual (time tables, color photographs) –in over 140 countries.
• Over 90% of McWorkers are hourly paid Crew & Training Squad workers rotating through stations / sales counter.
• Ingredients delivered frozen and handled in a mechanized system that differs little place to place. FOOD SAFETY IS CRITICAL and a key to marketing in poor countries.
• McDs, do not adjust technology to different wages

DCO-ZXE089-20040200-jgfPP1
19
Data collection
• In total, we have data for 64 countries from 2007, but for fewer countries back to 2000.
• Hourly wages of Crew and Training Squad
• Data from large urban areas (2 cities in 2007, 2 restaurants per city, where available). Correlation of median and average wages is 0.9999.
• Price of Big Mac (BMI)
• Reliability? – We collected several McWages ourselves as a
check (in Canada, Czech Rep., Denmark, India, Italy) – the main data is fully consistent with our own measurements.
– Big Mac price correlates with the Economist (0.99)

Australia
AustriaBelgium
Brazil
Canada
Czech Republic
Denmark
Finland
France
Germany
Hong Kong
Ireland
Israel
Italy
Japan
Korea
Mexico
Netherlands
New Zealand
Norway
Philippines
PolandSingapore
Spain
Sri Lanka
Sweden
Switzerland
Taiwan
UK
USA
0
0.5
1
1.5
2
2.5
0 0.5 1 1.5 2 2.5 3
BL
S W
age
Rat
io
Hourly Wage Ratio
FIGURE 4: THE McWAGE COMPARED TO BLS WAGE ESTIMATES, 30 COUNTRIES, 2007
Note: The McWage and the BLS wage estimates are each expressed relative to the US level, and displayed with a 45 degree line. This implies that the US is at the point 1,1.
Source: Authors calculations, BLS < ftp://ftp.bls.gov/pub/special.requests/ForeignLabor/>

IndiaEl Salvador
Peru Azerbaijan
MexicoCosta Rica
Belarus
Chile
Hong Kong
Russia
SingaporeCzech Rep.
Puerto Rico
Canada
USA
Italy
Germany FinlandUnited Kingdom
-0.10
0.10
0.30
0.50
0.70
0.90
1.10
1.30
1.50
-0.10 0.10 0.30 0.50 0.70 0.90 1.10 1.30 1.50
ILO
Wag
e R
atio
McWage Ratio
FIGURE 5: THE McWAGE COMPARED TO ILO WAGE ESTIMATES, 19 COUNTRIES, 2007
Note: The McWage and the ILO wages are each expressed relative to the US level, and displayed with a 45 degree line. Denmark has a McWage ratio of 2.57 and an ILO wage ratio of 3.13, off the dimensions of the chart.
Source: Authors calculations, http://laborsta.ilo.org/ (The ILO October Inquiry).

U.S.Canada
RussiaSouth Africa
ChinaIndia
Japan
The rest of Asia*
Eastern Europe*
Western Europe*
Middle East*
Latin America*
Oceania*
1.00
1.50
2.00
2.50
3.00
3.50
4.00
4.50
0.00 2.00 4.00 6.00 8.00 10.00 12.00
Big
Mac
Pri
ce
McWage
FIGURE 8: BIG MAC PRICE COMPARED TO THE McWAGE,2007Note: See Note to Table 3. The regression line is from a log linear regression with slope .586.
Source: Authors Calculation

USA
Canada
Russia
South Africa
China
India
Japan
Hong Kong
Indonesia
Korea
MalaysiaPhilippines
Singapore
Sri LankaThailandAzerbaijan
Belarus
Czech RepublicEstonia
Georgia
LatviaLithuaniaPoland
TurkeyUkraine
Austria
Belgium
Denmark
Finland
France
Germany
Ireland
Italy
Netherlands
Norway
Spain
Sweden
Switzerland
UK
Egypt
Israel
Lebanon
MoroccoPakistan
Saudi Arabia
Argentina
Brazil
Chile
Colombia
Costa RicaDominican Republic
Ecuador
El Salvador
Guatemala
HondurasMexico
Paraguay
PeruUruguayVenezuela
Australia
New Zealand
0.00
0.20
0.40
0.60
0.80
1.00
1.20
1.40
1.60
1.80
0.00 0.20 0.40 0.60 0.80 1.00 1.20 1.40 1.60 1.80
BM
PH
Rat
io
PPP McWage Ratio
FIGURE 6: THE McWAGE ADJUSTED FOR PURCHASING POWER PARITY PRICES COMPARED TO BIG MACS PER HOUR OF WORK (BMPH), 62 COUNTRIES, 2007
Note: The McWage is adjusted for purchasing power price prices in 2005, the latest year available. The PPP adjusted McWage and Big Macs Per Hour are each expressed relative to the US level, and displayed with a 45 degree line.
Source: Authors calculations, Penn World Table <http://pwt.econ.upenn.edu/ php_site/ pwt70/ pwt70 _form. php>

PeruBrazilColombia
MexicoVenezuelaChile
ArgentinaTurkey
TaiwanHong Kong
PolandLithuania
Singapore
Latvia
Estonia
Czech RepublicKorea
Israel
Netherlands
Spain
Canada
Austria
USA
JapanItaly
Germany
New Zealand
-0.10
0.10
0.30
0.50
0.70
0.90
1.10
1.30
1.50
-0.10 0.10 0.30 0.50 0.70 0.90 1.10 1.30 1.50
Ho
url
y O
utp
ut
Rat
io
McWage Ratio
FIGURE 7: THE McWAGE COMPARED TO OUTPUT PER MANHOUR, 27 COUNTRIES, 2007
Note: The McWage and output per man hour are each expressed relative to the US level, and displayed with a 45 degree line.
Source: Authors calculations, Penn World Table <http://pwt.econ.upenn.edu/ php_site/ pwt70/ pwt70 _form. php>

DC
O-Z
XE
089-20040200-jgfPP
1
25
0
0.5 1
1.5 2
2.5 3
PakistanEgypt
Sri LankaIndia
PhilippinesIndonesia
Dominican Rep.ThailandMalaysia
MexicoEl Salvador
PeruChina
ColombiaBrazil
MoroccoUkraineBelarus
EcuadorSouth Africa
AzerbaijanUruguay
HondurasGeorgia
ChileTurkey
ArgentinaVenezuela
RussiaLebanon
GuatemalaSaudi Arabia
SingaporeHong Kong
TaiwanKorea
PolandLithuania
Czech Rep.Portugal
EstoniaLatviaIsrael
NetherlandsPuerto Rico
USACanada
New ZealandUnited Kingdom
SpainJapan
AustriaGermany
ItalyAustralia
FinlandFrance
SwedenIreland
BelgiumNorway
SwitzerlandDenmark
Costa RicaParaguay
McW
ag
es in
20
09
, rela
tive
to U
S le
ve
l

TABLE 3: McWAGES, BIG MAC PRICES AND BIG MACS PER HOUR OF WORK (BMPH), 2007
Countries and Economic Regions
McWageMcWage
RatioBig Mac
PriceBMPH
U.S. 7.33 1 3.04 2.41Canada 6.8 0.93 3.1 2.19Russia 2.34 0.32 1.96 1.19South Africa 1.69 0.23 2.08 0.81China 0.81 0.11 1.42 0.57India 0.46 0.06 1.29 0.35Japan 7.37 1.01 2.39 3.09U.K. 10.53 1.44 3.92 2.69The rest of Asia* 1.02 0.14 1.95 0.53Eastern Europe* 1.81 0.25 2.26 0.8Western Europe* 9.44 1.29 4.23 2.23Middle East* 0.98 0.13 2.49 0.39Latin America* 1.06 0.14 3.05 0.35
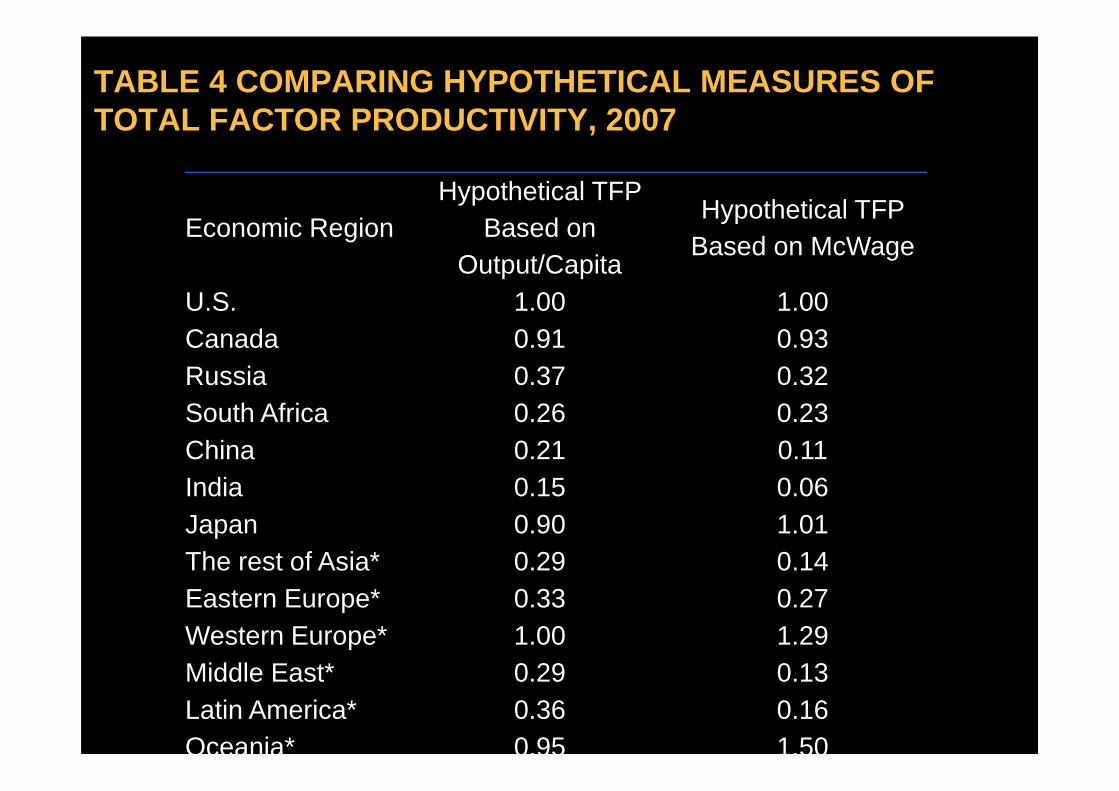
TABLE 4 COMPARING HYPOTHETICAL MEASURES OF TOTAL FACTOR PRODUCTIVITY, 2007
Economic RegionHypothetical TFP
Based on Output/Capita
Hypothetical TFP Based on McWage
U.S. 1.00 1.00Canada 0.91 0.93Russia 0.37 0.32South Africa 0.26 0.23China 0.21 0.11India 0.15 0.06Japan 0.90 1.01The rest of Asia* 0.29 0.14Eastern Europe* 0.33 0.27Western Europe* 1.00 1.29Middle East* 0.29 0.13Latin America* 0.36 0.16Oceania* 0.95 1.50

Note: see Note to Table 4. Both TFP measures are expressed relative to the US level, and displayed with a 45 degree line.
Source: see Source of Table 4
U.S.
Canada
Russia
South AfricaChina
India
Japan
The rest of Asia*Eastern Europe*
Western Europe*
Middle East*
Latin America*
Oceania*
0.00
0.20
0.40
0.60
0.80
1.00
1.20
0.00 0.20 0.40 0.60 0.80 1.00 1.20 1.40 1.60
Hyp
oth
etic
al T
FP
bas
ed o
n O
utp
ut
per
Cap
ita
Hypothetical TFP based on McWage
FIGURE 9: COMPARISON OF HYPOTHETICAL TOTAL FACTOR PRODUCTIVITY MEASURED WITH OUTPUT/WORKER AND McWAGES, 2007

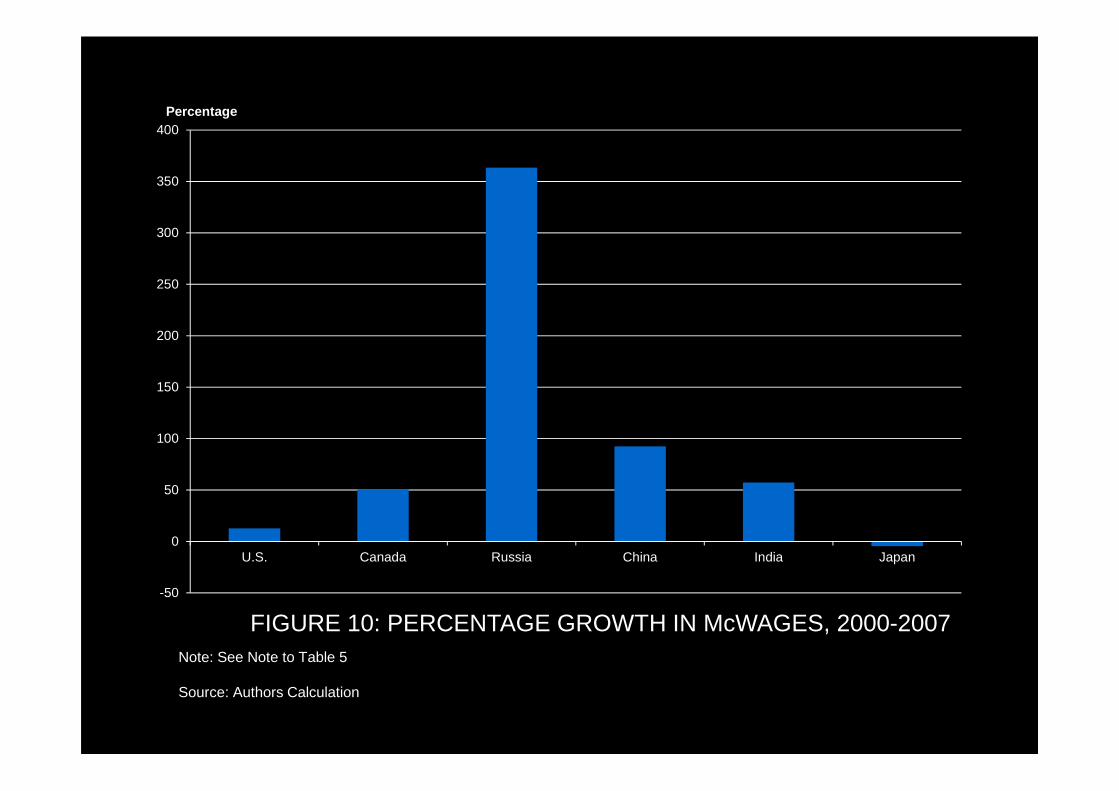
TABLE 5: GROWTH IN McWAGES, BIG MAC PRICES AND BIG MACS PER HOUR OF WORK (BMPH), 2000-2007
McWage Ratio
McWage Ratio
Relative to the U.S
Big Mac Price Ratio
BMPH Ratio
U.S. 1.13 1 1.21 0.93Canada 1.51 1.34 1.66 0.91Russia 4.63 4.11 1.84 2.52China 1.92 1.71 1.2 1.6India 1.57 1.4 1.03 1.53
Japan 0.95 0.85 0.94 1.02U.K. 1.51 1.33 1.30 1.16
-50
0
50
100
150
200
250
300
350
400
U.S. Canada Russia China India Japan
Percentage
FIGURE 10: PERCENTAGE GROWTH IN McWAGES, 2000-2007Note: See Note to Table 5
Source: Authors Calculation
-20.00
-10.00
0.00
10.00
20.00
30.00
40.00
50.00
60.00
70.00
80.00
90.00
U.S. Canada Russia China India Japan
Percentage
FIGURE 11: PERCENTAGE GROWTH IN BIG MAC PRICES, 2000-2007Note: See Note to Table 5
Source: Authors Calculation

-50
0
50
100
150
200
U.S. Canada Russia China India Japan
Percentage
FIGURE 12: PERCENTAGE GROWTH IN BIG MACS PER HOUR OF WORK, 2000-2007
Note: See Note to Table 5
Source: Authors Calculation

TABLE 6: GROWTH IN McWAGES, BIG MAC PRICES AND BIG MACS PER HOUR OF WORK (BMPH), 2007-2011
McWage Ratio
Big Mac Price Ratio
BMPH Ratio
U.S. 1.06 1.16 0.91Canada 1.47 1.56 0.94Russia 1.78 1.24 1.43South Africa 0.89 1.29 0.69China 2.00 1.62 1.24India 1.36 1.58 0.86Japan 1.46 2.04 0.72U.K. 0.86 0.99 0.87The rest of Asia* 1.34 1.42 0.94Eastern Europe* 1.31 1.22 1.08Western Europe* 1.12 1.19 0.95Middle East* 1.26 1.26 1.00Latin America* 1.51 1.45 1.04Oceania* 1.22 1.39 0.88

FIGURE 13: PERCENTAGE GROWTH IN McWAGES, 2007-2011
Note: See Note to Table 6
Source: Authors Calculation
-20.00
0.00
20.00
40.00
60.00
80.00
100.00
120.00
U.S. Canada Russia SouthAfrica
China India Japan The restof Asia*
EasternEurope*
WesternEurope*
MiddleEast*
LatinAmerica*
Oceania*
Percentage

FIGURE 14: PERCENTAGE GROWTH IN BIG MAC PRICES, 2007-2011
Note: See Note to Table 6
Source: Authors Calculation
-20.00
0.00
20.00
40.00
60.00
80.00
100.00
120.00
U.S. Canada Russia SouthAfrica
China India Japan The restof Asia*
EasternEurope*
WesternEurope*
MiddleEast*
LatinAmerica*
Oceania*
Percentage
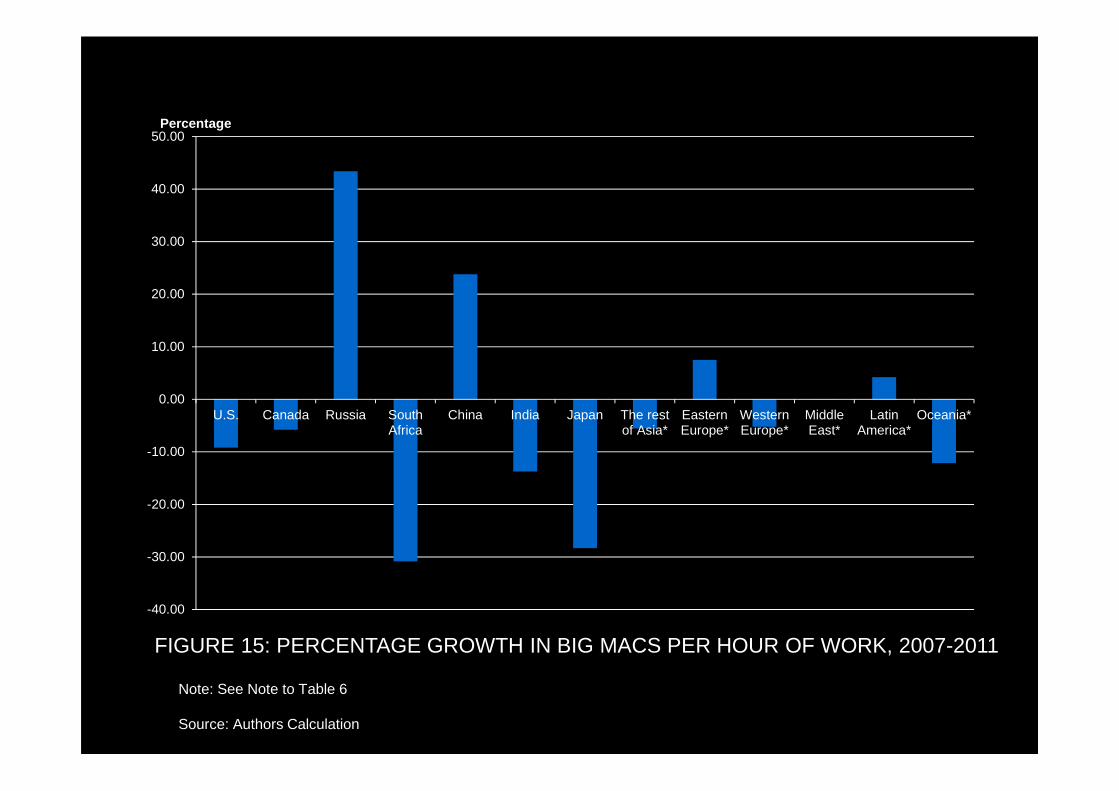
FIGURE 15: PERCENTAGE GROWTH IN BIG MACS PER HOUR OF WORK, 2007-2011
Note: See Note to Table 6
Source: Authors Calculation
-40.00
-30.00
-20.00
-10.00
0.00
10.00
20.00
30.00
40.00
50.00
U.S. Canada Russia SouthAfrica
China India Japan The restof Asia*
EasternEurope*
WesternEurope*
MiddleEast*
LatinAmerica*
Oceania*
Percentage

Comparing Real Wages: the McWage Index
Professor Orley AshenfelterJoseph Douglas Green 1895 Professor of Economics, Princeton UniversityDirector, Industrial Relations Section, Princeton University
Professor Lord LayardChair, LSE
Centre for Economic Performance 21st Birthday Lecture Series
Suggested hashtag for Twitter users: #lsemcwage


![Untitled-15 [ftp.columbia.edu]ftp.columbia.edu/itc/barnard/arthist/wolff/pdfs/week6_duncan...John Layard, Stone Men of Malekula, Yao (London, 1942), 652. Layard drew from his own field](https://img.pdfslide.us/doc/110x75/5b1e05907f8b9ab85b8b46c4/untitled-15-ftp-ftp-layard-stone-men-of-malekula-yao-london-1942-652.jpg)