Embed Size (px)
Citation preview

RURAL ECONOMY
COMPARING PREDICTORS OF DIET QUALITY IN CANADA OVER TIME UNDER CONSIDERATION OF ALTERING FOOD GUIDES
Larissa S. Drescher and Ellen Goddard
Staff Paper #08 - 01
Staff Paper
Department of Rural Economy Faculty of Agricultural, Life & Environmental Sciences University of Alberta Edmonton, Canada

COMPARING PREDICTORS OF DIET QUALITY IN CANADA OVER TIME UNDER CONSIDERATION OF ALTERING FOOD GUIDES
Larissa S. Drescher and Ellen Goddard
The authors are, respectively: Larissa Drescher, Marketing and Consumer Research, Technische Universität München, Germany Ellen Goddard, Department of Rural Economy, University of Alberta, Edmonton, AB Acknowledgements: The authors gratefully acknowledge financial support from the H.
Wilhelm Schaumann-Stiftung Hamburg, Germany and the Co-operative Program in
Agricultural Marketing and Business, University of Alberta. We thank participants of
seminars in Edmonton and Québec City as well as Thomas Herzfeld for valuable comments.
The purpose of the Rural Economy ‘Staff Papers’ series is to provide a forum to accelerate the presentation of issues, concepts, ideas and research results within the academic and professional community. Staff Papers are published without peer review.

Comparing predictors of diet quality in Canada over time under consideration of altering food guides
Abstract
Latest data on the diet of Canadians from the Canadian Community Health Survey reveals
that the diet quality of Canadians needs improvement. Within this paper predictors of diet
quality in Canada are identified based on two cross-sectional data sets from the Canadian
Food Expenditure Survey. To measure diet quality, the Canadian Healthy Food Diversity
(CanHFD)-Index is developed which is based on Food Guide recommendations. Moreover,
this paper considers that the Food Guide between survey years has changed when analyzing
diet quality. To track changes in demand for diet quality we use “Canada’s Food Guide 1982”
to calculate CanHFD-Index for 1984 and 1996. Changes in demand for diet quality according
to “Canada’s Food Guide to Healthy Eating 1992” are observed by calculating CanHFD-
Index with data from 1984 and 1996. Theoretically, this model is related to Becker’s
household production theory and Lancaster’s characteristics approach. Multiple regression
results show significant changes in the Canadian demand for food diversity over time. Some
of the differences can be traced back to the different versions of the Canada Food Guide.
Increasing age, higher income, being female, and high education level are positive predictors
of diet quality in 1984 and 1996 among others.
Keywords: diet quality, healthy food diversity, Canada, Food Guides
JEL Codes: D12, D13, I12, Q18
1
1. Introduction
The Canadian Community Health Survey (2004) reveals that the diet quality of Canadians
needs improvement. For example, the majority of Canadians of all ages do not eat enough
fruits and vegetables. In addition, more than 25% get more than 35% of their calories from
fat. Moreover, snacks (defined as foods and drinks eaten in between meals) make up more
calories than breakfast and almost as many calories as lunch (Garriguet, 2004).
For public health measures targeting an improvement in diet quality, insights into the
predictors of diet quality are indispensable. There is little evidence on predictors of diet
quality in Canada, however. While some studies have looked at diet quality for selected
Canadian regions (Dubois et al., 2000 for Québec; Shatenstein et al., 2005 for Montreal), not
much is known about predictors of diet quality in Canada overall. Far less is known whether
the determinants of diet quality have changed over time, not only for Canada but worldwide.
While consumers’ self-perceived diet quality for their diet is called subjective, diet quality is
objective if it can be measured with nutritional norms (Brockmeier, 1993). Health Canada
publishes nutritional norms that are intended to assure a high diet quality for the majority of
the population. Health Canada uses a Food Guide that was last updated in 2007 (“Eating Well
With Canada’s Food Guide”). Since its first introduction, the Food Guide has been changed
seven times, indicating that objective diet quality is not static. Generally, the Food Guides
have changed in response to current health problems prevalent in the population (e.g. obesity),
or the latest scientific findings (e.g. trans fatty acids). There are also rumours that guidelines
change due to pressure from the food industry (Andresen, 2007).
Observing the evolution of diet quality in Canada over time requires the use of a diet quality
indicator that is able to consider Food Guides. Thus, diet quality is measured according to the
Healthy Food Diversity-Index (Drescher, Thiele and Mensink, 2007) as it is based on Food
Guide recommendations. A number of nutritional studies associate food diversity with
positive health outcomes. Eating diverse has been found to increase diet quality, e.g. the
supply of essential nutrients is higher the more different foods are eaten (Ogle, Huang Hung
and Tuyet, 2001). Since the association between food diversity and diet quality is consistently
high among studies, food diversity itself is regarded as a predictor of diet quality (Ruel,
2003).
Based on these insights, this paper has three objectives. The first objective is to establish a
measure of healthy food diversity for Canada. Second, we identify predictors of diet quality in
Canada for two different survey years. Under the third methodological objective, we compare
2

resulting changes in Food Guides between those years when analyzing diet quality. To make
diet quality comparable over the two survey years though, we calculate it according to two
different versions of Canadian Food Guides.
The organization of this paper is as follows. Section 2 describes the association between food
diversity and diet quality. In the subsequent section (section 3) how diet quality (i.e. food
diversity) can be measured considering Food Guides is explained. Section 4 introduces a
theoretical economic model to derive a demand function for diet quality. In section 5 the data
and methodology used is explained before the results are presented in section 6. This paper
ends with a conclusion.
2. The association between food diversity and diet quality
Traditionally, dietary quality has been measured at the nutrient level due to the fact that diet-
related diseases have been mainly a problem of supply of single nutrients (such as
sugar/caries or fat/cardio-vascular diseases). However, nutrient level indicators are criticised
as they give only a selected view of consumers’ diet and do not reflect total dietary behaviour
(Dubois, Girard and Bergeron, 2000). Michels and Wolk (2002) note that studies solely
considering nutrients might have confounder problems caused by other food items or nutrients
consumed in combination which remain unaccounted for (see also Maunder, Matji and
Hlathswayo-Molea, 2001). Moreover, it has been noted that consumer demand is not focused
on single nutrients but rather on food items (Ogle, Huang Hung and Tuyet, 2001).
Consequently, newer concepts point out the need for defining and analysing dietary quality at
food level. They are regarded as “[…] more adequate for analyses concerned with population
health, because they take into account the complexity of the diet (Dubois, Girard and
Bergeron, 2000, p. 358; see also Kant, 1996). Food diversity indices are food-based dietary
quality measures.
In the past 20 years, up to 50 studies have dealt with the relationship between diversity in the
diet and health outcomes worldwide. Most of the diversity research has been conducted in the
United States. Existing nutritional diversity studies can be categorized into five different
research topics (Drescher, 2007). Among those topics, the greatest attention has been drawn
3

to the relationship between food diversity and dietary quality in terms of nutrient adequacy.
We refer to this literature to justify the use of food diversity as an indicator of diet quality.1
In these diversity studies, whether a high diversity of foods in the diet increases or decreases
the nutrient supply of single nutrient taking into account Recommended Daily Allowances
differentiated by age, sex, physical activity etc. (e.g. Krebs-Smith et al., 1987; Cox et al.,
1997; Hatloy, Torheim and Oshaug, 1998; Torheim et al., 2004) is analyzed.
Most of these studies show that food diversity is strongly correlated with dietary quality and
nutrient adequacy. This finding is also consistent across developing as well as developed
countries. Hence, many studies consider food diversity as a proxy for nutrient adequacy
(Ruel, 2003). For example, Randall, Nichaman and Contant (1985) assess the nutritional
consequence of the differences in food diversity for 3,645 Americans participating in the
second National Health and Nutrition Examination Survey (NHANES II). It is observed that
increasing food diversity, i.e. the increasing number of food items consumed, increases the
total amount of all nutrients consumed. The seminal work of Krebs-Smith et al. (1987) links
diversity measures with dietary quality as defined by the adequacy of intakes of energy, fat,
sugar, cholesterol, and sodium using data of 3,701 U.S. Americans participating in the
Nationwide Food Consumption Survey. Multiple regression findings illustrate that the variety
among major food groups added the most (10%) to the explained variation of all regression
models.
To analyse the relationship between variety and nutritional adequacy in a developing country,
Hatloy, Torheim and Oshaug (1998) use data from 77 children from Mali, West Africa.
Pearson’s correlation coefficients between nutrient adequacy and variety indices are
significant for the coefficient for vitamin C, vitamin A and energy percentage.
Ogle, Huang Hung and Tuyet (2001) observe a small sample size of 196 women in Vietnam.
They focus on the association between food variety, nutrient intake and health status
especially with respect to wild vegetables. Diets high in diversity have significantly higher
intakes of energy and higher mean intake of all considered nutrients.
Overall, although dietary quality and diversity do not reflect the same constructs, diversity
indicators are often preferred to nutrient adequacy dietary quality indicators because the data
required for calculating food diversity is easier to collect (Torheim et al., 2004).
1 Within the other categories, food diversity is associated with health outcomes such as dietary status (e.g. Body
Mass Index), morbidity (cancer, cardiovascular diseases, obesity and body fat), mortality risks and the extent of
food diversity in different population groups (cf. Drescher, 2007).
4

Thus, not only are food diversity indices regarded as better diet quality indicators than
nutrient-based ones, they are also strongly correlated with nutrient-adequacy diet quality
indicators. To sum up, food diversity is a good measure of diet quality.
3. Measuring diet quality under consideration of altering food guides
Food diversity has been analyzed from a technical and a social science perspective. In
nutrition science, food diversity is mainly measured using count measures, such as the Diet
Diversity Score (Kant et al., 1993) or the Food Variety Score (Hatloy, Torheim and Oshaug,
1998). Although these measures belong to the same mathematical class of diversity indices,
they differ e.g. in the consideration of foods that count towards diversity. The problem with
nutritional measures, as pointed out by Drescher, Thiele and Mensink (2007), is that they do
not distinguish between healthy and unhealthy foods consumed. Many nutritional diversity
studies therefore delete unhealthy foods from the analysis. Moreover, count measures fail to
consider the distribution of foods. The distribution of foods is especially important for diet
quality because it does make a difference if the consumer eats two food items in equal shares
(50% each) compared to eating one food with 1% and the other one with 99%.
Economic diversity indices that consider both the number and distribution of food items when
calculating diversity are so called distribution measures also known as concentration
measures (Drescher, Thiele and Mensink, 2007). With these measures, diversity increases the
more foods are eaten in equal shares. Next to the Entropie-Index, the Berry-Index is most
often applied in economic diversity studies (Gollop and Monahan, 1991). The Berry-Index
(BI), an extension of the well-known Herfindahl-Index, was proposed by Berry (1971). It
takes the form:
(1) ∑=
−=n
iisBI
1
21
where, n is the number of foods available, and si is the quantitative share of food i on the total
amounts of foods. High values indicate high diversity. The Berry-Index lies in the range of 0
and 1/1-n. A value of zero would indicate no diversity; that is the diet is completely
concentrated on a single food. If all foods in a consumption basket are eaten in equal shares,
the Berry-Index reaches its maximum. For nutritional purposes the fact that the Berry-Index
reaches highest values whenever foods are eaten in equal shares is undesired. International
Food Guides recommend that “healthier” foods should be eaten in higher proportional shares
than “unhealthy” foods. Against the background of the disadvantages of existing diversity
studies, a new diversity index was proposed for Germany (Drescher, Thiele and Mensink,
5

2007). The idea behind the so called Healthy Food Diversity-Index is to extend the Berry-
Index by a value that describes the healthiness of all foods eaten. The Healthy Food Diversity-
Index takes the following form:
(2) ⎟⎠
⎞⎜⎝
⎛⎟⎠
⎞⎜⎝
⎛−= ∑∑
==
n
iii
n
ii shfsHFD
11
2 *1 .
The first term in (2) is the Berry-Index which measures diversity. The second term measures
the healthiness of the food basket with hfi as health factors that describe the nutritional value
of single food categories. In the original version, these health factors were derived from
German Food Guides (i.e. German Food Pyramid). The food categories that are recognized as
healthier in the Food Guides get higher health factors (e.g. vegetables) than those foods that
are considered as less healthy by the German Food Guides. These health factors are given for
15 food categories. To calculate how healthy the foods eaten are altogether, the quantitative
share of each food is multiplied by the health factor, resulting in the health value. In the end,
the Berry-Index and health value are multiplied to obtain the Healthy Food Diversity-Index.
According to Drescher, Thiele and Mensink (2007), the HFD-Index becomes lower (higher),
the less (more) unhealthy (healthy) foods are eaten. The authors also show that the HFD-
Index better reflects a healthy diet than traditional diversity measures.
For the purpose of this paper, the original HFD-Index is adjusted using different versions of
the Canadian Food Guide. Since this paper compares changes in demand for diet quality
between 1984 and 1996, it is necessary to consider that the Canadian Food Guide changed
between the survey years. Thus, the HFD-Index is adjusted twice according to the effective
Food Guides in the survey years: “Canada’s Food Guide 1982” and “Canada’s Food Guide to
Healthy Eating 1992” for survey year 1984 and 1996, respectively.
Figure 1 and Figure 2 show both, Canada’s Food Guide 1982” and “Canada’s Food Guide to
Healthy Eating 1992” that are used to construct the Canadian Healthy Food Diversity-Index
(CanHFD).
Insert Figure 1 and Figure 2 here
We use recommended servings based on amounts of foods eaten to construct the Canadian
Healthy Food Diversity-Index. The idea behind it is that the recommended servings are
highest for those foods Health Canada regards as healthier while recommended servings for
foods considered as less healthy are lower. Thus, these servings represent a hierarchy in terms
of their nutritional value (which reflects the original idea of the HFD-Index).
6

In the Canadian Food Guides, the recommended servings are given as upper and lower
recommendations. Upper recommendations are given for people with especially high needs
(e.g. sportsmen or pregnant women), while lower levels are given as guidelines for those
groups that have a lower than average need for foods, for example, children. However, the
Food Guides also state that most people can choose servings in between the upper and lower
level (see Canada’s Food Guide to Healthy Eating 1992). This is the reason for deriving the
health factors from mean recommended servings. Technically speaking, the health factors are
derived in the following manner. Starting from the recommended servings given by Health
Canada’s Food Guides, we calculate the mean servings and add them up to total servings.
Afterwards, we calculate the percentage of each mean serving on the total servings. Finally,
the percentages health factors are given in the range between 0 and 1. The derivation of the
health factors based on Canada’s Food Guide 1982 is given in Table 1.
Insert Table 1 here
With respect to Canada’s Food Guide 1982 it has to be noted that there is no “other” food
group. Thus, in the 1982 Food Guide all foods, including such as chocolate, have been
assigned to the group of milk, meat, bread or fruits and vegetables. In this study, the “other”
food group is differentiated for two reasons. First, assigning a food such as chocolate to the
group of fruits of vegetables would be senseless in a study aiming at analyzing diet quality.
Second, Canada’s Food Guide for Healthy Eating 1992 considers the group of “other” foods.
Therefore, the group “other” foods is distinguished in 1982 also in order to make indices
comparable.
The health factors according to Canada’s Food Guide for Healthy Eating 1992 are given in
Table 2.
Insert Table 2 here
Canada’s Food Guide for Healthy Eating 1992 distinguishes the group of “other” foods (see
Figure 2), but it does not quantify recommended servings for the “other” food group to keep
the consumption of these foods as low as possible. However, for our purposes, recommended
servings are essential. We assume that if there is the possibility to eat a food out of the “other”
food group (e.g. chocolate) than it seems justified to attach one “recommended” serving to the
“other” food group. Looking at the mean recommended servings or Canadian health factors
7
reveals the biggest difference between the two Food Guide versions. In 1982 fruits and
vegetables have the highest mean recommended servings. In 1992, fruits and vegetables are
replaced by grain products on first place.
4. Theory
Among the few previous studies that analyze the demand for healthy eating or diet quality are
Variyam et al. (1998) and Drescher et al. (2008). These studies refer to both the household
production theory (according to Becker, 1965) and Lancaster’s characteristics approach
(Lancaster, 1971). In line with these predecessors, we assume that households maximize their
utility to produce (in Lancaster’s terminology) final “commodities”. It is from these
commodities, such as consumer’s own health or the health of the family members, that the
consumer gathers utility. The commodity “own health” is produced using different foods and
medical care as inputs. To the consumer, these inputs have a value because of the
characteristics they contain. For foods, the valued characteristics are taste or nutrients, for
medical care, the valued characteristics are medical services.
The utility function of any representative consumer is (Variyam et al., 1998; Drescher et al.,
2008)
(3) ( )hzQUU ,,=
Q is the consumption bundle (Q = q1,q2,…,q3) and z represents the consumption of non-food
items. H stands for consumers health status. The utility function satisfies the following
conditions: given that the level of food items, non-food items or consumer’s health status
increases, consumer’s level of utility increases also (U’ >0). This utility increases at a
decreasing rate if either Q, z or h increase (U’’<0).
The consumer’s utility function (3) is maximized considering three restrictions. The first
restriction is the budget restriction:
(4) , i = 1,…,n ∑ = ≤+n1i i Yziqp 0≥iq
In the budget restriction, pi is the price of food i. qi describes the quantity of any food eaten.
The price of the non-food item z is for simplification purposes normalised to 1. Finally, Y
describes consumer’s disposable income.
The second restriction is the health production restriction which is defined as (Drescher et al.,
2008):
(5) ( )ECanHFDhh ,, KNF=
8

In (5), CanHFD is the Canadian Healthy Food Diversity-Index that measures consumers diet
quality. In equation (5), NF is a vector of non-food items the consumers uses to produce own
health, too (for example medical services, physical exercise). Variayam et al. (1998) assume
that consumers efficiency of producing h from CanHFD and NF depends on a vector of
personal consumer characteristics. In equation 5, vector K represents a vector of consumer
describing characteristics (e.g. education). E describes the exogenous health endowment out
of consumer’s control (e.g. genetic predisposition) (Drescher et al., 2008).
The third restriction the consumer needs to consider when maximizing his utility is that the
input of CanHFD in the health production function (5) depends on the production function for
healthy food diversity itself:
(6) ( )K,,....,,..., 11 nn hfhfqqgCanHFD =
Drescher et al. (2008) note that the production function in (6) is non-linear. An increasing
quantity of foods does not result in a proportional increase in CanHFD. The authors refer to
Chern (2003) who states that there are characteristics whose production depends on
consumer’s human capital and thus, there is not necessarily a proportional increase. On that
account, Drescher et al. (2008) consider K, the vector of consumer describing characteristics
for the CanHFD production function, too.
Considering the three restrictions when maximizing consumer’s utility gives the demand
function for CanHFD as (cf. Variyam et al., 1998; Drescher et al., 2008):
(7) ),,,,...( d0 EYppCanHFD n1 K=
As a result, CanHFD is a function of food prices, consumer income, consumer-describing
characteristics and the exogenous health endowment.
5. Data and methodology
We use the Canadian Healthy Food Diversity-Index to analyze the demand for diet quality in
Canada. As mentioned in chapter 4, the Canadian Healthy Food Diversity-Index is a product
of the Berry-Index and the health value of the consumption bundle. Because of the Berry-
Index it is necessary to restrict the number of foods available in the data set. Since the Berry-
Index lies in the boundaries of 0 and 1-1/n (with n = number of food items distinguished in
the data set), it can only be compared over different data sets provided that the number of
foods distinguished is the same in all data sets.
For the empirical implementation we use public-use micro-data files of the Canadian Food
Expenditure Survey provided by Statistics Canada using the weekly quantities consumed in
1984 (n=5,360) and 1996 (n=10,459). In order to make the Berry-Index and therewith the
9
Canadian Healthy Food Diversity-Index comparable over all years, the number of foods
counted in each year needs to be the same. Therefore, certain foods from each of the datasets
were excluded. 9.2% have been deleted for the 1984 data set and 5.4% for 1996, respectively.
However, it is shown that the share of each of the deleted foods on the total is small and thus
negligible.2 To track changes in demand for healthy food diversity we use “Canada’s Food
Guide 1982” to calculate CanHFD-Index for 1984 and 1996 (CanHFD82). Accordingly,
CanHFD92 has been calculated for 1984 and 1996 based on “Canada’s Food Guide to Healthy
Eating 1992”. Multiple regressions are conducted for each year using CanHFD-Index as
dependent variable and various socioeconomics to explain differences in the demand for
healthy food diversity. Table 3 gives the descriptive statistics of all variables used in the
regression.
Insert Table 3 here
In detail, four regression models are completed. For Model 1 and Model 2, “Canada’s Food
Guide 1982” is used. In Model 1, the regression is based on data from 1984 and in Model 2
based on data from 1996. Model 3 and Model 4 refer to “Canada’s Food Guide to Healthy
Eating 1992”. Model 3 uses data from 1984 and Model 4 uses the 1996 dataset. Model 2 and
model 3 are kind of hypothetical models. It is at least questionable whether survey
participants in 1996 remembered the 1982 Food Guide version (Model 2). And of course,
survey participants in 1984 did not know the 1992 version of Canada’s Food Guides (Model
3). However, model 2 and model 3 are used to differentiate the time impact (year effect) from
the Food Guide effect on demand for diet quality.
The Canadian Healthy Food Diversity-Index is bounded between 0 and almost 1. In order to
assure the assumptions of normality, the dependent variable is logit transformed which
changes the boundaries of the dependent variable to minus and plus infinity. The logit
transformation is achieved by (Greene, 1997):
(8) ( )( )( )CanHFDCanHFDTCanHFD −= 1/ln
We additionally show cross table results on education and income with the Canadian Healthy
Food Diversity Index.
6. Results
2 Mean quantitative share of deleted foods from 1984, and 1996: 0.024, and 0.011, respectively.
10

The results of the four regression models of the Canadian Healthy Food Diversity-Index on
sociodemographic variables are given in Table 4. Generally, the explanatory variables explain
the CanHFD quite satisfactorily. The coefficient of determination is similar to other cross-
sectional studies.
Insert Table 4 here
To compare the predictors of diet quality the results can be are divided into three categories:
a) predictors that are consistent across the survey years (no change in demand for diet
quality) and that are consistent across Food Guide versions
b) predictors of Canadian demand for diet quality that changes over time (i.e. across
survey years) but that are consistent across the Food Guide versions
c) predictors of Canadian demand for diet quality that can be traced back to Food Guide
changes only.
First, we describe the results that are shown to be consistent across the two different versions
of Canada’s Food Guide (category a) and over the two years 1984 and 1996. These are the
results that are independent of Food Guide changes and that are consistent across the two
survey years. This applies for the variables age, gender, education, born South, born Other,
household size and Prairies.
With regard to the characteristics of the survey participant, the demand for the Canadian
Healthy Food Diversity-Index increases with increasing age. Thus, the older Canadians get,
they eat diets of higher quality. Also, Drescher et al. (2008) show that the demand for Healthy
Food Diversity increases with increasing numbers of foods eaten. They argue that health
aspects of the diet become more important with increasing age. Similarly, Variyam et al.
(1998) show that increasing age leads to higher Healthy Eating Index scores.
Furthermore, it is shown that male Canadians have a significantly lower demand for Healthy
Food Diversity (CanHFD) than female Canadians (reference person). This result stands in
sharp contrast to the analysis by Variyam et al. (1998), who observe no significant influence
of gender on diet quality for US-consumers.
The impact of education is strong and consistent across the years. The effect of education
occurs independent of the Canadian Food Guide version. Compared to Canadian households
with the lowest education level (less than 9 years of education, education level of the
reference person), households with higher education (secondary education, post secondary
education, diploma, university) have higher CanHFD values. This reflects findings in
11

Drescher et al. (2008) and Variyam et al. (1998) where it is argued that more education results
in better knowledge of the diet-health relationship and thus, higher diet quality.
The result that higher income is associated with better diet quality is confirmed with the
following cross tables.
Insert table 5 and table 6 here
For both years, the percentages clarify that with increasing income is associated with higher
diet quality values. This association is found to be significant at the 1% level according to the
Chi2-test for cross table relationship.
For households where the survey participant was born in the South and East Europe (Born
South), the demand for diet quality is considerably higher compared to Canadian born
households in both 1984 and 1996. The same result shows for households that are born in any
other region (Asian and Oceanic).
With regard to the household characteristics, Table 5 shows that regardless of the Food Guide
version or survey year, household size has no impact on the demand for diet quality in Canada
which is a finding in line with Variyam et al. (1998).
With respect to the region it is shown that across both years and Food Guide versions, the diet
quality of households located in the Prairies is highly significantly lower than of households
in British Columbia.
Next, the results of category b) (changed predictors of diet quality consistent across Food
Guide versions) are described. Those are born West, Ontario, single households, lone parent
families and households consisting of relatives.
Among the variables reflecting the survey participants’ place of birth, households born in
United Kingdom, North America, or West Europe have significantly higher diet quality in
1984. However, the demand for diet quality changes: in 1996 there is no longer a significant
difference in the demand for diet quality of Canadian born and Western born people. This
might be due to the fact that the Western born households adapted the consumption structures
of the Canadian born households in the course of time or that diets in those regions converged
over the 1980s. These findings are of high relevance for Canada that is known to be a country
with a high immigration rate.
For both CanHFD versions, in 1984 the demand for food diversity is significantly lower in
Ontario than in British Columbia (reference household). However, there is no significant
difference in the demand for diet quality between Ontario and British Columbia in 1996. This
12

gives reason to assume that households in Ontario improved their diet quality from 1984 to
1996.
From 1984 to 1996 the demand for diet quality changed for single households and lone parent
families. While in 1984 the diet quality of single households appears to be highly significant
lower than for households with a married couple, in 1996 there is no longer a significant
difference between single and married households. The same results are observed for lone
parent families. In 1984, the diet quality in households of lone parent families was highly
significantly lower than in households with married couples while there is no difference in
diet quality between those household types in 1996.
The results further show that households consisting of relatives (but not married couples),
have no different demand for healthy food diversity than households with married couples in
1984. In 1996, households with relatives have a significantly higher demand for healthy food
diversity than married households.
Below the differences in demand for diet quality are described that can be traced back to
changes in Canadian Food Guides (category c). Differences occur for the household
characteristic variable ‘income’ and the regions Atlantic and Québec. The fact that there are
only three predictors of diet quality that belong to category c, i.e. that can be traced back to
altering Food Guides, indicates that the changes made in the Food Guides are minor.
If diet quality is defined based on “Canada’s Food Guide 1982”, increasing income leads to a
higher demand for diet quality in 1984 and 1996. Contrary, given that diet quality is defined
based on “Canada’s Food Guide to Healthy Eating 1992”, income has no impact on the
demand for healthy food diversity in 1984 but has a highly significant impact in 1996. For the
1992 Food Guide version, this indicates that over time income became more important to the
demand for high quality diets.
The fact that higher income is associated with higher diet quality also shows in the following
cross table results:
Insert table 7 and table 8 here
The association between income and diet quality shown in tables 7 and 8 is highly significant.
With the 1982 CanHFD version, there was no significant difference between the CanHFD for
households living in the Atlantic region and those living in British Columbia in 1984.
However, with the CanHFD 1992 version, Atlantic households have significantly lower
CanHFD values in 1984 and 1996 compared to households in British Columbia. For Québec,
13
Table 4 shows varying results. If diet quality is defined using “Canada’s Food Guide 1982”,
households living in Québec have no different demand for diet quality than households in
British Columbia in 1984. In 1996, the demand for diet quality in Québec is higher compared
to households in British Columbia. Contrary, if healthy food diversity is defined using
“Canada’s Food Guide to Healthy Eating 1992”, Québécoise households demand significantly
less diet quality in 1984 than households in British Columbia. However, in 1996 the demand
for diet quality of Québécois households is significantly higher than for households from
British Columbia.
7. Conclusion
Since other studies note that the diet of Canadians is far from being optimal, this study
analyzes the demand for diet quality in overall Canada between the years 1984 and 1996. It is
the first study that observes the demand for diet quality across all Canadian provinces. Diet
quality is measured according to the recently developed Healthy Food Diversity-Index by
Drescher, Thiele and Mensink (2007). For the purpose of this paper, a Canadian version of the
HFD-Index is developed using the Canadian Food Guides that were prevalent at the time of
the Canadian Food Expenditure Survey data collection in 1984 and 1996: “Canada’s Food
Guide 1982” and “Canada’s Food Guide to Healthy Eating 1992”. Another novelty of this
study is that it takes into account that officially recommended diet quality changed between
the two survey years.
The theoretical basis of the study is based on a model of demand for healthy eating in the
style of Becker’s household production theory and Lancaster’s characteristics approach which
have already been applied in other empirical studies on demand for healthy eating or diet
quality (Variyam et al., 1998; Drescher et al., 2008).
For the empirical implementation multiple regressions are conducted for each year using two
versions of CanHFD as dependent variables and various socio-demographic variables to
explain differences in the demand for healthy food diversity. We apply public-use micro-file
data of the Canadian Food Expenditure Survey for 1984 (n=5,360) and 1996 (n=10,459)
provided by Statistics Canada using the weekly quantities consumed for the same 176 food
items.
There are three categories of results. Among the first category (a), predictors that are
consistent across survey years and independent of Food Guides are variables such as age,
education and gender. The second category (b) describes results that changed over time but
these changes occur independent of altering Food Guides. Survey participants place of birth,
14
regional differences and marital status are among these results. Also, there are differences in
the demand for diet quality which can be traced back to the different versions of Canada’s
Food Guides (category c). Given diet quality is defined according to “Canada’s Food Guide
1982”, increasing age, higher income, being female, and high education level are positive
predictors of healthy food diversity in 1984 and 1996 among others. While households living
in Atlantic Provinces (or Québec) have no different demand for diet quality in 1984 than
households living in BC, their demand for diet quality was lower (higher) in 1996. If diet
quality is defined based on “Canada’s Food Guide to Healthy Eating 1992”, similar but not
identical results are observed. E.g., while income is not a significant predictor of diet quality
in 1984, in 1996 it has a strong positive influence.
Future studies should observe changes in Canadian demand for diet quality over time using
newer data sets.
15

References
Andresen, M. (2007). Mixed reviews for Canada’s new food guide. Canadian Medical
Association Journal, 176 (6), 752-753.
Bernstein, M., Tucker, K.L., Ryan, N.D., O'Neill, E.F., Clements, K.M., Nelson, M.E., Evans,
W.J., Fiatarone, M.A. (2002). Higher dietary variety is associated with better nutritional
status in frail elderly people. Journal of the American Dietetic Association, 102, 1096-
1104.
Berry, C.H. (1971). Corporate growth and diversification. Journal of Law and Economics, 14,
371-383.
Brockmeier, M. (1993). Ökonomische Analyse der Nahrungsmittelqualität.
Agrarökonomische Studien, Bd. 17, Kiel: Vauk Verlag.
Dixon, L.B., Cronin, F.J., Krebs-Smith, S.M. (2001). Let the pyramid guide your food
chioces: capturing the total diet concept. Journal of Nutrition (Supplement), 131, 461S-
472S.
Drescher, L. S., (2007): Healthy food diversity as a concept of dietary quality – measurement,
determinants of consumer demand, and willingness to pay. Cuvillier Verlag, Göttingen.
Drescher, L.S., Thiele, S., Mensink, G.B.M. (2007). A new index to measure healthy food
diversity better reflects diet quality than traditional measures. The Journal of Nutrition,
137, 647-651.
Drescher, L.S., Thiele, S., Roosen, J., Mensink, G.B.M. (2008). Consumer demand for a
healthy diet considering diversity. Working Paper, Christian-Albrechts-Universität zu
Kiel, Germany.
Dubois, L., Girard, M., Bergeron, N. (2000). The choice of a diet quality indicator to evaluate
the nutritional health of populations. Public Health Nutrition, 3, 357-365.
Elmadfa, I., Leitzmann, C. (2004). Ernährung des Menschen. Stuttgart: Ulmer.
Fernandez, E., D'Avanzo, B., Negri, E., Franceschi, S., La Vecchia, C. (1996). Diet diversity
and the risk of colorectal cancer in Northern Italy. Cancer Epidemiology, Biomarkers &
Prevention, 5, 433-436.
Garriguet, D. (2004). Overview of Canadians’ Eating Habits. Nutrition Findings from the
Canadian Community Health Survey. Statistics Canada, Health Statistics Division,
Research Paper.
Gollop, F.M., Monahan, J.L. (1991). A generalized index of diversification: trends in US
manufacturing. The Review of Economics and Statistics, 2, 318-330.
16

Greene, W.H. (1997). Econometric analysis. Englewood, Cliffs, NJ: Prentice Hall.
Hatloy, A., Hallund, J., Diarra, M.M., Oshaug, A. (2000). Food variety, socioeconomic status
and nutritional status in urban and rural areas in Koutiala (Mali). Public Health Nutrition,
3, 57-65.
Health Canada (2002). Canada’s Food Guides from 1942 to 1992. Ottawa, ISBN 0-662-
32989-9.
Jansen, M.C.J.F., Bueno-de-Mesquita, H.B., Feskens, E.J.M., Streppel, M.T., Kok, F.J.,
Kromhout, D. (2004). Quantity and variety of fruit and vegetable consumption and cancer
risk. Nutrition and Cancer, 48, 142-148.
Kant, A.K., Schatzkin, A., Harris, T.B., Ziegler, R.G., Block, G. (1993). Dietary diversity and
subsequent mortality in the First National Health and Nutrition Examination Survey
Epidemiologic Follow-up Study. American Journal of Clinical Nutrition, 57, 434-440.
Katanoda, K., Kim, H.S., Matsumura, Y. (2006). New Quantitative Index for Dietary
Diversity (QUANTIDD) and its annual changes in the Japanese. Nutrition, 22, 283-287.
Kennedy, E. (2004). Dietary diversity, diet quality, and body weight regulation. Nutrition
Reviews, 62, S78-S81.
Kennedy, E., Meyers, L., Layden, W. (1996). The 1995 Dietary Guidelines for Americans:
An overview. Journal of the American Dietetic Association, 96, 234-237.
Krebs-Smith, S.M., Smiciklas-Wright, H., Guthrie, H.A., Krebs-Smith, J. (1987). The effects
of variety in food choices on dietary quality. Journal of the American Dietetic
Association, 87, 897-902.
Lancaster, K. (1971). Consumer demand: a new approach. New York: Columbia Univ. Press.
McCrory, M.A., Fuss, P.J., McCallum, J.E., Yao, M., Vinken, A.G., Hays, N.P., Roberts, S.B.
(1999). Dietary variety within food groups: association with energy intake and body
fatness in men and women. American Journal of Clinical Nutrition, 69, 440-447.
Michels, K.B., Wolk, A. (2002). A prospective study of variety of healthy foods and mortality
in women. International Journal of Epidemiology, 31, 847-854.
Murphy, S.P., Foote, J.A., Wilkens, L.R., Basiotis, P.P., Carlson, A., White, K.K.L.,
Yonemori, K.M. (2006). Simple measures of dietary variety are associated with improved
dietary quality. Journal of the American Dietetic Association, 106, 425-429.
Ogle, B.M., Huang Hung, P., Tuyet, H.T. (2001). Significance of wild vegetables in
micornutrient intakes of women in Vietnam: An analysis of food variety. Asia Pacific
Journal of Clinical Nutrition, 10, 21-30.
17
Onyango, A., Koski, K.G., Tucker, K.L. (1998). Food diversity versus breastfeeding choice in
determining anthropometric status in rural Kenyan toddlers. International Journal of
Epidemiology, 27, 484-489.
Randall, E., Nichaman, M.Z., Contant, J.C.F. (1985). Diet diversity and nutrient intake.
Journal of the American Dietetic Association, 85, 830-836.
Raynor, H.A., Jeffery, R.W., Phelan, S., Holl. James, O., Wing, R.R. (2005). Amount of food
group variety consumed in the diet and long-term weight loss maintenance. Obesity
Research, 13, 883-890.
Ruel, M.T. (2003). Operationalizing dietary diversity: A review of measurement issues and
research priorities. Journal of Nutrition, 133, 3911S-3926S.
Shatenstein, B., Nadon, S., Godin, C., Ferland, G. (2005). Diet quality of Montreal-area adults
needs improvement: estimates from a self-administered food frequency questionnaire
furnishing a dietary indicator score.
Slattery, M.L., Berry, T.D., Potter, J., Caan, B. (1997). Diet diversity, diet composition, and
risk of colon cancer (United States). Cancer Causes and Control, 8, 872-882.
Variyam, J.N., Blaylock, J., Smallwood, D., Basiotis, P.P. (1998). USDA's Healthy Eating
Index and nutrition information. Economic Research Service/ USDA, Technical Bulletin,
1866. Washington, D.C.
18

Figure 1: Canada’s Food Guide 1982
Source: Health Canada, 2002, p. 19-20.
Figure 2: Canada’s Food Guide to Healthy Eating 1992
Source: Health Canada, 2002, p. 22-23.
19

20
Table 1: Derivation of health factors based on Canada’s Food Guide 1982
Food group Recommended servings (source)
Mean servings % of total servings
Health factors
Milk, milk products
2 2 14.81% 0.15
Meat, fish, poultry and alternates
2 2 14.81% 0.15
Bread and cereals
3-5 4 29.63% 0.30
Fruits and vegetables
4-5 4.5 33.33% 0.33
Other (not differentiated)
1 1 7.41% 0.07
Total servings 13.5 100% 1
Table 2: Derivation of health factors based on Canada’s Food Guide for Healthy Eating
1992
Food group Recommended servings
Mean servings % of total servings
Health factors
Grain products 5-12 8.5 37.78 0.38 Vegetables and fruits
5-10 7.5 33.33 0.33
Milk products 2-4 3 13.33 0.13 Meat and alternatives
2-3 2.5 11.11 0.11
Other foods 1 1 4.44 0.04 Total servings 22.5 100% 1

Table 3: Descriptive statistics of variables used in OLS regression
Mean (Std.dev) Min (Max) Variable Description 1984 1996 1984 1996
Dependent variables
CanHFD Version 1982
Diet quality measure calculated from
where si is the share of food i on total quantities and hfi is the health factor for food i derived from Canada’s Food Guide 1982
⎟⎠
⎞⎜⎝
⎛⎟⎠
⎞⎜⎝
⎛−= ∑∑
==
n
iii
n
ii shfsHFD
11
2 *10.56 (0.12) 0.56 (0.13) 0.01 (0.85) 0.004
(0.87)
CanHFD Version 1992
Diet quality measure calculated from
where si is the share of food i on total quantities and hfi is the health factor for food i derived from Canada’s Food Guide 1992
⎟⎠
⎞⎜⎝
⎛⎟⎠
⎞⎜⎝
⎛−= ∑∑
==
n
iii
n
ii shfsHFD
11
2 *10.49 (0.11) 0.49 (0.12) 0.01 (0.75) 0.002
(0.78)
Characteristics of the survey participant
Ln Age Logarithm of the age of the survey participant 3.74 (0.38) 3.81 (0.34) 3.00 (4.33) 3.18 (4.38)
Male Dummy variable is set at 1 if the survey participant is male and 0 otherwise 0.69 (0.46) 0.48 (0.50) 0 (1) 0 (1)
Female Dummy variable is set at 1 if the survey participant is female and 0 otherwise
0.31 (0.46) 0.52 (0.50) 0 (1) 0 (1)
Low education Low education - Dummy variable is set equal to 1 if the survey participant has completed less than 9 years of education and 0 otherwise
0.15 (0.36) 0.12 (0.33) 0 (1) 0 (1)
Secondary education
Secondary education – Dummy variable is set equal to 1 if the survey participant has completed some or completed secondary education and 0 otherwise
0.45 (0.50) 0.40 (0.49) 0 (1) 0 (1)
Post secondary education
Post secondary education – Dummy variable is set equal to 1 if the survey participant has some post-secondary education and is 0 otherwise
0.13 (0.33) 0.14 (0.34) 0 (1) 0 (1)
Diploma Diploma – Dummy variable is set equal to 1 if the survey participant has a post-secondary non-university certificate or diploma and is 0 otherwise
0.13 (0.33) 0.19 (0.40) 0 (1) 0 (1)
University University – Dummy variable is set equal to 1 if the survey participant has a 0.14 (0.35) 0.15 (0.35) 0 (1) 0 (1)
21

university degree and is 0 otherwise Born West Born West – Dummy variable is set equal to 1 if the survey participant in
United Kingdom, North America, and West Europe and is 0 otherwise
0.10 (0.29) 0.07 (0.25) 0 (1) 0 (1)
Born South Born South – Dummy variable is set equal to 1 if the survey participant is born in South and East Europe and is 0 otherwise
0.06 (0.23) 0.03 (0.17) 0 (1) 0 (1)
Born Other Born Other – Dummy variable is set equal to 1 if the survey participant is born in Asia and Oceanic or elsewhere and is 0 otherwise
0.05 (0.23) 0.04 (0.19) 0 (1) 0 (1)
Born Canada Born Canada – Dummy variable is set equal to 1 if the survey participant is born in Canada and is 0 otherwise
0.79 (0.41) 0.84 (0.37) 0 (1) 0 (1)
Household characteristics
HHSize Number of persons in the household 2.70 (1.43) 2.66 (1.35) 1 (10) 1 (6)
Ln Income Logarithm of Income – personal income in the past 12 months, income of all family members
10.10 (0.73)
10.46 (0.78) 5.88 (12.00)
5.7 (13.65)
Atlantic Dummy variable is set equal to 1 if the household is living Newfoundland and Labrador, Prince Edward Island, Nova Scotia, New Brunswick and is 0 otherwise
0.17 (0.37) 0.23 (0.42) 0 (1) 0 (1)
Québec Dummy variable is set equal to 1 if the household is living in Quebec an is 0 otherwise
0.17 (0.37) 0.16 (0.36) 0 (1) 0 (1)
Ontario Dummy variable is set equal to 1 if the household is living in Ontario and is 0 otherwise
0.23 (0.42) 0.26 (0.44) 0 (1) 0 (1)
Prairies Dummy variable is set equal to 1 if the household is living in Manitoba, Saskatchewan, Alberta and 0 otherwise
0.31 (0.46) 0.23 (0.42) 0 (1) 0 (1)
BC Dummy variable is set equal to 1 if the household is living in British Columbia and is 0 otherwise
0.12 (0.33) 0.13 (0.33) 0 (1) 0 (1)
Single Single household – dummy variable is set equal to 1 if the household is a single household and 0 otherwise
0.23 (0.42) 0.22 (0.41) 0 (1) 0 (1)
Married HH Married household – Dummy variable is set equal to 1 if the household is a married couple without children and without additional persons and is 0
0.22 (0.42) 0.25 (0.43) 0 (1) 0 (1)
22

23
otherwise Marriedwchild Married household with children – Dummy variable is set equal to 1 if the
household is a married couple with unmarried children and without additional persons and is 0 otherwise
0.38 (0.49) 0.36 (0.48) 0 (1) 0 (1)
Marriedwrelat Married household with relatives – Dummy variable is set equal to 1 if the household is a married couple with additional persons and is 0 otherwise
0.03 (0.17) 0.04 (0.19) 0 (1) 0 (1)
loneparent Lone parent – Dummy variable is set equal to 1 if the household is a lone parent household and 0 otherwise
0.08 (0.26) 0.08 (0.27) 0 (1) 0 (1)
HHrelatives Household with relatives – Dummy variable is set equal to 1 if all persons in the household are related and 0 otherwise
0.03 (0.16) 0.03 (0.19) 0 (1) 0 (1)
Nonmarried Other non married household – Dummy variable is set equal to 1 if at least one person in the household is unrelated and is 0 otherwise
0.03 (0.18) 0.03 (0.17) 0 (1) 0 (1)
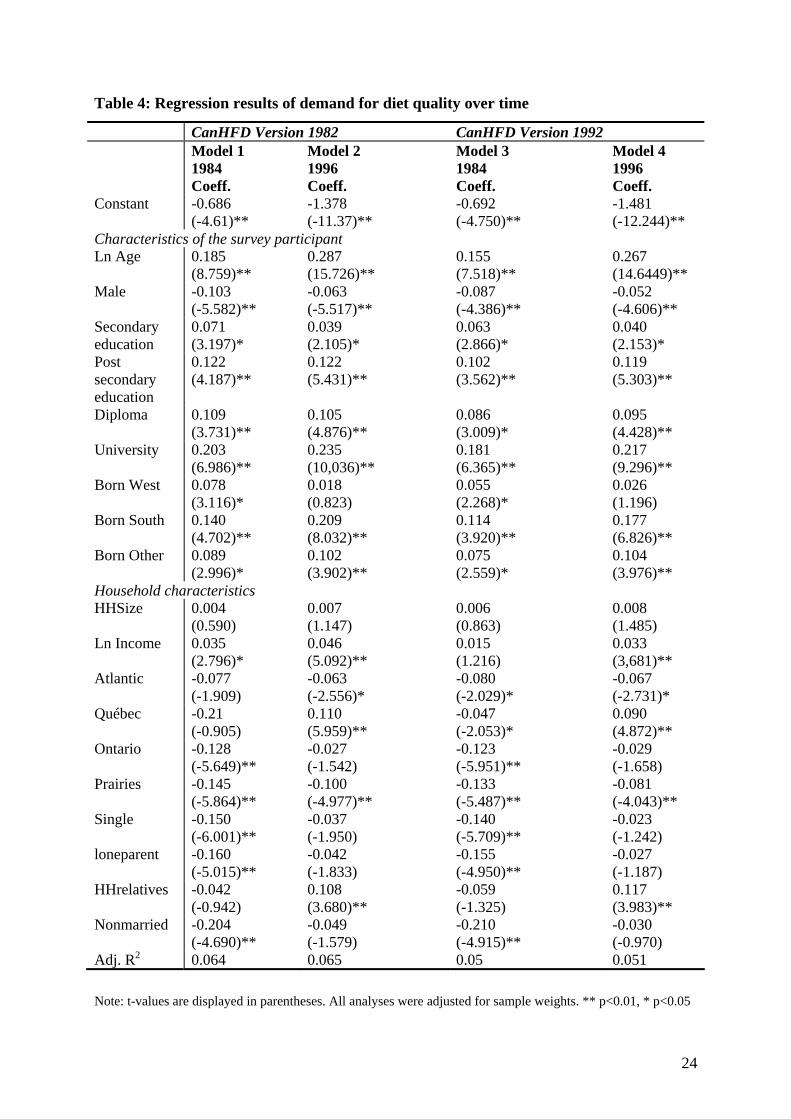
Table 4: Regression results of demand for diet quality over time
CanHFD Version 1982 CanHFD Version 1992 Model 1 Model 2 Model 3 Model 4 1984
Coeff. 1996 Coeff.
1984 Coeff.
1996 Coeff.
Constant -0.686 (-4.61)**
-1.378 (-11.37)**
-0.692 (-4.750)**
-1.481 (-12.244)**
Characteristics of the survey participant Ln Age 0.185
(8.759)** 0.287 (15.726)**
0.155 (7.518)**
0.267 (14.6449)**
Male -0.103 (-5.582)**
-0.063 (-5.517)**
-0.087 (-4.386)**
-0.052 (-4.606)**
Secondary education
0.071 (3.197)*
0.039 (2.105)*
0.063 (2.866)*
0.040 (2.153)*
Post secondary education
0.122 (4.187)**
0.122 (5.431)**
0.102 (3.562)**
0.119 (5.303)**
Diploma 0.109 (3.731)**
0.105 (4.876)**
0.086 (3.009)*
0.095 (4.428)**
University 0.203 (6.986)**
0.235 (10,036)**
0.181 (6.365)**
0.217 (9.296)**
Born West 0.078 (3.116)*
0.018 (0.823)
0.055 (2.268)*
0.026 (1.196)
Born South 0.140 (4.702)**
0.209 (8.032)**
0.114 (3.920)**
0.177 (6.826)**
Born Other 0.089 (2.996)*
0.102 (3.902)**
0.075 (2.559)*
0.104 (3.976)**
Household characteristics HHSize 0.004
(0.590) 0.007 (1.147)
0.006 (0.863)
0.008 (1.485)
Ln Income 0.035 (2.796)*
0.046 (5.092)**
0.015 (1.216)
0.033 (3,681)**
Atlantic -0.077 (-1.909)
-0.063 (-2.556)*
-0.080 (-2.029)*
-0.067 (-2.731)*
Québec -0.21 (-0.905)
0.110 (5.959)**
-0.047 (-2.053)*
0.090 (4.872)**
Ontario -0.128 (-5.649)**
-0.027 (-1.542)
-0.123 (-5.951)**
-0.029 (-1.658)
Prairies -0.145 (-5.864)**
-0.100 (-4.977)**
-0.133 (-5.487)**
-0.081 (-4.043)**
Single -0.150 (-6.001)**
-0.037 (-1.950)
-0.140 (-5.709)**
-0.023 (-1.242)
loneparent -0.160 (-5.015)**
-0.042 (-1.833)
-0.155 (-4.950)**
-0.027 (-1.187)
HHrelatives -0.042 (-0.942)
0.108 (3.680)**
-0.059 (-1.325)
0.117 (3.983)**
Nonmarried -0.204 (-4.690)**
-0.049 (-1.579)
-0.210 (-4.915)**
-0.030 (-0.970)
Adj. R2 0.064 0.065 0.05 0.051
Note: t-values are displayed in parentheses. All analyses were adjusted for sample weights. ** p<0.01, * p<0.05
24

25
Table 5: Cross table results 1984, CanHFD-Index and income categories by quintiles
Income
CanHFD Low Medium High
Low 39.2% 32.5% 28.3%
Medium 30.3% 32.4% 37.1%
High 30.5% 35.1% 34.6%
Total 100% 100% 100%
Table 6: Cross table results 1996, CanHFD-Index and income categories by quintiles
Income
CanHFD Low Medium High
Low 34.6% 33.8% 31.5%
Medium 30.6% 34.1% 35.5%
High 34.8% 32.1% 33.0%
Total 100% 100% 100%
Table 7: Cross table results, CanHFD-Index 1984 by quantiles and education categories
Education
CanHFD Low Secondary Post
secondary
Diploma University
Low 28.4% 25.9% 24.5% 23.8% 18.2%
Medium 50.9% 49.7% 49.7% 47.0% 46.0%
High 20.7% 24.4% 25.7% 29.1% 35.7%
Total 100% 100% 100% 100% 100%
Table 8: Cross table results, CanHFD-Index 1996 by quantiles and education categories
Education
CanHFD Low Secondary Post
secondary
Diploma University
Low 32.5% 37.3% 30.4% 33.4% 25.9%
Medium 34.0% 32.1% 35.8% 35.1% 31.5%
High 33.5% 30.6% 33.7% 31.5% 42.5%
Total 100% 100% 100% 100% 100%