Embed Size (px)
Citation preview
ª 2014 by the Academy of Nutrition and Dietetics. J
RESEARCH
Research and Professional BriefsComparing Nutrition Environments in Bodegas andFast-Food RestaurantsKathryn M. Neckerman, PhD; Laszlo Lovasi; Paulette Yousefzadeh, MA; Daniel Sheehan, MS; Karla Milinkovic; Aileen Baecker, MPH;Michael D. M. Bader, PhD; Christopher Weiss, PhD; Gina S. Lovasi, PhD; Andrew Rundle, DrPH
ARTICLE INFORMATION
Article history:Accepted 26 June 2013Available online 12 September 2013
Keywords:Nutrition environmentRestaurantsNutrition Environment Measures Study inRestaurants (NEMS-R)
Fast foodCorner stores
Copyright ª 2014 by the Academy of Nutritionand Dietetics.2212-2672/$36.00http://dx.doi.org/10.1016/j.jand.2013.07.007
ABSTRACTMany small grocery stores or “bodegas” sell prepared or ready-to-eat items, filling aniche in the food environment similar to fast-food restaurants. However, littlecomparative information is available about the nutrition environments of bodegas andfast-food outlets. This study compared the nutrition environments of bodegas and na-tional chain fast-food restaurants using a common audit instrument, the NutritionEnvironment Measures Study in Restaurants (NEMS-R) protocol. The analytic sampleincluded 109 bodegas and 107 fast-food restaurants located in New York City neigh-borhoods in the upper third and lower third of the census tract poverty rate distribu-tion. Inter-rater reliability was evaluated in 102 food outlets, including 31 from theanalytic sample and 71 from a supplementary convenience sample. The analysiscompared scores on individual NEMS-R items, a total summary score, and subscoresindicating healthy food availability, nutrition information, promotions of healthy orunhealthy eating, and price incentives for healthy eating, using t tests and c2 statistics toevaluate differences by outlet type and neighborhood poverty. Fast-food restaurantswere more likely to provide nutrition information, and bodegas scored higher onhealthy food availability, promotions, and pricing. Bodegas and fast-food restaurantshad similar NEMS-R total scores (bodegas 13.09, fast food 14.31; P¼0.22). NEMS-R totalscores were higher (indicating healthier environments) in low- than high-povertyneighborhoods among both bodegas (14.79 vs 11.54; P¼0.01) and fast-food restau-rants (16.27 vs 11.60; P<0.01). Results imply different policy measures to improvenutrition environments in the two types of food outlets.J Acad Nutr Diet. 2014;114:595-602.
FOOD CONSUMED AWAY FROM HOME ACCOUNTS FORnearly half of all food expenditures.1 Research on thefood environment that shapes this consumption hasfocused on restaurants, highlighting the distinction
between full-service and take-out or fast-food restaurants.2,3
However, many small grocery stores, particularly in urban en-vironments, sell packaged ready-to-eat items or offer pre-pared food from deli counters, salad bars, or steam tables,filling a similar niche in the food environment as fast-foodor take-out restaurants.4 Because they are classified as gro-cery stores, such outlets are excluded from measures of therestaurant environment.The implications of this exclusion for measures of food
environment quality are unclear. Small stores are conven-tionally evaluated using audit tools designed for grocerystores, and audit studies typically compare them with su-permarkets or other larger stores.5,6 Such audits do notconsider the nutrition environment that small stores provideto consumers who purchase prepared or packaged ready-to-eat food. A few studies have examined the availability ofenergy-dense snacks in small grocery stores and the impli-cations for those exposed to these outlets.7-11 Although thesestudies do consider ready-to-eat foods, they focus on snack
foods and do not fully inventory healthy foods that might beavailable in small stores, nor do they benchmark the resultsagainst those for restaurants. A recent Baltimore-based studyof food outlets selling prepared foods included corner storesand considered a broader range of healthy foods and health-promoting features, but the small sample limited comparisonacross food-outlet type.4
The objective of this study was to compare the nutritionenvironments of national chain fast-food restaurants andsmall grocery stores (“bodegas”) using a common instrument,the Nutrition Environment Measures Study in Restaurants(NEMS-R).12 Hypotheses included the following: fast-foodrestaurants are more likely than bodegas to post nutritioninformation, the nutrition environment is better in low-poverty than high-poverty neighborhoods, and differencesin the nutrition environment by neighborhood poverty aresmaller in fast-food restaurants than in bodegas.
METHODSNEMS-R ProtocolThe NEMS-R protocol used in this study was designed tomeasure the nutrition environment in restaurants.13 It
OURNAL OF THE ACADEMY OF NUTRITION AND DIETETICS 595
RESEARCH
includes indicators of healthy food availability, as well as thepresence of nutrition information, promotions, and pricingthat promote healthy or unhealthy food choices. (For adescription of NEMS-R items, see http://www.med.upenn.edu/nems/measures.shtml.) The protocol has good inter-rater and testeretest reliability12 and has been widelyused.4,14-19 Summary scores can be constructed using aNEMS-R scoring tool. Training in the NEMS protocol isavailable via a 20-hour online interactive course followed bydata collection at four food outlets,20 with NEMS certificationavailable upon course completion (http://www.med.upenn.edu/nems/). Audits were conducted by five summer internsworking with two field supervisors, all of whom took theNEMS training and received certification.Pilot work was undertaken to determine the feasibility of
using the NEMS-R protocol, which is designed for restau-rants, in bodegas. Field staff visited bodegas in high- and low-income neighborhoods in New York City and noted anydifficulties they faced in administering the NEMS-R inventory.Supplementary instructions were added when necessary toclarify how specific items were to be categorized in bodegas.Coders were instructed to include only single-serving�sizedpackaged or ready-to-eat foods. To count entrées in bodegas,raters counted the total number of deli meats, the number ofnamed sandwiches (eg, “BLT” or “Cubano”), the number ofnamed or combination plates, and the number of breakfastitems offered all day. Coders were given examples of signagepromoting healthy eating, including industry posters adver-tising diet soda and low-salt varieties of deli meat and NewYork City Department of Health and Mental Hygiene signagepromoting lower-sodium foods. Because few bodegas hadwebsites, two items gauging the availability of nutrition in-formation online were not assessed; all other NEMS-R itemswere retained in the protocol.
Samples and Field ProceduresThe study employed two overlapping samples. Sample 1 (theanalytic sample) included bodegas and national chain fast-food restaurants in low-income and high-income neighbor-hoods in New York City. A two-step procedure was followedto select food outlets for this sample. The first step was toidentify areas—typically 6 to 8 blocks of major commercialstreets—that had a high density of both fast-food restaurantsand bodegas and that fell within the top third or bottom thirdof the city-wide distribution of census tract poverty rates.Project staff identified these areas by mapping bodegas andnational chain fast-food restaurants using Dun & Bradstreetbusiness microdata for 2005, categorized using coding pro-cedures employed in the authors’ previous work.21 Neigh-borhood poverty classification was based on tract-level datafrom the Census 2000 summary file 3. Neighborhoods >90minutes away (by public transit) from the research officewere excluded to limit travel time for the raters. A total of 34areas were sampled, including 10 in the Bronx, 17 in Man-hattan, and 7 in Brooklyn.The second step was to audit bodegas and fast-food outlets
in the sampled commercial areas. The field staff walked alongall streets within these areas and attempted to audit all na-tional chain fast-food restaurants and all bodegas (defined assmall grocery stores with no more than two cash registers).To initiate data collection, a field supervisor approached the
596 JOURNAL OF THE ACADEMY OF NUTRITION AND DIETETICS
owner or manager of the establishment, accompanied by oneor more interns, to describe the study and ask permission toconduct an audit; he or she provided a letter from the ProjectDirector with information about the purpose of the study. Ifpermission was given, the audit was conducted, with scoresrecorded on paper forms. The study was deemed exemptfrom Institutional Review Board review under federal regu-lation 45 CFR §46.101(a) because it did not meet the defini-tion of human subjects research.22
Sample 2 was employed for analysis of inter-rater reli-ability and included 31 establishments from sample 1 thatwere evaluated by more than one rater, as well as 71 estab-lishments from a supplementary convenience sample ofoutlets located near the research office and evaluated bymore than one rater. When multiple coders audited the sameoutlet, they completed audits on the same day and wereinstructed not to consult with each other or compareanswers.
Statistical AnalysisMeans and proportions were calculated for individualNEMS-R items in sample 1, with t tests and c2 statistics usedto assess statistical significance. Counts of healthy food itemswere converted to dichotomous measures of presence orabsence of those items.Total NEMS-R scores were calculated in sample 1 using a
scoring sheet available from NEMS, which assigned weightsto values of each item. The total score has a hypotheticalrange from �27 to 59, with higher scores indicating betternutrition environments. To aid in interpretation, total scoreswere rescaled to have a hypothetical range of 0 to 100. Bothoriginal and rescaled total scores are presented. Subscoresrepresenting key dimensions of the nutrition environmentwere created by combining items related to healthy foodavailability, promotions, nutrition information, and pricing.Hypothetical ranges for these subscores were 0 to 30 forhealthy food availability, �15 to 9 for promotions, 0 to 14 fornutrition information, and �12 to 6 for pricing.Inter-rater reliability was assessed in sample 2 using per-
centage agreement and k statistics for the dichotomous itemsand Spearman rank-order correlations for the continuousitems. Because bias and high/low prevalence can affect kvalues,23 two additional diagnostics were calculated fordichotomous items: the Bias Index, which measures theextent to which the marginals of a 2�2 table differ, andPrevalence Index, a measure of prevalence. A few outletswere visited by more than two raters; in those instances, twoscores were randomly selected for the reliability assessment.All analyses were conducted with Stata software (version
12.1, 2012).
RESULTSFew difficulties were encountered in using the NEMS-Rprotocol in fast-food restaurants or bodegas. Cooperationwith the study was good, with only 8.9% of establishmentsdeclining participation. Refusal rates did not differ signifi-cantly by neighborhood poverty, but refusal was more com-mon for bodegas than fast-food restaurants (12.5% vs 4.6%;P¼0.02). After exclusion of 41 cases with missing data for atleast one NEMS-R item, the analytic sample included 109bodegas and 107 fast-food establishments, with 47.2% located
April 2014 Volume 114 Number 4
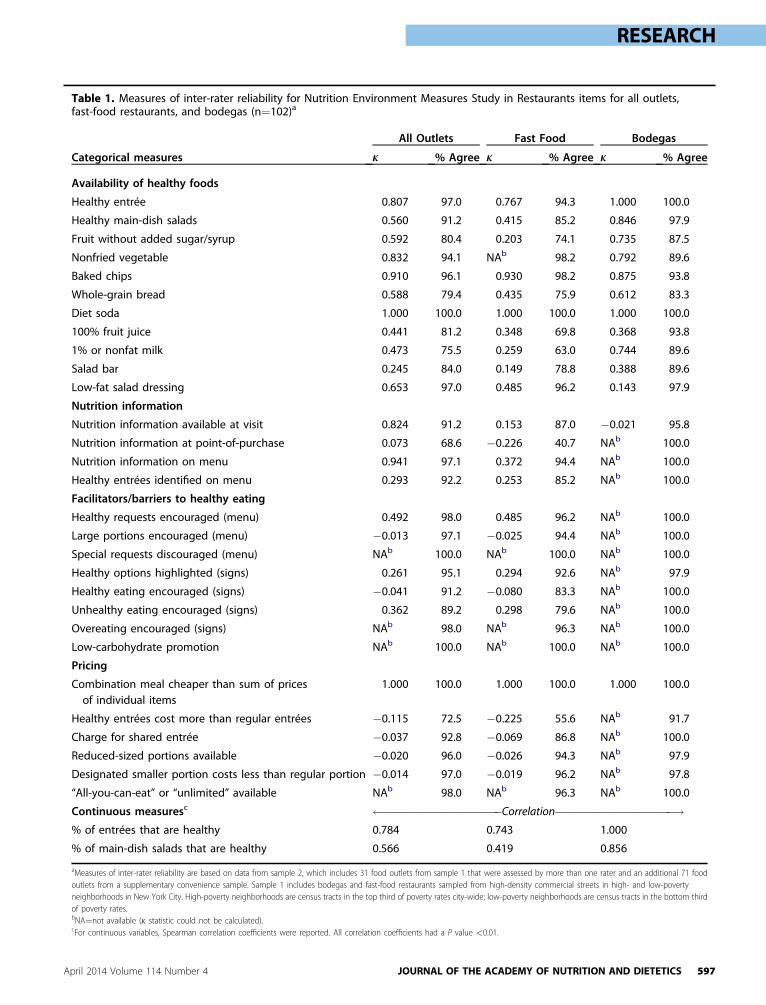
Table 1. Measures of inter-rater reliability for Nutrition Environment Measures Study in Restaurants items for all outlets,fast-food restaurants, and bodegas (n¼102)a
Categorical measures
All Outlets Fast Food Bodegas
k % Agree k % Agree k % Agree
Availability of healthy foods
Healthy entrée 0.807 97.0 0.767 94.3 1.000 100.0
Healthy main-dish salads 0.560 91.2 0.415 85.2 0.846 97.9
Fruit without added sugar/syrup 0.592 80.4 0.203 74.1 0.735 87.5
Nonfried vegetable 0.832 94.1 NAb 98.2 0.792 89.6
Baked chips 0.910 96.1 0.930 98.2 0.875 93.8
Whole-grain bread 0.588 79.4 0.435 75.9 0.612 83.3
Diet soda 1.000 100.0 1.000 100.0 1.000 100.0
100% fruit juice 0.441 81.2 0.348 69.8 0.368 93.8
1% or nonfat milk 0.473 75.5 0.259 63.0 0.744 89.6
Salad bar 0.245 84.0 0.149 78.8 0.388 89.6
Low-fat salad dressing 0.653 97.0 0.485 96.2 0.143 97.9
Nutrition information
Nutrition information available at visit 0.824 91.2 0.153 87.0 �0.021 95.8
Nutrition information at point-of-purchase 0.073 68.6 �0.226 40.7 NAb 100.0
Nutrition information on menu 0.941 97.1 0.372 94.4 NAb 100.0
Healthy entrées identified on menu 0.293 92.2 0.253 85.2 NAb 100.0
Facilitators/barriers to healthy eating
Healthy requests encouraged (menu) 0.492 98.0 0.485 96.2 NAb 100.0
Large portions encouraged (menu) �0.013 97.1 �0.025 94.4 NAb 100.0
Special requests discouraged (menu) NAb 100.0 NAb 100.0 NAb 100.0
Healthy options highlighted (signs) 0.261 95.1 0.294 92.6 NAb 97.9
Healthy eating encouraged (signs) �0.041 91.2 �0.080 83.3 NAb 100.0
Unhealthy eating encouraged (signs) 0.362 89.2 0.298 79.6 NAb 100.0
Overeating encouraged (signs) NAb 98.0 NAb 96.3 NAb 100.0
Low-carbohydrate promotion NAb 100.0 NAb 100.0 NAb 100.0
Pricing
Combination meal cheaper than sum of pricesof individual items
1.000 100.0 1.000 100.0 1.000 100.0
Healthy entrées cost more than regular entrées �0.115 72.5 �0.225 55.6 NAb 91.7
Charge for shared entrée �0.037 92.8 �0.069 86.8 NAb 100.0
Reduced-sized portions available �0.020 96.0 �0.026 94.3 NAb 97.9
Designated smaller portion costs less than regular portion �0.014 97.0 �0.019 96.2 NAb 97.8
“All-you-can-eat” or “unlimited” available NAb 98.0 NAb 96.3 NAb 100.0
Continuous measuresc ������������������Correlation
������������������!% of entrées that are healthy 0.784 0.743 1.000
% of main-dish salads that are healthy 0.566 0.419 0.856
aMeasures of inter-rater reliability are based on data from sample 2, which includes 31 food outlets from sample 1 that were assessed by more than one rater and an additional 71 foodoutlets from a supplementary convenience sample. Sample 1 includes bodegas and fast-food restaurants sampled from high-density commercial streets in high- and low-povertyneighborhoods in New York City. High-poverty neighborhoods are census tracts in the top third of poverty rates city-wide; low-poverty neighborhoods are census tracts in the bottom thirdof poverty rates.bNA¼not available (k statistic could not be calculated).cFor continuous variables, Spearman correlation coefficients were reported. All correlation coefficients had a P value <0.01.
RESEARCH
April 2014 Volume 114 Number 4 JOURNAL OF THE ACADEMY OF NUTRITION AND DIETETICS 597
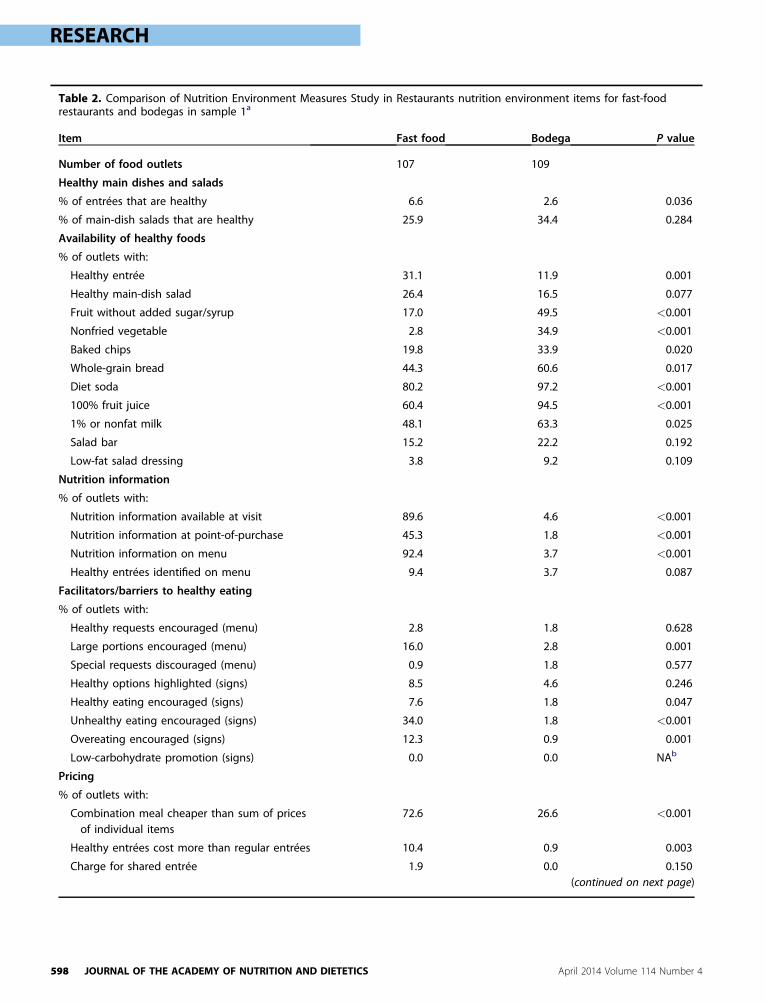
Table 2. Comparison of Nutrition Environment Measures Study in Restaurants nutrition environment items for fast-foodrestaurants and bodegas in sample 1a
Item Fast food Bodega P value
Number of food outlets 107 109
Healthy main dishes and salads
% of entrées that are healthy 6.6 2.6 0.036
% of main-dish salads that are healthy 25.9 34.4 0.284
Availability of healthy foods
% of outlets with:
Healthy entrée 31.1 11.9 0.001
Healthy main-dish salad 26.4 16.5 0.077
Fruit without added sugar/syrup 17.0 49.5 <0.001
Nonfried vegetable 2.8 34.9 <0.001
Baked chips 19.8 33.9 0.020
Whole-grain bread 44.3 60.6 0.017
Diet soda 80.2 97.2 <0.001
100% fruit juice 60.4 94.5 <0.001
1% or nonfat milk 48.1 63.3 0.025
Salad bar 15.2 22.2 0.192
Low-fat salad dressing 3.8 9.2 0.109
Nutrition information
% of outlets with:
Nutrition information available at visit 89.6 4.6 <0.001
Nutrition information at point-of-purchase 45.3 1.8 <0.001
Nutrition information on menu 92.4 3.7 <0.001
Healthy entrées identified on menu 9.4 3.7 0.087
Facilitators/barriers to healthy eating
% of outlets with:
Healthy requests encouraged (menu) 2.8 1.8 0.628
Large portions encouraged (menu) 16.0 2.8 0.001
Special requests discouraged (menu) 0.9 1.8 0.577
Healthy options highlighted (signs) 8.5 4.6 0.246
Healthy eating encouraged (signs) 7.6 1.8 0.047
Unhealthy eating encouraged (signs) 34.0 1.8 <0.001
Overeating encouraged (signs) 12.3 0.9 0.001
Low-carbohydrate promotion (signs) 0.0 0.0 NAb
Pricing
% of outlets with:
Combination meal cheaper than sum of pricesof individual items
72.6 26.6 <0.001
Healthy entrées cost more than regular entrées 10.4 0.9 0.003
Charge for shared entrée 1.9 0.0 0.150(continued on next page)
RESEARCH
598 JOURNAL OF THE ACADEMY OF NUTRITION AND DIETETICS April 2014 Volume 114 Number 4
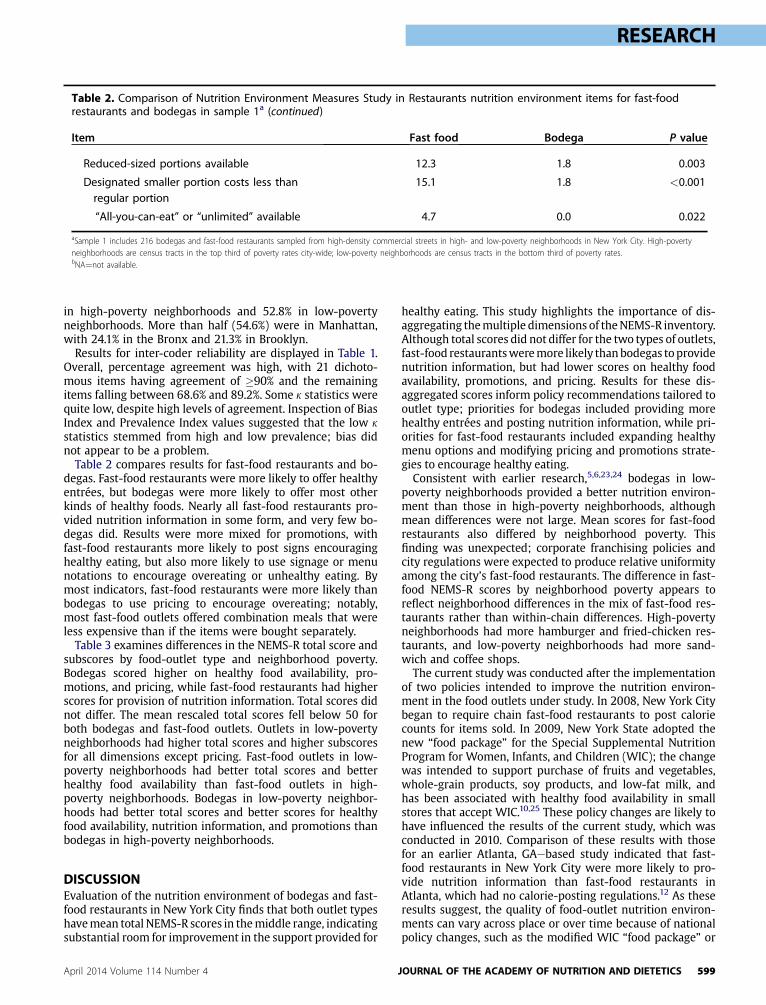
Table 2. Comparison of Nutrition Environment Measures Study in Restaurants nutrition environment items for fast-foodrestaurants and bodegas in sample 1a (continued)
Item Fast food Bodega P value
Reduced-sized portions available 12.3 1.8 0.003
Designated smaller portion costs less thanregular portion
15.1 1.8 <0.001
“All-you-can-eat” or “unlimited” available 4.7 0.0 0.022
aSample 1 includes 216 bodegas and fast-food restaurants sampled from high-density commercial streets in high- and low-poverty neighborhoods in New York City. High-povertyneighborhoods are census tracts in the top third of poverty rates city-wide; low-poverty neighborhoods are census tracts in the bottom third of poverty rates.bNA¼not available.
RESEARCH
in high-poverty neighborhoods and 52.8% in low-povertyneighborhoods. More than half (54.6%) were in Manhattan,with 24.1% in the Bronx and 21.3% in Brooklyn.Results for inter-coder reliability are displayed in Table 1.
Overall, percentage agreement was high, with 21 dichoto-mous items having agreement of �90% and the remainingitems falling between 68.6% and 89.2%. Some k statistics werequite low, despite high levels of agreement. Inspection of BiasIndex and Prevalence Index values suggested that the low kstatistics stemmed from high and low prevalence; bias didnot appear to be a problem.Table 2 compares results for fast-food restaurants and bo-
degas. Fast-food restaurants were more likely to offer healthyentrées, but bodegas were more likely to offer most otherkinds of healthy foods. Nearly all fast-food restaurants pro-vided nutrition information in some form, and very few bo-degas did. Results were more mixed for promotions, withfast-food restaurants more likely to post signs encouraginghealthy eating, but also more likely to use signage or menunotations to encourage overeating or unhealthy eating. Bymost indicators, fast-food restaurants were more likely thanbodegas to use pricing to encourage overeating; notably,most fast-food outlets offered combination meals that wereless expensive than if the items were bought separately.Table 3 examines differences in the NEMS-R total score and
subscores by food-outlet type and neighborhood poverty.Bodegas scored higher on healthy food availability, pro-motions, and pricing, while fast-food restaurants had higherscores for provision of nutrition information. Total scores didnot differ. The mean rescaled total scores fell below 50 forboth bodegas and fast-food outlets. Outlets in low-povertyneighborhoods had higher total scores and higher subscoresfor all dimensions except pricing. Fast-food outlets in low-poverty neighborhoods had better total scores and betterhealthy food availability than fast-food outlets in high-poverty neighborhoods. Bodegas in low-poverty neighbor-hoods had better total scores and better scores for healthyfood availability, nutrition information, and promotions thanbodegas in high-poverty neighborhoods.
DISCUSSIONEvaluation of the nutrition environment of bodegas and fast-food restaurants in New York City finds that both outlet typeshavemean total NEMS-R scores in themiddle range, indicatingsubstantial room for improvement in the support provided for
April 2014 Volume 114 Number 4
healthy eating. This study highlights the importance of dis-aggregating themultiple dimensions of theNEMS-R inventory.Although total scores did not differ for the two types of outlets,fast-food restaurantsweremore likely thanbodegas toprovidenutrition information, but had lower scores on healthy foodavailability, promotions, and pricing. Results for these dis-aggregated scores inform policy recommendations tailored tooutlet type; priorities for bodegas included providing morehealthy entrées and posting nutrition information, while pri-orities for fast-food restaurants included expanding healthymenu options and modifying pricing and promotions strate-gies to encourage healthy eating.Consistent with earlier research,5,6,23,24 bodegas in low-
poverty neighborhoods provided a better nutrition environ-ment than those in high-poverty neighborhoods, althoughmean differences were not large. Mean scores for fast-foodrestaurants also differed by neighborhood poverty. Thisfinding was unexpected; corporate franchising policies andcity regulations were expected to produce relative uniformityamong the city’s fast-food restaurants. The difference in fast-food NEMS-R scores by neighborhood poverty appears toreflect neighborhood differences in the mix of fast-food res-taurants rather than within-chain differences. High-povertyneighborhoods had more hamburger and fried-chicken res-taurants, and low-poverty neighborhoods had more sand-wich and coffee shops.The current study was conducted after the implementation
of two policies intended to improve the nutrition environ-ment in the food outlets under study. In 2008, New York Citybegan to require chain fast-food restaurants to post caloriecounts for items sold. In 2009, New York State adopted thenew “food package” for the Special Supplemental NutritionProgram for Women, Infants, and Children (WIC); the changewas intended to support purchase of fruits and vegetables,whole-grain products, soy products, and low-fat milk, andhas been associated with healthy food availability in smallstores that accept WIC.10,25 These policy changes are likely tohave influenced the results of the current study, which wasconducted in 2010. Comparison of these results with thosefor an earlier Atlanta, GAebased study indicated that fast-food restaurants in New York City were more likely to pro-vide nutrition information than fast-food restaurants inAtlanta, which had no calorie-posting regulations.12 As theseresults suggest, the quality of food-outlet nutrition environ-ments can vary across place or over time because of nationalpolicy changes, such as the modified WIC “food package” or
JOURNAL OF THE ACADEMY OF NUTRITION AND DIETETICS 599
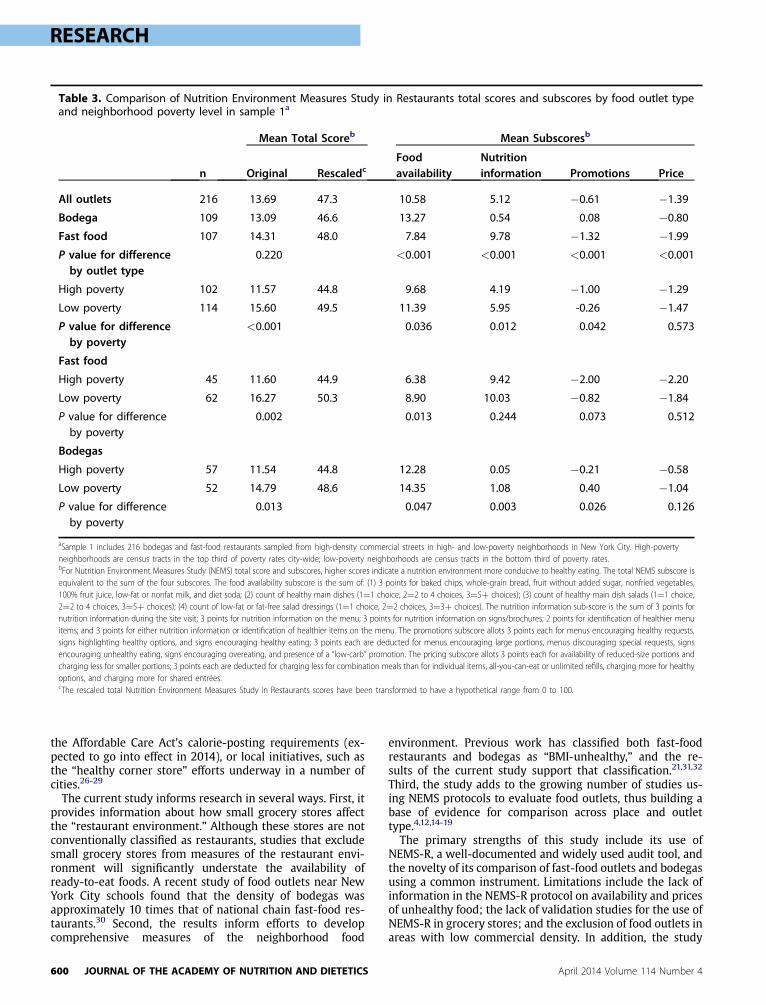
Table 3. Comparison of Nutrition Environment Measures Study in Restaurants total scores and subscores by food outlet typeand neighborhood poverty level in sample 1a
n
Mean Total Scoreb Mean Subscoresb
Original RescaledcFoodavailability
Nutritioninformation Promotions Price
All outlets 216 13.69 47.3 10.58 5.12 �0.61 �1.39Bodega 109 13.09 46.6 13.27 0.54 0.08 �0.80Fast food 107 14.31 48.0 7.84 9.78 �1.32 �1.99P value for differenceby outlet type
0.220 <0.001 <0.001 <0.001 <0.001
High poverty 102 11.57 44.8 9.68 4.19 �1.00 �1.29Low poverty 114 15.60 49.5 11.39 5.95 -0.26 �1.47P value for differenceby poverty
<0.001 0.036 0.012 0.042 0.573
Fast food
High poverty 45 11.60 44.9 6.38 9.42 �2.00 �2.20Low poverty 62 16.27 50.3 8.90 10.03 �0.82 �1.84P value for differenceby poverty
0.002 0.013 0.244 0.073 0.512
Bodegas
High poverty 57 11.54 44.8 12.28 0.05 �0.21 �0.58Low poverty 52 14.79 48.6 14.35 1.08 0.40 �1.04P value for differenceby poverty
0.013 0.047 0.003 0.026 0.126
aSample 1 includes 216 bodegas and fast-food restaurants sampled from high-density commercial streets in high- and low-poverty neighborhoods in New York City. High-povertyneighborhoods are census tracts in the top third of poverty rates city-wide; low-poverty neighborhoods are census tracts in the bottom third of poverty rates.bFor Nutrition Environment Measures Study (NEMS) total score and subscores, higher scores indicate a nutrition environment more conducive to healthy eating. The total NEMS subscore isequivalent to the sum of the four subscores. The food availability subscore is the sum of: (1) 3 points for baked chips, whole-grain bread, fruit without added sugar, nonfried vegetables,100% fruit juice, low-fat or nonfat milk, and diet soda; (2) count of healthy main dishes (1¼1 choice, 2¼2 to 4 choices, 3¼5þ choices); (3) count of healthy main dish salads (1¼1 choice,2¼2 to 4 choices, 3¼5þ choices); (4) count of low-fat or fat-free salad dressings (1¼1 choice, 2¼2 choices, 3¼3þ choices). The nutrition information sub-score is the sum of 3 points fornutrition information during the site visit; 3 points for nutrition information on the menu; 3 points for nutrition information on signs/brochures; 2 points for identification of healthier menuitems; and 3 points for either nutrition information or identification of healthier items on the menu. The promotions subscore allots 3 points each for menus encouraging healthy requests,signs highlighting healthy options, and signs encouraging healthy eating; 3 points each are deducted for menus encouraging large portions, menus discouraging special requests, signsencouraging unhealthy eating, signs encouraging overeating, and presence of a “low-carb” promotion. The pricing subscore allots 3 points each for availability of reduced-size portions andcharging less for smaller portions; 3 points each are deducted for charging less for combination meals than for individual items, all-you-can-eat or unlimited refills, charging more for healthyoptions, and charging more for shared entrées.cThe rescaled total Nutrition Environment Measures Study in Restaurants scores have been transformed to have a hypothetical range from 0 to 100.
RESEARCH
the Affordable Care Act’s calorie-posting requirements (ex-pected to go into effect in 2014), or local initiatives, such asthe “healthy corner store” efforts underway in a number ofcities.26-29
The current study informs research in several ways. First, itprovides information about how small grocery stores affectthe “restaurant environment.” Although these stores are notconventionally classified as restaurants, studies that excludesmall grocery stores from measures of the restaurant envi-ronment will significantly understate the availability ofready-to-eat foods. A recent study of food outlets near NewYork City schools found that the density of bodegas wasapproximately 10 times that of national chain fast-food res-taurants.30 Second, the results inform efforts to developcomprehensive measures of the neighborhood food
600 JOURNAL OF THE ACADEMY OF NUTRITION AND DIETETICS
environment. Previous work has classified both fast-foodrestaurants and bodegas as “BMI-unhealthy,” and the re-sults of the current study support that classification.21,31,32
Third, the study adds to the growing number of studies us-ing NEMS protocols to evaluate food outlets, thus building abase of evidence for comparison across place and outlettype.4,12,14-19
The primary strengths of this study include its use ofNEMS-R, a well-documented and widely used audit tool, andthe novelty of its comparison of fast-food outlets and bodegasusing a common instrument. Limitations include the lack ofinformation in the NEMS-R protocol on availability and pricesof unhealthy food; the lack of validation studies for the use ofNEMS-R in grocery stores; and the exclusion of food outlets inareas with low commercial density. In addition, the study
April 2014 Volume 114 Number 4
RESEARCH
does not examine other types of food outlets that offerinexpensive prepared or ready-to-eat foods. Future researchshould consider take-out restaurants other than nationalchain fast food, including ethnic restaurants, which areprevalent in many inner-city areas.4,33,34
CONCLUSIONSAudit tools such as the NEMS-R provide resources forassessing nutrition environments and identifying policychanges to improve these environments. The current studyimplies different policies for fast-food restaurants and smallgrocery stores or bodegas. Priorities for fast-food restaurantsare to change pricing to reduce incentives to overeat andincrease availability of healthy food. For bodegas, provision ofhealthy entrées, healthy food promotion, and nutrition in-formation are more appropriate foci. NEMS-R scores werelower in high-poverty neighborhoods, indicating a particularneed for intervention to support healthy eating in high-poverty neighborhoods whose residents are at higher riskfor obesity.
References1. Stewart H, Blisard N, Jolliffe D. Let’s Eat Out: Americans Weigh Taste,
Convenience, and Nutrition. Washington, DC: Department of Agri-culture Economic Research Service; 2006.
2. Mehta NK, Chang VW. Weight status and restaurant availability: Amultilevel analysis. Am J Prev Med. 2008;34(2):127-133.
3. Powell LM, Chaloupka FJ, Bao Y. The availability of fast-food and full-service restaurants in the United States: Associations with neighbor-hood characteristics. Am J Prev Med. 2007;33(4 suppl 1):S240-S245.
4. Lee SH, Rowan MT, Powell LM, et al. Characteristics of prepared foodsources in low-income neighborhoods of Baltimore City. Ecol FoodNutr. 2010;49(6):409-430.
5. Franco M, Diez Roux AV, Glass TA, Caballero B, Brancati FL. Neigh-borhood characteristics and availability of healthy foods in Balti-more. Am J Prev Med. 2008;35(6):561-567.
6. Krukowski R, West D, Harvey-Berino J, Elaine Prewitt T. Neighbor-hood impact on healthy food availability and pricing in food stores.J Community Health. 2010;35(3):315-320.
7. Borradaile KE, Sherman S, Vander Veur SS, et al. Snacking in chil-dren: The role of urban corner stores. Pediatrics. 2009;124(5):1293-1298.
8. Lucan S, Karpyn A, Sherman S. Storing empty calories and chronicdisease risk: Snack-food products, nutritive content, and manufac-turers in Philadelphia corner stores. J Urban Health. 2010;87(3):394-409.
9. Gebauer H, Laska M. Convenience stores surrounding urban schools:An assessment of healthy food availability, advertising, and productplacement. J Urban Health. 2011;88(4):616-622.
10. Tester JM, Yen IH, Pallis LC, Laraia BA. Healthy food availability andparticipation in WIC (Special Supplemental Nutrition Program forWomen, Infants, and Children) in food stores around lower- andhigher-income elementary schools. Public Health Nutr. 2010;14(6):960-964.
11. Laska MN, Borradaile KE, Tester J, Foster GD, Gittelsohn J. Healthyfood availability in small urban food stores: A comparison of four UScities. Public Health Nutr. 2010;13(7):1031-1035.
12. Saelens BE, Glanz K, Sallis JF, Frank LD. Nutrition EnvironmentMeasures Study in Restaurants (NEMS-R): Development and evalu-ation. Am J Prev Med. 2007;32(4):273-281.
13. GlanzK, Sallis JF, Saelens BE, Frank LD.Healthy nutrition environments:Concepts and measures. Am J Health Promot. 2005;19(5):330-333.
14. Cerin E, Frank LD, Sallis JF, et al. From neighborhood design and foodoptions to residents’ weight status. Appetite. 2011;56(3):693-703.
April 2014 Volume 114 Number 4
15. Horacek TM, Erdman MB, Byrd-Bredbenner C, et al. Assessment ofthe dining environment on and near the campuses of fifteen post-secondary institutions. Public Health Nutr. 2012;17(7):1-11.
16. Lesser LI, Hunnes DE, Reyes P, et al. Assessment of food offerings andmarketing strategies in the food-service venues at California chil-dren’s hospitals. Acad Pediatr. 2012;12(1):62-67.
17. Bertoni AG, Foy CG, Hunter JC, Quandt SA, Vitolins MZ, Whitt-Glover MC. A multilevel assessment of barriers to adoption of Di-etary Approaches to Stop Hypertension (DASH) among AfricanAmericans of Low Socioeconomic Status. J Health Care Poor Under-served. 2011;22(4):1205-1220.
18. Saelens BE, Chan NL, Krieger J, et al. Nutrition-labeling regulationimpacts on restaurant environments. Am J Prev Med. 2012;43(5):505-511.
19. Liebert ML, Patsch AJ, Smith JH, Behrens TK, Charles T, Bailey TR.Planning and development of the Better Bites Program: A pricingmanipulation strategy to improve healthy eating in a hospital cafe-teria. Health Promot Pract. 2013;14(4):552-562.
20. Honeycutt S, Davis E, Clawson M, Glanz K. Training for anddissemination of the Nutrition Environment Measures Surveys(NEMS). Prev Chronic Dis. 2010;7(6):1-10.
21. Rundle A, Neckerman KM, Freeman L, et al. Neighborhood foodenvironment and walkability predict obesity in New York City. En-viron Health Perspect. 2009;117(3):442-447.
22. US Department of Health and Human Services. Basic HHS Policy forProtection of Human Research Subjects. 45 CFR 46. Washington, DC:US Department of Health and Human Services; 2009.
23. Horowitz CR, Colson KA, Hebert PL, Lancaster K. Barriers to buyinghealthy foods for people with diabetes: Evidence of environmentaldisparities. Am J Public Health. 2004;94(9):1549-1554.
24. Andreyeva T, Blumenthal DM, Schwartz MB, Long MW, Brownell KD.Availability and prices of foods across stores and neighborhoods: Thecase of New Haven, Connecticut. Health Aff (Millwood). 2008;27(5):1381-1388.
25. Andreyeva T, Luedicke J, Middleton AE, Long MW, Schwartz MB.Positive influence of the revised Special Supplemental NutritionProgram for Women, Infants, and Children food packages on accessto healthy foods. J Acad Nutr Diet. 2012;112(6):850-858.
26. Gittelsohn J, Rowan M, Gadhoke P. Interventions in small food storesto change the food environment, improve diet, and reduce risk ofchronic disease. Prev Chronic Dis. 2012;9:110015.
27. Bodor JN, Ulmer VM, Futrell Dunaway L, Farley TA, Rose D. Therationale behind small food store interventions in low-income urbanneighborhoods: Insights from New Orleans. J Nutr. 2010;140(6):1185-1188.
28. Hoffman JA, Morris V, Cook J. The Boston middle school-corner storeinitiative: Development, implementation, and initial evaluation of aprogram designed to improve adolescents’ beverage-purchasingbehaviors. Psychol Schools. 2009;46(8):756-766.
29. Dannefer R, Williams DA, Baronberg S, Silver L. Healthy bodegas:Increasing and promoting healthy foods at corner stores in New YorkCity. Am J Public Health. 2012;102(10):e27-e31.
30. Neckerman KM, Bader MDM, Richards CA, et al. Disparities in thefood environments of New York City public schools. Am J Prev Med.2010;39(3):195-202.
31. Park Y, Neckerman K, Quinn J, Weiss C, Jacobson J, Rundle A.Neighborhood immigrant acculturation and diet among Hispanicfemale residents of NYC. Public Health Nutr. 2011;14(9):1593-1600.
32. Jennings A, Welch A, Jones AP, et al. Local food outlets, weight status,and dietary intake: Associations in children aged 9-10 years. Am JPrev Med. 2011;40(4):405-410.
33. Graham R, Kaufman L, Novoa Z, Karpati A. Eating In, Eating Out, EatingWell: Access to Healthy Food in North and Central Brooklyn. New York,NY: New York City Department of Health and Mental Hygiene; 2006.
34. Noormohamed A, Lee SH, Batorsky B, Jackson A, Newman S,Gittelsohn J. Factors influencing ordering practices at Baltimore Citycarryouts: Qualitative research to inform an obesity preventionintervention. Ecol Food Nutr. 2012;51(6):481-491.
JOURNAL OF THE ACADEMY OF NUTRITION AND DIETETICS 601
RESEARCH
AUTHOR INFORMATIONK. M. Neckerman is a senior research scientist, Columbia Population Research Center, Columbia University, New York, NY; at the time of the study,she was a research scientist, Institute for Social and Economic Research and Policy (ISERP), Columbia University, New York, NY. L. Lovasi is atechnology teacher at Quest to Learn (a public school), New York, NY; at the time of the study, he was also a research associate, ISERP, ColumbiaUniversity, New York, NY. At the time of the study, P. Yousefzadeh was a research associate, ISERP, Columbia University, New York, NY. D. Sheehanis a GIS analyst, Department of Epidemiology, Columbia University, New York, NY; at the time of the study, he was a GIS analyst, ISERP, ColumbiaUniversity, New York, NY. K. Milinkovic is an event coordinator, KCI Management, London, Ontario, Canada; at the time of the study, she was aresearch assistant, ISERP, Columbia University, New York, NY. A. Baecker is a doctoral student in epidemiology, University of California, LosAngeles; at the time of the study, she was a master’s student in epidemiology, Columbia University, New York, NY. M. D. M. Bader is an assistantprofessor of sociology, American University, Washington, DC; at the time of the study, he was a Robert Wood Johnson Foundation Health &Society Scholar, University of Pennsylvania, Philadelphia. C. Weiss is clinical associate professor of sociology, New York University, New York, NY;at the time of the study, he was director, Quantitative Methods in the Social Sciences program, Columbia University, New York, NY. G. S. Lovasi isassistant professor of epidemiology, Columbia University, New York, NY. A. Rundle is associate professor of epidemiology, Columbia University,New York, NY.
Address correspondence to: Kathryn M. Neckerman, PhD, Columbia Population Research Center, 1255 Amsterdam Ave, Room 715, New York, NY10027. E-mail: [email protected]
STATEMENT OF POTENTIAL CONFLICT OF INTERESTNo potential conflict of interest was reported by the authors.
FUNDING/SUPPORTThis research was supported by an American Recovery and Reinvestment Act (ARRA) supplement to a National Institutes of Health–fundedresearch project (R01DK079885, PI A. Rundle). Support was also provided by the summer intern program at the Institute for Social and EconomicResearch and Policy (ISERP) at Columbia University. The participation of M. Bader was supported by the Robert Wood Johnson Foundation Health& Society Scholars Program at the University of Pennsylvania. The participation of G. Lovasi was supported by a grant from the National Institutefor Child Health and Human Development (K01HD067390).
602 JOURNAL OF THE ACADEMY OF NUTRITION AND DIETETICS April 2014 Volume 114 Number 4