Embed Size (px)
Citation preview

Comparing Health Care Systems by Socio-economic Accounting
Fleissner, P.
IIASA Research MemorandumMay 1976

Fleissner, P. (1976) Comparing Health Care Systems by Socio-economic Accounting. IIASA Research
Memorandum. IIASA, Laxenburg, Austria, RM-76-019 Copyright © May 1976 by the author(s).
http://pure.iiasa.ac.at/665/ All rights reserved. Permission to make digital or hard copies of all or part of this
work for personal or classroom use is granted without fee provided that copies are not made or distributed for
profit or commercial advantage. All copies must bear this notice and the full citation on the first page. For other
purposes, to republish, to post on servers or to redistribute to lists, permission must be sought by contacting
COMPARING HEALTH CARE SYSTEMS
BY SOCIO-ECONOMIC ACCOUNTING
Peter Fleissner
M a y 1 9 7 6
Research Memoranda are interim reports on research being con- ducted by the International Institute for Applied Systems Analysis, and as such receive only limited scientific review. Views or opin- ions contained herein do not necessarily represent those o f the Institute or o f the National Member Organizations supporting the Institute.

Preface
During the last decade mathematical simulations and econo- metric macro-models of various sectors of society were developed in different countries. The most advanced of these were con- structed for the dynamics of the econqmy and the population on regional and national levels.
Since some subsystems of society encountered difficulties, the models focused on energy, aqriculture, education, prices, ecology, crime, urban and industrial development, and medical care.
Cost explosion, unequal distribution of treatment and an increasing demand for health care with rather marginal results in terms of social indicators on the output side directed the attention of some model builders to the health care system in different countries. Many submodels were developed for commun- ity care, for medical doctors and their income, for hospital. care, for drug addicts, for the whole medical care system and so forth.
Although they use similar methods such as systems dynamics, regression- or factor analysis, the models and therefore the subsystems cannot be compared and evaluated on an international level. There is no general principle available to determine the meaning and the weiqht of a subsystem with respect to the whole society. There are no internationally accepted standards, variables and methods which must be included in a model of the health care system.
Bearing these facts in mind, and after constructing a con- siderable number of descriptive models, we tried to attack this problem realistically. It was necessary to adopt a normative approach and to carry out numerous aggregations, generalizations, and simplifications. This paper limits discussions to linear relations only, and should be viewed as a first step in actual model construction. Although the variables and parameters are chosen so that applications of the model are possible, there is no empirical information given. Thus only an outline is given but one that I hope can be read independently.

Abstract
The paper explains how the concept of integrated socio- economic accounting allows one to study the effects of changes in certain social indicators on the different components of GNP. This method enables the user to compare countries with different health conditions and demographic situations by cre- ating an "ideal" and comparable state of society which can be approximated in quantitative terms. The proposed definition framework is expanded to economies with a public sector.


Comparing Health Care Systems
by Socio-Economic Accountin4
Peter Fleissner
1. STRUCTURE OF SOCIO-ECONOMIC ACCOUNTING (SEA)
If one is comparing economic variables, as for example the GNP of different countries, it is impossible to evaluate the data appropriately, unless one takes into account a larger amount of information on the countries concerned. Similarly, one is unable to evaluate a subsector, for example the medical care system, without knowledge of economic and demographic characteristics of the countries being anlayzed.
In both cases the lack of information hinders a comprehen- sive view of society. Therefore this paper proposes a normative framework which attempts to answer the following questions:
a) What quantitative information is needed to make an evaluation?
b) How can the different levels of information be com- bined or related to each other?
c) In what manner are international and intertemporal comparisons possible?
The presented model of SEA is constructed as an extension of national economic accounts (NEA). SEA contains three levels of information:
- the economic level,
- the social level, and
- the demographic level.
At the economic level the usual, but more aggregated in- formation on production, consumption, investment and income distribution is necessary. The demographic data include a num- ber of persons, and death- and birth-rates. The social level is not narrowly defined. The application of the health care system requires data on the number of sick-leaves and sick non- workers, pensioners, and the like. The social level can be used for other societal sectors as, for example, education, un- employment, and transfer of workers to other sectors of the
economy. This paper will not follow these possibilities but will limit discussi=ir; to the health aspects.
In general, SEA represents a step toward simultaneously handling and evaluating changes in a country's socio-economic structure, and correcting the usual economic data with respect to a certain "ideal" socio-economic status, which enables com- parisons over time of different countries.
Models in the social sciences usually consist of two elements: causal relationships, and balance or definition equations. Forrester [ I ] uses causal relationships in his systems dynamics approach; econometric models are a mixture of balance and behavioral (causal) equations, while SEA is built only on a definition basis. This does not mean that SEA is restricted to this basis; in a further step one can broaden and connect SEA with econometrical behavioral equations for variables or for SEA-parameters. If there are endogenous vari- ables with a time lag, SEA will show a dynamic behavior. Mul- tiplier and indirect effects will come into existence. The ad- vantage of SEA should be that there is a definitional framework from which one could extend this model step-by-step to nonlin- ear, dynamic and/or simultaneous equations that can integrate demographic, economic and social aspects of a society.
2. THE BASIC MODEL
For illustration purposes a simplified version of the model is presented that allows one to explain the main features and properties of SEA. Some of the restrictions will be later re- moved.
We start with a very simple society: its economy is closed, that is, without international trade. At this stage there is no public sector. (We will introduce this below.) The inhabitants of the country can be divided into workers and non-workers. For the purpose of simplicity, workers have equal productivity. Non- workers such as children, housewives and retired and aged persons do not contribute to the national product and are assumed to have the same amount of consumption per head as workers. There are two kinds of income: wages and profits; and two kinds of expen- ditures: consumption and investment.
Based on these assumptions, national economic accounts can be expressed as:
where
Y: national product,
E: number of workers,
q: output per worker,
W: wage sum,
P: profits,
C: consumption,
I: investment,
T: total population.
The wage sum (W) will be earned by E persons. Therefore the annual wage rate (w) per worker is:
The total population T is consuming C. Thus consumption per head is:
with
where N equals the number of non-workers. Equation (1) can now be written as:
which holds for every year. It is a flow equation. Stock equations must be added to obtain a dynamic behavior.
The equation for capital stock K,
closes the economic description of the economic system. The
equation
describes the demographic system, where Bt equals birth, and
D equals deaths in period t. The stock variables Tt and Kt t are measured at the beginning of period t.
Now the social structure will be introduced by the param- e n eters bt, dt, s s and by Ft, the net flow variable. Faram- t f t
eters are defined as follows:
bt = Bt/Tt , birth rate ( 8 )
dt = Dt/Tt , death rate
se t = s ~ / E ~ , rate of sick workers
n sn = St/Nt , rate of sick non-workers t
where
st: number of sick workers,
s:: number of sick non-workers, and
Ft: net flow from the set of non-workers to workers.
The death rate d+ can be divided into a death rate out of N, L
d:, and a death rate out of E, d:. That is,
With these parameters and variables the socio-economic structure and dynamic behavior can be expressed by the following four equa- tions:
If we add (13) and (14) and use (4) and (12), the result is ( 7 ) .
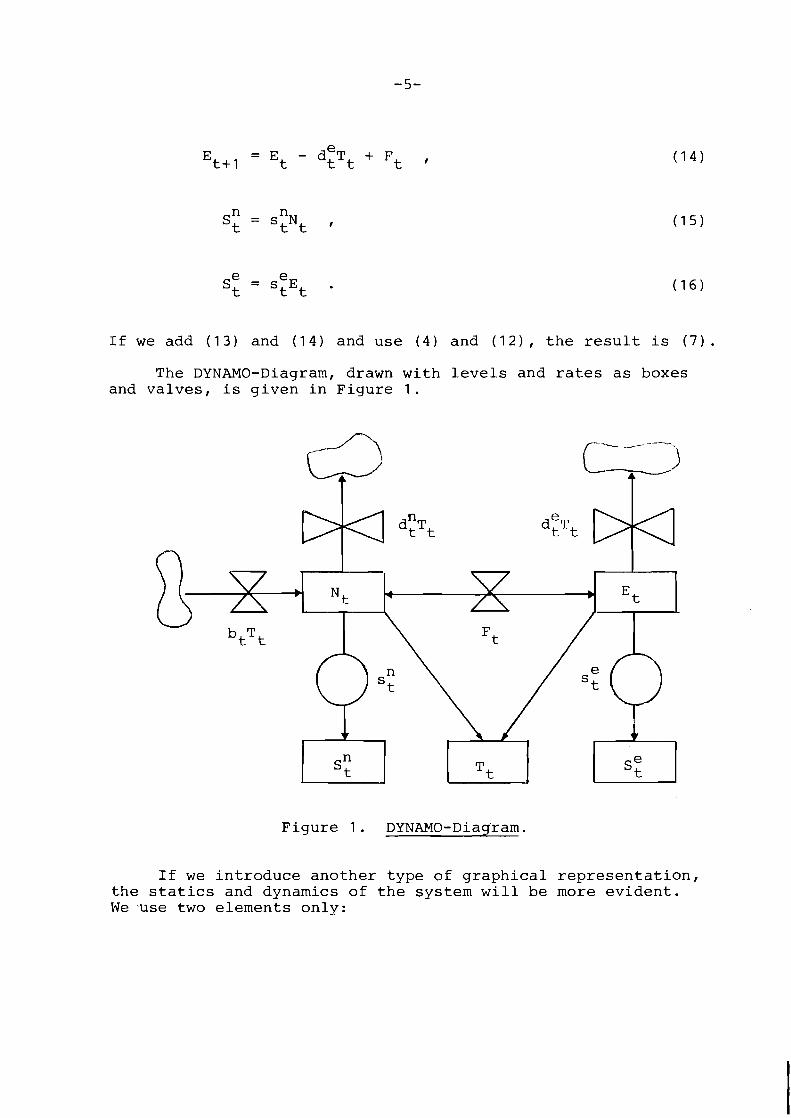
The DYNAMO-Diagram, drawn with levels and rates as boxes and valves, is given in Figure 1 .
Figure 1. DYNAMO-Diagram.
If we introduce another type of graphical representation, the statics and dynamics of the system will be more evident. We use two elements only:
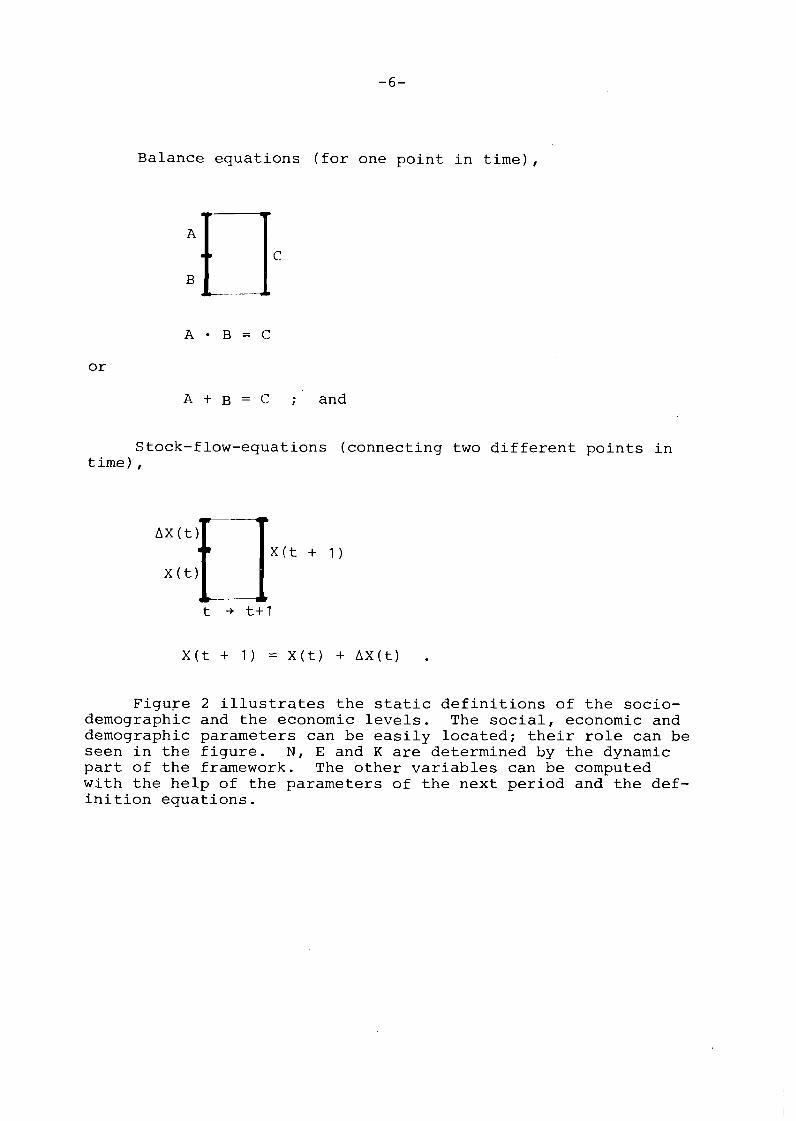
Balance equations (for one point in time),
A + B = C ; and
Stock-flow-equations (connecting two different points in time),
Figure 2 illustrates the static definitions of the socio- demographic and the economic levels. The social, economic and demographic parameters can be easily located; their role can be seen in the figure. N, E and K are determined by the dynamic part of the framework. The other variables can be computed with the help of the parameters of the next period and the def- inition equations.

k 0
'4-4 ,
X $4- 0 3
I k U
'4-4 -4 .G
U PI -4 rd c, & rd 64
4-J oa, rn E 5 4
2 I 0 -4 U 0 cn
. L
2.1. Socio-Demographic Changes in Economic Terms
We know the basic social, demographic and econornic frame- work of our country. With the help of the method of comparative statics, we can analyze the influences of different social and demographic situations on the economy. Since we have focused our interest on the health care system, we will start with an analysis of the effects of illness.
2.1.1. Illness of a Worker
A worker falls ill in the beginning of a period t; he ceases to contribute to the national product. Thus Y1 , the
national product with one additional ill person per year will be reduced by q, the average productivity. That is,
e The actual pattern, considering S ill workers, will be:
Y in this case is a more or less corrected or "ideal" figure for national product--a potential national product, while YSe
corre.sponds to the actual value of the economy. If other losses of national product are taken into account (which we will do later'on), Y has to be changed. For a certain social and demo- graphic situation, Y can be computed as the basis for interna- tional comparisons. We refer to this below.
What will happen to the expenditure, that is, the income- side of the NEA? If there is no payment of the public insur- ance, we must define an aaditional average consumption per head, c and, in the case of illness, pharmaceutical products and s medical services. Since the model should be used in the short run, we assume that there will be no a priori change in invest- ment. To obtain the corrected values for investment, we take (18) and (1) together with the changed consumption expenditures.
On the one hand YSe is less than Y by q se; on the other hand,
'~e = C + cSse;' therefore
and, with ( 1 1 ,
Ise will be ex-post investment, reduced by lgss of production
and, if it holds empirically, by a higher level of consumption.
The third composition of the NEA is the income composition. Once again we assume that sickness behavior is related to the income of workers. We have two extreme alternatives:
Case a - the wages are continuously paid during illr.ess; or
Case b - the person is not earning money any longer because of illness.
In case (a) there is no change in the wage sum:
however there is a reduction in profits
In case (b) the reduction of profits is not as great as that in case (a) :
however, the wage sum has changed to
Assuming that the above equations are correct, the defini- tion equations of the NEA must be valid. These are:
- 'se - 'se + I = WSe + PSe ;
Se
2.1.2. A Non-Worker Falls I11
We use another analogue approach for the case of sickness of a non-worker, assuming no loss in production, and c is av-
S erage consumption per head. Thus we obtain:
The only change appears in the share of consumption and invest- ment in the national product.
2.1.3. Birth and Death Processes
One can use the concept of birth and death processes to evaluate demographic changes in a similar way as was done in the case of illness. If a person is born, the number of
consumers is raised by one:
If the standard of living is not allowed to decline, in general we have the following:
In the case of death one must differentiate between the death of a worker and that of a consumer. When a worker dies, he no longer produces nor does he earn wages and consume. Therefore:
In the case of a de.ceased consumer, the equations are more sim- ple. All of the above equations remain unchanged with the exception of:

2.1.4. Transitions from the Non-Workina to the Workina Category and Vice Versa
If a person begins to work, he remains a consumer. The national product, investment and profits will be greater than before. To translate these effects into mathematical formulas, we find it more informative to look at the origins of the re- sulting net transitions of F. We split F into persons joining
the labor force, and those leaving it, F"~. Thus we have:
2.2. Combining the Socio-Economic Elements - A Concept of Socio-Economic Accountina
Chapter 3 will describe three processes: the illness/ health process, the birth/death process, and the non-working/ working process. Using different formulas given in the pre- vious chapter, it is possible to combine the processes provided one analyzes the changes brought about by different origins. Thus the components of the national product and the product itself will be connected with the hypothetical values of the components. (Variables with an asterisk refer to actual situa- tions. )
W* = w - w(se + D~ - F) (case b) , (54
The hypothetical national product, Y, must be corrected by all net flows away from the set of workers--sick, deceased and net retired workers. Consumption is changed by the net change of population, (B - Dl, and by the additional consumption of sick persons; in the case of investment, this is reversed and an additional loss of productivity must be subtracted. Wages will be less because of the loss of workers, while profits de- cline only by the profit-margin per worker. To describe a real life situation where births and deaths will not occur all at once in the beginning of the period, correction factors for the
e variables B, D, D and F are necessary. Each flow variable should be multiplied by one half; this is the expected value of the time of death or birth within the period, if the occur- rence is uniformly distributed. That-is,
This correction is not needed for se and sn. These vari- ables are stocks--percentage rates of stocks--which are computed as percentages of the two parts of population. Therefore the correct formulas are:
l e 1 W* = w - w(se + ID - IF) , (case b) (59
2.3. Possible ADDlications and Extensions
By means of the simplified version of ,the SEA given in Chapter 2, it is possible to demonstrate possible applications more easily than a complicated and completed scheme. What we have done so far is to build up a very simple economic account- ing scheme and to introduce social and demographic indicators in combination with certain parameters. To proceed in a prac- tical manner, we need the figures for the economic, social and demographic parts given in the national statistics. These data correspond to asterisk-variables Y*, C*, I*, W* and P* on the
e economic level, and to B, D, S , sn and F on the socio-demo- graphic level. With the help of the parameters q, c, w and c s (which can be approximated by simple computations from national economic accounts or by an empirical investiqation) we obtain results for the "hypothetical" values of Y, C, I, W and P on the economic level.
What is the meaning of these values? To answer this ques- tion we have to analyze equations (56) to (60). The actual sit- uation is equal to the hypothetical case only if each correction term of the right-hand side vanishes. That is,
l e 1 q(se + -D - -F) = 0 2 2 t (61
1 -c(B - D) + cs (se + sn) = 0 , 2 (62)
1 w(se + i~~ - -F) = 0 2 (63)
Since q > 0, w usually will be greater than 0. That is,
1 se +;ge - -F = 0 . 2 (64)
Equations (62) and (64) have an infinite set of solutions. To create a unique and simple "ideal" social situation, we assume
se and sn to be 0. Thus we obtain:

B = D , and (65)
By "ideal" situation we mean either no sickness, stationary state of the population, or stationary state of the labor force. These "ideal" situations are the bases of international compari- sons. All differences among countries (within the ranqe of our framework) will be corrected before an economic comparison is made. Since demographic data are included in SEA, it is very easy to do the comparisons on a per capita or per worker basis.
The tool given here can be applied nationally as well: one could construct "efficiency" indicators as for example,
which should be determined over time. With the help of these indicators one can see the efficiency of certain aspects of the economy, corrected by social and demographic irregularities.
SEA, used in this manner, could take into account such factors as changes in the average length of the working day, increasing unemployment, increases in the number of guestworkers, changes in the av,erage duration of the educational processes, epidemics, and high sick-leave rates; it would be helpful for analyzing economic growth factors in a changing socio-demograph- ic environment.
Real life situations require extensions depending on the special interest of the user of SEA. Five main directions are given here, although more specializations are possible. These are:
1 . Disaggregating the simple model given in this chapter;
2. Including additional sectors of the oversimplified economic level of the model described;
3. Implementing additional socio-demographic problems within the SEA framework;
4. Introducing behavioral equations into the definitional f ranework; and
5. Adding a fourth level of accounting.
An example of disaggregation on the economic level is given in the next chapter; the economy is disaggregated into n sectors
of production. Each of the sectors has its own characteristics (e.g. productivity and wage rate). Disaggregation of population by certain age groups, by different social levels or by special diseases is also possible.
In Chapter 4 an extension of SEA- to the public sector is worked out; this is important for the accounting of public health insurances and public health services. Foreign trade will not be included there to keep the notation simple, but it could be eas- ily included.
If the interest of the user of SEA is focused on fields of investigation other than the health care system, he could apply the same methodology to the education system, the retraining of workers, climatic conditions for agriculture, social welfare, criminal justice system, and so forth. At every level of ac- counting the necessary indicators must be collected and intro- duced into the model together with the corresponding cost, ex- penditures and the like. Thus the proposed framework could be expanded to a mul~tidirnensional cost-benefit or cost-effectiveness- analysis for different groups 0.f society.
Especially for the health care sector, it would be useful to take into account amounts of money, persons and sick-leaves, and also to include a fourth level of accounting, for example time of life with or without a certain degree of illness. Using this method, we can count economic and demographic aspects of illness. The health condition of children, housewives and the aged also come into the picture.
The last extension to the model suggested is completing it in the direction of a dynamic, and perhaps nonlinear manner. Estimating the parameters of certain behavioral equations (which could lead to the inclusion of lagged variables, to simultaneous systems and/or to nonlinear relationships), will be the last step in constructing the model. With every new behavioral equation, a priori assumptions will have to disappear and the model will be step-by-step closer to reality.
3. DISAGGREGATION OF SEA
3.1. Production Sectors
We will broaden the scheme to include not only one but also m sectors of production. The over-all labor productivity q is:

where
Y: national products, and
E: number of employees;
i this is composed of the sectoral labor productivities q , weighted by the percentage of workers in sector i:
The national product consists of products of the coeffi- cient sectors. The total number of employees consists of the sum of the sectoral workers.
Population is divided into workers and non-workers. Total population T can be computed by:
where
B: number of births per year,
Dn: number of deceased non-workers per year,
Dee number of deceased workers of sector j per year. j
The total number of deaths, D, is the sum of deceased non- workers and deceased workers per year. That is,
Non-workers N are computed by

i where F are net transitions from the non-productive sector to sector i per year.
More complicated is the formula for the workers in sector j at the beginning of the year t+l:
E~~ is symbolizing the non-negative transition matrix of workers of sector i to sector j during the year t. The double sum S,
characterizes the number of fluctuations on the labor market among the various sectors. The diagonal elements should be
equal to zero. If we sum up over j , we get Et+l , the total
number of workers. That is,
Now the parameters describing social structure will be intro- duced :
Sick workers: se = s .E j j I n e
Sick non-workers: Se = s .T 3
Deceased workers: De = dfl~ j 3
Deceased non-workers: Dn = d n ~
Consumption added or s e subtracted: cS = c.S
j I j
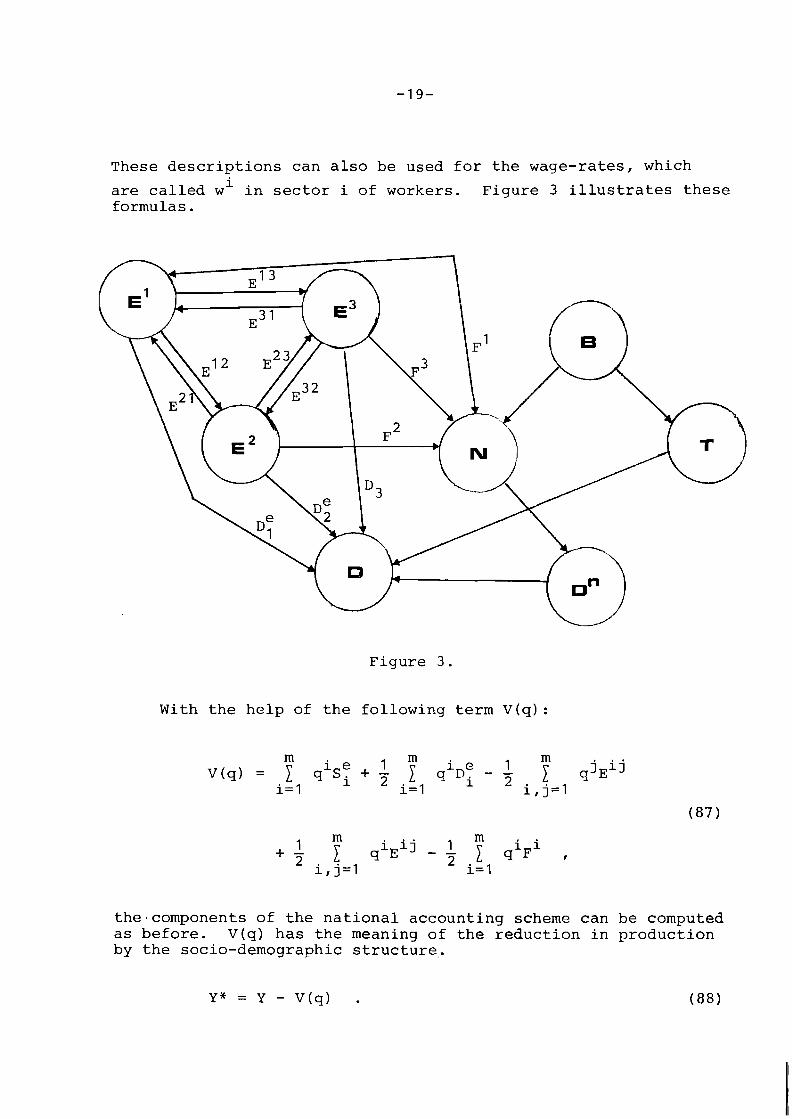
These descriptions can also be used for the wage-rates, which
are called wi in sector i of workers. Figure 3 illustrates these formulas.
Figure 3.
With the help of the following term V ( q ) :
thetcomponents of the national accounting scheme can be computed as before. V ( q ) has the meaning of the reduction in production by the socio-demographic structure,.
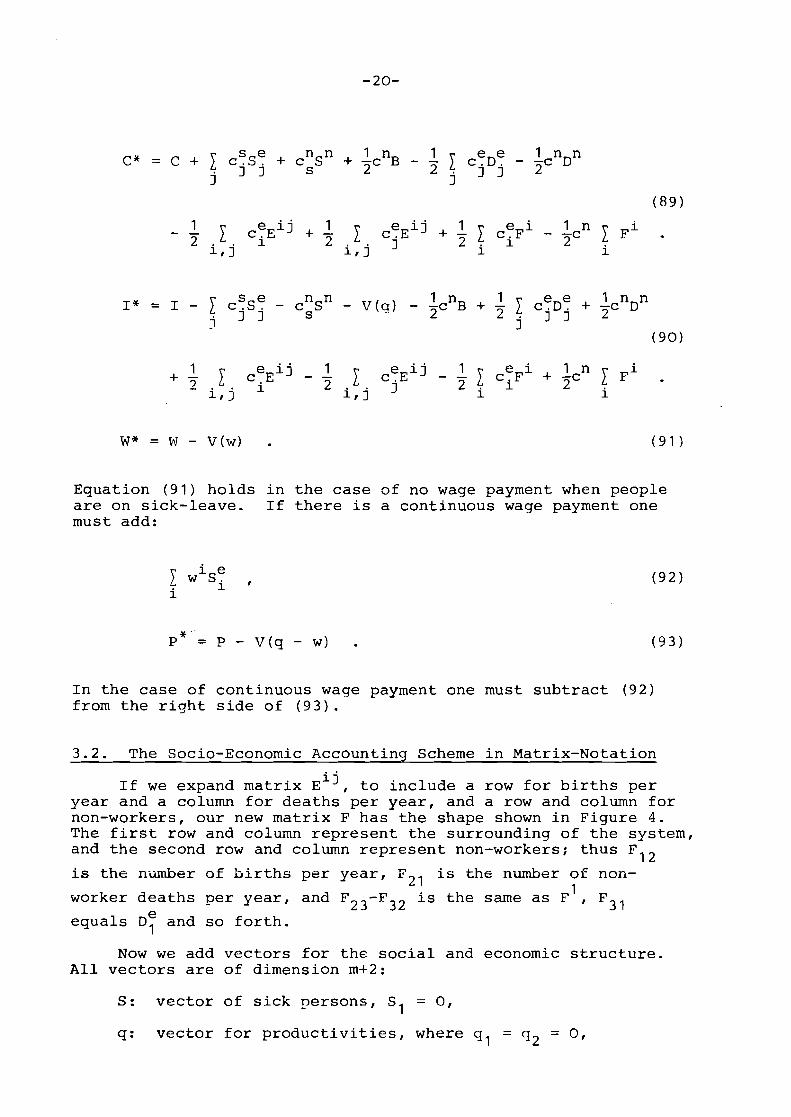
I' = I - 1 csse - 1 n 1 I n n c:sn - V(q) - ~c B + 7 1 ceDe + -C D j I j
j 1 1 2
(90)
Equation (91) holds in the case of no wage payment when people are on sick-leave. If there is a continuous wage payment one must add:
In the case of continuous wage payment one must subtract (92) from the right side of (93).
3.2. The Socio-Economic Accounting Scheme in Matrix-Notation
i j If we expand matrix E , to include a row for births per year and a column for deaths per year, and a row and column for non-workers, our new matrix F has the shape shown in Figure 4. The first row and column represent the surrounding of the system, and the second row and column represent non-workers; thus F12
is the n - d e r of births per year, F21 is the number of non- 1 worker deaths per year, and F23-F is the same as F , F3,
- 32 equals D; and so forth.
Now we add vectors for the social and economic structure. All vectors are of dimension m+2:
S: vector of sick persons, S1 = 0,
q: vector for productivities, where q l = q2 = 0,

w: vector for wage-rates, where w l = w = 0, 2
c: vector for yearly consumption per head,
s c : vector of additional consumption in the case of
illness.
* deaths
Figure 4.
Equations (88) to (93) can be written' very simply:
1 W* = W - --[wl(F - F 1 ) l ] - w'S ,
\ 2 v 1
in the case of continuous payment
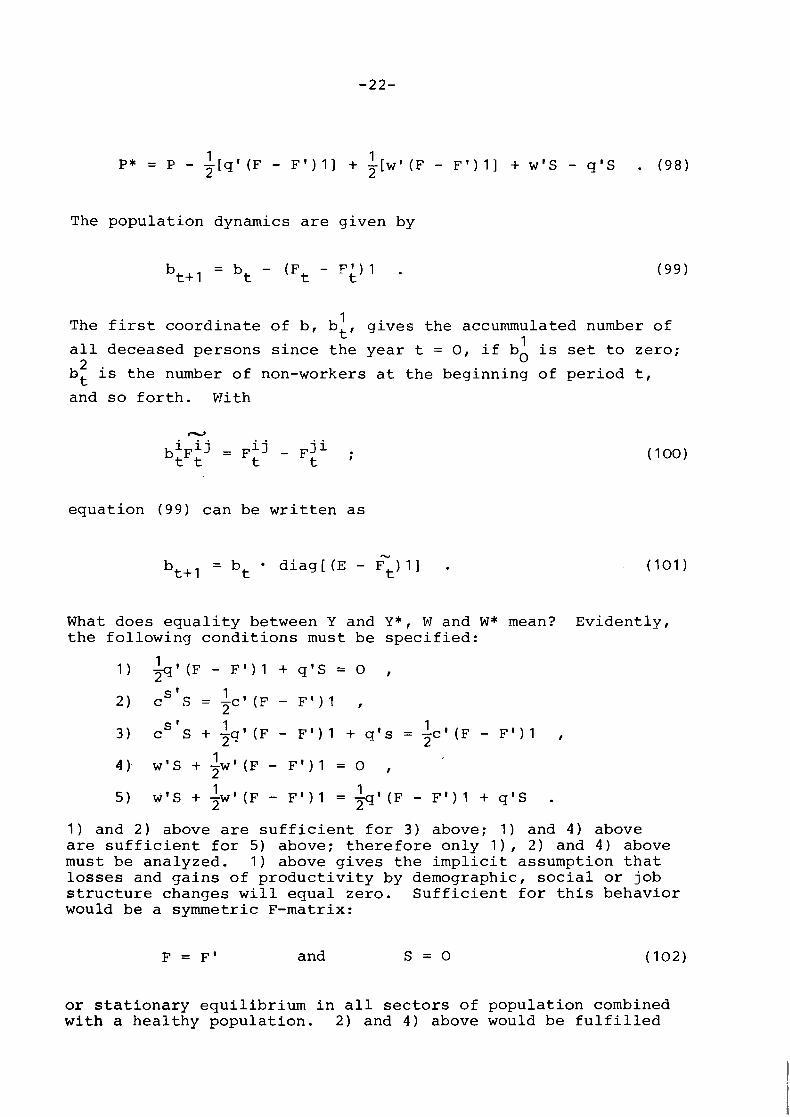
p * = p - 1 1 T[q' (F - F') 1 1 + T [ ~ ' (F - F') I] + w'S - q l S . (98)
The population dynamics are given by
1 The first coordinate of b, bt, gives the accummulated number of
all deceased persons since the year t = 0, if b; is set to zero; *
b; is the number of non-workers at the beginning of period t,
and so forth. With
equation (99) can be written as
What does equality between Y and Y*, W and W* mean? Evidently, the following conditions must be specified:
s ' 1 1 3) c S + -a' (F - F') 1 + q's = -c' (F - F') 1 , 2 - 2
1 ) and 2) above are sufficient for 3) above; 1) and 4) above are sufficient for 5) above; therefore only 1 ) , 2) and 4) above must be analyzed. 1) above gives the implicit assumption that losses and gains of productivity by demographic, social or job structure changes will equal zero. Sufficient for this behavior would be a symmetric F-matrix:
F = F' and S = O (102)
or stationary equilibrium in all sectors of population combined with a healthy population. 2) and 4) above would be fulfilled
if, for instance, no sick persons would exist:
Equation (101 ) is reduced by (102) to:
which is the equation of the stationary state. If one will S specify the elements of q, w, C and c, less restrictive Froper-
ties for F could be derived.
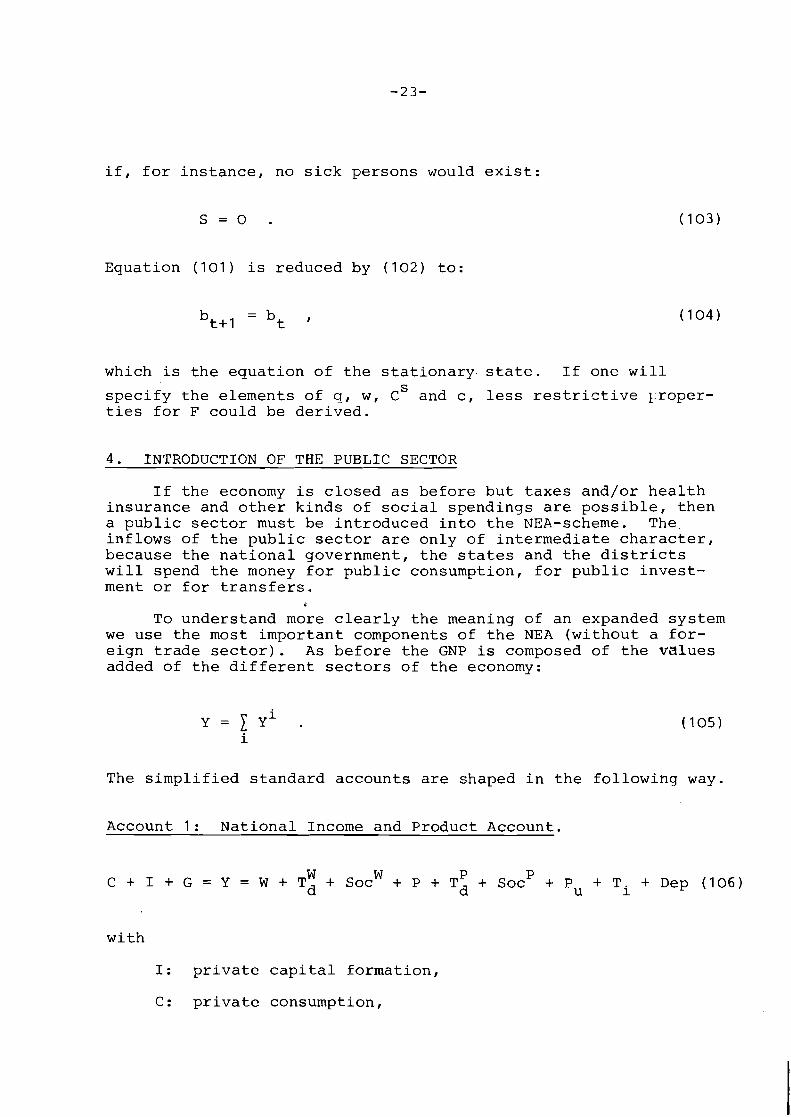
4 . INTRODUCTION OF THE PUBLIC SECTOR
If the economy is closed as before but taxes and/or health insurance and other kinds of social spendings are possible, then a public sector must be introduced into the NEA-scheme. The inflows of the public sector are only of intermediate character, because the national government, the states and the districts will spend the money for public consumption, for public invest- ment or for transfers.
1
To understand more clearly the meaning of an expanded system we use the most important components of the NEA (without a for- eign trade sector). As before the GNP is composed of the values added of the different sectors of the economy:
The simplified standard accounts are shaped in the following way.
Account 1: National Income and Product Account.
11 P C + I + G = Y = W + T + SOC' + P + Td + socP + P + Ti + Dep (106) d u
with
I: private capital formation,
C: private consumption,

government purchases for goods and services,
W:
T;:
W soc :
P soc :
net wages,
direct taxes of employed persons,
contributions to the social insurance by employed persons,
non-labor income, after taxes,
direct taxes out of non-labor income,
contributions to the social insurance by employers,
undistributed profits,
Ti: indirect taxes,
Dep: depreciation,
Y: gross national product.
Account 2: Personal Income and Outlay Account.
Y = W + P + Tra = C + T H + TP + socW + socP + S , (107) P g g d d P
with
W : gross wases, g
P : gross non-labor income, g
Tra: transfers,
S : personal savings, P
Y : personal income. P
Account 3: Government Receipts and Expenditure Account.
Y~ = T: + T' + T~ + SOC' + socP = Tra + Sur + G , d
with
Sur: government surplus on income and product account (negative deficit),
YG: government receipts.
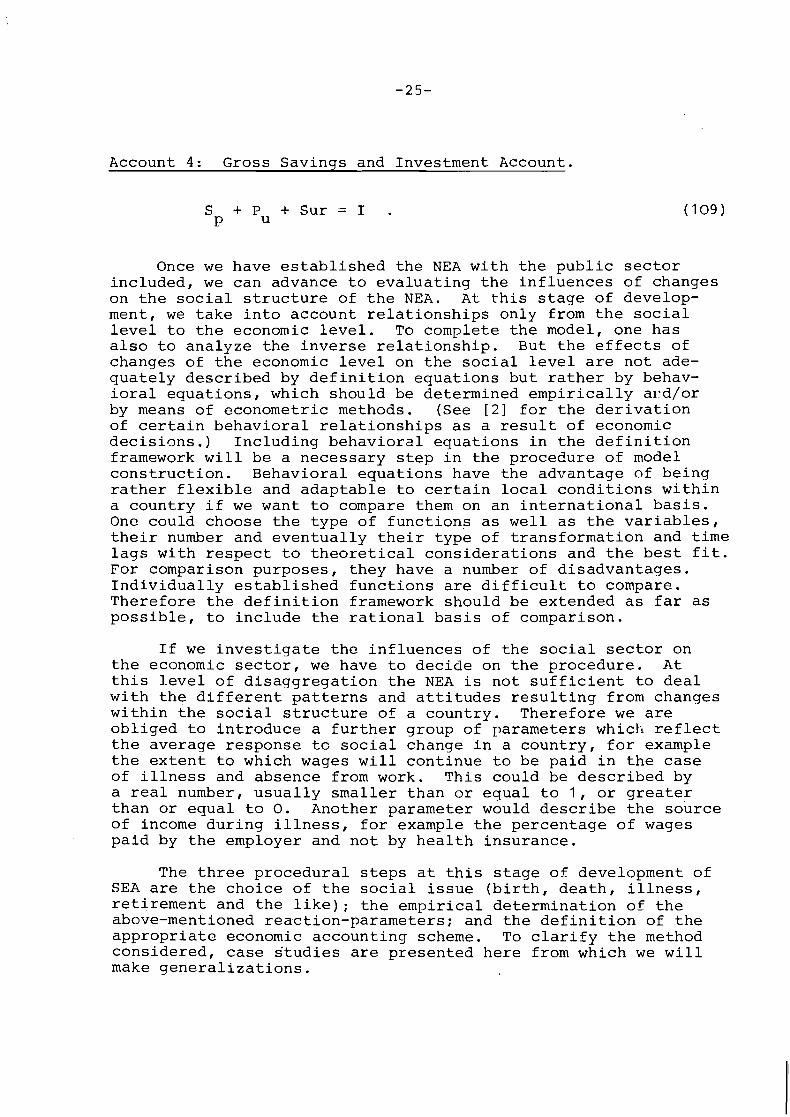
Account 4: Gross Savings and Investment Account.
S + Pu + Sur = I . P
(109)
Once we have established the NEA with the public sector included, we can advance to evaluating the influences of changes on the social structure of the NEA. At this stage of develop- ment, we take into account relationships only from the social level to the economic level. To complete the model, one has also to analyze the inverse relationship. But the effects of changes of the economic level on the social level are not ade- quately described by definition equations but rather by behav- ioral equations, which should be determined empirically al!d/or by means of econometric methods. (See [2] for the derivation of certain behavioral relationships as a result of economic decisions.) Including behavioral equations in the definition framework will be a necessary step in the procedure of model construction. Behavioral equations have the advantage of being rather flexible and adaptable to certain local conditions within a country if we want to compare them on an international basis. One could choose the type of functions as well as the variables, their number and eventually their type of transformation and time lags with respect to theoretical considerations and the best fit. For comparison purposes, they have a number of disadvantages. Individually established functions are difficult to compare. Therefore the definition framework should be extended as far as possible, to include the rational basis of comparison.
If we investigate the influences of the social sector on the economic sector, we have to decide on the procedure. At this level of disaggregation the NEA is not sufficient to deal with the different patterns and attitudes resulting from changes within the social structure of a country. Therefore we are obliged to introduce a further group of parameters which reflect the average response tc social change in a country, for example the extent to which wages will continue to be paid in the case of illness and absence from work. This could be described by a real number, usually smaller than or equal to 1 , or greater than or equal to 0 . Another parameter would describe the source of income during illness, for example the percentage of wages paid by the employer and not by health insurance.
The three procedural steps at this stage of development of SEA are the choice of the social issue (birth, death, illness, retirement and the like); the empirical determination of the above-mentioned reaction-parameters; and the definition of the appropriate economic accounting scheme. To clarify the method considered, case studies are presented here from which we will make generalizations.

4.1. Case 1 : Illness of a Worker
Within the framework of definition equations, one has to make explicit the causal chain pattern. What are the given assumptions? What are the results obtained? In the case of illness of a worker we do not ask the reason for the illness; this should be done at a later stage. We use the fact of getting ill as the starting point of our causal chain as shown in Figure 5 below.
eventual eventual change loss in in consumption
illness sick-leave loss in output income patterns
eventual hiring loss in eventual pay- of new labor tax pay- ments of social
ment insurances
Figure 5.
This chain is only one possible way of describing what is going on in the economic sector. Similar and more complete chains must-be set up to assure the existence of a solution of the definition equations of the NEA.
In this case, we propose a first approximation of procedure. (The a priori restrictions could be levied, if the problems and manners of the country under consideration require this.) The population is divided into workers and non-workers. Thus we must consider the following:
- Illness of a worker.
- Sick-leave of a duration of Ad fraction of time unit
(without losing generality we take one year).
- Loss of production of A fraction of average productivity 9
q. The total loss is computed by A A q. d q
- There is a possible scale of wage changes (see Figure 6).
no wage in continuous case of illness wage payment
Figure 6.
- A worker's wage during illness is XdXww.
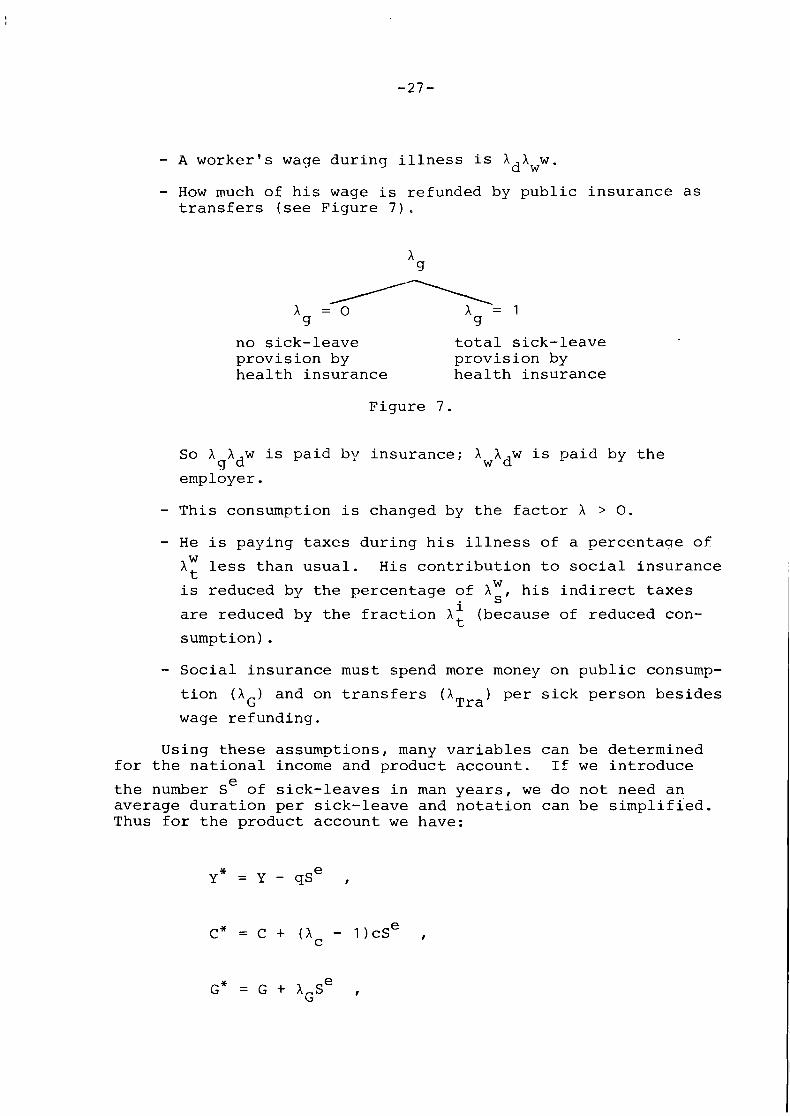
- How much of his wage is refunded by public insurance as transfers (see Figure 7).
no sick-leave total sick-leave provision by provision by health insurance health insurance
Figure 7.
So X X w is paid by insurance; X X w is paid by the FI d w d
employer.
- This consumption is changed by the factor X > 0.
- He is paying taxes during his illness of a percentage of W A + less than usual. His contribution to social insurance L
is reduced by the percentage of XW his indirect taxes s are reduced by the fraction X i (because of reduced con-
sumption).
- Social insurance must spend more money on public consump-
tion (A ) and on transfers (A ) per sick person besides G Tra
wage refunding.
Using these assumptions, many variables can be determined for the national income and product account. If we introduce
the number se of sick-leaves in man years, we do not need an average duration per sick-leave and notation can be simplified. Thus for the product account we have:
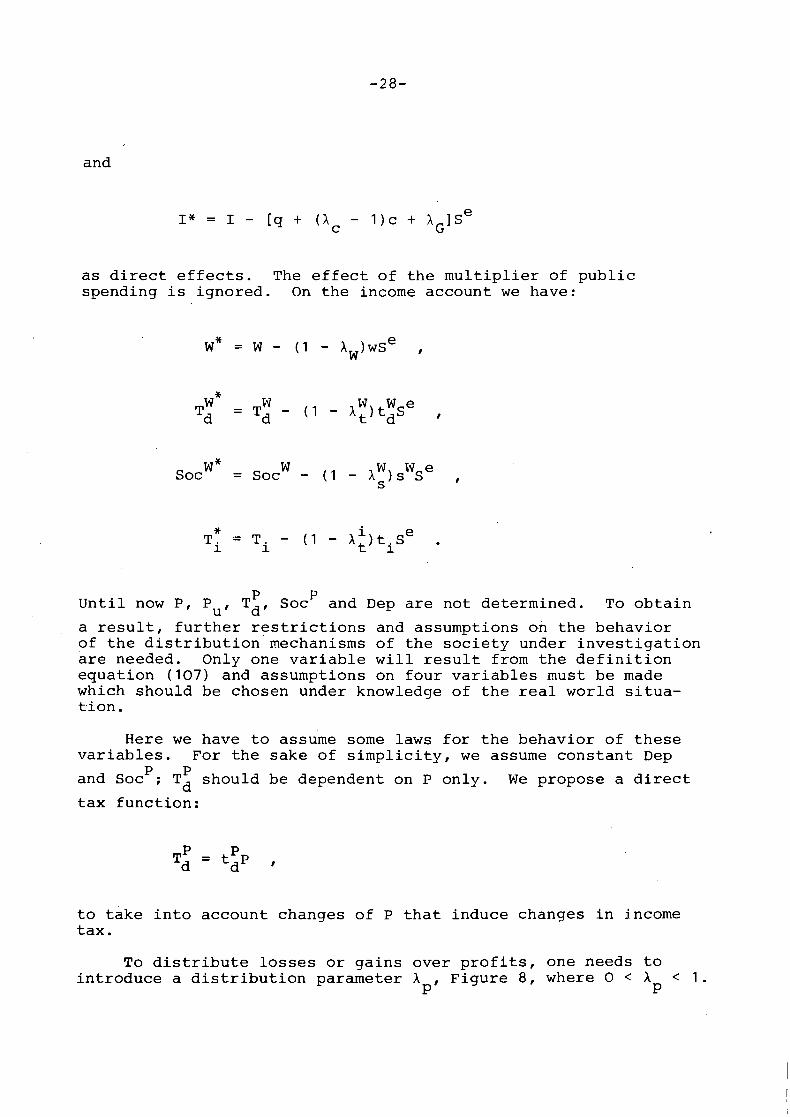
and
as direct effects. The effect of the multiplier of public spending is ignored. On the income account we have:
W* w w W e soc = S o c - (1 - A s ) S S ,
P Until now P, Put Td , socP and Dep are not determined. To obtain
a result, further restrictions and assumptions on the behavior of the distribution mechanisms of the society under investigation are needed. Only one variable will result from the definition equation (107) and assumptions on four variables must be made which should be chosen under knowledge of the real world situa- tion.
Here we have to assume some laws for the behavior of these variables. For the sake of simplicity, we assume constant Dep
and socP; T: should be dependent on P only. We propose a direct
tax function:
to take into account changes of P that induce changes in income tax.
To distribute losses or gains over profits, one needs to introduce a distribution parameter X Figure 8, where 0 < X < 1.
P' P

All losses are All losses are distributed to PU distributed to P
Figure 8.
The main determinant for X D is the sector where the sick person L-
was working. If he worked in agriculture, no direct influence on undistributed profits can be expected. If he is working in a large corporation, undistributed profits could be influenced. The actual figure for X is determined by an average situation
P existing in the country.
Now we are ready to estimate the influence of illness on P and PU:
~ e p * = Dep ,
w* w* P* + P: = Y* - W* - T - Soc - T:* - socP* - T* - Dep* i
W P P = Y - W - T: - Soc - Td - Soc - Ti - Dep - A
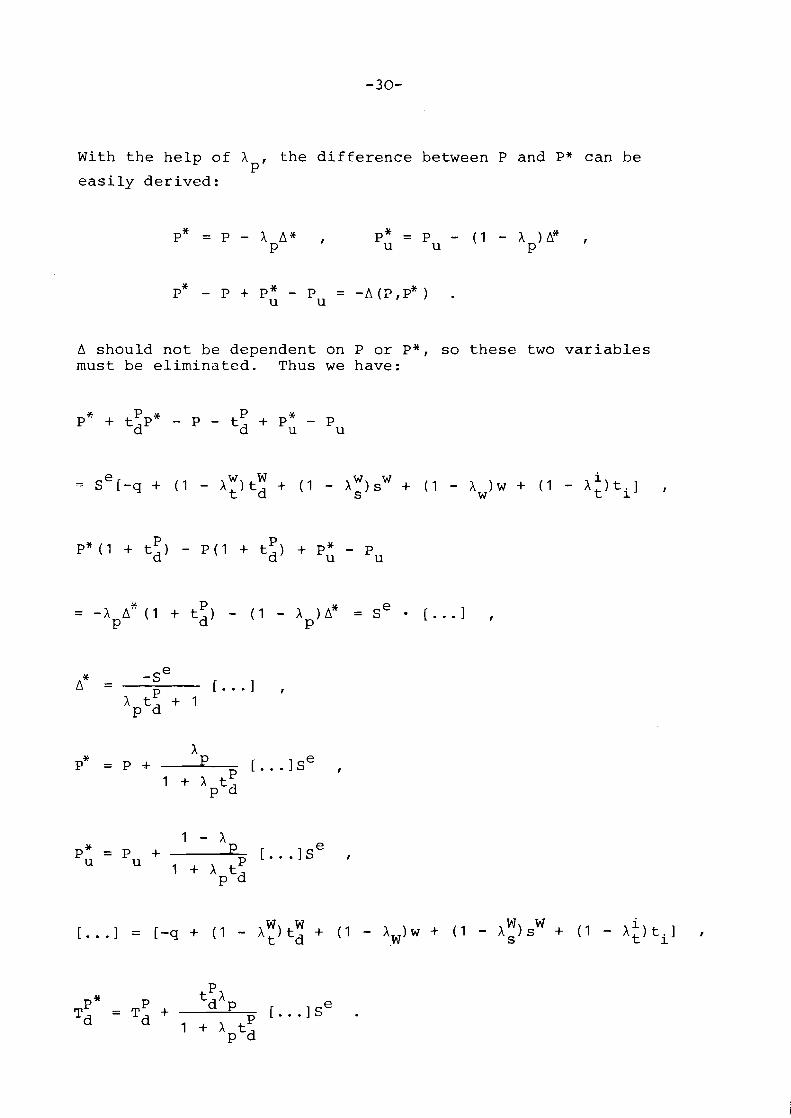
With t h e h e l p o f X t h e d i f f e r e n c e be tween P and P* c a n b e P I
e a s i l y d e r i v e d :
A s h o u l d n o t b e d e p e n d e n t on P o r P*, so t h e s e t w o v a r i a b l e s mus t b e e l i m i n a t e d . Thus w e have:
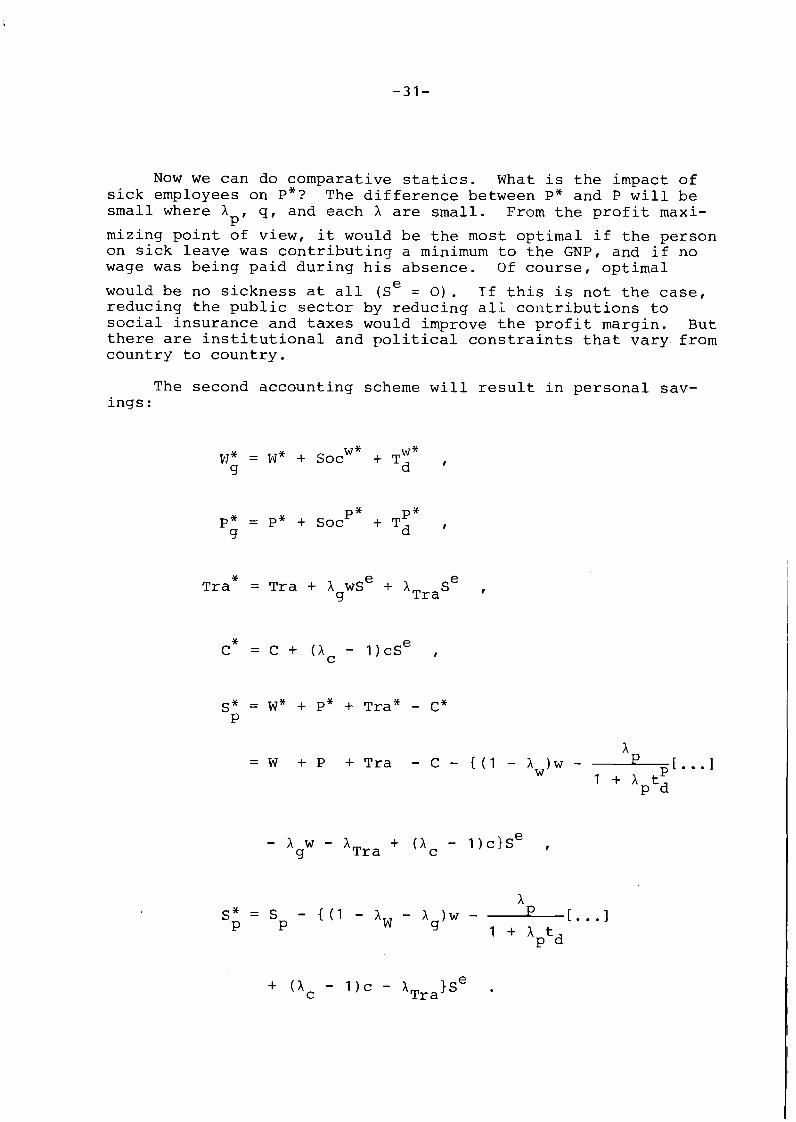
Now we can do comparative statics. What is the impact of sick employees on P*? The difference between P* and P will be small where X q, and each X are small. From the profit maxi-
P' mizing point of view, it would be the most optimal if the person on sick leave was contributing a minimum to the GNP, and if no wage was being paid during his absence. Of course, optimal
would be no sickness at all (se = 0 ) . Tf this is not the case, reducing the public sector by reducing all contributions to social insurance and taxes would improve the profit margin. But there are institutional and political constraints that vary- from country to country.
The second accounting scheme will result in personal sav- ings :
e ~ r a * = Tra + h wS + ATrase 9
X = W + P + Tra - C - { ( I - Xw)w - + [ . . . I
1 + A t P d
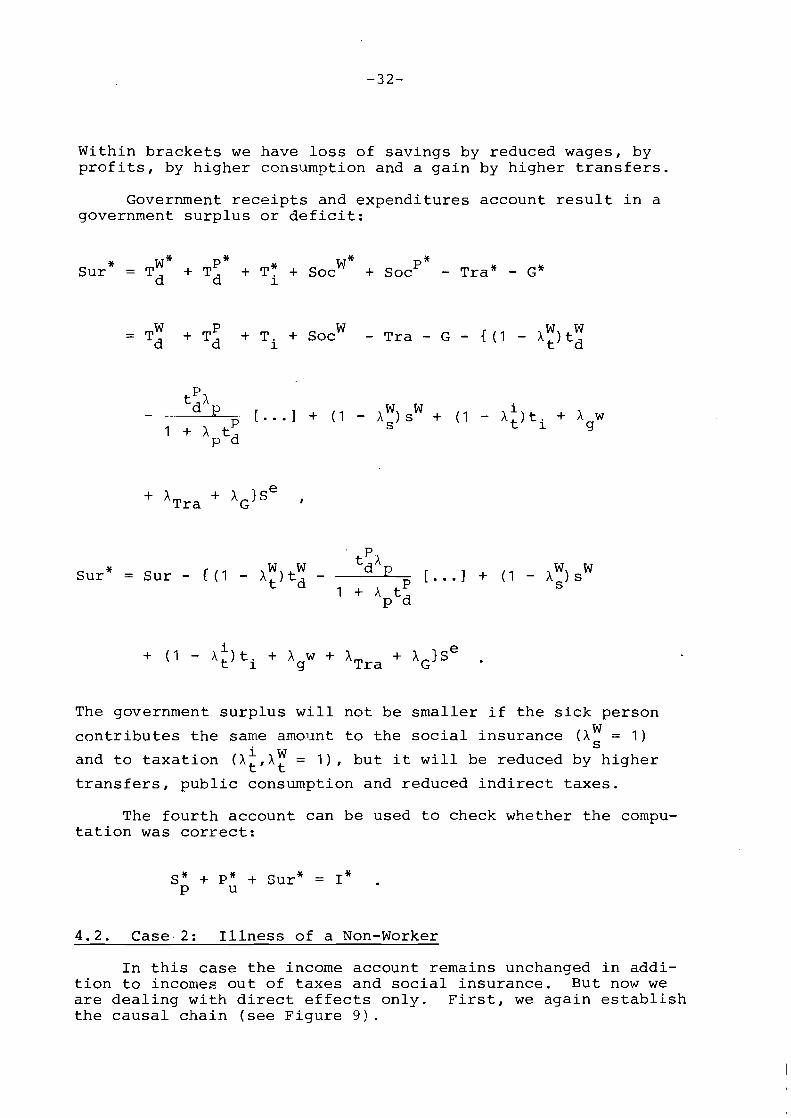
With in b r a c k e t s w e have l o s s o f s a v i n g s by reduced wages, by p r o f i t s , by h i g h e r consumption and a g a i n by h i g h e r t r a n s f e r s .
Government r e c e i p t s and e x p e n d i t u r e s a c c o u n t r e s u l t i n a government s u r p l u s o r d e f i c i t :
w W W + T: + T i + Soc - T r a - G - { ( l - A t ) t d = Td
The government s u r p l u s w i l l n o t be smaller i f t h e s i c k p e r s o n W
c o n t r i b u t e s t h e s a m e amount t o t h e s o c i a l i n s u r a n c e ( A - = 1 ) S
and t o t a x a t i o n ( h i , A: = 1 ) , b u t it w i l l be reduced by h i g h e r
t r a n s f e r s , p u b l i c consumption and reduced i n d i r e c t t a x e s .
The f o u r t h a c c o u n t can b e used t o check whether t h e compu- t a t i o n w a s c o r r e c t :
4.2. C a s e . 2 : I l l n e s s o f a Non-Worker
I n t h i s case t h e income a c c o u n t r emains unchanged i n a d d i - t i o n t o incomes o u t o f t a x e s and s o c i a l i n s u r a n c e . But now w e a r e d e a l i n g w i t h d i r e c t e f f e c t s o n l y . F i r s t , w e a g a i n e s t a b l i s h t h e c a u s a l c h a i n (see F i g u r e 9 ) .

change in change in illness indirect taxes
expenditures
personal savings
Figure 9.
As in case 1, we assume a very simple labor structure: workers and non-workers.
If there are sn sick-years of workers, the national income and product account is changed by the changed consumption C and government expenditure. The parameters are (Ac - l)c and AG,
respectively. The parameters of case 2 may differ from the values of case 1 so that:
We assume no change in contribution to social insurance, wages, and direct taxes of employees. Changes in indirect taxes result in changed profits and direct profit tax so that:

i * i SOC = S o c I
~ e ~ * = Dep I
a n d
P * P P Td = t d ( p * - P) + Td I
a n d t h e s h a r e o f losses o n P a n d PU i s A we g e t P I
P* + Pu w* w* P* * = Y* - W - Td - S o c - S o c - T; - ~ e p * -
= P + Pu + ( 1 i - A t ) t i S
P " - t d ( p * - P ) ,
P P i P * ( 1 + td) + P: = P ( l + td) + PU + ( 1 - A t ) t i S
n
w i t h

i Depending on the size of X P* is greater or less than P t' (P* u : Pu).
The personal income account can easily be computed with:
Tra* = Tra + hTrasn I
Personal savings will grow with transfers and decline with extra consumption and indirect taxes--no indirect effects are included. Government surplus is reduced by higher transfers, smaller direct profit taxes and higher government expenditures:
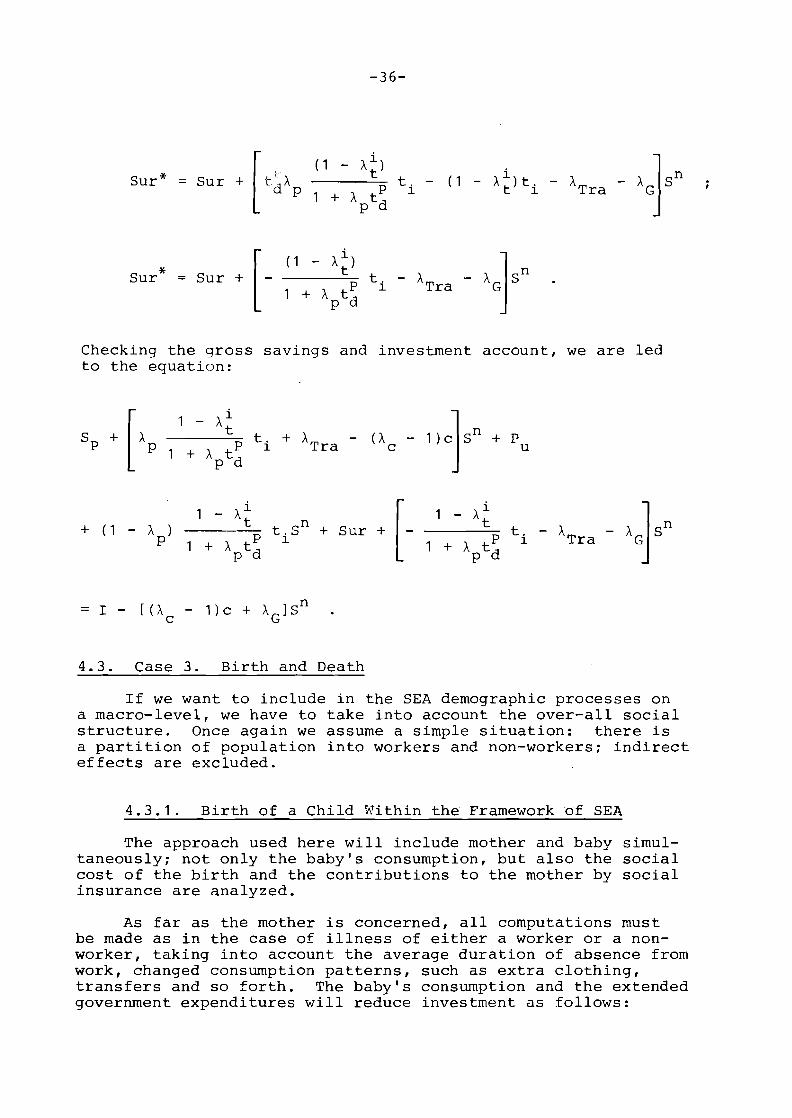
Checking the gross savings and investment account, we are led to the equation:
4 . 3 . Case 3 . Birth and Death
If we want to include in the SEA demographic processes on a macro-level, we have to take into account the over-all social structure. Once again we assume a simple situation: there is a partition of population into workers and non-workers; indirect effects are excluded.
4 . 3 . 1 . Birth of a Child Within the Framework o'f SEA
The approach used here will include mother and baby simul- taneously; not only the baby's consumption, but also the social cost of the birth and the contributions to the mother by social insurance are analyzed.
As far as the mother is concerned, all computations must be made as in the case of illness of either a worker or a non- worker, taking into account the average duration of absence from work, changed consumption patterns, such as extra clothing, transfers and so forth. The baby's consumption and the extended government expenditures will reduce investment as follows:
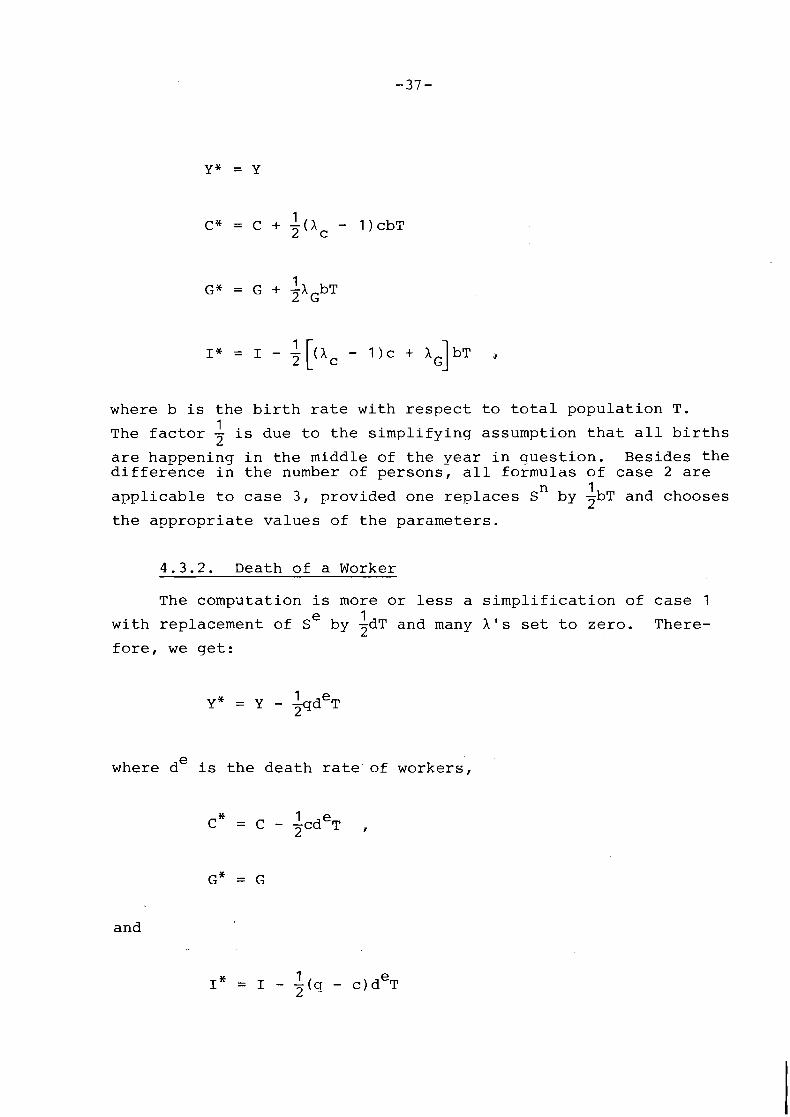
where b is the birth rate with respect to total population T. 1 The factor 2 is due to the simplifying assumption that all births
are happening in the middle of the year in question. Besides the difference in the number of persons, all formulas of case 2 are
n 1 applicable to case 3, provided one replaces S by -bT and chooses 2 the appropriate values of the parameters.
4.3.2. Death of a Worker
The compatation is more or less a simplification of case 1 e 1 with replacement of S by -dT and many X's set to zero. There-
2 fore, we get:
where de is the death rate of workers,
and
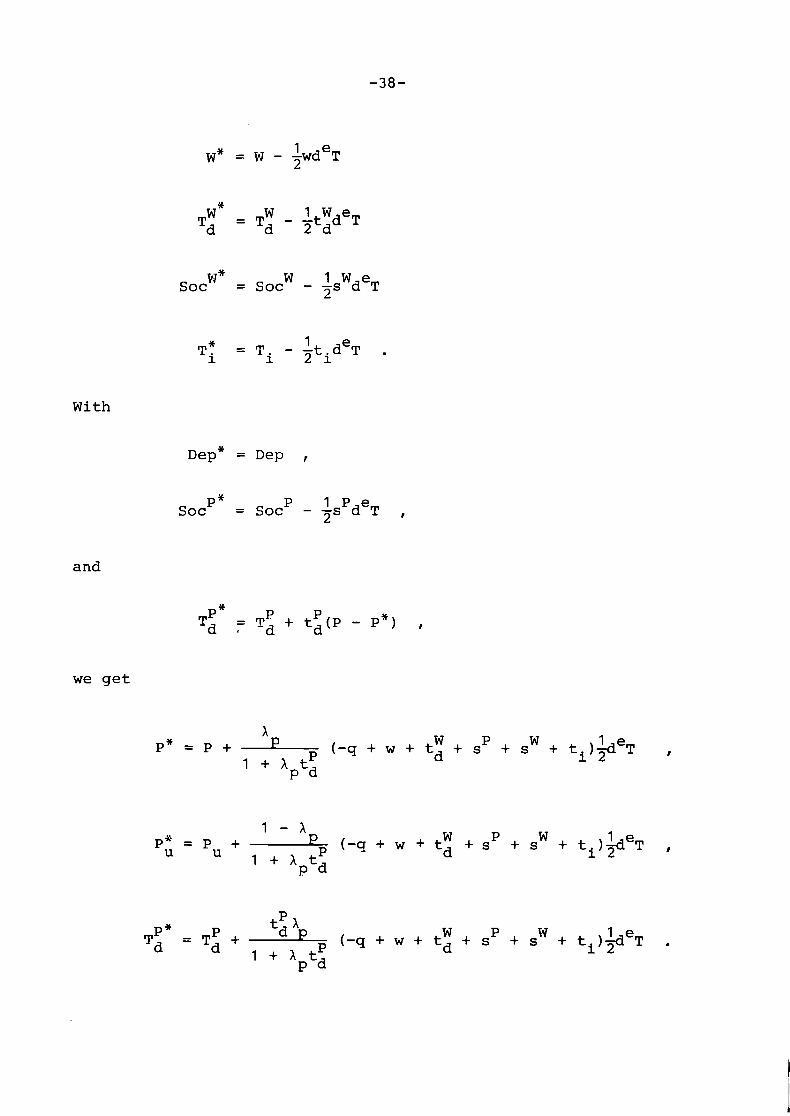
1 e W* = W - -wd T 2
W* w 1 W e Td = T ~ - - t d ~ 2 d
W* w 1 W e Soc = Soc - 3 s d T
T: = T~ - - t . d 1 e T . 2 1
With
~ e ~ * = Dep ,
P* 1 P e Soc = socP - 2 s d T
a n d
w e get
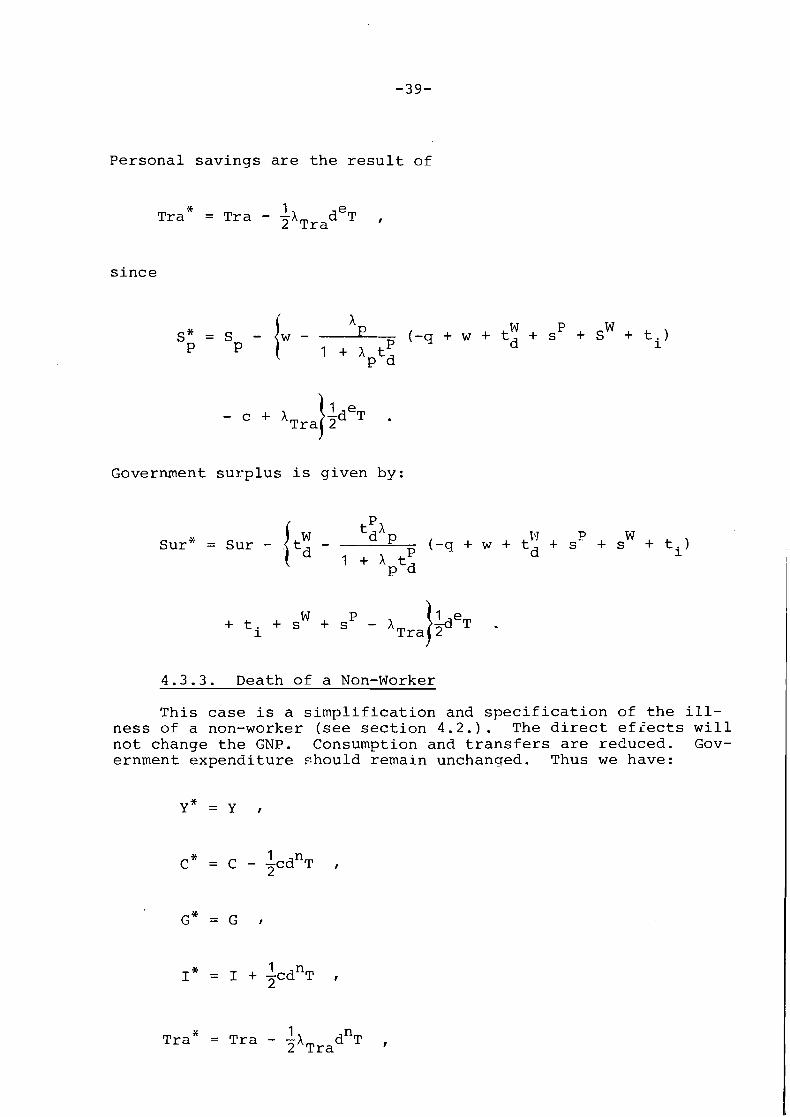
Personal savings are the result of
* 1 Tra = Tra - -X d e ~ I 2 Tra
since
Government surplus is given by:
tPX ~ u r * = Sur - ( - q + w + t " + s P + s W + t i )
- 1 + A t P d P d
4.3.3. Death of a Non-Worker
This case is a simplification and specification of the ill- ness of a non-worker (see section 4.2.). The direct efiects will not change the GNP. Consumption and transfers are reduced. Gov- ernment expenditure should remain unchanged. Thus we have:
1 ~ r a * = Tra - -A d n ~ I 2 Tra
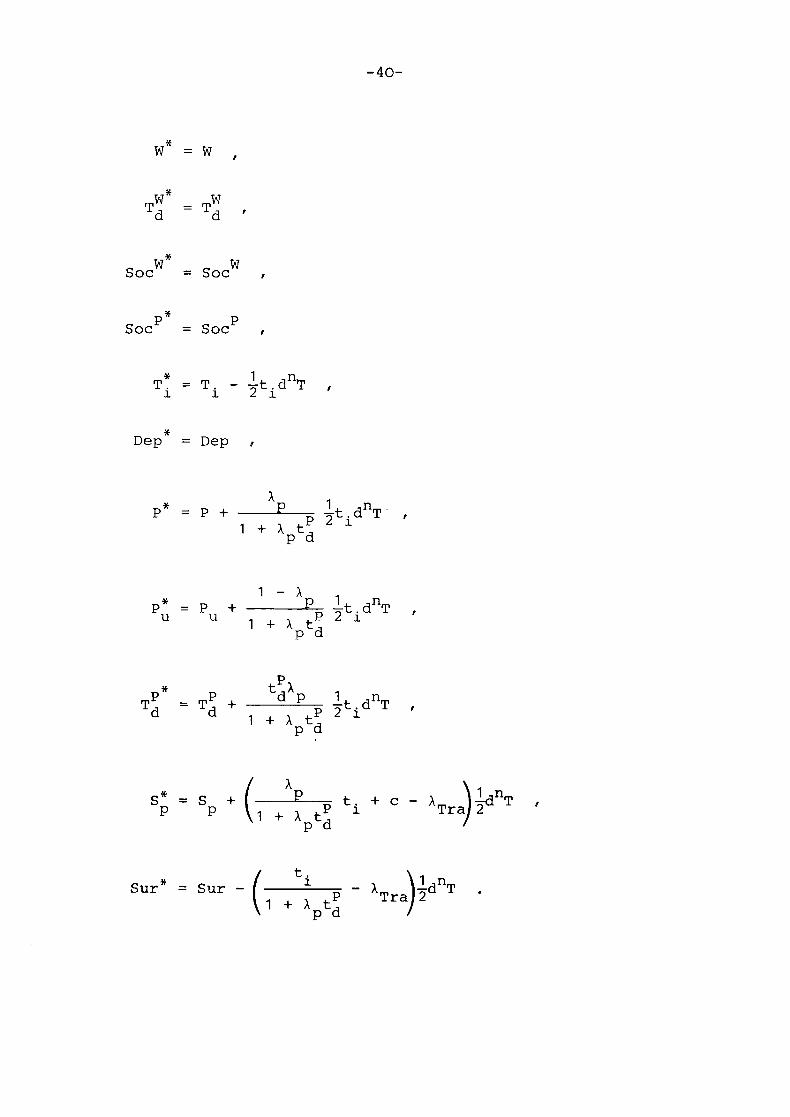
w * = w ,
W* W Td = Td ,
w* W SOC = SOC ,
P* P SOC = SOC r
* - Ti - Ti 1 - - t . d " ~ # 2 1
* D e p = D e p r

4.4. Case 4: Transition from the Non-Worker to the Worker Category
Similar to 2 . 2 . 4 the extended SEA is applied to net tran- sitions as follows:
Thus
If there is no chanue in consumption patterns,
c * = c ,
and
* G = G 1
if government expenditures remain unchanged.
1 1 * = 1 + ~ q F
1 W* = W + T ~ F ,
1 w Tw* d = T! + ltdF ,
w* 1 W SOC = S O C ~ + -S F , 2
1 P SocP* = socP + 3s F ,
~ e ~ * = Dep
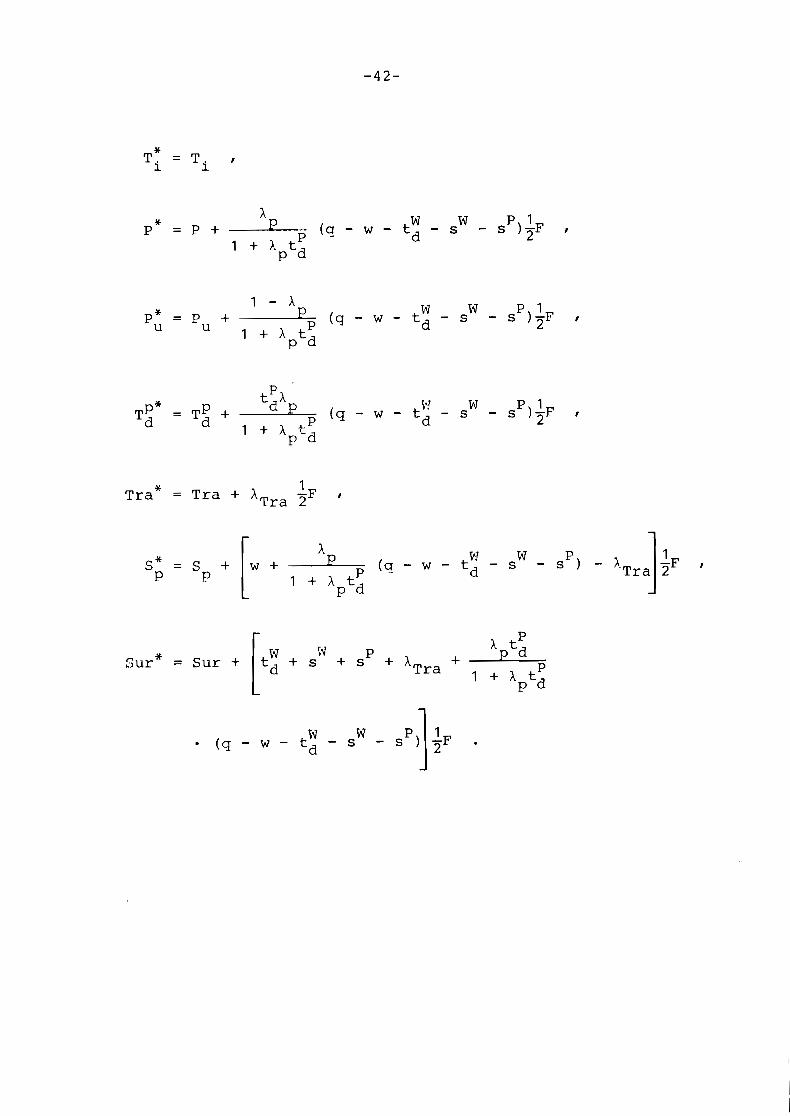
I - A W W P 1 P : = P u + - ( q - w - t d - s - S ) ~ F I
1 + A t P d
1 T r a * = T r a + X T r a ZF I
REFERENCES
[I] Forrester, J.W. Principles of Systems. Wright-Allen Press, Cambridge, Mass., 1968.
[21 Newhouse, J.P., et al., Policy Options and the Impact of Nations Health Insurance, The New England Journal of Medicine, - 290 (1974), 1,345-1,359.
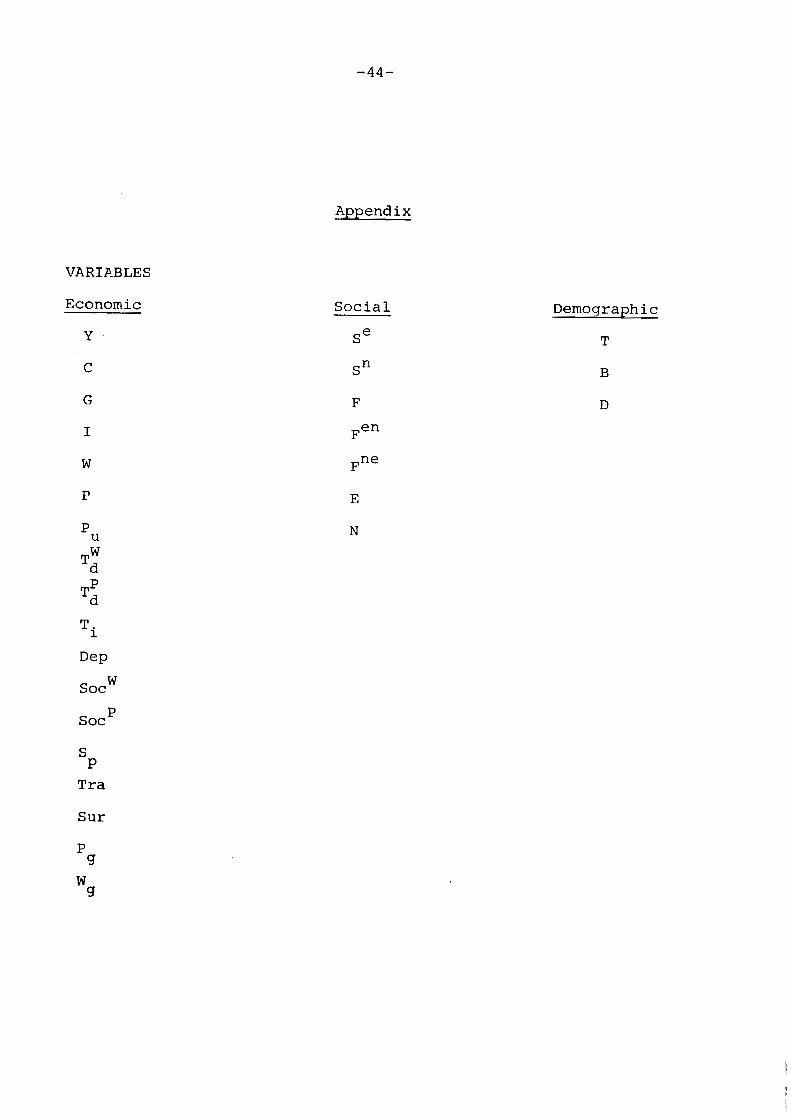
Appendix
VARIABLES
Economic
Y
D ~ P
soc W
T r a
S u r
Social
se
sn
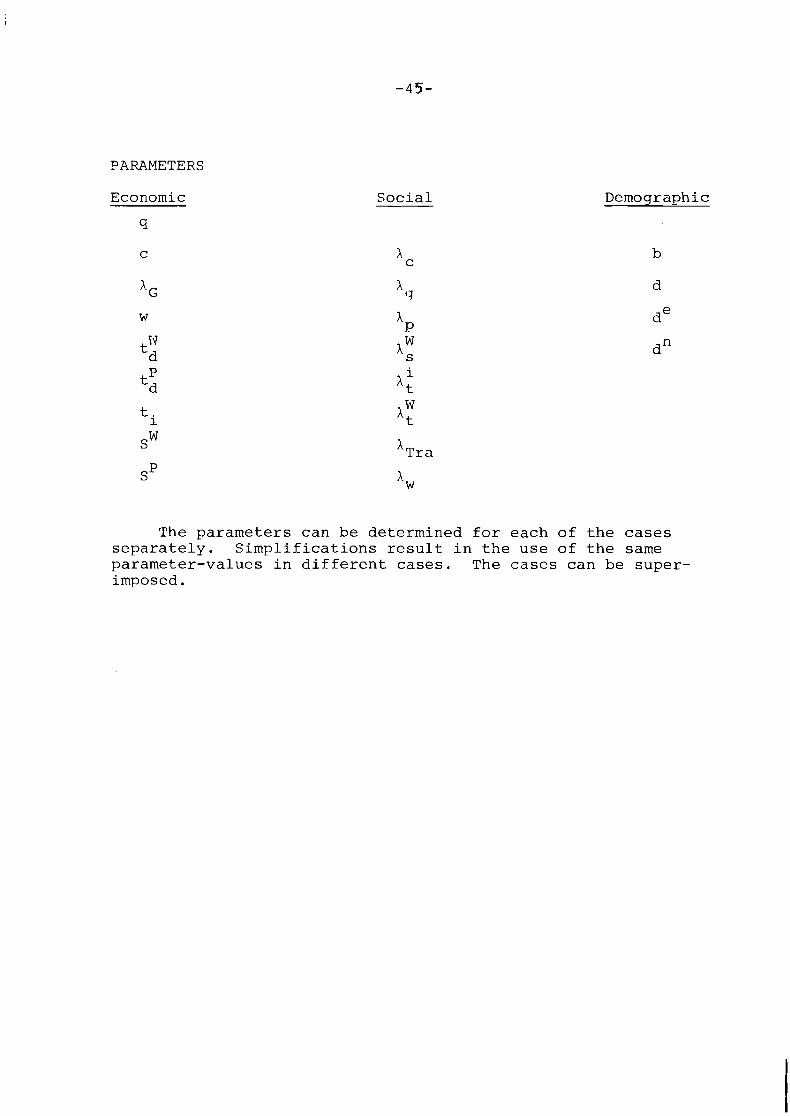
PARAMETERS
Economic Social
The parameters can be determined for each of the cases separately. Simplifications result in the use of the same parameter-values in different cases. The cases can be super- imposed.
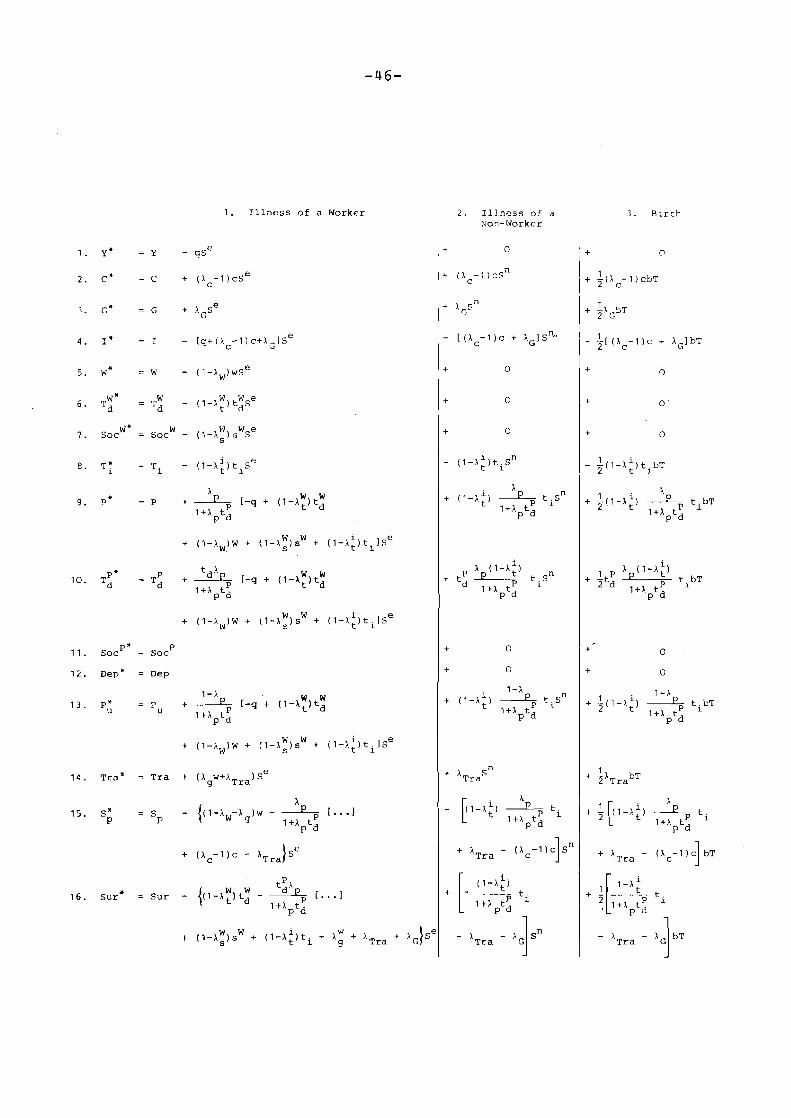
1 . I l lness of a Worker 3 . B i r t h
+ (1-AW)W + ( I -AE)sW + (1-A:)tilse
1 1 . socPX = SOC P
12. ~ e ~ * = Dep
1 - A 13. P: - - Pu + -+ [-q .+ (1-A!) t!
1+A t P d
14. Tra" = Tra + (A w+ATra)se g
+ A sn C,
- [(A - 1 )c + AG1sn"
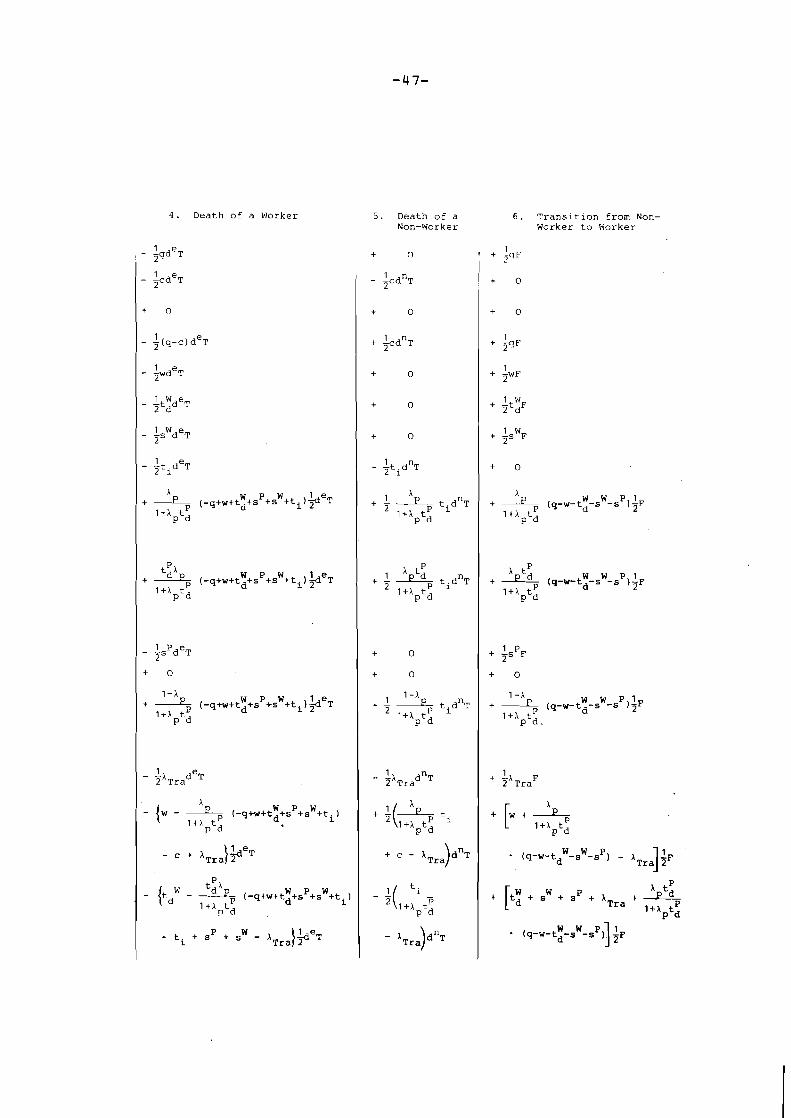
4 . D e a t h o f a W o r k e r
-47-
5 . D e a t h o f a Non-Worker
+ 0
- &dnT
+ 0
+ L c d n T 2
+ 0
+ 0
+ 0
- ; t i d n ~
+ 1+X tP
P d
+ T 1+A tP P '3
+ 0
+ 0
+ 1+A tP
P d
1 - Z A T r a d n ~
t .
6 . T r a n s i t i o n f r o m Non- W o r k e r t o b o r k e r
A W W P I + 2 ( q -w- t -s - s )-F
1+A tP d 2 P d
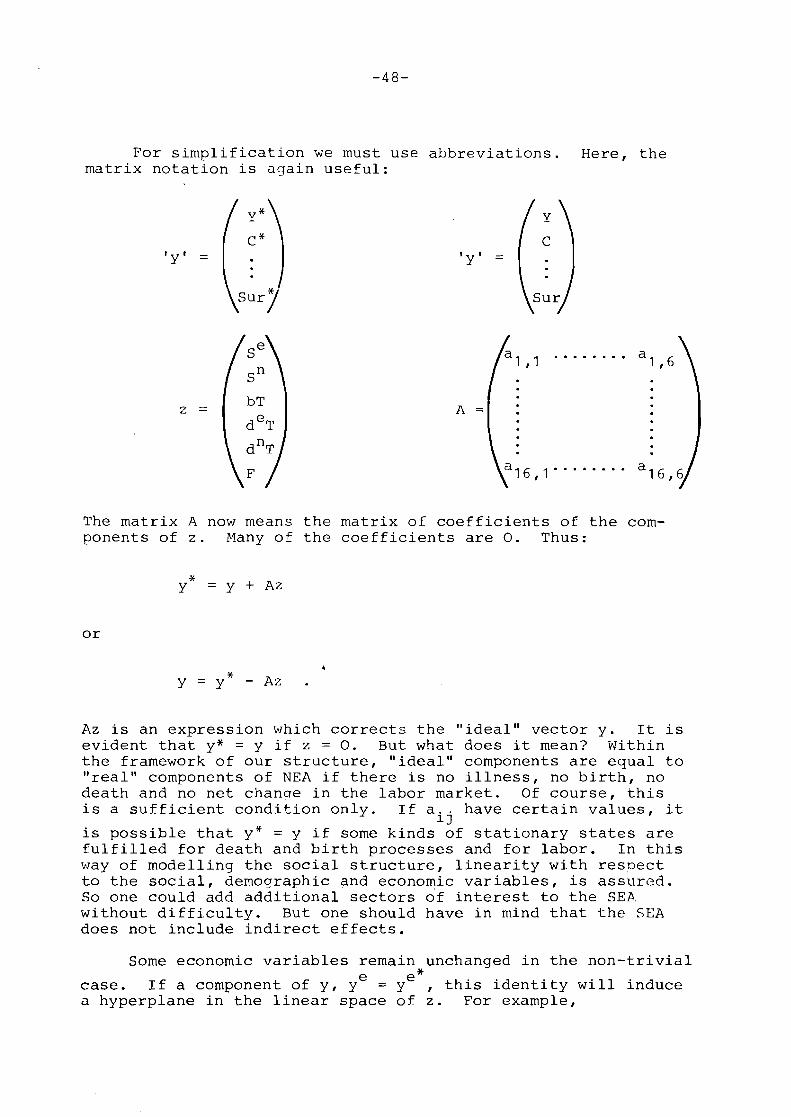
For simplification we must use abbreviations. Here, the matrix notation is again useful:
'y' =
~ u r *
'y' =
Sur
The matrix A now means the matrix of coefficients of the com- ponents of z . Many of the coefficients are 0. Thus:
Az is an expression which corrects the "ideal" vector y. It is evident that y* = y if z = 0 . But what does it mean? Within the framework of our structure, "ideal" components are equal to "real" components of NEA if there is no illness, no birth, no death and no net chanse in the labor market. Of course, this is a sufficient condition only. If a have certain values, it ij is possible that y* = y if some kinds of stationary states are fulfilled for death and birth processes and for labor. In this way of modelling the social structure, linearity with respect to the social, demoqraphic and economic variables, is assured. So one could add additional sectors of interest to the SEA without difficulty. But one should have in mind that the SEA does not include indirect effects.
Some economic variables remain unchanged in the non-trivial e
case. If a component of y, y = ye*, this identity will induce a hyperplane in the linear space of z . For example,

-49-
the gross national product,
or if we want to determine the necessary amount of net additional workers to overcome the deficit by illness and death,
if the productivities in a a and a I l l 1 1,4 are assumed equal, 116
we get