Embed Size (px)
Citation preview
R E S E A R C HRETIREMENT
State and Local Pension Plans Number 20, September 2011
COMPARING COMPENSATION: STATE-
LOCAL VERSUS PRIVATE SECTOR WORKERSBy Alicia H. Munnell, Jean-Pierre Aubry, Josh Hurwitz, and Laura Quinby*
* Alicia H. Munnell is the Peter F. Drucker Professor of Management Sciences in Boston College’s Carroll School of Management and director of the Center for Retirement Research at Boston College (CRR). Jean-Pierre Aubry is the assistant director of state and local research at the CRR. Josh Hurwitz and Laura Quinby are research associates at the CRR. The au-thors would like to thank Andrew Biggs, David Blitzstein, Keith Brainard, Peter Diamond, Elizabeth Kellar, Steven Kreisberg, Jason Richwine, and Nathan Scovronick for helpful comments.
Introduction
The comparability of state-local versus private sector pay has become a major issue in the wake of the financial crisis. Funded levels of public pension plans declined sharply, and governments’ ability to make required contributions has been severely constrained by the collapse of state-local budgets. Politicians everywhere are looking for ways to reduce pension costs and increase revenues. Often such efforts are couched in terms of excessively generous existing compensation – especially, current pensions. Dueling studies have appeared arguing that state-local workers are paid less or more than their private sector coun-terparts. Virtually all agree that wages of state-local employees are lower than for private sector workers with similar education and experience, but research-ers differ on the extent to which pensions and other benefits compensate for the shortfall. This brief builds on the recent wave of studies by refining the estimates of the value of benefits.
The discussion proceeds as follows. The first sec-tion presents some basic data on wages and benefits. The second section, following the methodology of earlier researchers, estimates the relative wages in the state-local versus private sector, controlling for education, demographics, and other factors. The results suggest that state and local workers in the aggregate have a wage penalty of 9.5 percent. The third section explores the extent to which benefits for state and local workers offset the wage penalty. With appropriate modifications for pension contributions and the addition of retiree health insurance, annual public sector compensation – including both wages and benefits – is about 4 percent less than that in the private sector. The final section concludes that, given the modest size of any differential between public and private compensation, policymakers should look carefully at the specifics of their own state or locality before making significant changes.
LEARN MORE
Search for other publications on this topic at:crr.bc.edu

Center for Retirement Research2
The Basic Facts
While a full answer to the question of parity of compensation requires careful comparisons between people with similar skills doing similar jobs, some basic statistics are a good place to start. Average wages for state-local sector workers between 25 and 64 – even without controlling for education and other factors – are lower than those in the private sector, and the ratio of public to private sector wages has been declining over time (see Figure 1).
Figure 1. Ratio of Average Public to Private Sector Wages, Ages 25-64, 1990-2010
84%
88%
92%
96%
100%
104%
1990 1994 1998 2002 2006 2010 Source: Authors’ calculations from U.S. Department of Labor, Current Population Survey (CPS) (1990-2010).
On the other hand, pensions are more generous in the public sector. First, a greater percentage of workers has an employer-sponsored plan in the public sector than in the private sector – 76 percent vs. 43 percent. Second, among those employers who do sponsor plans, costs to the employer are higher in the state-local sec-tor, despite significant employee contributions, than in the private sector (see Figure 2).
Figure 2. Average Employer and Employee Pension Costs as Percent of Payroll, by Sector, 2009
7.0%
5.2%
3.0%
4.9%
0.0%
7.0%
0%
2%
4%
6%
8%
State and local defined benefit
Private sector defined benefit
Private sector defined
contribution
Employer - solidEmployee - striped
Note: The costs for defined benefit plans represent the normal cost. State-local costs are for Social Security eligible employees. The costs for those without Social Security aver-aged 7.1 percent (employer) and 7.6 percent (employee). Sources: Public Plans Database (PPD) (2009); Towers Watson (2009); and Vanguard (2010).
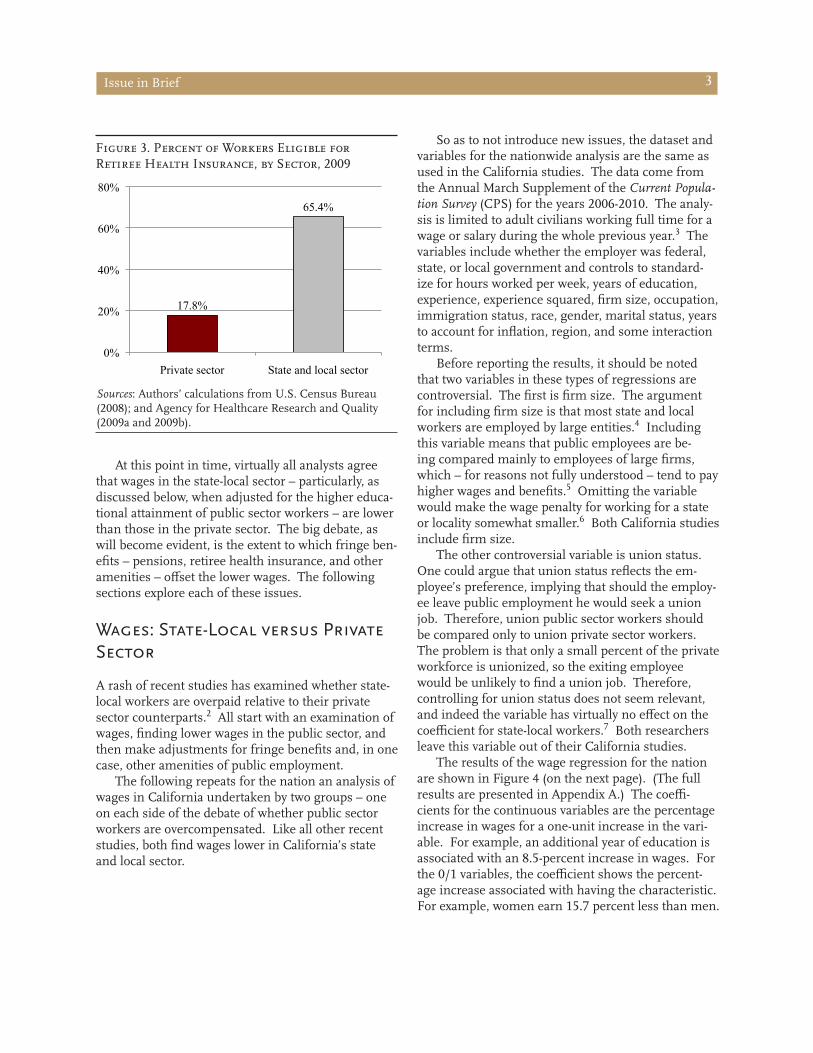
Finally, retiree health insurance is much more prevalent in the public sector than the private sec-tor (see Figure 3, on the next page). Unfortunately, no data are readily available to confirm this pattern, so estimates are required. In the private sector, the Medical Expenditure Panel Survey provides information on retiree health insurance offerings by firm size, and the Census shows the distribution of workers by firm size. Combining the two pieces of information yields an estimate of private sector coverage of 18 percent. In the public sector, our assumption is that the per-cent of the state-local workforce potentially eligible for retiree health is the same as that enrolled in employee health insurance – roughly 65 percent.1
Issue in Brief 3
Figure 3. Percent of Workers Eligible for Retiree Health Insurance, by Sector, 2009
17.8%
65.4%
0%
20%
40%
60%
80%
Private sector State and local sector Sources: Authors’ calculations from U.S. Census Bureau (2008); and Agency for Healthcare Research and Quality (2009a and 2009b).
At this point in time, virtually all analysts agree that wages in the state-local sector – particularly, as discussed below, when adjusted for the higher educa-tional attainment of public sector workers – are lower than those in the private sector. The big debate, as will become evident, is the extent to which fringe ben-efits – pensions, retiree health insurance, and other amenities – offset the lower wages. The following sections explore each of these issues.
Wages: State-Local versus Private Sector
A rash of recent studies has examined whether state-local workers are overpaid relative to their private sector counterparts.2 All start with an examination of wages, finding lower wages in the public sector, and then make adjustments for fringe benefits and, in one case, other amenities of public employment.
The following repeats for the nation an analysis of wages in California undertaken by two groups – one on each side of the debate of whether public sector workers are overcompensated. Like all other recent studies, both find wages lower in California’s state and local sector.
So as to not introduce new issues, the dataset and variables for the nationwide analysis are the same as used in the California studies. The data come from the Annual March Supplement of the Current Popula-tion Survey (CPS) for the years 2006-2010. The analy-sis is limited to adult civilians working full time for a wage or salary during the whole previous year.3 The variables include whether the employer was federal, state, or local government and controls to standard-ize for hours worked per week, years of education, experience, experience squared, firm size, occupation, immigration status, race, gender, marital status, years to account for inflation, region, and some interaction terms.
Before reporting the results, it should be noted that two variables in these types of regressions are controversial. The first is firm size. The argument for including firm size is that most state and local workers are employed by large entities.4 Including this variable means that public employees are be-ing compared mainly to employees of large firms, which – for reasons not fully understood – tend to pay higher wages and benefits.5 Omitting the variable would make the wage penalty for working for a state or locality somewhat smaller.6 Both California studies include firm size.
The other controversial variable is union status. One could argue that union status reflects the em-ployee’s preference, implying that should the employ-ee leave public employment he would seek a union job. Therefore, union public sector workers should be compared only to union private sector workers. The problem is that only a small percent of the private workforce is unionized, so the exiting employee would be unlikely to find a union job. Therefore, controlling for union status does not seem relevant, and indeed the variable has virtually no effect on the coefficient for state-local workers.7 Both researchers leave this variable out of their California studies.
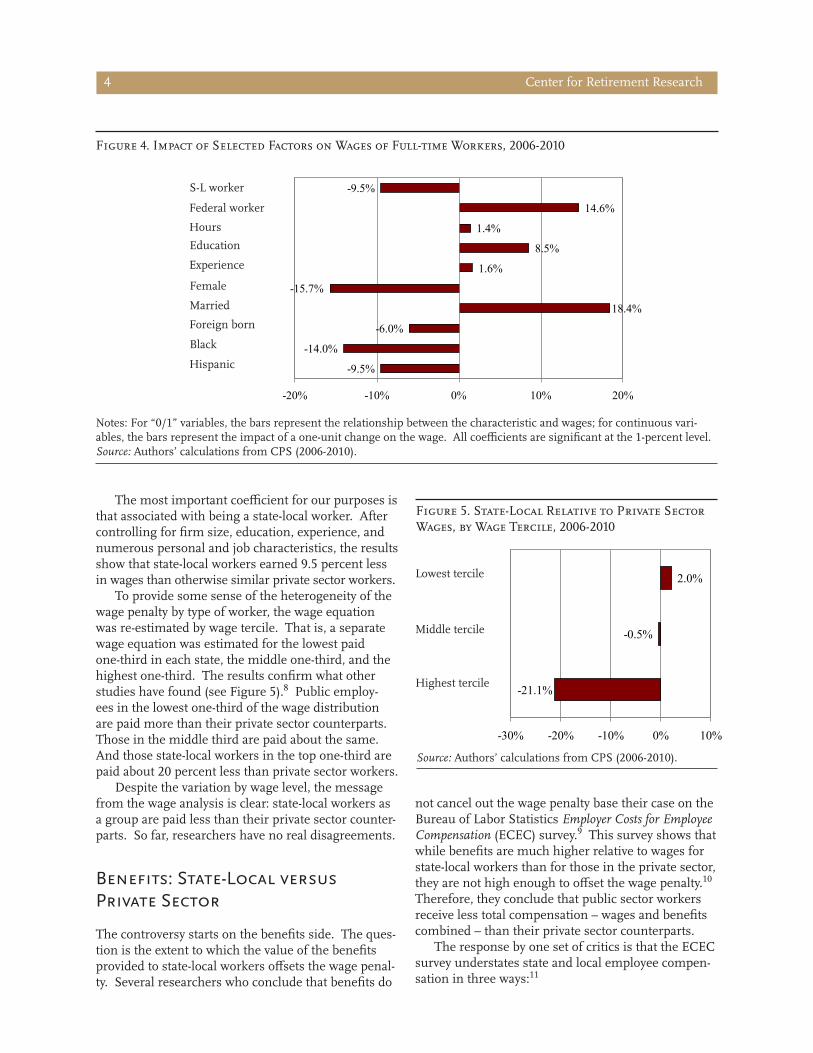
The results of the wage regression for the nation are shown in Figure 4 (on the next page). (The full results are presented in Appendix A.) The coeffi-cients for the continuous variables are the percentage increase in wages for a one-unit increase in the vari-able. For example, an additional year of education is associated with an 8.5-percent increase in wages. For the 0/1 variables, the coefficient shows the percent-age increase associated with having the characteristic. For example, women earn 15.7 percent less than men.
Center for Retirement Research4
Figure 4. Impact of Selected Factors on Wages of Full-time Workers, 2006-2010
S-L worker -9.5%
Federal worker 14.6%Hours 1.4%Education 8.5%Experience 1.6%Female -15.7%Married 18.4%Foreign born -6.0%Black -14.0%Hispanic -9.5%
-20% -10% 0% 10% 20% Notes: For “0/1” variables, the bars represent the relationship between the characteristic and wages; for continuous vari-ables, the bars represent the impact of a one-unit change on the wage. All coefficients are significant at the 1-percent level.Source: Authors’ calculations from CPS (2006-2010).
The most important coefficient for our purposes is that associated with being a state-local worker. After controlling for firm size, education, experience, and numerous personal and job characteristics, the results show that state-local workers earned 9.5 percent less in wages than otherwise similar private sector workers.
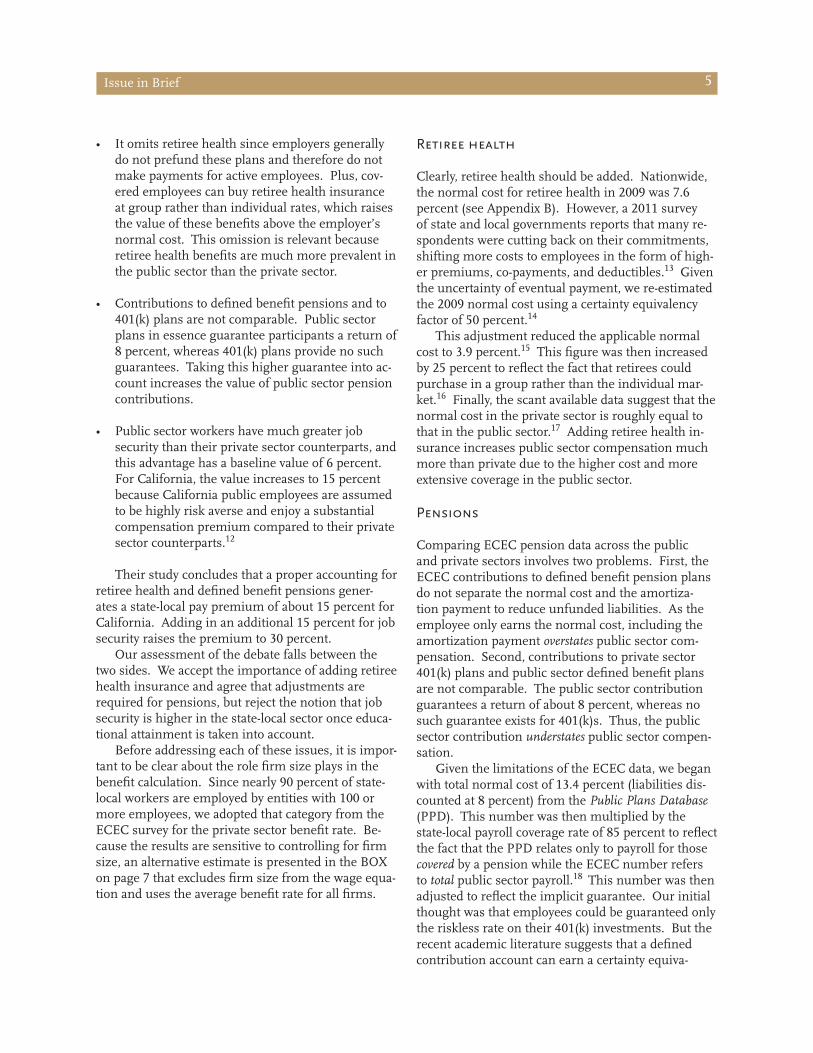
To provide some sense of the heterogeneity of the wage penalty by type of worker, the wage equation was re-estimated by wage tercile. That is, a separate wage equation was estimated for the lowest paid one-third in each state, the middle one-third, and the highest one-third. The results confirm what other studies have found (see Figure 5).8 Public employ-ees in the lowest one-third of the wage distribution are paid more than their private sector counterparts. Those in the middle third are paid about the same. And those state-local workers in the top one-third are paid about 20 percent less than private sector workers.
Despite the variation by wage level, the message from the wage analysis is clear: state-local workers as a group are paid less than their private sector counter-parts. So far, researchers have no real disagreements.
Benefits: State-Local versus Private Sector
The controversy starts on the benefits side. The ques-tion is the extent to which the value of the benefits provided to state-local workers offsets the wage penal-ty. Several researchers who conclude that benefits do
-21.1%
-0.5%
2.0%
-30% -20% -10% 0% 10%
Lowest tercile
Middle tercile
Highest tercile
Figure 5. State-Local Relative to Private Sector Wages, by Wage Tercile, 2006-2010
Source: Authors’ calculations from CPS (2006-2010).
not cancel out the wage penalty base their case on the Bureau of Labor Statistics Employer Costs for Employee Compensation (ECEC) survey.9 This survey shows that while benefits are much higher relative to wages for state-local workers than for those in the private sector, they are not high enough to offset the wage penalty.10 Therefore, they conclude that public sector workers receive less total compensation – wages and benefits combined – than their private sector counterparts.
The response by one set of critics is that the ECEC survey understates state and local employee compen-sation in three ways:11
Issue in Brief 5
• It omits retiree health since employers generally do not prefund these plans and therefore do not make payments for active employees. Plus, cov-ered employees can buy retiree health insurance at group rather than individual rates, which raises the value of these benefits above the employer’s normal cost. This omission is relevant because retiree health benefits are much more prevalent in the public sector than the private sector.
• Contributions to defined benefit pensions and to 401(k) plans are not comparable. Public sector plans in essence guarantee participants a return of 8 percent, whereas 401(k) plans provide no such guarantees. Taking this higher guarantee into ac-count increases the value of public sector pension contributions.
• Public sector workers have much greater job security than their private sector counterparts, and this advantage has a baseline value of 6 percent. For California, the value increases to 15 percent because California public employees are assumed to be highly risk averse and enjoy a substantial compensation premium compared to their private sector counterparts.12
Their study concludes that a proper accounting for retiree health and defined benefit pensions gener-ates a state-local pay premium of about 15 percent for California. Adding in an additional 15 percent for job security raises the premium to 30 percent.
Our assessment of the debate falls between the two sides. We accept the importance of adding retiree health insurance and agree that adjustments are required for pensions, but reject the notion that job security is higher in the state-local sector once educa-tional attainment is taken into account.
Before addressing each of these issues, it is impor-tant to be clear about the role firm size plays in the benefit calculation. Since nearly 90 percent of state-local workers are employed by entities with 100 or more employees, we adopted that category from the ECEC survey for the private sector benefit rate. Be-cause the results are sensitive to controlling for firm size, an alternative estimate is presented in the BOX on page 7 that excludes firm size from the wage equa-tion and uses the average benefit rate for all firms.
Retiree health
Clearly, retiree health should be added. Nationwide, the normal cost for retiree health in 2009 was 7.6 percent (see Appendix B). However, a 2011 survey of state and local governments reports that many re-spondents were cutting back on their commitments, shifting more costs to employees in the form of high-er premiums, co-payments, and deductibles.13 Given the uncertainty of eventual payment, we re-estimated the 2009 normal cost using a certainty equivalency factor of 50 percent.14
This adjustment reduced the applicable normal cost to 3.9 percent.15 This figure was then increased by 25 percent to reflect the fact that retirees could purchase in a group rather than the individual mar-ket.16 Finally, the scant available data suggest that the normal cost in the private sector is roughly equal to that in the public sector.17 Adding retiree health in-surance increases public sector compensation much more than private due to the higher cost and more extensive coverage in the public sector.
Pensions
Comparing ECEC pension data across the public and private sectors involves two problems. First, the ECEC contributions to defined benefit pension plans do not separate the normal cost and the amortiza-tion payment to reduce unfunded liabilities. As the employee only earns the normal cost, including the amortization payment overstates public sector com-pensation. Second, contributions to private sector 401(k) plans and public sector defined benefit plans are not comparable. The public sector contribution guarantees a return of about 8 percent, whereas no such guarantee exists for 401(k)s. Thus, the public sector contribution understates public sector compen-sation.
Given the limitations of the ECEC data, we began with total normal cost of 13.4 percent (liabilities dis-counted at 8 percent) from the Public Plans Database (PPD). This number was then multiplied by the state-local payroll coverage rate of 85 percent to reflect the fact that the PPD relates only to payroll for those covered by a pension while the ECEC number refers to total public sector payroll.18 This number was then adjusted to reflect the implicit guarantee. Our initial thought was that employees could be guaranteed only the riskless rate on their 401(k) investments. But the recent academic literature suggests that a defined contribution account can earn a certainty equiva-
Center for Retirement Research6
lency return of 1.23 percentage points more than the risk-free interest rate by allowing for investment in equities.19 Therefore, we re-calculate the public plan total normal cost using an interest rate of 6.23 percent(5 percent riskless rate + 1.23 percent).20 We then subtract the employee contribution. The amount by which the re-estimated employer normal cost exceeds the ECEC contribution number was added to em-ployee benefits.
Job security
The remaining issue is job security in the public sec-tor. The argument is that job security, like wages and benefits, is a major goal of collective bargaining. To the extent that workers have security, they should be willing to accept less in wages or benefits. During this recession, employment in the state-local sector is down 3.1 percent since its peak, compared to 5.6 percent in the private sector. However, state-local workers should be expected to fare better given that 52 percent have a college degree – a category where employment has continued to grow – compared to only 35 percent in the private sector. In fact, the peak-to-present drops in employment for state-local and private sector workers can be projected almost perfectly based on the educational attainment of the respective sectors (see Table 1). Moreover, public sector employment continues to decline while private sector employment appears to have stabilized. Thus, it is not clear that public sector workers have any greater job security than their private sector counter-parts after accounting for their education level.21
Table 1. Projected Drop in Employment Based on Educational Attainment, by Sector, Peak-to-July 2011
Educational % distribution of workers Change in employment attainment State-local Private
Less than high school 2.3% 8.1 % -18.6 %
High school 19.9 29.3 -8.4
Associate’s degree 25.4 27.8 -4.7
College degree 52.4 34.8 0.4
Addendum:
Projected drop in -3.1 % -5.1 %employment
Actual drop in -3.1 -5.6 employment Sources: Authors’ calculations from CPS (2010) and U.S. Bureau of Labor Statistics (2011).
Putting aside job security, the calculations show that state/local benefits nearly offset the private sec-tor wage premium, but compensation in the public sector is 4 percent less than that in the private sector (see Figure 6). Given all the assumptions required,
the best way to describe the respective compensationlevels is roughly equal.
Figure 6. Total Compensation, as a Percent of Private Sector Wages, by Sector, 2010
0%
40%
80%
120%
160%
Private sector State and local sector
142.3%148.1%
147.0%
100.0%90.5%
138.2%
Wages ECEC benefits Pension adjustment Retiree health
Sources: Authors’ calculations from U.S. Bureau of Labor Statistics (2010); CPS (2006-2010); and PPD (2009).
Issue in Brief 7
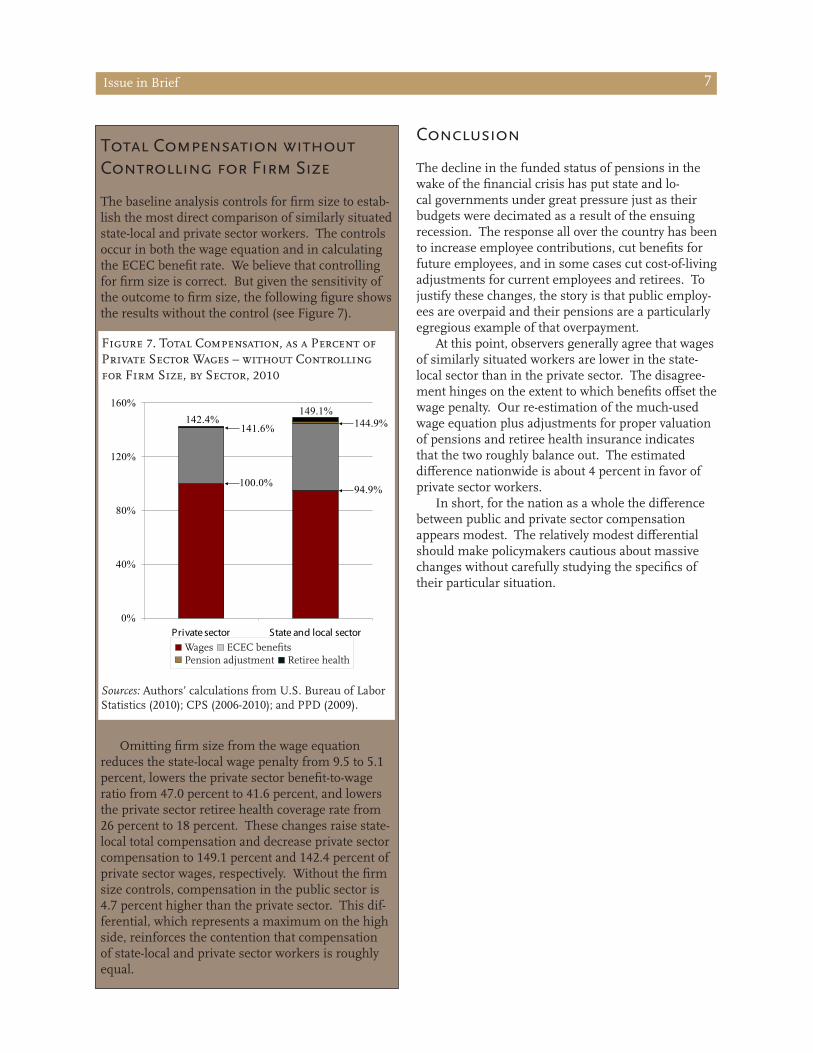
Total Compensation without Controlling for Firm Size
The baseline analysis controls for firm size to estab-lish the most direct comparison of similarly situated state-local and private sector workers. The controls occur in both the wage equation and in calculating the ECEC benefit rate. We believe that controlling for firm size is correct. But given the sensitivity of the outcome to firm size, the following figure shows the results without the control (see Figure 7).
Figure 7. Total Compensation, as a Percent of Private Sector Wages – without Controlling for Firm Size, by Sector, 2010
0%
40%
80%
120%
160%
Private sector State and local sector
149.1%142.4%
100.0%
141.6% 144.9%
94.9%
Wages ECEC benefits Pension adjustment Retiree health
Sources: Authors’ calculations from U.S. Bureau of Labor Statistics (2010); CPS (2006-2010); and PPD (2009).
Omitting firm size from the wage equation reduces the state-local wage penalty from 9.5 to 5.1 percent, lowers the private sector benefit-to-wage ratio from 47.0 percent to 41.6 percent, and lowers the private sector retiree health coverage rate from 26 percent to 18 percent. These changes raise state-local total compensation and decrease private sector compensation to 149.1 percent and 142.4 percent of private sector wages, respectively. Without the firm size controls, compensation in the public sector is 4.7 percent higher than the private sector. This dif-ferential, which represents a maximum on the high side, reinforces the contention that compensation of state-local and private sector workers is roughly equal.
Conclusion
The decline in the funded status of pensions in the wake of the financial crisis has put state and lo-cal governments under great pressure just as their budgets were decimated as a result of the ensuing recession. The response all over the country has been to increase employee contributions, cut benefits for future employees, and in some cases cut cost-of-living adjustments for current employees and retirees. To justify these changes, the story is that public employ-ees are overpaid and their pensions are a particularly egregious example of that overpayment.
At this point, observers generally agree that wages of similarly situated workers are lower in the state-local sector than in the private sector. The disagree-ment hinges on the extent to which benefits offset the wage penalty. Our re-estimation of the much-used wage equation plus adjustments for proper valuation of pensions and retiree health insurance indicates that the two roughly balance out. The estimated difference nationwide is about 4 percent in favor of private sector workers.
In short, for the nation as a whole the difference between public and private sector compensation appears modest. The relatively modest differential should make policymakers cautious about massive changes without carefully studying the specifics of their particular situation.

APPENDICES

Center for Retirement Research9
Appendix A. Wage Regression in the Current Population Survey
The baseline wage regression uses 2006-2010 data from the Annual March Supplement of the Current Popula-tion Survey. The results are shown at the end of this Appendix. The dependent variable is the log of annual earnings. Those with imputed earnings are dropped from the sample. The sample is at the individual level and imposes the following restrictions:• Age 16 to 64;• Works for a wage or salary and receives at least $9,000;• With at least one year of work experience;• Full-time, working 52 weeks per year;• Not a member of the armed forces or the postal service; and • Currently living in the United States.
Table A1. Summary Statistics for Regression on Annual Wages, 2006-2010
Mean Standard deviation
Minimum Maximum
Annual wage 51,132 49,037 9,000 706,117
S-L worker 0.1454 0.3525 0 1
Federal worker 0.0301 0.1708 0 1
Hours 43.0910 7.2222 35 99
Education 13.7780 2.7770 0 21
Experience 21.6670 11.1250 1 58
Female 0.4468 0.4972 0 1
Married 0.6430 0.4791 0 1
Foreign born 0.1775 0.3821 0 1
Black 0.1083 0.3108 0 1
Hispanic 0.1600 0.3666 0 1 Note: Additional controls not depicted include occupation, firm size, year, and region dummies. Some respondents report less than 10 years of education. They comprise only a small portion of the total sample, and removing them does not alter the results.Source: Authors’ calculations from CPS (2006-2010).
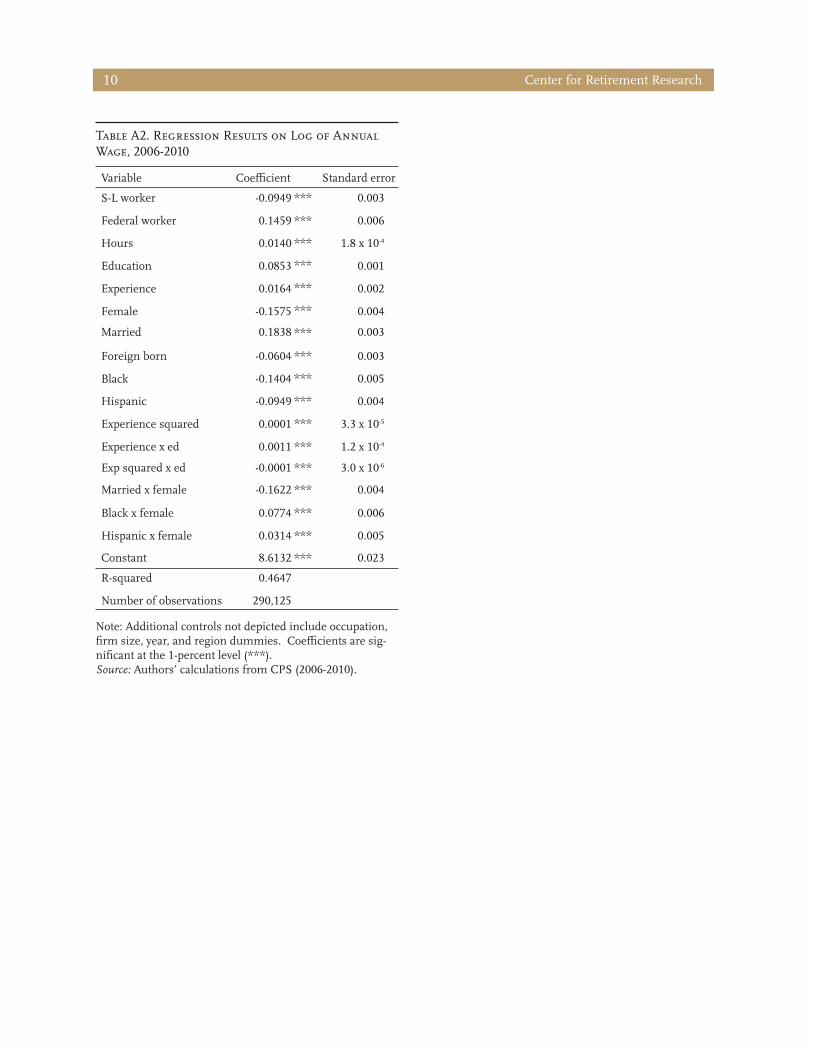
Table A2. Regression Results on Log of Annual Wage, 2006-2010
Variable Coefficient Standard error
S-L worker
Federal worker
Hours
Education
Experience
Female
Married
Foreign born
Black
Hispanic
Experience squared
Experience x ed
Exp squared x ed
Married x female
Black x female
Hispanic x female
Constant
-0.0949
0.1459
0.0140
0.0853
0.0164
-0.1575
0.1838
-0.0604
-0.1404
-0.0949
0.0001
0.0011
-0.0001
-0.1622
0.0774
0.0314
8.6132
***
***
***
***
***
***
***
***
***
***
***
***
***
***
***
***
***
0.003
0.006
1.8 x 10⁻⁴
0.001
0.002
0.004
0.003
0.003
0.005
0.004
3.3 x 10⁻⁵
1.2 x 10⁻⁴
3.0 x 10⁻⁶
0.004
0.006
0.005
0.023
R-squared
Number of observations
0.4647
290,125
Center for Retirement Research10
Note: Additional controls not depicted include occupation, firm size, year, and region dummies. Coefficients are sig-nificant at the 1-percent level (***).Source: Authors’ calculations from CPS (2006-2010).
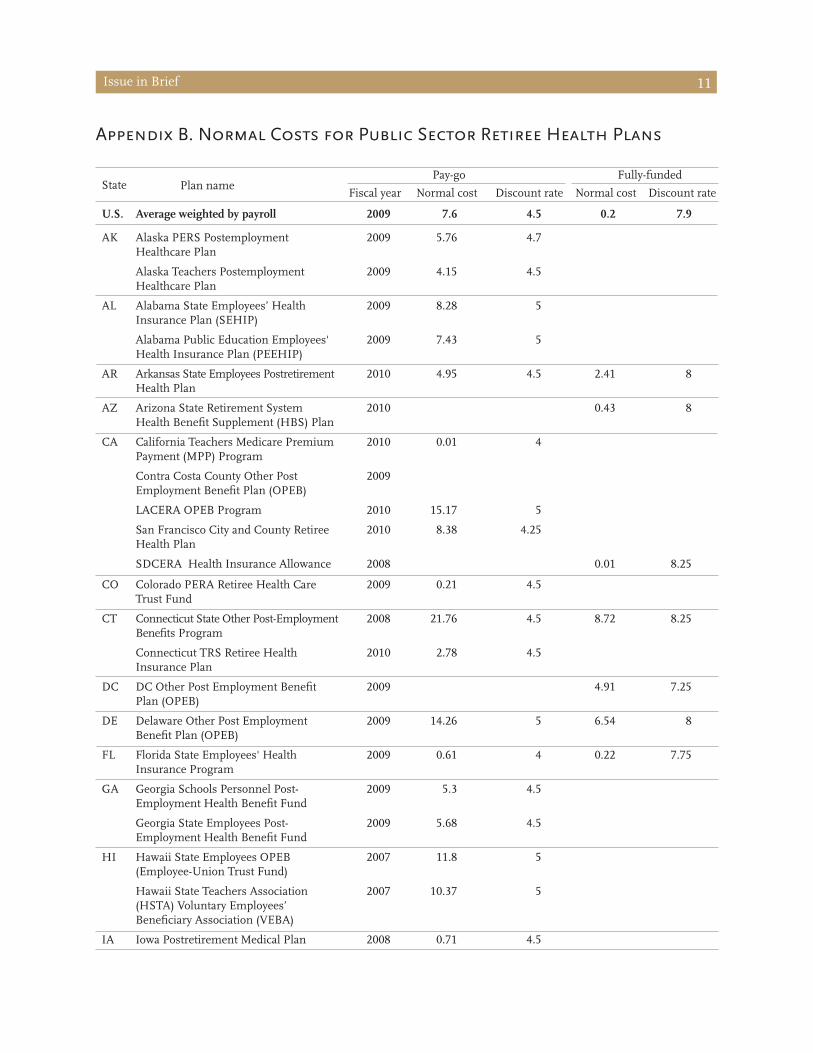
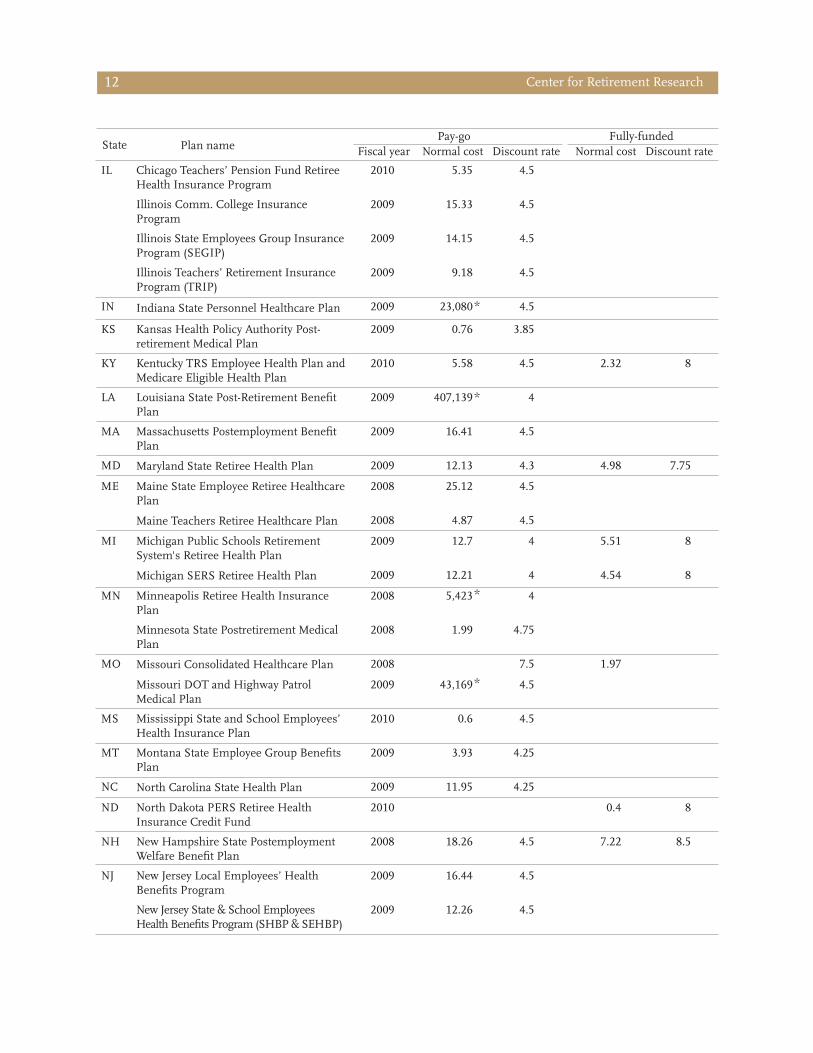
Appendix B. Normal Costs for Public Sector Retiree Health Plans
Pay-go Fully-funded State Plan name Fiscal year Normal cost Discount rate Normal cost Discount rate U.S. Average weighted by payroll 2009 7.6 4.5 0.2 7.9
AK Alaska PERS Postemployment 2009 5.76 4.7Healthcare Plan
Alaska Teachers Postemployment 2009 4.15 4.5Healthcare Plan
AL Alabama State Employees’ Health 2009 8.28 5Insurance Plan (SEHIP)
Alabama Public Education Employees' 2009 7.43 5Health Insurance Plan (PEEHIP)
AR Arkansas State Employees Postretirement 2010 4.95 4.5 2.41 8Health Plan
AZ Arizona State Retirement System 2010 0.43 8Health Benefit Supplement (HBS) Plan
CA California Teachers Medicare Premium 2010 0.01 4Payment (MPP) Program
Contra Costa County Other Post 2009Employment Benefit Plan (OPEB)
LACERA OPEB Program 2010 15.17 5
San Francisco City and County Retiree 2010 8.38 4.25Health Plan
SDCERA Health Insurance Allowance 2008 0.01 8.25
CO Colorado PERA Retiree Health Care 2009 0.21 4.5Trust Fund
CT Connecticut State Other Post-Employment 2008 21.76 4.5 8.72 8.25Benefits Program
Connecticut TRS Retiree Health 2010 2.78 4.5Insurance Plan
DC DC Other Post Employment Benefit 2009 4.91 7.25Plan (OPEB)
DE Delaware Other Post Employment 2009 14.26 5 6.54 8Benefit Plan (OPEB)
FL Florida State Employees' Health 2009 0.61 4 0.22 7.75Insurance Program
GA Georgia Schools Personnel Post- 2009 5.3 4.5Employment Health Benefit Fund
Georgia State Employees Post- 2009 5.68 4.5Employment Health Benefit Fund
HI Hawaii State Employees OPEB 2007 11.8 5(Employee-Union Trust Fund)
Hawaii State Teachers Association 2007 10.37 5(HSTA) Voluntary Employees’ Beneficiary Association (VEBA)
IA Iowa Postretirement Medical Plan 2008 0.71 4.5
Issue in Brief 11
State Plan name
Pay-go Fully-fundedNormal cost Discount rateFiscal year Normal cost Discount rate
IL Chicago Teachers’ Pension Fund Retiree Health Insurance Program
2010 5.35 4.5
Illinois Comm. College Insurance Program
2009 15.33 4.5
Illinois State Employees Group Insurance Program (SEGIP)
2009 14.15 4.5
Illinois Teachers’ Retirement Insurance Program (TRIP)
2009 9.18 4.5
IN Indiana State Personnel Healthcare Plan 2009 23,080* 4.5
KS Kansas Health Policy Authority Post-retirement Medical Plan
2009 0.76 3.85
KY Kentucky TRS Employee Health Plan and Medicare Eligible Health Plan
2010 5.58 4.5 2.32 8
LA Louisiana State Post-Retirement Benefit Plan
2009 407,139* 4
MA Massachusetts Postemployment Benefit Plan
2009 16.41 4.5
MD Maryland State Retiree Health Plan 2009 12.13 4.3 4.98 7.75
ME Maine State Employee Retiree Healthcare Plan
2008 25.12 4.5
Maine Teachers Retiree Healthcare Plan 2008 4.87 4.5
MI Michigan Public Schools Retirement System's Retiree Health Plan
2009 12.7 4 5.51 8
Michigan SERS Retiree Health Plan 2009 12.21 4 4.54 8
MN Minneapolis Retiree Health Insurance Plan
2008 5,423* 4
Minnesota State Postretirement Medical Plan
2008 1.99 4.75
MO Missouri Consolidated Healthcare Plan 2008 7.5 1.97
Missouri DOT and Highway Patrol Medical Plan
2009 43,169* 4.5
MS Mississippi State and School Employees’ Health Insurance Plan
2010 0.6 4.5
MT Montana State Employee Group Benefits Plan
2009 3.93 4.25
NC North Carolina State Health Plan 2009 11.95 4.25
ND North Dakota PERS Retiree Health Insurance Credit Fund
2010 0.4 8
NH New Hampshire State Postemployment Welfare Benefit Plan
2008 18.26 4.5 7.22 8.5
NJ New Jersey Local Employees’ Health Benefits Program
2009 16.44 4.5
New Jersey State & School Employees Health Benefits Program (SHBP & SEHBP)
2009 12.26 4.5
Center for Retirement Research12

Issue in Brief 13
State
Plan namePay-go Fully-funded
Fiscal year Normal cost Discount rate Normal cost Discount rate
NM New Mexico Retiree Health Care Authority OPEB Program
2010 4.59 5
NV Nevada Public Employees’ Benefits Program’s Retiree Health Insurance Plan
2009 7.31 4
NY New York City Health Benefits Program
New York State Health Insurance Program (NYSHIP)
2008
2009
14.26
1,013,836*
4
4.24
OH Ohio PERS Retiree Health Care Plan 2009
Ohio Police & Fire RS Retiree Health Care Plan
2009
Ohio SERS Retiree Health Care Plan 2010 3.09 5.25
Ohio TRS Retiree Health Care Plan 2008 3.57 4.9
OK Oklahoma State and Education Employees Group Insurance Board
2007 1.95 3.5 1.02 7.5
OR Oregon Retiree Health Insurance Account (RHIA) and Health Insurance Premium Account (RHIPA)
2009 0.08 8
PA Pennsylvania Retired Employee Health Program (REHP)
2009 6.56 5
Pennsylvania Retired State Police Program (RPSPP)
2009 17.96 5
RI Rhode Island State Employees’ and Electing Teachers OPEB
2009 4.07 3.57 1.84 7
SC South Carolina State Employee Insurance Program (EIP)
2009 4.93 5.5
SD South Dakota Postemployment Benefit Plan
2008 0.67 3
TN TN Local Education Employee Group Plan
2009 1.81 4.5
TN Local Gov. Group Plan 2009 0.38 4.5
TN State Employee Group Plan 2009 4.1 4.5
TX City of Austin OPEB plan 2008 12.96 4.21
Houston Postretirement Medical & Life Plan
2009 10.16 4.5
Texas Employees Group Benefits Program (GBP)
2010 10.02 5.5
Texas TRS-Care 2010 3.59 5.25 2 8
UT Utah Postretirement Medical & Life Plan 2008
VA Fairfax County Government Post- Employment Benefit Plans
2009 1.55 7.5
Virginia State Health Insurance Credit Program
2009 0.31 7.5
Virginia Teachers Health Insurance Credit Program
2009 0.23 7.5
Center for Retirement Research14
State
VT
Plan name
Vermont SERS Postretirement Benefit Plan
Fiscal year
2010
Pay-go
Normal cost
10.11
Discount rate
4
Fully-fu
Normal cost
4.17
nded
Discount rate
8.25
WA
Vermont TRS Postretirement Benefit Plan
Washington K-12 School Districts OPEB Program
2010
2008
3.77
3.71
4
4.5
1.44 8.25
Washington LEOFF Plan 1 OPEB Plan 2007 10.01 4.5 6.59 7.5
Washington Pol. Sub. OPEB Program 2008 4.05 4.5
WI
WV
WY
Washington State OPEB Program
Wisconsin State Postretirement Medical Plan
West Virginia Public Employees Insurance Agency OPEB Benefits
Wyoming State Employee Group Insurance Retiree Benefit Plan
2008
2008
2009
2009
3.68
2.71
13.73
1.28
4.5
4
3.56
5
1.81
4.57
7.5
7
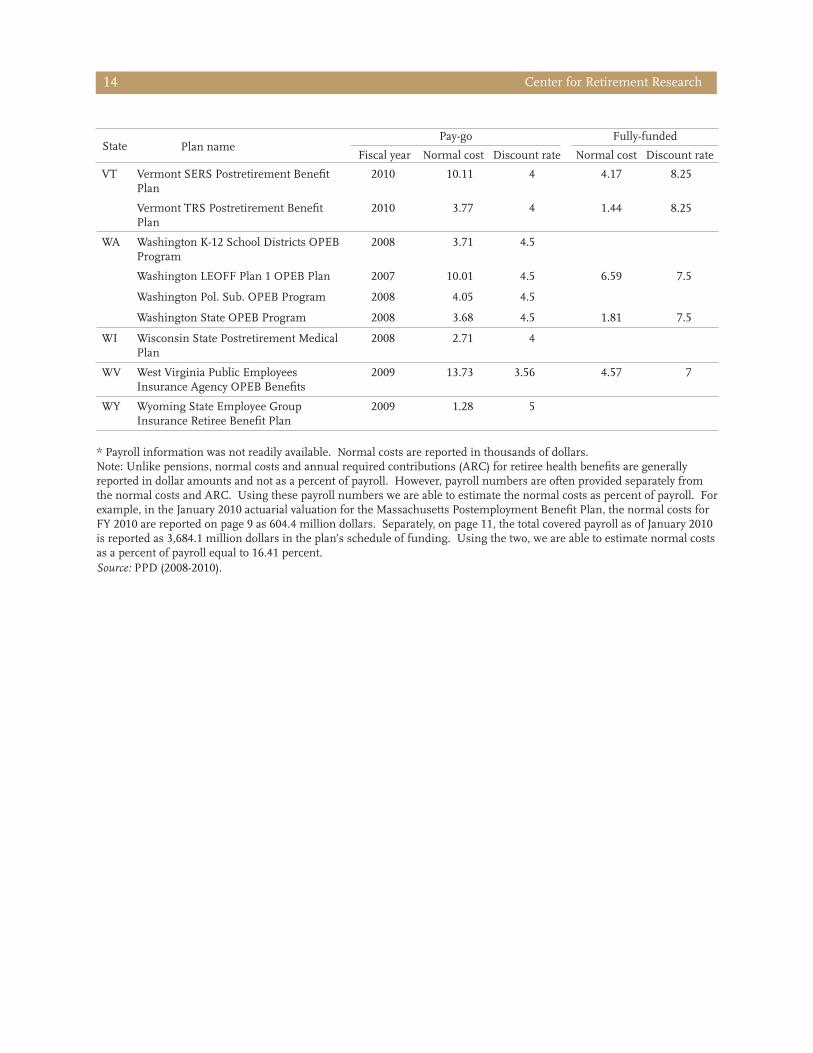
* Payroll information was not readily available. Normal costs are reported in thousands of dollars.Note: Unlike pensions, normal costs and annual required contributions (ARC) for retiree health benefits are generally reported in dollar amounts and not as a percent of payroll. However, payroll numbers are often provided separately from the normal costs and ARC. Using these payroll numbers we are able to estimate the normal costs as percent of payroll. For example, in the January 2010 actuarial valuation for the Massachusetts Postemployment Benefit Plan, the normal costs for FY 2010 are reported on page 9 as 604.4 million dollars. Separately, on page 11, the total covered payroll as of January 2010 is reported as 3,684.1 million dollars in the plan’s schedule of funding. Using the two, we are able to estimate normal costs as a percent of payroll equal to 16.41 percent. Source: PPD (2008-2010).

Issue in Brief 15
Endnotes 1 Agency for Healthcare Research and Quality, Medi-cal Expenditure Panel Survey (2009b).
2 See Allegretto and Keefe (2010); Belman and Hey-wood (2004); Bender and Heywood (2010); Richwine and Biggs (2011); Borjas (2002); Braconi (2011); Keefe (2010); Keefe (2011); Schmitt (2010); and Thompson and Schmitt (2010).
3 See Appendix for a full description of the sample. The 52-week restriction could potentially cut state and local teachers who have summers off. Removing this restriction and controlling for weeks worked does not significantly alter the results.
4 Nearly 90 percent of state and local workers are em-ployed by entities with 100 or more employees, based on calculations from the CPS.
5 Hypotheses for the large-firm premium include greater unionization, economies of scale in non-labor costs, firm age (larger firms tend to be older, and a correlation exists between employee compensation and firm age), and compensating differentials for bureaucratic work environments. See Brown and Medoff (1989).
6 The results presented show a wage penalty of 9.5 percent. Omitting firm size from the equation re-duces the penalty to 5.1 percent.
7 Including union status in the equation increases the wage penalty from 9.5 percent to 9.7 percent.
8 See Borjas (2002); Fogel and Lewin (1974); Katz and Krueger (1991); Poterba and Reuben (1994); and Schmitt (2010).
9 Allegretto and Keefe (2010).
10 Benefits include paid leave, such as vacation, holiday or sick pay; supplemental bonus pay, such as bonuses and overtime; insurance, such as life and health coverage; retirement and savings, which include employer contributions to defined benefit and defined contribution plans; and legally required benefits, such as Social Security and Medicare. 11 Richwine and Biggs (2011).
12 See Biggs (2011 a and b) for a more detailed dis-cussion of the value of public sector job security.
13 Center for State and Local Government Excellence (2011).
14 The normal cost accounts for the probability that employees meet the vesting requirement for the retiree health plan. The 50-percent certainty equiva-lency factor represents the probability that retiree health benefits and the share of premiums paid by the employer will remain unreduced through retirement. See Mas-Colell, Whinston, and Green (1995) for the theory behind the certainty equivalency, and Center for State and Local Government Excellence (2011) for statistics on recent changes made to retiree health plans.
15 We typically assume a risk-free rate of 5 percent – 2 percent real return and 3 percent inflation – which is 50 basis points higher than the rate used in the valuations of most of the retiree health plans in our sample. However, in this case we did not attempt to rediscount the liabilities due to the complexity of the calculations for a minimal expected gain in precision. 16 Buntin et al. (2003).
17 In 2006, monthly premiums for private sector retiree health coverage were $552 for retirees under age 65, and $270 for those aged 65 and over (McArdle et al., 2006). A survey of the 10 largest state-adminis-tered retiree health plans found that the public sector premiums were, in 2009, $655 and $220, respectively. Based on the similarity in premium levels, we assume that retiree health costs for the two sectors are about equal. 18 Authors’ calculations from CPS (2010). 19 Gollier (2008) and conversation with Peter Dia-mond. The Gollier model assumes a portfolio that is rebalanced annually over a 40-year investment period to maintain a constant equity allocation of 40.4 percent. The risk-free rate is assumed to remain constant over time and future stock returns are com-pletely independent.
Center for Retirement Research16
20 See Munnell, Aubry, and Quinby (2011) for a description of this calculation. 21 In fact, the difference in cost for supplemental unemployment insurance suggests that the premium for job security in the public sector amounts to only 2.4 percent of private sector wages. See Biggs (2011a). However, other data do show that, controlling for age and experience, the likelihood of unemployment in the public sector is consistently lower than that of the private sector. Regardless, any analysis including job security would also need to incorporate all other non-monetary aspects of the work environment.
References
Agency for Healthcare Research and Quality. 2009a. Medical Expenditure Panel Survey. “Summary Table 1.A.2.e(2009).” Washington, DC: U.S. Depart-ment of Health and Human Services. Available at: http://www.meps.ahrq.gov/mepsweb/data_stats/summ_tables/insr/national/series_1/2009/tia2e.pdf.
Agency for Healthcare Research and Quality. 2009b. Medical Expenditure Panel Survey. “Table III.B.2.b (2009).” Washington, DC: U.S. Department of Health and Human Services. Available at: http://www.meps.ahrq.gov/mepsweb/data_stats/summ_tables/insr/national/series_3/2009/ic09_iiia_g.pdf.
Allegretto, Sylvia A. and Jeffrey Keefe. 2010. “The Truth About Public Employees in California: They are Neither Overpaid nor Overcompensated.” Berkeley, CA: Center on Wage and Employment Dynamics at the University of California, Berkeley.
Belman, Dale and John S. Heywood. 2004. “Public-Sector Wage Comparability: The Role of Earnings Dispersion.” Public Finance Review 32: 567-587.
Bender, Keith A. and John S. Heywood. 2010. “Com-paring Private and Public Sector Compensation Over 20 Years.” Washington, DC: Center for State and Local Government Excellence and National Institute on Retirement Security.
Biggs, Andrew. 2011a. “The Value of Public Sector Job Security.” The American Enterprise Institute. Available at: http://blog.american.com/2011/07/the-value-of-public-sector-job-security/.
Biggs, Andrew. 2011b. “Lining Up for Government Jobs.” The American Enterprise Institute. Avail-able at: http://blog.american.com/2011/02/lining-up-for-government-jobs/.
Borjas, George J. 2002. “The Wage Structure and the Sorting of Workers into the Public Sector.” Work-ing Paper No. 9313. Cambridge, MA: National Bureau of Economic Research.
Braconi, Frank. 2011. “Municipal Employee Compen-sation in New York City.” New York, NY: Office of New York City Comptroller John. C. Liu.
Issue in Brief 17
Brown, Charles and James L. Medoff. 1989. “The Employer Size-Wage Effect.” Journal of Political Economy 97: 1027-1059.
Buntin, Melinda Beeuwkes, José S. Escarce, Kanika Kapur, Jill M. Yegian, and M. Susan Marquis. 2003. “Trends and Variability in Individual Insur-ance Products.” Health Affairs Web Exclusive. Available at: http://content.healthaffairs.org/con-tent/early/2003/09/24/hlthaff.w3.449.full.pdf
Center for State and Local Government Excellence. State and Local Government Workforce: 2011 Reali-ties. Washington, DC.
Fogel, Walter and Lewin, David. 1974. “Wage De-termination in the Public Sector.” Industrial and Labor Relations Review 27(3): 410.
Fronstin, Paul. 2005. ‘The Impact of the Erosion of Retiree Health Benefits on Workers and Retirees,’ EBRI Issue Brief No. 279, Washington, DC: EBRI.
Gollier, Christian. 2008. “Intergenerational Risk-Shar-ing and Risk-Taking of a Pension Fund.” Journal of Public Economics (92): 1463-1485.
Katz, Lawrence F. and Alan B. Krueger. 1991. “Chang-es in the Structure of Wages in the Public and Private Sectors.” Working Paper No. 3667: NBER Cambridge, MA.
Keefe, Jeffrey. 2010. “Debunking the Myth of the Overcompensated Public Employee: The Evi-dence.” Washington, DC: Economic Policy Insti-tute.
Keefe, Jeffrey. 2011. “Are Wisconsin Public Employees Over-Compensated?” Washington, DC: Economic Policy Institute.
Mas-Colell, Andreu, Michael D. Whinston, and Jerry Green. 1995. Microeconomic Theory. Oxford: Ox-ford University Press.
McArdle, Frank, Amy Atchison, Dale Yamamoto, Mi-chelle Kitchman Strollo, and Tricia Neuman. 2006. “Retiree Health Benefits Examined: Findings from the Kaiser/Hewitt 2006 Survey on Retiree Health Benefits.” The Kaiser Family Foundation and Hewitt. Available at: http://www.kff.org/medicare/upload/7587.pdf.
Munnell, Alicia H., Jean-Pierre Aubry, and Laura Quinby. 2011. “Public Pension Funding in Prac-tice.” Journal of Pension Economics and Finance 10(2): 247-268.
National Conference of State Legislatures. 2011. “State Employee Health Benefits.” Washington, DC. Available at: http://www.ncsl.org/portals/1/documents/health/IndivPrem09.pdf.
Poterba, James M. and Kim S. Reuben. 1994. “The Distribution of Public Sector Wage Premia: New Evidence Using Quantile Regression Methods.” Working Paper No. 4734. Cambridge, MA: Na-tional Bureau of Economic Research.
Public Plans Database. 2009. Center for Retirement Research at Boston College and Center for State and Local Government Excellence.
Richwine, Jason and Andrew Biggs. 2011. “Are Cali-fornia Public Employees Overpaid?” Washington, DC: Heritage Foundation Working Paper.
Schmitt, John. 2010. “The Wage Penalty for State and Local Government Employees.” Washington, DC: Center for Economic and Policy Research.
Thompson, Jeffrey and John Schmitt. 2010. “The Wage Penalty for State and Local Government Employees in New England.” Center for Economic and Policy Research and the Political Economy Research Institute at the University of Massachu-setts, Amherst.
Towers Watson. 2009. “Employer Commitment to Retirement Plans in the United States.” Avail-able at: http://www.towerswatson.com/assets/pdf/649/Employer%20Commitment%20to%20Retire¬ment%20Plans%20in%20the%20Unit-ed%20States%281%29.pdf.
U.S. Bureau of Labor Statistics. 2011. Employer Costs for Employee Compensation – March 2011. Wash-ington, DC: U.S. Government Printing Office. Available at: http://www.bls.gov/news.release/ecec.toc.htm.
U.S. Bureau of Labor Statistics. 2007-2011. Employ-ment Statistics. Available at: http://www.bls.gov/data/#employment.
Center for Retirement Research18
U.S. Census Bureau. Statistics of U.S. Businesses. “Table 2a. Employment Size of Employer and Nonemployer Firms, 2008.” Washington DC: Available at: http://www.census.gov/econ/small-bus.html#EmpSize.
U.S. Department of Labor. Current Population Survey, 1990-2010. Washington, DC.
Vanguard. 2010. “How America Saves 2010: A Report on Vanguard 2009 Defined Contribution Plan Data.” Valley Forge, PA.

About the CenterThe Center for Retirement Research at Boston Col-lege was established in 1998 through a grant from the Social Security Administration. The Center’s mission is to produce first-class research and educational tools and forge a strong link between the academic com-munity and decision-makers in the public and private sectors around an issue of critical importance to the nation’s future. To achieve this mission, the Center sponsors a wide variety of research projects, transmits new findings to a broad audience, trains new schol-ars, and broadens access to valuable data sources. Since its inception, the Center has established a repu-tation as an authoritative source of information on all major aspects of the retirement income debate.
Affiliated InstitutionsAmerican Enterprise InstituteThe Brookings InstitutionMassachusetts Institute of TechnologySyracuse UniversityUrban Institute
Contact InformationCenter for Retirement ResearchBoston CollegeHovey House140 Commonwealth AvenueChestnut Hill, MA 02467-3808Phone: (617) 552-1762Fax: (617) 552-0191E-mail: [email protected]: http://crr.bc.edu
© 2011, by Trustees of Boston College, Center for Retirement Research. All rights reserved. Short sections of text, not to exceed two paragraphs, may be quoted without explicit permission provided that the authors are identified and full credit, including copyright notice, is given to Trustees of Boston College, Center for Retirement Research.
The CRR gratefully acknowledges the Center for State and Local Government Excellence (SLGE) for its support of this research. The SLGE (http://www.slge.org) is a proud partner in seeking retirement security for public sector employees, part of its mission to attract and retain talented individuals to public service. The opinions and conclusions expressed in this brief are solely those of the authors and do not repre-sent the opinions or policy of the CRR or the SLGE.
pubplans.bc.edu
Visit our:
Issue in Brief 19


![Retroflex versus bunched [r] in compensation for ...linguistics.berkeley.edu/phonlab/documents/2011/retrobunch_paper.pdf · Retroflex versus bunched [r] in compensation for coarticulation](https://img.pdfslide.us/doc/110x75/5b09bbee7f8b9a992a8e2cb3/retroflex-versus-bunched-r-in-compensation-for-versus-bunched-r-in-compensation.jpg)