Embed Size (px)
Citation preview
Comparing Combustion Comparing Combustion Energies of Petroleum Energies of Petroleum
Diesel and Biodiesel FuelsDiesel and Biodiesel FuelsBy Bomb CalorimetryBy Bomb Calorimetry
Penn State University, Department of Chemistry, CHEM 457, Section 1, Fall 2013By: Tim Haggerty, Arjun Plakkat, Kelly Helfrich, Kristen Woznick

MotiMotivationvation
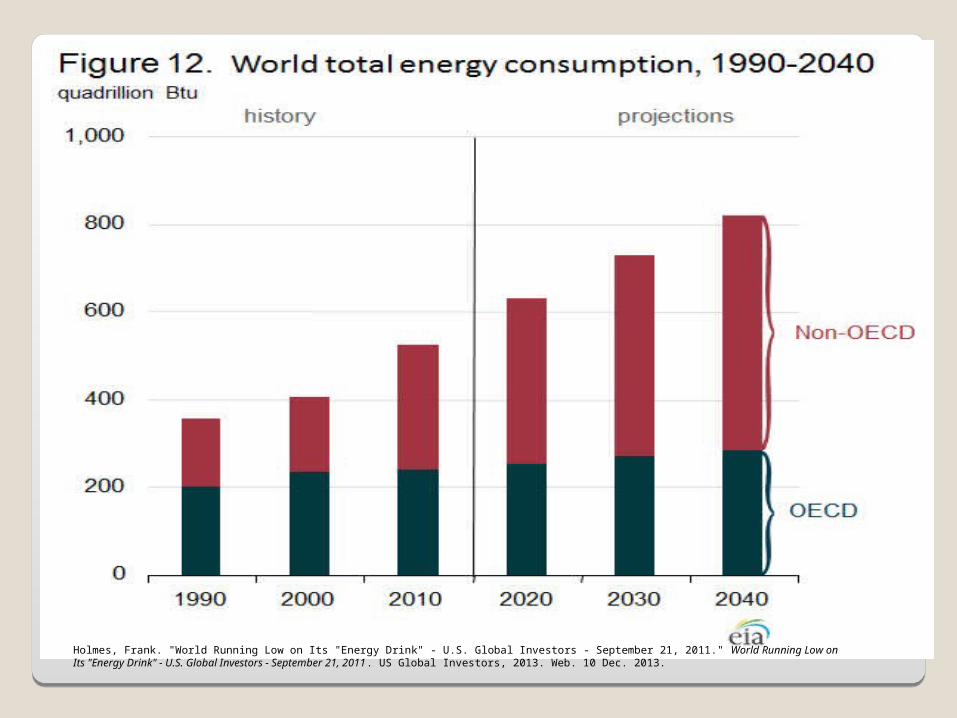
Holmes, Frank. "World Running Low on Its "Energy Drink" - U.S. Global Investors - September 21, 2011." World Running Low on Its "Energy Drink" - U.S. Global Investors - September 21, 2011. US Global Investors, 2013. Web. 10 Dec. 2013.
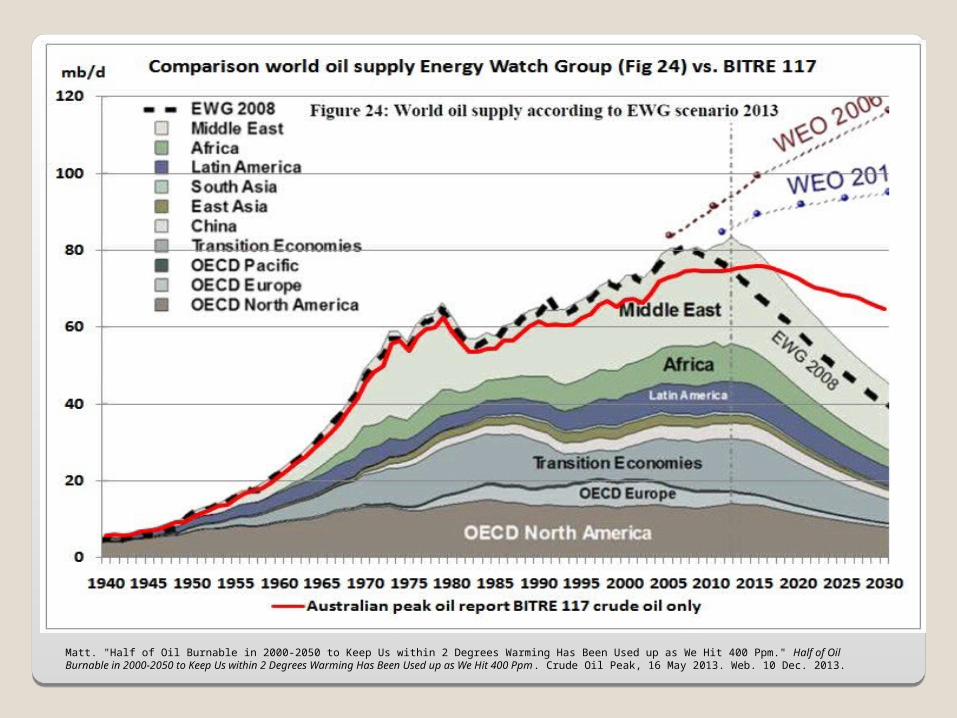
Matt. "Half of Oil Burnable in 2000-2050 to Keep Us within 2 Degrees Warming Has Been Used up as We Hit 400 Ppm." Half of Oil Burnable in 2000-2050 to Keep Us within 2 Degrees Warming Has Been Used up as We Hit 400 Ppm. Crude Oil Peak, 16 May 2013. Web. 10 Dec. 2013.
IntroductionIntroduction
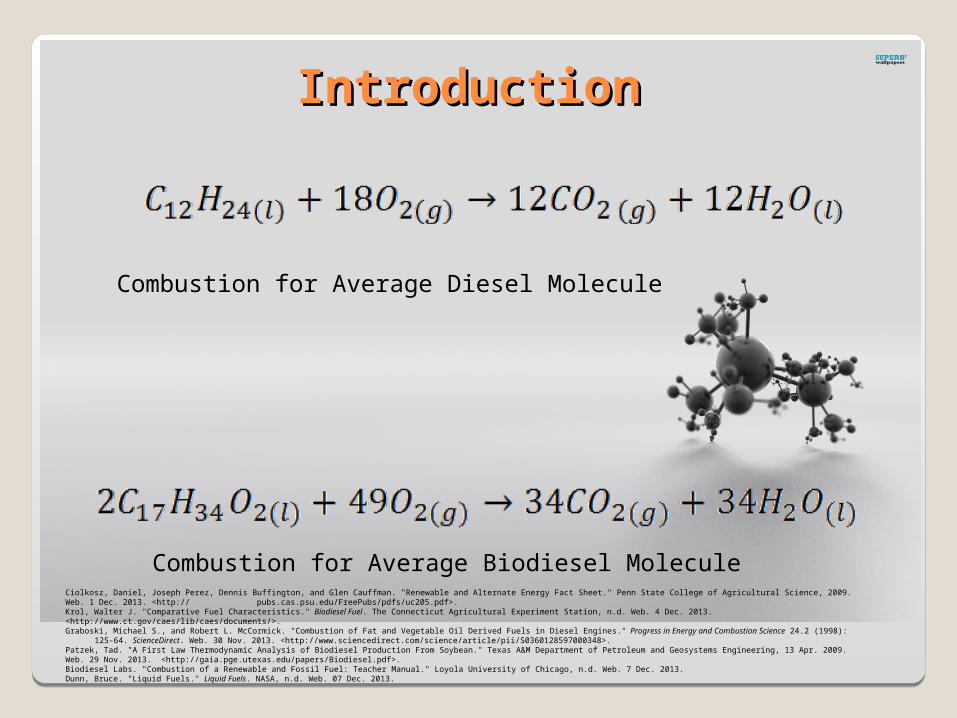
Combustion for Average Diesel Molecule
Combustion for Average Biodiesel MoleculeCiolkosz, Daniel, Joseph Perez, Dennis Buffington, and Glen Cauffman. "Renewable and Alternate Energy Fact Sheet." Penn State College of Agricultural Science, 2009. Web. 1 Dec. 2013. <http://
pubs.cas.psu.edu/FreePubs/pdfs/uc205.pdf>.Krol, Walter J. "Comparative Fuel Characteristics." Biodiesel Fuel. The Connecticut Agricultural Experiment Station, n.d. Web. 4 Dec. 2013. <http://www.ct.gov/caes/lib/caes/documents/>.Graboski, Michael S., and Robert L. McCormick. "Combustion of Fat and Vegetable Oil Derived Fuels in Diesel Engines." Progress in Energy and Combustion Science 24.2 (1998): 125-64. ScienceDirect. Web. 30 Nov. 2013. <http://www.sciencedirect.com/science/article/pii/S0360128597000348>.Patzek, Tad. "A First Law Thermodynamic Analysis of Biodiesel Production From Soybean." Texas A&M Department of Petroleum and Geosystems Engineering, 13 Apr. 2009. Web. 29 Nov. 2013.
<http://gaia.pge.utexas.edu/papers/Biodiesel.pdf>.Biodiesel Labs. "Combustion of a Renewable and Fossil Fuel: Teacher Manual." Loyola University of Chicago, n.d. Web. 7 Dec. 2013.Dunn, Bruce. "Liquid Fuels." Liquid Fuels. NASA, n.d. Web. 07 Dec. 2013.
Parr Bomb Parr Bomb CalorimetryCalorimetry
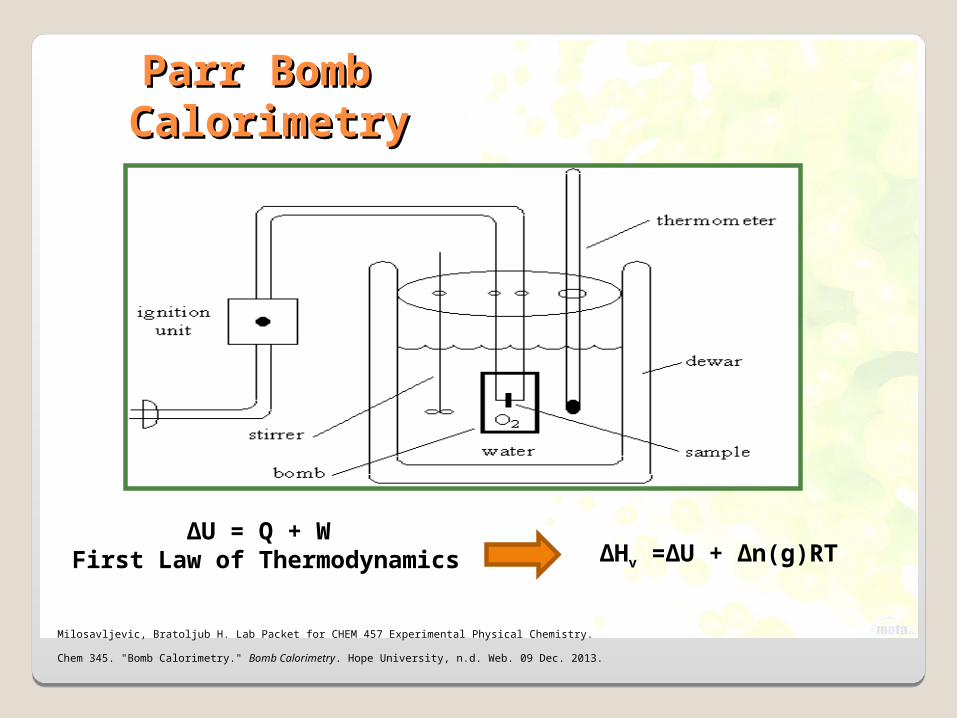
∆U = Q + W First Law of Thermodynamics ∆Hv =∆U + ∆n(g)RT
Chem 345. "Bomb Calorimetry." Bomb Calorimetry. Hope University, n.d. Web. 09 Dec. 2013.
Milosavljevic, Bratoljub H. Lab Packet for CHEM 457 Experimental Physical Chemistry.
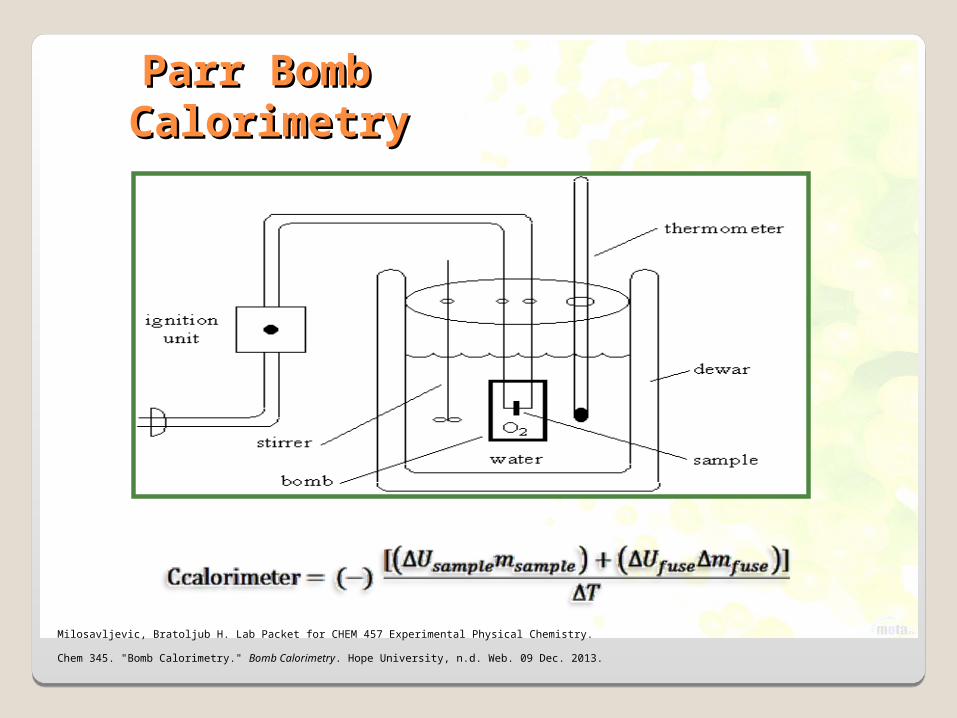
Parr Bomb Parr Bomb CalorimetryCalorimetry
Chem 345. "Bomb Calorimetry." Bomb Calorimetry. Hope University, n.d. Web. 09 Dec. 2013.
Milosavljevic, Bratoljub H. Lab Packet for CHEM 457 Experimental Physical Chemistry.
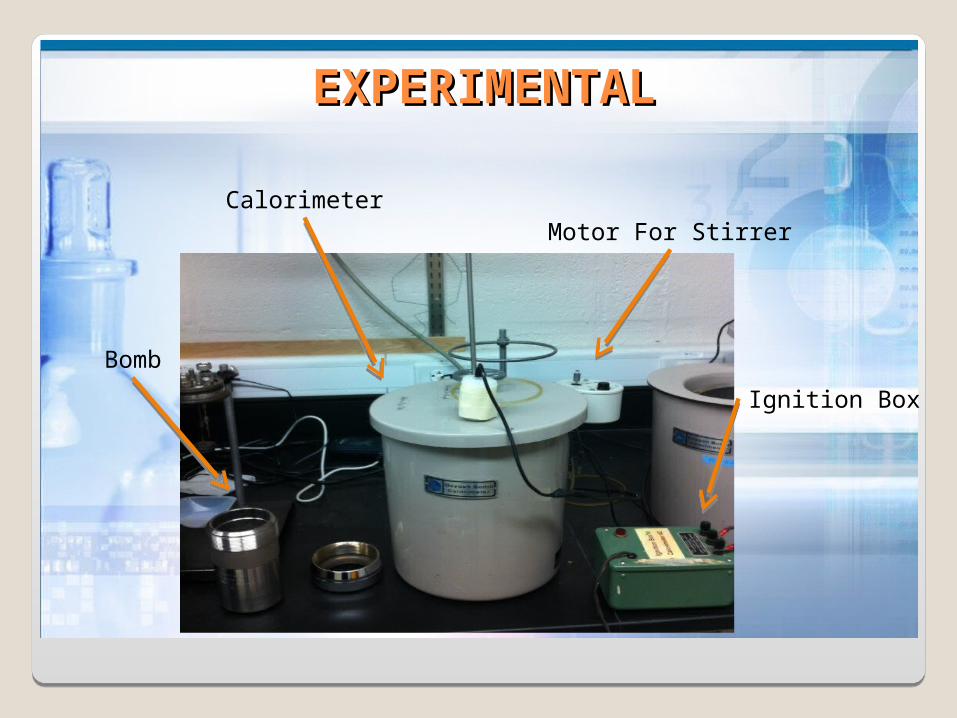
EXPERIMENTALEXPERIMENTAL
Bomb
CalorimeterMotor For Stirrer
Ignition Box
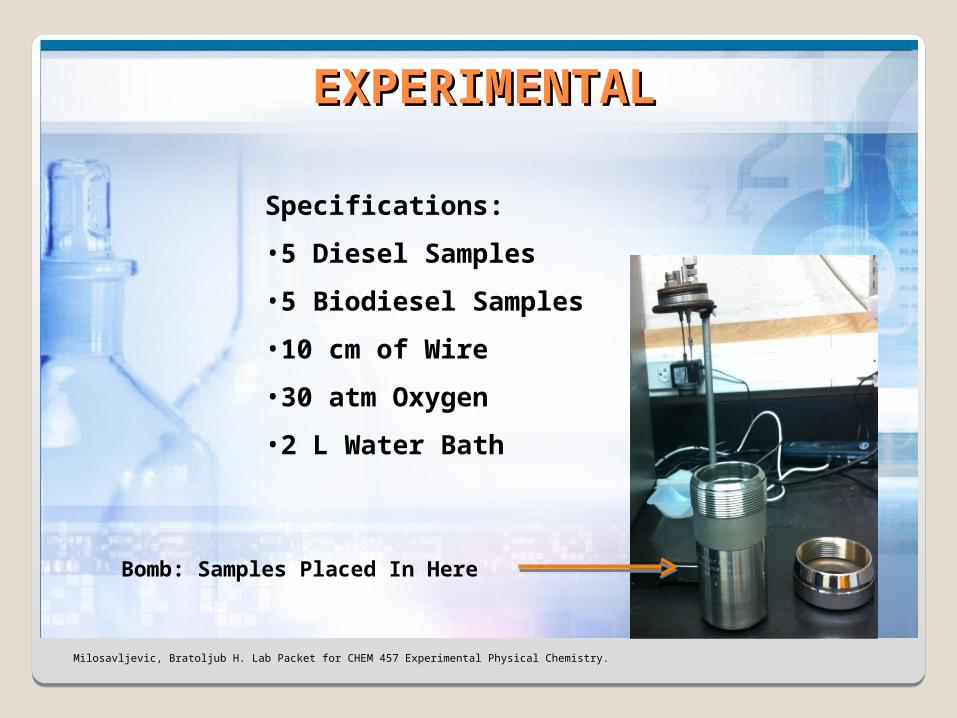
EXPERIMENTALEXPERIMENTAL
Bomb: Samples Placed In Here
Specifications:
•5 Diesel Samples
•5 Biodiesel Samples
•10 cm of Wire
•30 atm Oxygen
•2 L Water Bath
Milosavljevic, Bratoljub H. Lab Packet for CHEM 457 Experimental Physical Chemistry.

Results Results Trial ParametersTrial Parameters
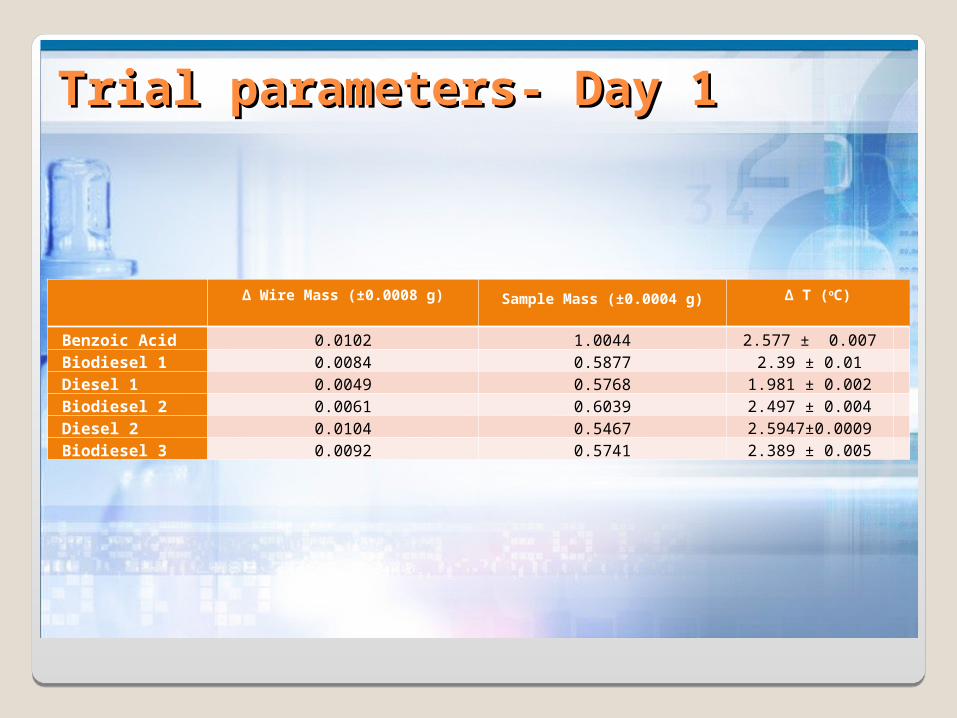
Trial parameters- Day 1Trial parameters- Day 1
Δ Wire Mass (±0.0008 g) Sample Mass (±0.0004 g) Δ T (oC)
Benzoic Acid 0.0102 1.0044 2.577 ± 0.007
Biodiesel 1 0.0084 0.5877 2.39 ± 0.01
Diesel 1 0.0049 0.5768 1.981 ± 0.002
Biodiesel 2 0.0061 0.6039 2.497 ± 0.004
Diesel 2 0.0104 0.5467 2.5947±0.0009
Biodiesel 3 0.0092 0.5741 2.389 ± 0.005
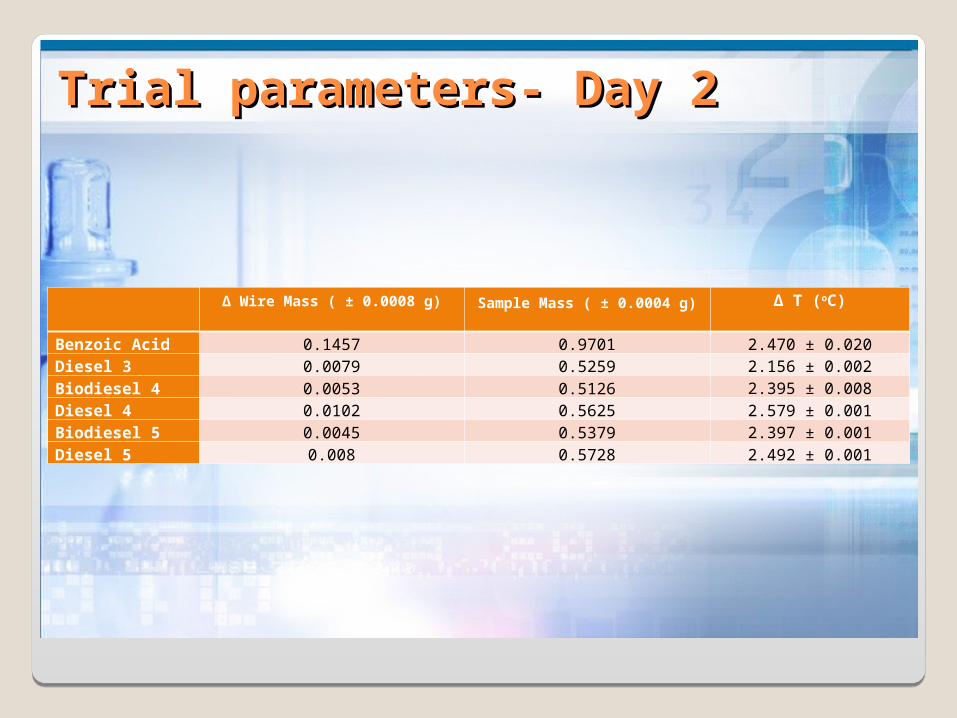
Trial parameters- Day 2Trial parameters- Day 2
Δ Wire Mass ( ± 0.0008 g) Sample Mass ( ± 0.0004 g) Δ T (oC)
Benzoic Acid 0.1457 0.9701 2.470 ± 0.020Diesel 3 0.0079 0.5259 2.156 ± 0.002Biodiesel 4 0.0053 0.5126 2.395 ± 0.008Diesel 4 0.0102 0.5625 2.579 ± 0.001Biodiesel 5 0.0045 0.5379 2.397 ± 0.001Diesel 5 0.008 0.5728 2.492 ± 0.001
Results Results Bomb Calorimetry Data- Bomb Calorimetry Data- Average Average Temperature ProfilesTemperature Profiles
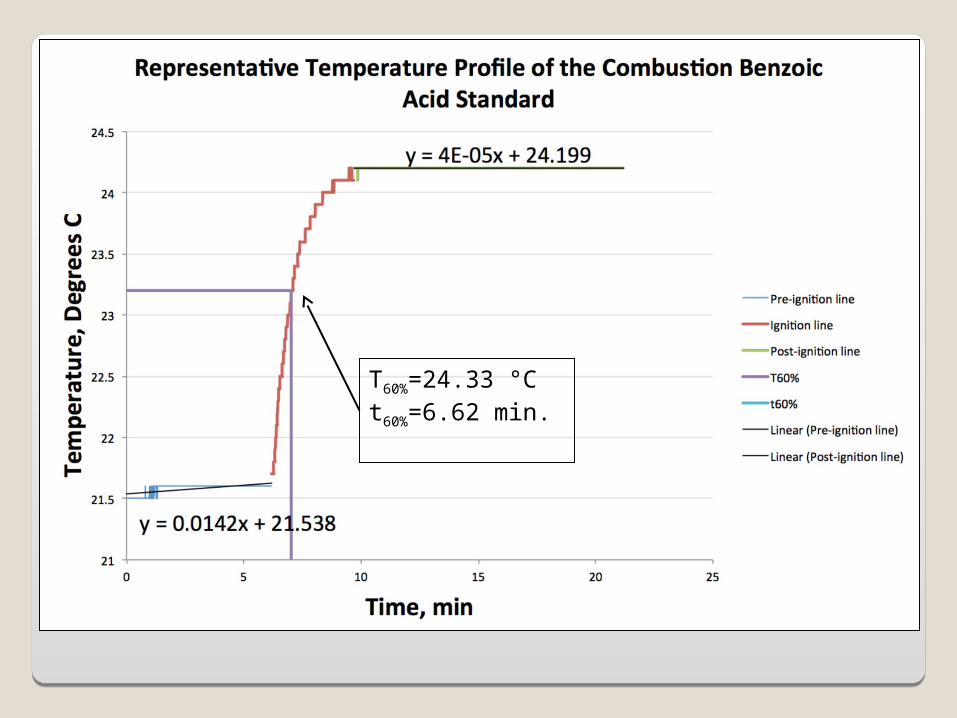
T60%=24.33 °Ct60%=6.62 min.
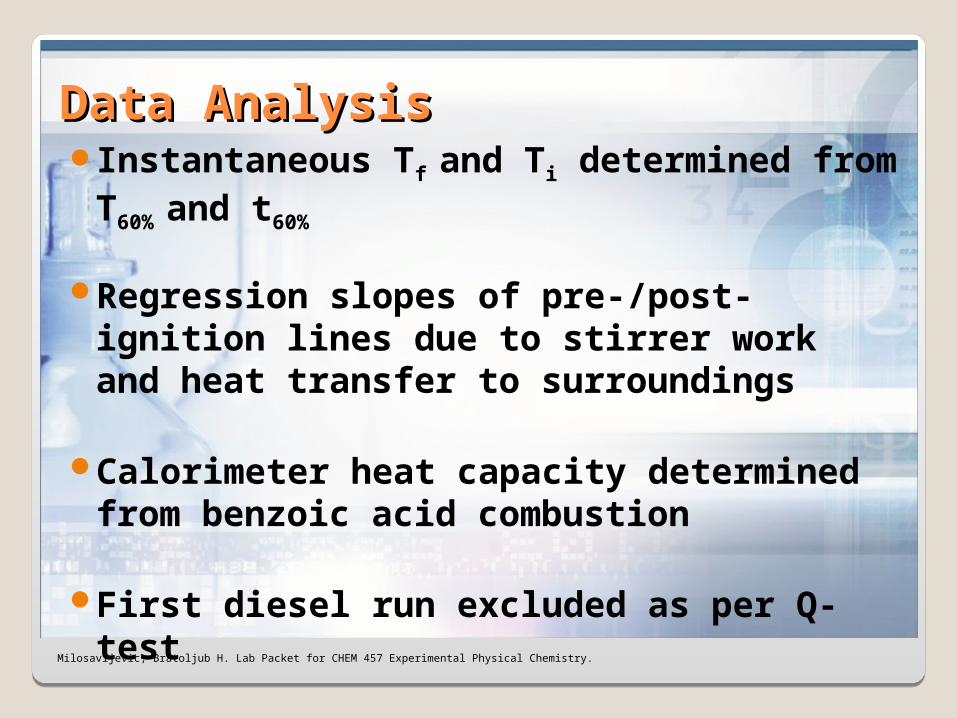
Data AnalysisData AnalysisInstantaneous Tf and Ti determined
from T60% and t60%
Regression slopes of pre-/post-ignition lines due to stirrer work and heat transfer to surroundings
Calorimeter heat capacity determined from benzoic acid combustion
First diesel run excluded as per Q-testMilosavljevic, Bratoljub H. Lab Packet for CHEM 457 Experimental Physical Chemistry.
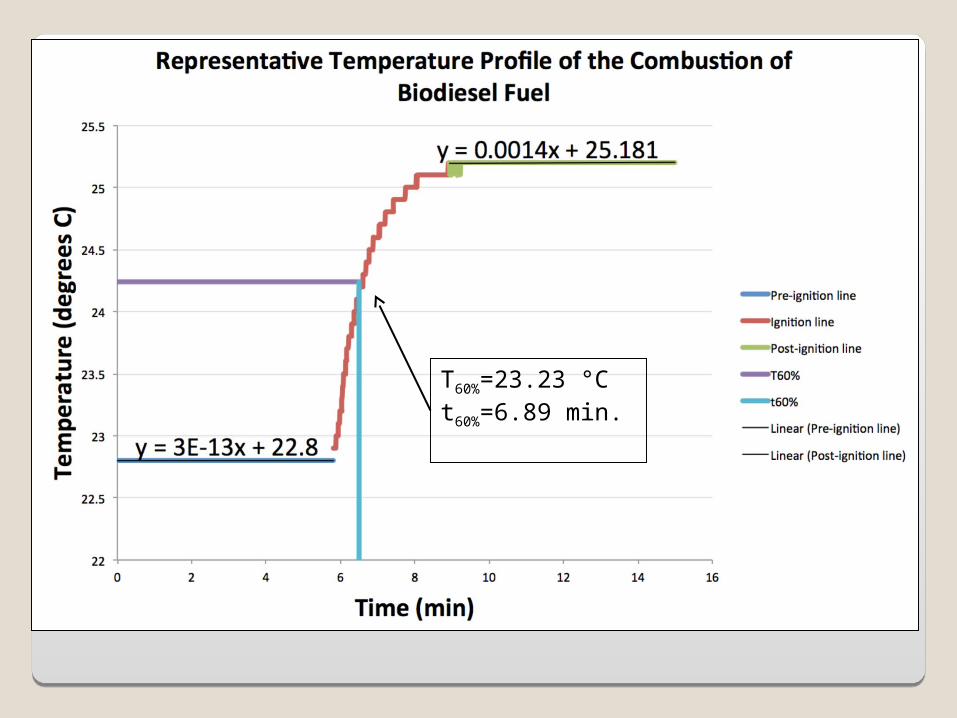
T60%=23.23 °Ct60%=6.89 min.
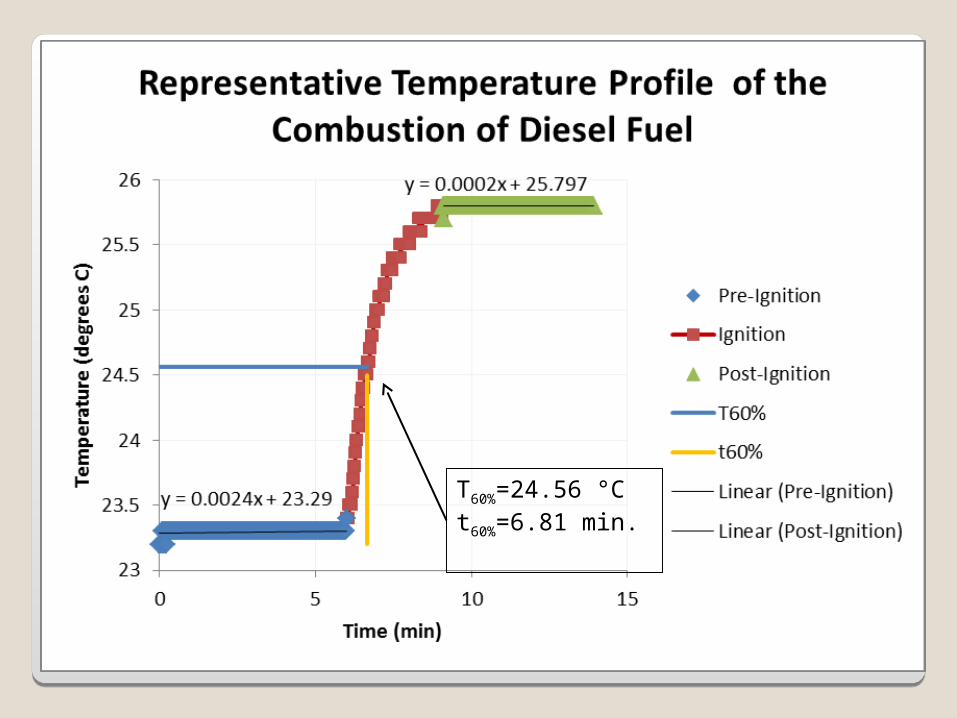
T60%=24.56 °Ct60%=6.81 min.
Results Results Bomb Calorimetry Data- Bomb Calorimetry Data- ΔΔHHcombcomb
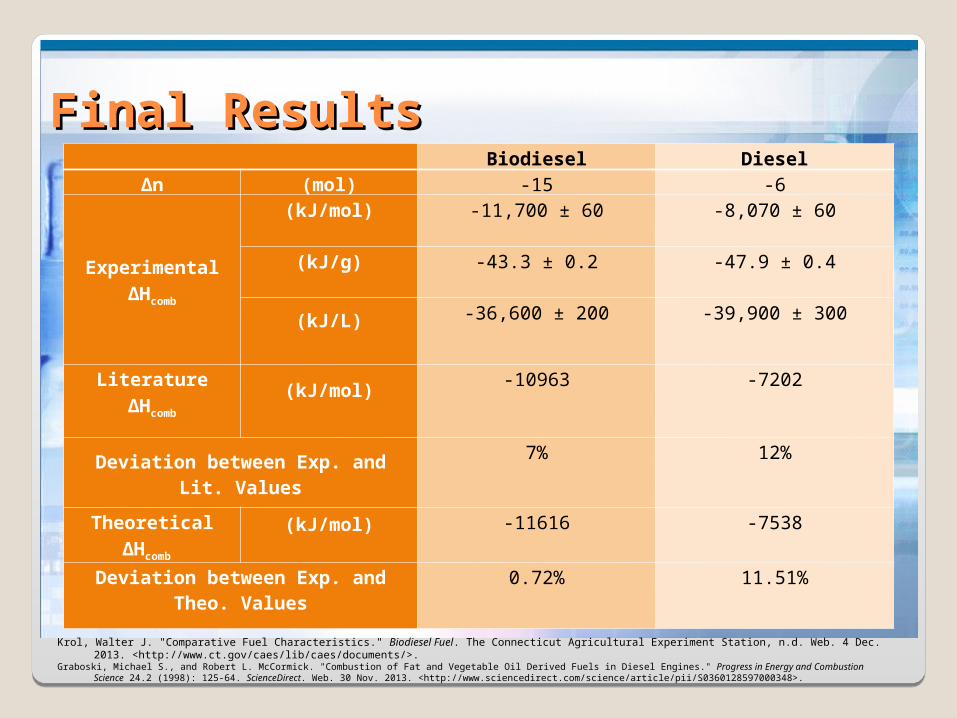
Final ResultsFinal ResultsBiodiesel Diesel
Δn (mol) -15 -6
Experimental ΔHcomb
(kJ/mol) -11,700 ± 60 -8,070 ± 60
(kJ/g) -43.3 ± 0.2 -47.9 ± 0.4
(kJ/L) -36,600 ± 200 -39,900 ± 300
Literature ΔHcomb
(kJ/mol) -10963 -7202
Deviation between Exp. and Lit. Values
7% 12%
Theoretical ΔHcomb
(kJ/mol) -11616 -7538
Deviation between Exp. and Theo. Values
0.72% 11.51%
Krol, Walter J. "Comparative Fuel Characteristics." Biodiesel Fuel. The Connecticut Agricultural Experiment Station, n.d. Web. 4 Dec. 2013. <http://www.ct.gov/caes/lib/caes/documents/>.
Graboski, Michael S., and Robert L. McCormick. "Combustion of Fat and Vegetable Oil Derived Fuels in Diesel Engines." Progress in Energy and Combustion Science 24.2 (1998): 125-64. ScienceDirect. Web. 30 Nov. 2013. <http://www.sciencedirect.com/science/article/pii/S0360128597000348>.

DiscussionDiscussion
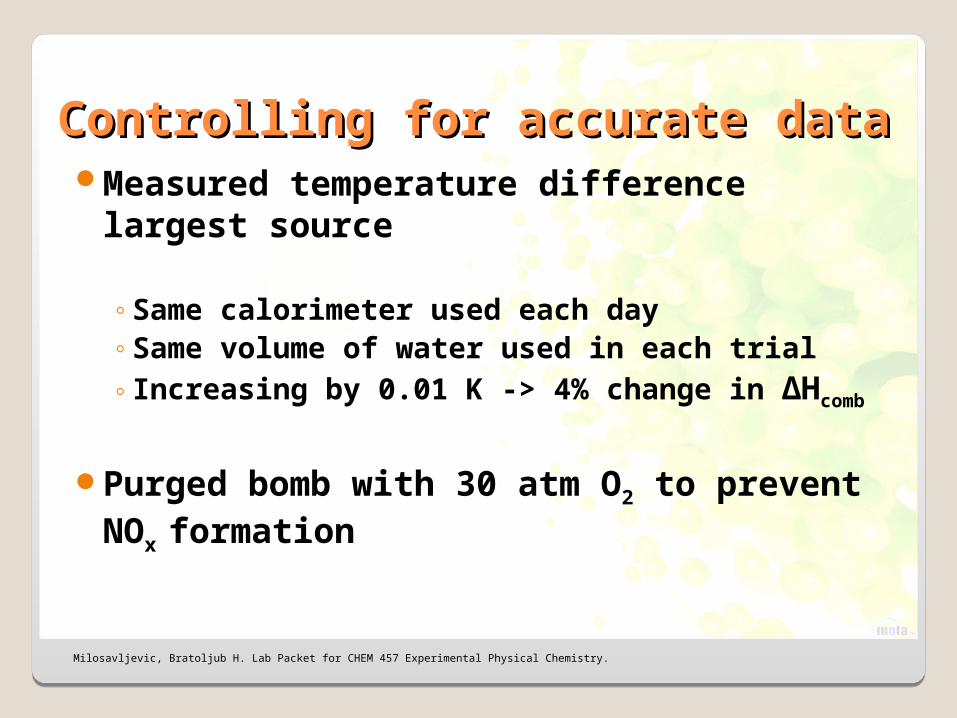
Controlling for accurate dataControlling for accurate dataMeasured temperature difference
largest source
◦Same calorimeter used each day◦Same volume of water used in each trial◦ Increasing by 0.01 K -> 4% change in ΔHcomb
Purged bomb with 30 atm O2 to prevent NOx formation
Milosavljevic, Bratoljub H. Lab Packet for CHEM 457 Experimental Physical Chemistry.
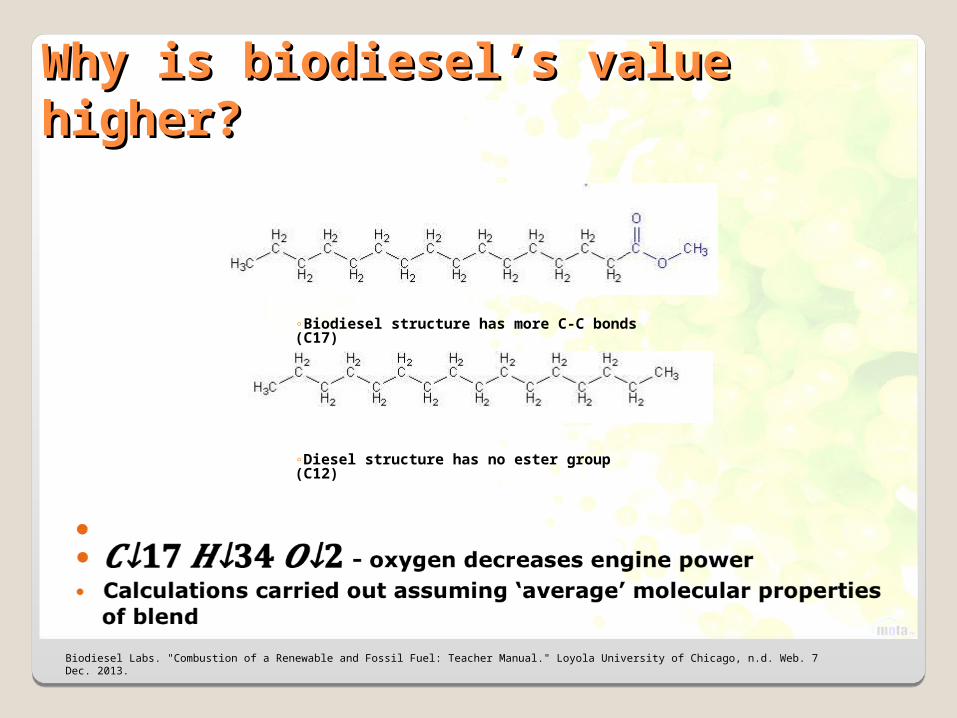
Why is biodiesel’s value higher?Why is biodiesel’s value higher?
◦Biodiesel structure has more C-C bonds (C17)
◦Diesel structure has no ester group (C12)
Biodiesel Labs. "Combustion of a Renewable and Fossil Fuel: Teacher Manual." Loyola University of Chicago, n.d. Web. 7 Dec. 2013.
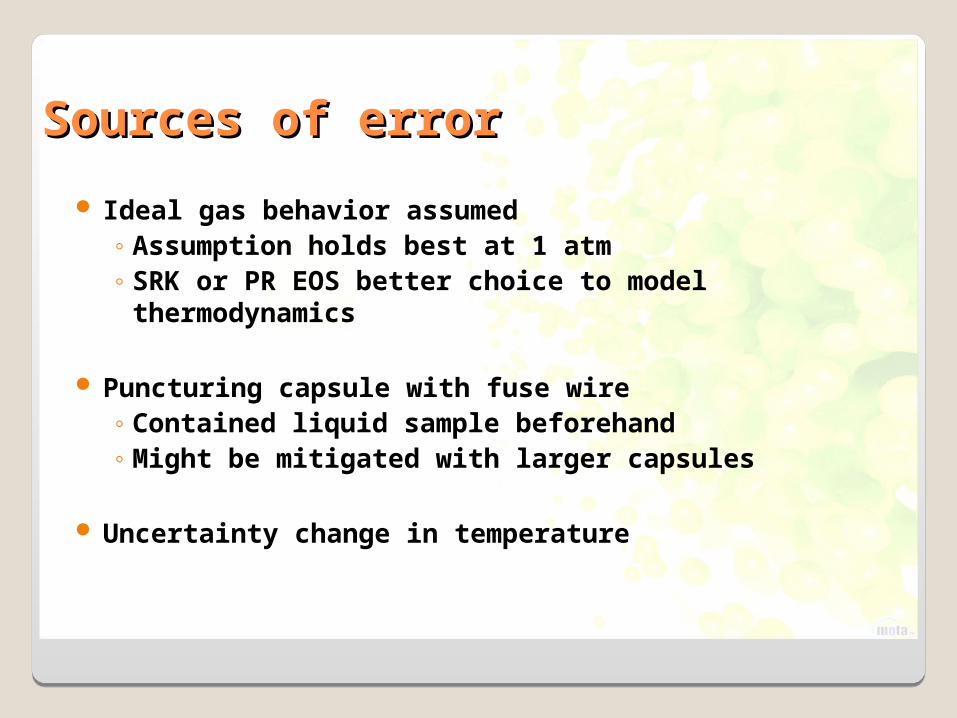
Sources of errorSources of error
Ideal gas behavior assumed◦ Assumption holds best at 1 atm◦ SRK or PR EOS better choice to model
thermodynamics
Puncturing capsule with fuse wire ◦ Contained liquid sample beforehand◦ Might be mitigated with larger capsules
Uncertainty change in temperature

ConclusionConclusion
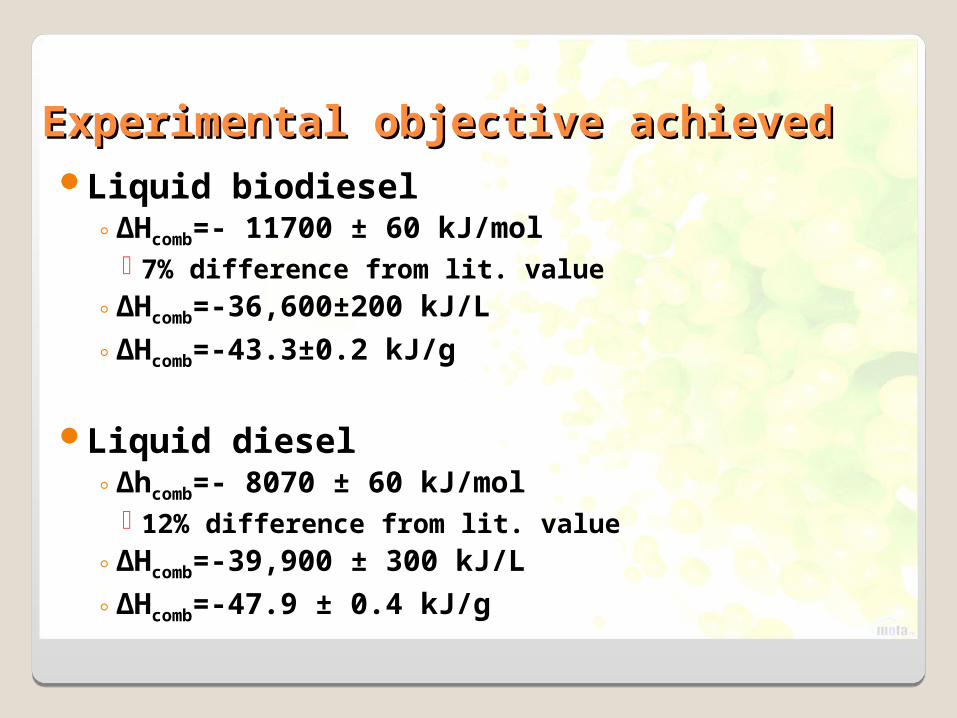
Experimental objective achievedExperimental objective achievedLiquid biodiesel
◦ΔHcomb=- 11700 ± 60 kJ/mol 7% difference from lit. value
◦ΔHcomb=-36,600±200 kJ/L
◦ΔHcomb=-43.3±0.2 kJ/g
Liquid diesel ◦Δhcomb=- 8070 ± 60 kJ/mol
12% difference from lit. value◦ΔHcomb=-39,900 ± 300 kJ/L
◦ΔHcomb=-47.9 ± 0.4 kJ/g

Questions?Questions?