Embed Size (px)
Citation preview
Comparing Classical Pathways and Modern Networks: Towards the Development of an Edge Ontology
Long J. Lu1, Andrea Sboner1, Yuanpeng J. Huang4, Hao Xin Lu1, Tara A. Gianoulis1, Kevin Y. Yip2, Philip M. Kim1, and Gaetano T. Montelione4,5, Mark B. Gerstein1, 2, 3*
1. Department of Molecular Biophysics and Biochemistry, Yale University, 266 Whitney Avenue, New Haven, CT 06520 2. Department of Computer Science, Yale University, 51 Prospect Street, New Haven, CT 06511 3. Program in Computational Biology and Bioinformatics, Yale University, 266 Whitney Avenue, New Haven, CT 06520 4. Department of Molecular Biology and Biochemistry, Center for Advanced Biotechnology and Medicine, Rutgers University, Piscataway, NJ 08854 5. Department of Biochemistry, Robert Wood Johnson Medical School, UMDNJ, Piscataway, NJ 08854. * Corresponding author: Gerstein, M.B. ([email protected])
1
Abstract Pathways are integral to systems biology. Their classical representation has proven useful but is inconsistent in the meaning assigned to each arrow (or edge) and inadvertently implies the isolation of one pathway from another. Conversely, modern high-throughput experiments give rise to standardized networks facilitating topological calculations. Combining these perspectives, we can embed classical pathways within large-scale networks and thus demonstrate the crosstalk between them. As more diverse types of high-throughput data become available, we can effectively merge both perspectives, embedding pathways simultaneously in multiple networks. However, the original problem still remains – the current edge representation is inadequate to accurately convey all the information in pathways. Therefore, we suggest that a standardized, well-defined, edge ontology is necessary and propose a prototype here, as a starting point for reaching this goal.
2
Uniting classical pathways and modern networks In biology, a pathway refers to a sequence of reactions, usually controlled and catalyzed by enzymes, by which one organic substance is converted to another. Biological pathways are an important component of systems biology. The classical representation of these pathways provides varied, mechanistic associations between many proteins. Conversely, modern high-throughput experiments and large-scale databases have given rise to standardized networks that provide a somewhat different perspective on pathways. Combining and comparing these perspectives, classical biochemical pathways can be embedded into large-scale networks. This reveals a number of problematic issues with classical pathways: First, the same pathways documented in different databases are often inconsistent in components included and their exact symbolic representation (e.g., what each of the arrows means). Second, pathways are isolated from one another in classical representations, de-emphasizing crosstalk. In contrast, embedded pathways offer completely uniform representations and relate network statistics, such as average degree or diameter, consistently to pathways. However, they are more limited in the richness of the mechanistic biochemistry that they can convey. As more diverse types of high-throughput data become available, it will be possible to embed classical pathways simultaneously in many large-scale networks, effectively merging both approaches. To accomplish this, a precise edge (or arrow) ontology needs to be defined. For illustrative purposes, we propose a prototype of ontology which provides an unambiguous representation of the edges connecting biomolecules and also describes higher-level relationships amongst these edges. We then demonstrate the usefulness of the simple edge ontology on four diverse types of pathways. We do not intend to provide a complete ontology here, but rather to stimulate people working in this field to continue building upon existing knowledge until a complete ontology is achieved. Pathway databases and limitations During the last decade, an increasing number of pathway databases have been established in order to document the ever-expanding knowledge concerning established pathways. Some of these pathway databases are organism specific. For example, EcoCyc[1] describes the genome and the biochemical machinery of E. coli K12 MG1655. A few other pathway databases focus on a specific type of disease or disorder, such as The Cancer Cell Map (http://cancer.cellmap.org) or GOLD.db[2]. The majority of these pathway databases cover a certain functional area that occurs in multiple organisms. Furthermore, such databases can often be roughly divided into three categories: those containing metabolic pathways (KEGG[3], WIT[4], BioCyc[5], MetaCyc[6], and GenMAPP[7]); those containing signal transduction (signaling) pathway (BioCarta (http://biocarta.com), STKE (http://stke.org), Pathways Knowledge Base (http://ingenuity.com), and Reactome[8]); and those containing both (KEGG, BioCarta and Reactome). Excellent recent reviews on these pathway databases can be found elsewhere [9, 10]. Although the above-mentioned databases provide valuable resources for studying the associations between proteins, they are hampered by several limitations. First of all, the same pathways documented in different databases are often inconsistent. In many cases, a pathway is described by including a few core components first. The decision of whether to include additional components in the given pathway is usually empirically determined, based on the expert curators’ knowledge and experience. Therefore, the boundary of a pathway is usually vague. The consequence is that the number of components in the same pathway in different databases varies greatly (Table S1 and Figure 4a).
3
Second, these pathways are isolated in classical representations. This is the consequence of the traditional reductionist approaches to molecular biology, whereby genes and pathways are investigated as isolated entities. However, from the perspective of modern systems biology, the interactions between biological pathways must be studied in order to understand how biological systems function. On the systems level, the crosstalk between pathways appears to be particularly important but lack significant study. Although there have been efforts to integrate them, such as in the Boehringer Mannheim Biochemical Pathways wall chart, many aspects of the relationships between pathways have yet to be systematically identified and incorporated. Third, the classical representations of pathways use symbols that lack a precise definition. The same symbol is often used to represent a variety of functions. For example, arrows are used to represent direct interactions in some circumstances, but in others, they are also used to represent translocation to a different sub-cellular compartment. Although this might not cause problems for laboratories focusing on individual pathways, these notations must be precisely defined in order to perform analyses on pathways on a larger scale. A structured vocabulary or ontology of these symbols should be developed to ameliorate this problem. Recent advent of network biology A particularly novel concept in the post-genomic era is the idea that a living cell can be viewed as a complex network of biomolecules. Indeed a biomolecular network can now be rendered as a collection of nodes and edges. Nodes represent biomolecules, such as proteins, genes and metabolites, while edges represent the types of associations between two nodes, such as physical interactions and co-expression of mRNAs. The combined functions and interactions between these networks constitute the behavior of the cell. Mapping and understanding biomolecular networks represents the first step towards modeling how a cell actually operates. As a result of recent genome-wide high-throughput (HTP) experiments, including large-scale yeast two-hybrid screens and microarray experiments, many types of networks have been mapped, including protein-protein interaction (PPI), expression, regulatory, metabolic and signaling networks. For example, protein-protein interaction networks have been experimentally determined in Saccharomyces cerevisiae[11-15], Caenorhabditis elegans[16], Drosophila melonogaster[17], Homo sapiens[18, 19], Plasmodium falciparum[20] and Helicobacter pylori[21]. The availability of such well-mapped networks has allowed us to compare and contrast them in terms of global and local topology, as well as, to relate the structural properties of these networks to protein properties, such as function and essentiality. Topological analysis of networks provides quantitative insight into their basic organization. Different network statistics have been designed to capture the characteristics of network topology (Table S2). Despite the seemingly vast differences between biomolecular networks, they are found to share common features with respect to network topology. Barabási et al. [22] proposed a “scale-free” model in which the degree distribution in many large networks follows a power-law distribution [ ]. What is remarkable about this distribution is that while most of the nodes within these networks have very few links, a few of these nodes, classified as hubs, are exceptionally well-connected. Concurrently, Watts and Strogatz[23] found that many
( ) rkkP −≈
4
networks also have a “small-world” property, meaning they are defined as being both highly clustered and containing small characteristic path lengths. Network analysis has provided quantitative new insights into protein properties, cellular dynamics and other biological problems. For example, research has shown that hubs in a network are more likely to be essential proteins, as well as prompted debate about whether hubs tend to evolve slower [24-26]. Furthermore, different motifs have been implicated in different stages of dynamic transitions of a network[27]. Comparisons between classical and embedded pathways One can construct large-scale networks using different types of data from HTP experiments: protein-protein interaction networks from yeast two-hybrid screens, and co-expression networks from micro-array experiments provide apt examples of this. For each classical pathway, we can extract the corresponding sub-network from the entire network by mapping the core components in this classical pathway onto the network of biomolecules. From a network point of view, this mapping can also be viewed as embedding pathway components into the network. To differentiate from the classical pathways, we refer to these sub-networks as embedded pathways (Figure 1). The core components of a classical or embedded pathway are defined as the biomolecules in the KEGG pathway diagram. KEGG is used in this article because of its high quality among pathway databases, as pointed out by Wittig et al. [28]. We will use the Notch pathway as an example to illustrate our findings because of its elegance and simplicity. The Notch signaling pathway is a highly conserved pathway for cell-cell communication. It is involved in the regulation of cellular differentiation and proliferation. As shown in Figure 1, we constructed core and extended embedded pathways by collecting the 22 core protein components listed in KEGG and mapping them onto the large-scale PPI network deposited in the Human Protein Reference Database (HPRD)[29]. The HPRD interactions are manually curated by expert biologists to reduce errors. Comparisons between classical and core embedded Notch pathways reveal a number of differences. First, the classical pathway contains directed and undirected edges (Figure 2a). Directed edges often represent activations, such as the edge between Delta and Notch. They also represent translocation to a different cellular compartment, for example, the edge between Notch and NICD. Undirected edges often represent an interaction between two components, such as the edge between CSL and SKIP. In contrast, the edges between components in the embedded pathway are uniform (Figure 2b). In this case, they are protein-protein interactions. Although the edge representation in the core embedded pathway is more consistent, it loses information encoded in classical pathways. Second, although most of the edges are common between both representations, some edges appear only in one representation. The core embedded pathway also reveals 12 new interactions that are not found in the KEGG classical pathway. Conversely, there are two edges that exist in KEGG, but are not present in the core embedded pathway. They are between Notch and DVL and between Notch and TACE suggesting either that the protein-protein interaction map is incomplete or that these interactions take place through an intermediate (Figure 2a, b).
5
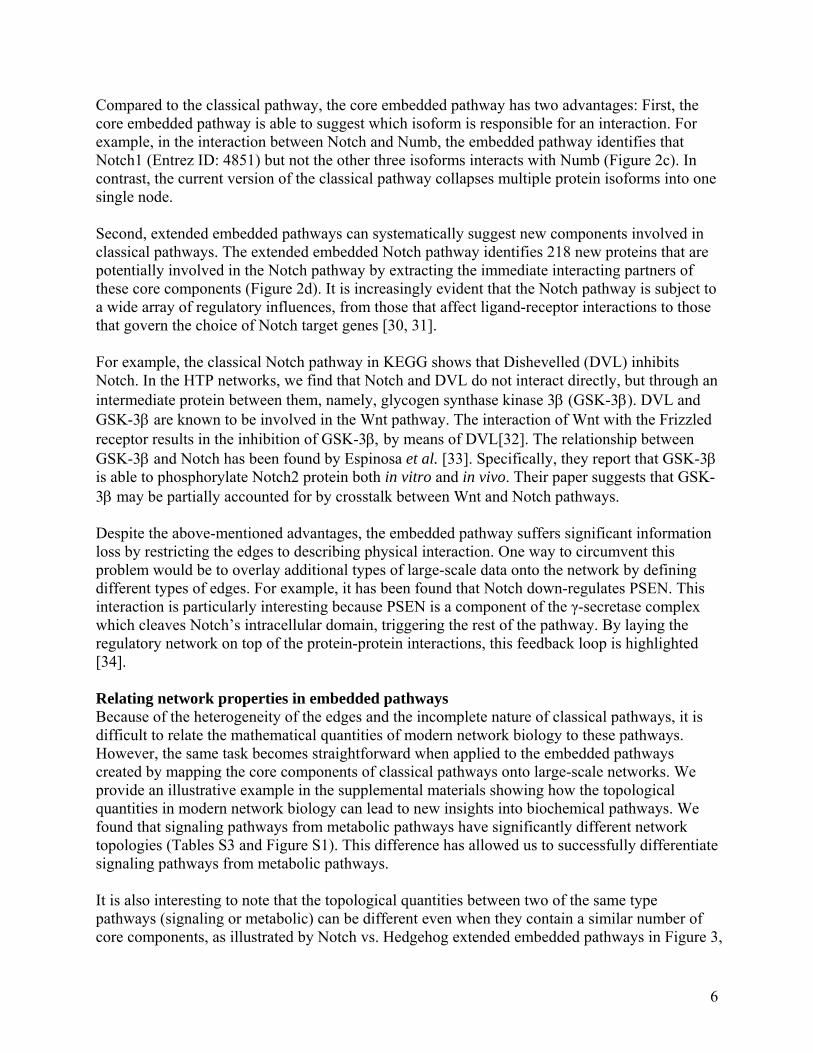
Compared to the classical pathway, the core embedded pathway has two advantages: First, the core embedded pathway is able to suggest which isoform is responsible for an interaction. For example, in the interaction between Notch and Numb, the embedded pathway identifies that Notch1 (Entrez ID: 4851) but not the other three isoforms interacts with Numb (Figure 2c). In contrast, the current version of the classical pathway collapses multiple protein isoforms into one single node. Second, extended embedded pathways can systematically suggest new components involved in classical pathways. The extended embedded Notch pathway identifies 218 new proteins that are potentially involved in the Notch pathway by extracting the immediate interacting partners of these core components (Figure 2d). It is increasingly evident that the Notch pathway is subject to a wide array of regulatory influences, from those that affect ligand-receptor interactions to those that govern the choice of Notch target genes [30, 31]. For example, the classical Notch pathway in KEGG shows that Dishevelled (DVL) inhibits Notch. In the HTP networks, we find that Notch and DVL do not interact directly, but through an intermediate protein between them, namely, glycogen synthase kinase 3β (GSK-3β). DVL and GSK-3β are known to be involved in the Wnt pathway. The interaction of Wnt with the Frizzled receptor results in the inhibition of GSK-3β, by means of DVL[32]. The relationship between GSK-3β and Notch has been found by Espinosa et al. [33]. Specifically, they report that GSK-3β is able to phosphorylate Notch2 protein both in vitro and in vivo. Their paper suggests that GSK-3β may be partially accounted for by crosstalk between Wnt and Notch pathways. Despite the above-mentioned advantages, the embedded pathway suffers significant information loss by restricting the edges to describing physical interaction. One way to circumvent this problem would be to overlay additional types of large-scale data onto the network by defining different types of edges. For example, it has been found that Notch down-regulates PSEN. This interaction is particularly interesting because PSEN is a component of the γ-secretase complex which cleaves Notch’s intracellular domain, triggering the rest of the pathway. By laying the regulatory network on top of the protein-protein interactions, this feedback loop is highlighted [34]. Relating network properties in embedded pathways Because of the heterogeneity of the edges and the incomplete nature of classical pathways, it is difficult to relate the mathematical quantities of modern network biology to these pathways. However, the same task becomes straightforward when applied to the embedded pathways created by mapping the core components of classical pathways onto large-scale networks. We provide an illustrative example in the supplemental materials showing how the topological quantities in modern network biology can lead to new insights into biochemical pathways. We found that signaling pathways from metabolic pathways have significantly different network topologies (Tables S3 and Figure S1). This difference has allowed us to successfully differentiate signaling pathways from metabolic pathways. It is also interesting to note that the topological quantities between two of the same type pathways (signaling or metabolic) can be different even when they contain a similar number of core components, as illustrated by Notch vs. Hedgehog extended embedded pathways in Figure 3,
6
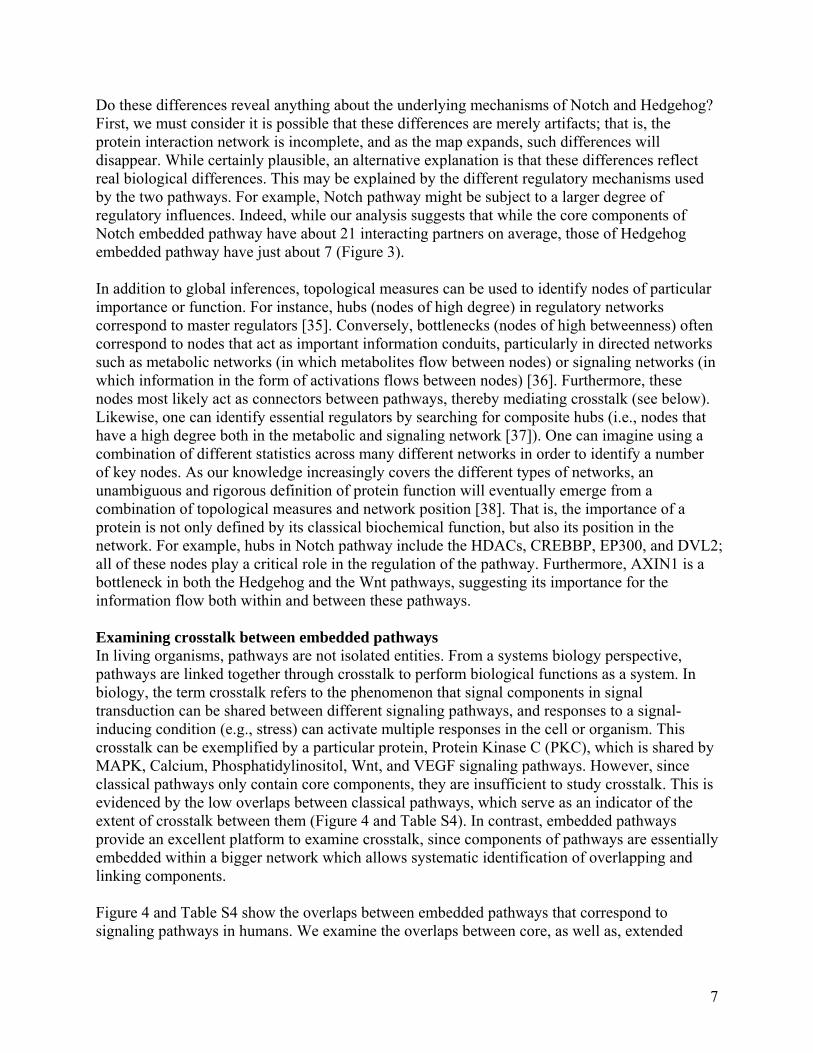
Do these differences reveal anything about the underlying mechanisms of Notch and Hedgehog? First, we must consider it is possible that these differences are merely artifacts; that is, the protein interaction network is incomplete, and as the map expands, such differences will disappear. While certainly plausible, an alternative explanation is that these differences reflect real biological differences. This may be explained by the different regulatory mechanisms used by the two pathways. For example, Notch pathway might be subject to a larger degree of regulatory influences. Indeed, while our analysis suggests that while the core components of Notch embedded pathway have about 21 interacting partners on average, those of Hedgehog embedded pathway have just about 7 (Figure 3). In addition to global inferences, topological measures can be used to identify nodes of particular importance or function. For instance, hubs (nodes of high degree) in regulatory networks correspond to master regulators [35]. Conversely, bottlenecks (nodes of high betweenness) often correspond to nodes that act as important information conduits, particularly in directed networks such as metabolic networks (in which metabolites flow between nodes) or signaling networks (in which information in the form of activations flows between nodes) [36]. Furthermore, these nodes most likely act as connectors between pathways, thereby mediating crosstalk (see below). Likewise, one can identify essential regulators by searching for composite hubs (i.e., nodes that have a high degree both in the metabolic and signaling network [37]). One can imagine using a combination of different statistics across many different networks in order to identify a number of key nodes. As our knowledge increasingly covers the different types of networks, an unambiguous and rigorous definition of protein function will eventually emerge from a combination of topological measures and network position [38]. That is, the importance of a protein is not only defined by its classical biochemical function, but also its position in the network. For example, hubs in Notch pathway include the HDACs, CREBBP, EP300, and DVL2; all of these nodes play a critical role in the regulation of the pathway. Furthermore, AXIN1 is a bottleneck in both the Hedgehog and the Wnt pathways, suggesting its importance for the information flow both within and between these pathways. Examining crosstalk between embedded pathways In living organisms, pathways are not isolated entities. From a systems biology perspective, pathways are linked together through crosstalk to perform biological functions as a system. In biology, the term crosstalk refers to the phenomenon that signal components in signal transduction can be shared between different signaling pathways, and responses to a signal-inducing condition (e.g., stress) can activate multiple responses in the cell or organism. This crosstalk can be exemplified by a particular protein, Protein Kinase C (PKC), which is shared by MAPK, Calcium, Phosphatidylinositol, Wnt, and VEGF signaling pathways. However, since classical pathways only contain core components, they are insufficient to study crosstalk. This is evidenced by the low overlaps between classical pathways, which serve as an indicator of the extent of crosstalk between them (Figure 4 and Table S4). In contrast, embedded pathways provide an excellent platform to examine crosstalk, since components of pathways are essentially embedded within a bigger network which allows systematic identification of overlapping and linking components. Figure 4 and Table S4 show the overlaps between embedded pathways that correspond to signaling pathways in humans. We examine the overlaps between core, as well as, extended
7
embedded pathways. The larger the overlap between embedded pathways, the more crosstalk takes place between the two pathways. Although most of the core embedded pathways do not overlap significantly, the corresponding extended embedded pathways often show a significant increase in overlap (Table S4). These results suggest that a large number of proteins exist as liaison components between pathways, and all of the signaling pathways can be connected with one degree of separation at most. A careful examination of these intermediate proteins may be useful in unraveling the mechanisms by which different pathways are related to each other. Developing a simple version of edge ontology for pathways As we mentioned before, classical pathway representation is often ambiguous, using the same symbol to represent different functions. In the post-genomic era, this problem is further confounded by the emergence of various types of high-throughput data. Different types of high-throughput data reveal different relationships between pathway components. In addition to protein-protein interaction networks, the core components of a pathway can also be mapped onto other types of networks, such as gene expression and regulatory networks. Simple edges and arrows that are traditionally used in the classical pathway representation may not be sufficient to meet the challenges of integrating these heterogeneous datasets. In order to perform large-scale mining of pathways, a precise edge or arrow ontology must be developed to represent different types of relationships between pathway components. To make things more complicated, a large number of pathway databases are currently available [9, 39]. Unfortunately, they typically do not share data models, file formats or access method. To foster sharing of these different information sources, several eXtensible Markup Language (XML) exchange formats have been developed. System Biology Markup Language (SBML) [40] and CellML [41] focus mainly on quantitatively simulating concentrations of pathway components. The Proteomic Standards Initiative’s Molecular Interaction (PSI-MI) [42] is an exchange format for molecular interaction, and the Biological Pathway Exchange (BioPAX) [43] is a more general format used to describe biological pathways. Much effort has been devoted towards developing consistent representation of pathways; however, most of these efforts focus on enumerating diverse types of edges. BioPAX has been developing an ontology of interactions that reveals relationships between edges. In order to perform large-scale mining of pathways, making explicit the relationships between edges is an important step for elucidating the transitions and reactions between molecules. A precise edge or arrow ontology may also help improve pathway representation by highlighting both different types of relationships between pathway components and our level of knowledge in that relationship. As an example, phosphorylation, unbiquitination, glycosylation and methylation can all be viewed as types of reactions by transferring “tags” to target proteins. Thus an ontology of edges which not only enumerates different types of edges but also classifies the edges into groups should be developed to capture this information. This explicit hierarchy of relationships can be exploited to enable accurate computational analysis without losing the expressiveness of the classical representation. For example, some pathway interactions can be represented by specific symbols, such as serine phosphorylation. However, translation to a more general interaction,
8
such as “tagging” that leads to activation, can be employed to perform high-level analysis of the pathway or to compare multiple pathways represented at a different level of specification. Here, we propose a simple version of edge ontology to illustrate how we could deal with this issue in the future. This ontology provides both an unambiguous definition of the interactions and defines a hierarchy of those interactions. In particular, the hierarchy of interactions may be useful to obtain multiple views of a pathway, from a general one to a more specific one. It also contains symbols that may help the graphical representation of interactions. Please note this ontology is far from complete. We foresee that the formidable goal of constructing a complete ontology for pathways would take multiple groups many years to achieve. However, this simple ontology could be used as a starting point, upon which we hope a complete ontology can be built. We also realize that a consistent representation of nodes is equally important; however, this problem can be largely solved by using Gene Ontology[44]. The Gene Ontology (GO) provides a controlled vocabulary to describe gene and gene product attributes in any organism, and hence could be used as a rough node ontology. Below, we will only focus on edge ontology. Table 1 shows the edge ontology. We use different shapes, symbols, and colors to represent diverse types of interactions between pathway components. We also define a simple hierarchy of interactions from general ones to more specific ones. The first level divides directed from undirected interactions whereas, the second level highlights the main mechanisms of interaction, which are in turn defined in more detail in the third level. The fourth level further specifies some of the interaction types. The edges in the second level have different shapes, while in the third level they are represented by different colors. Further specifications can be defined by adding annotations on the edge, such as those in the fourth level. Nearly all the edges connect two components of the pathways, such as proteins and molecules, except that the “catalysis” edge connects a pathway component to a “chemical reaction” edge. This allows us to properly describe metabolic pathways which typically display a sequence of chemical reactions in which enzymes take part. As an example, a black arrow is used to indicate a “tagging” interaction, meaning an interaction that binds a molecule to a pathway component. If we know the type of interaction in more detail, different colors can be used to describe different “tagging” mechanisms: red for phosphorylation, blue for ubiquitination, and so on. In many cases, however, the tagging mechanism activates proteins; to highlight that some tagging mechanisms may inhibit proteins, a solid vertical line is used instead of the arrow shape. To further specify the relationship with more details, an annotation on the edge can be used, such as serine phosphorylation and N-linked glycosylation. It is worth noting that symbols from different levels can be used concurrently in the same pathway. This may be used as a way to emphasize our level of understanding of the interaction. For illustration purposes only, we provide four examples of the application of this edge ontology. We consider the Notch pathway, the Citric acid cycle, the JAK-STAT signaling pathway and the Caspase cascade pathway. We redraw the classical pathways according to our new edge ontology in Figure 5. Concluding remarks
9
While classical representations of biochemical pathways can provide an in-depth view of isolated sets of genes, the network approach is capable of analyzing pathways on three different levels: whole system (crosstalk), whole network, and individual nodes. While embedding pathways to large-scale protein-protein interaction networks allows us to easily compare properties across, between, and within pathways, we also experience significant information loss. One way to circumvent this problem would be to overlay additional types of high-throughput data onto the pathway by defining different types of edges. In order to properly analyze this type of multilayered network, a precise edge ontology must be defined. The edge ontology should provide an unambiguous representation of the relationships between biomolecules, as well as reveal relationships between edges. However, even a well-defined edge ontology still suffers the limitation of lacking explicit temporal information. Properly incorporating explicit temporal information will be the next grand challenge in the representation of pathways.
10
ACKNOWLEDGMENTS This work is supported by an NIH grant to MBG. We would like to thank Dr. Ashish Agarwal and Mr. Emmett Sprecher for valuable comments on improving this manuscript. REFERENCES 1. Keseler, I.M., et al., EcoCyc: a comprehensive database resource for Escherichia coli.
Nucleic Acids Res, 2005. 33(Database issue): p. D334-7. 2. Hackl, H., et al., GOLD.db: genomics of lipid-associated disorders database. BMC
Genomics, 2004. 5(1): p. 93. 3. Kanehisa, M., et al., The KEGG resource for deciphering the genome. Nucleic Acids Res,
2004. 32(Database issue): p. D277-80. 4. Overbeek, R., et al., WIT: integrated system for high-throughput genome sequence
analysis and metabolic reconstruction. Nucleic Acids Res, 2000. 28(1): p. 123-5. 5. Karp, P.D., et al., Expansion of the BioCyc collection of pathway/genome databases to
160 genomes. Nucleic Acids Res, 2005. 33(19): p. 6083-9. 6. Caspi, R., et al., MetaCyc: a multiorganism database of metabolic pathways and enzymes.
Nucleic Acids Res, 2006. 34(Database issue): p. D511-6. 7. Dahlquist, K.D., et al., GenMAPP, a new tool for viewing and analyzing microarray data
on biological pathways. Nat Genet, 2002. 31(1): p. 19-20. 8. Joshi-Tope, G., et al., Reactome: a knowledgebase of biological pathways. Nucleic Acids
Res, 2005. 33(Database issue): p. D428-32. 9. Cary, M.P., G.D. Bader, and C. Sander, Pathway information for systems biology. FEBS
Lett, 2005. 579(8): p. 1815-20. 10. Schaefer, C.F., Pathway databases. Ann N Y Acad Sci, 2004. 1020: p. 77-91. 11. Uetz, P., et al., A comprehensive analysis of protein-protein interactions in
Saccharomyces cerevisiae. Nature, 2000. 403(6770): p. 623-7. 12. Ito, T., et al., A comprehensive two-hybrid analysis to explore the yeast protein
interactome. Proc Natl Acad Sci U S A, 2001. 98(8): p. 4569-74. 13. Gavin, A.C., et al., Functional organization of the yeast proteome by systematic analysis
of protein complexes. Nature, 2002. 415(6868): p. 141-7. 14. Ho, Y., et al., Systematic identification of protein complexes in Saccharomyces cerevisiae
by mass spectrometry. Nature, 2002. 415(6868): p. 180-3. 15. Gavin, A.C., et al., Proteome survey reveals modularity of the yeast cell machinery.
Nature, 2006. 440(7084): p. 631-6. 16. Li, S., et al., A map of the interactome network of the metazoan C. elegans. Science, 2004.
303(5657): p. 540-3. 17. Giot, L., et al., A protein interaction map of Drosophila melanogaster. Science, 2003.
302(5651): p. 1727-36. 18. Rual, J.F., et al., Towards a proteome-scale map of the human protein-protein interaction
network. Nature, 2005. 437(7062): p. 1173-8. 19. Han, J.D., et al., Effect of sampling on topology predictions of protein-protein interaction
networks. Nat Biotechnol, 2005. 23(7): p. 839-44. 20. Suthram, S., T. Sittler, and T. Ideker, The Plasmodium protein network diverges from
those of other eukaryotes. Nature, 2005. 438(7064): p. 108-12.
11
21. Rain, J.C., et al., The protein-protein interaction map of Helicobacter pylori. Nature, 2001. 409(6817): p. 211-5.
22. Barabasi, A.L. and Z.N. Oltvai, Network biology: understanding the cell's functional organization. Nat Rev Genet, 2004. 5(2): p. 101-13.
23. Watts, D.J. and S.H. Strogatz, Collective dynamics of 'small-world' networks. Nature, 1998. 393(6684): p. 440-2.
24. Fraser, H.B., et al., Evolutionary rate in the protein interaction network. Science, 2002. 296(5568): p. 750-2.
25. Jordan, I.K., et al., Essential genes are more evolutionarily conserved than are nonessential genes in bacteria. Genome Res, 2002. 12(6): p. 962-8.
26. Kim, P.M., et al., Redefining edges: relating 3D structures to protein networks provides evolutionary insights. Science, 2006. in press.
27. Luscombe, N.M., et al., Genomic analysis of regulatory network dynamics reveals large topological changes. Nature, 2004. 431(7006): p. 308-12.
28. Wittig, U. and A. De Beuckelaer, Analysis and comparison of metabolic pathway databases. Brief Bioinform, 2001. 2(2): p. 126-42.
29. Peri, S., et al., Development of human protein reference database as an initial platform for approaching systems biology in humans. Genome Res, 2003. 13(10): p. 2363-71.
30. Kadesch, T., Notch signaling: the demise of elegant simplicity. Curr Opin Genet Dev, 2004. 14(5): p. 506-12.
31. Bray, S.J., Notch signalling: a simple pathway becomes complex. Nat Rev Mol Cell Biol, 2006. 7(9): p. 678-89.
32. Salinas, P.C., Retrograde signalling at the synapse: a role for Wnt proteins. Biochem Soc Trans, 2005. 33(Pt 6): p. 1295-8.
33. Espinosa, L., et al., Phosphorylation by glycogen synthase kinase-3 beta down-regulates Notch activity, a link for Notch and Wnt pathways. J Biol Chem, 2003. 278(34): p. 32227-35.
34. Lleo, A., et al., Notch1 competes with the amyloid precursor protein for gamma-secretase and down-regulates presenilin-1 gene expression. J Biol Chem, 2003. 278(48): p. 47370-5.
35. Borneman, A.R., et al., Target hub proteins serve as master regulators of development in yeast. Genes Dev, 2006. 20(4): p. 435-48.
36. Yu, H., P.M. Kim, and M. Gerstein, PLoS Computational Biology. in press. 37. Yu, H., et al., Design principles of molecular networks revealed by global comparisons
and composite motifs. Genome Biol, 2006. 7(7): p. R55. 38. Huynen, M.A., et al., Function prediction and protein networks. Curr Opin Cell Biol,
2003. 15(2): p. 191-8. 39. Bader, G.D., M.P. Cary, and C. Sander, Pathguide: a pathway resource list. Nucleic
Acids Res, 2006. 34(Database issue): p. D504-6. 40. Hucka, M., et al., The systems biology markup language (SBML): a medium for
representation and exchange of biochemical network models. Bioinformatics, 2003. 19(4): p. 524-31.
41. Lloyd, C.M., M.D. Halstead, and P.F. Nielsen, CellML: its future, present and past. Prog Biophys Mol Biol, 2004. 85(2-3): p. 433-50.
12
42. Hermjakob, H., et al., The HUPO PSI's molecular interaction format--a community standard for the representation of protein interaction data. Nat Biotechnol, 2004. 22(2): p. 177-83.
43. Stromback, L. and P. Lambrix, Representations of molecular pathways: an evaluation of SBML, PSI MI and BioPAX. Bioinformatics, 2005. 21(24): p. 4401-7.
44. Ashburner, M., et al., Gene ontology: tool for the unification of biology. The Gene Ontology Consortium. Nat Genet, 2000. 25(1): p. 25-9.
13
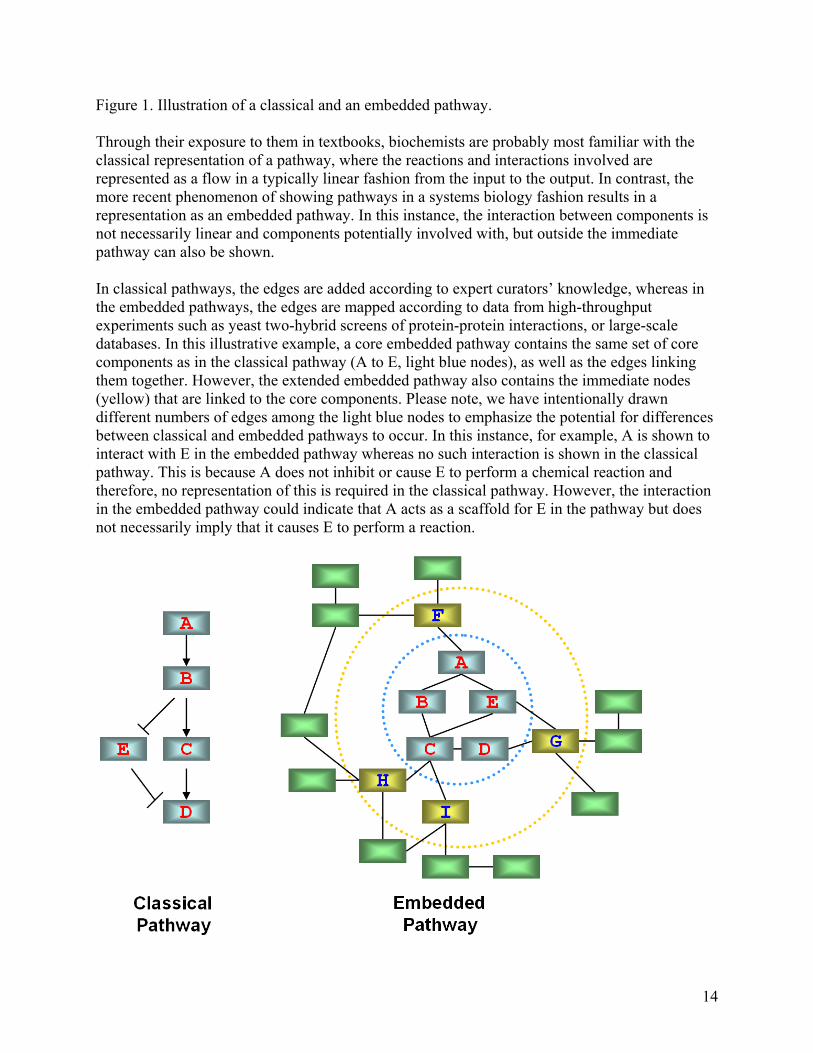
Figure 1. Illustration of a classical and an embedded pathway. Through their exposure to them in textbooks, biochemists are probably most familiar with the classical representation of a pathway, where the reactions and interactions involved are represented as a flow in a typically linear fashion from the input to the output. In contrast, the more recent phenomenon of showing pathways in a systems biology fashion results in a representation as an embedded pathway. In this instance, the interaction between components is not necessarily linear and components potentially involved with, but outside the immediate pathway can also be shown. In classical pathways, the edges are added according to expert curators’ knowledge, whereas in the embedded pathways, the edges are mapped according to data from high-throughput experiments such as yeast two-hybrid screens of protein-protein interactions, or large-scale databases. In this illustrative example, a core embedded pathway contains the same set of core components as in the classical pathway (A to E, light blue nodes), as well as the edges linking them together. However, the extended embedded pathway also contains the immediate nodes (yellow) that are linked to the core components. Please note, we have intentionally drawn different numbers of edges among the light blue nodes to emphasize the potential for differences between classical and embedded pathways to occur. In this instance, for example, A is shown to interact with E in the embedded pathway whereas no such interaction is shown in the classical pathway. This is because A does not inhibit or cause E to perform a chemical reaction and therefore, no representation of this is required in the classical pathway. However, the interaction in the embedded pathway could indicate that A acts as a scaffold for E in the pathway but does not necessarily imply that it causes E to perform a reaction.
14
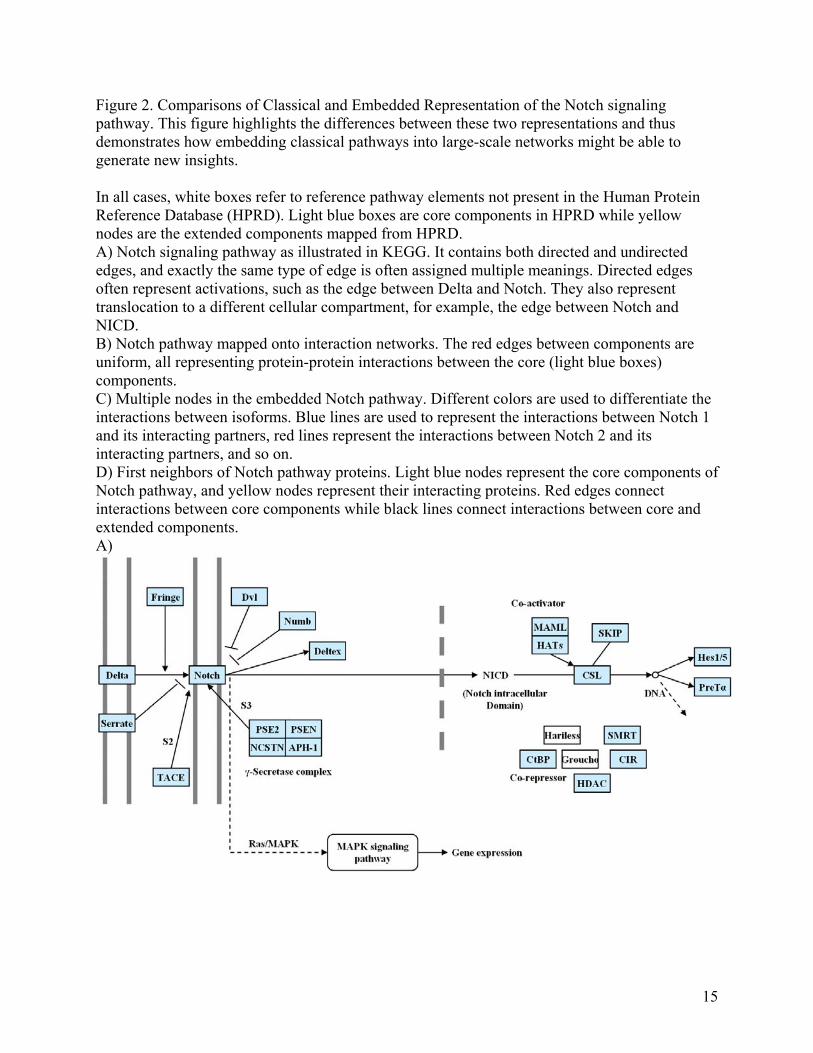
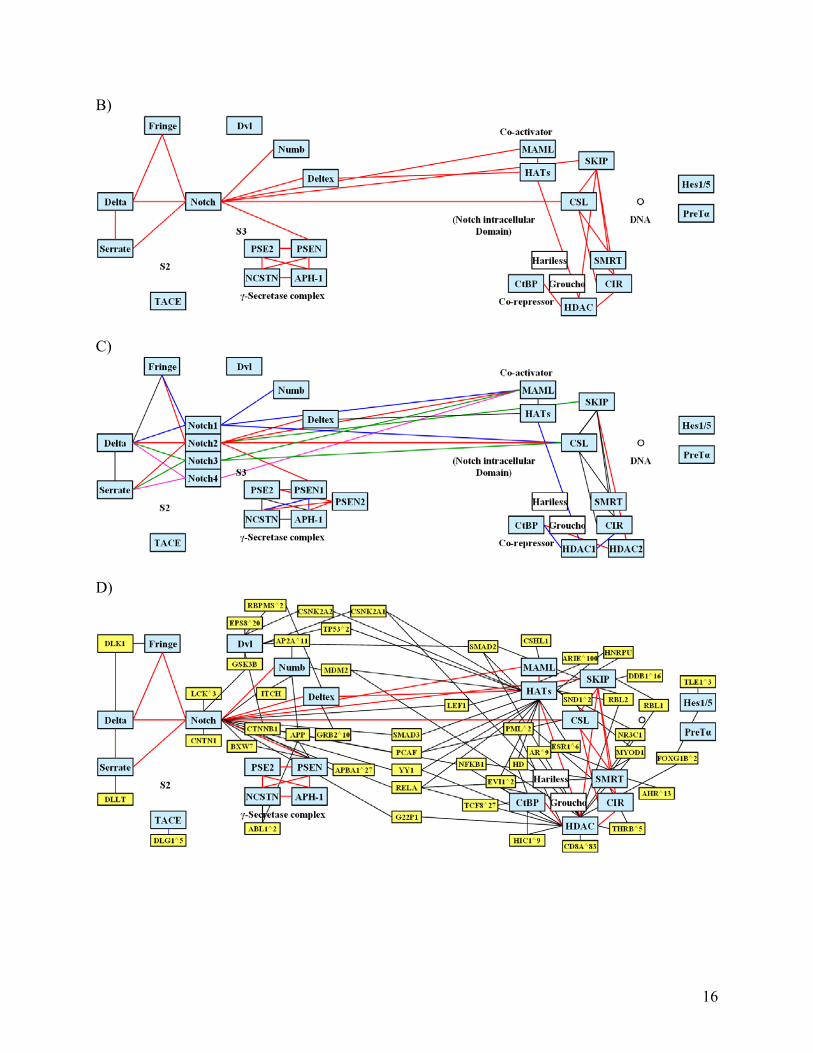
Figure 2. Comparisons of Classical and Embedded Representation of the Notch signaling pathway. This figure highlights the differences between these two representations and thus demonstrates how embedding classical pathways into large-scale networks might be able to generate new insights. In all cases, white boxes refer to reference pathway elements not present in the Human Protein Reference Database (HPRD). Light blue boxes are core components in HPRD while yellow nodes are the extended components mapped from HPRD. A) Notch signaling pathway as illustrated in KEGG. It contains both directed and undirected edges, and exactly the same type of edge is often assigned multiple meanings. Directed edges often represent activations, such as the edge between Delta and Notch. They also represent translocation to a different cellular compartment, for example, the edge between Notch and NICD. B) Notch pathway mapped onto interaction networks. The red edges between components are uniform, all representing protein-protein interactions between the core (light blue boxes) components. C) Multiple nodes in the embedded Notch pathway. Different colors are used to differentiate the interactions between isoforms. Blue lines are used to represent the interactions between Notch 1 and its interacting partners, red lines represent the interactions between Notch 2 and its interacting partners, and so on. D) First neighbors of Notch pathway proteins. Light blue nodes represent the core components of Notch pathway, and yellow nodes represent their interacting proteins. Red edges connect interactions between core components while black lines connect interactions between core and extended components. A)
15
B)
C)
D)
16
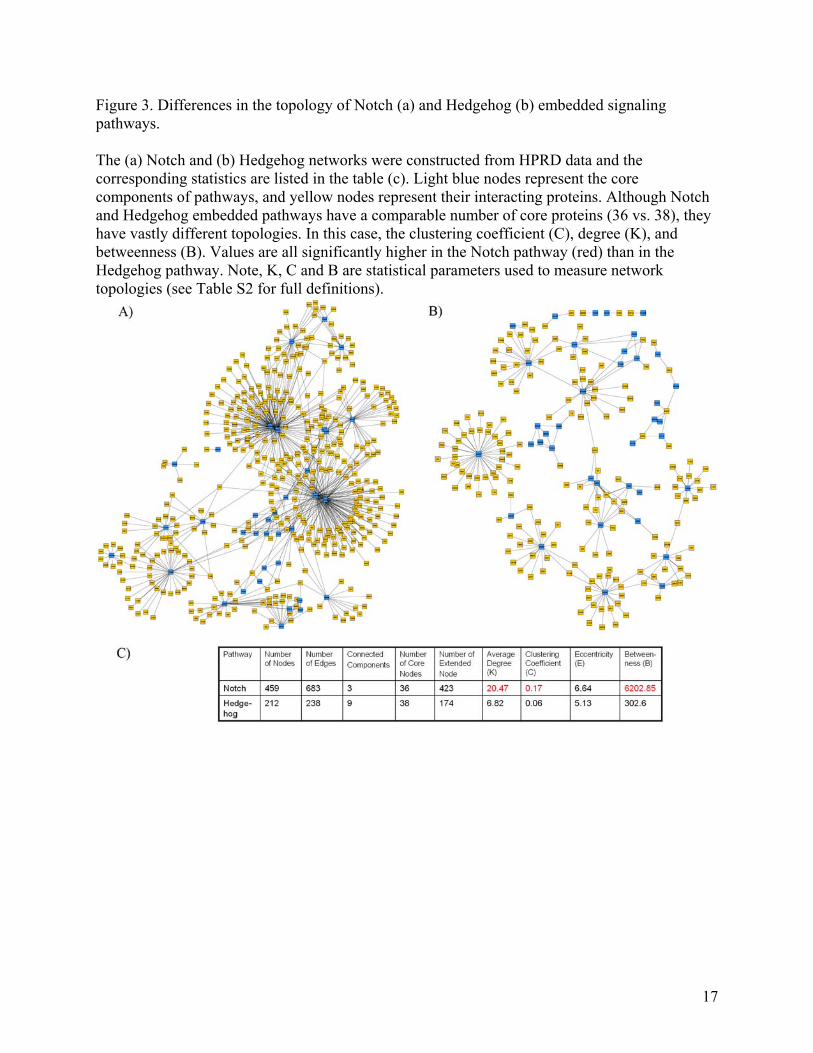
Figure 3. Differences in the topology of Notch (a) and Hedgehog (b) embedded signaling pathways. The (a) Notch and (b) Hedgehog networks were constructed from HPRD data and the corresponding statistics are listed in the table (c). Light blue nodes represent the core components of pathways, and yellow nodes represent their interacting proteins. Although Notch and Hedgehog embedded pathways have a comparable number of core proteins (36 vs. 38), they have vastly different topologies. In this case, the clustering coefficient (C), degree (K), and betweenness (B). Values are all significantly higher in the Notch pathway (red) than in the Hedgehog pathway. Note, K, C and B are statistical parameters used to measure network topologies (see Table S2 for full definitions).
17
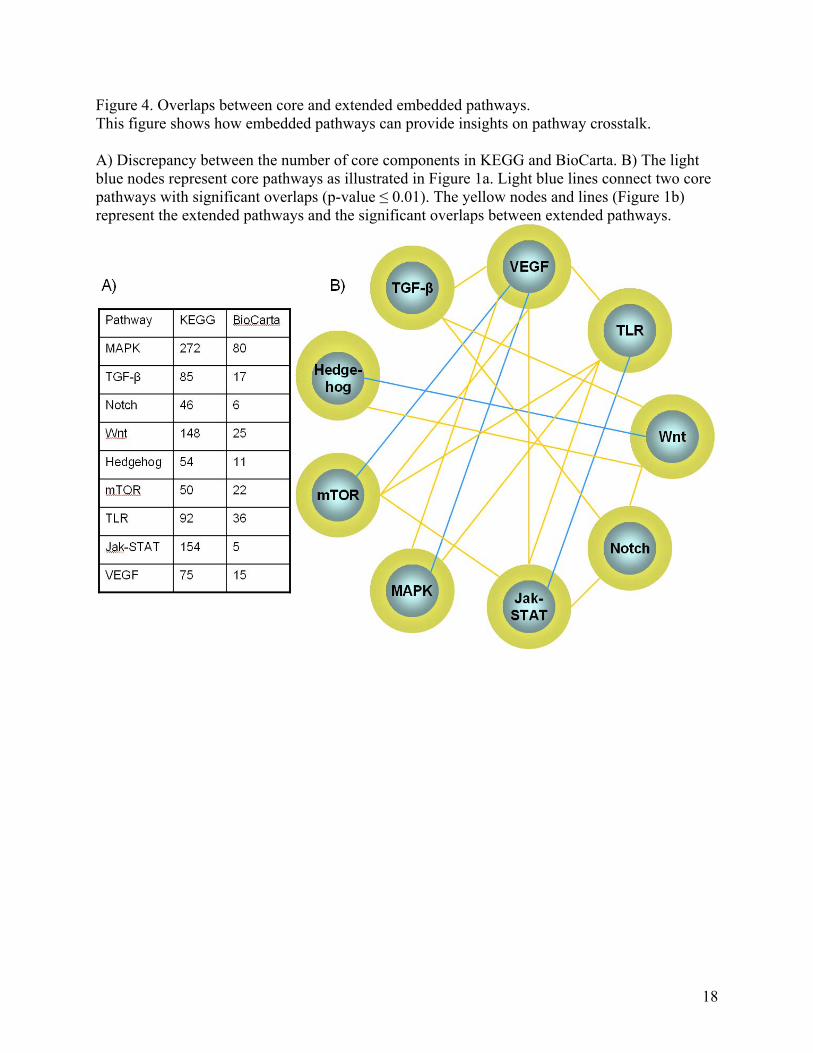
Figure 4. Overlaps between core and extended embedded pathways. This figure shows how embedded pathways can provide insights on pathway crosstalk. A) Discrepancy between the number of core components in KEGG and BioCarta. B) The light blue nodes represent core pathways as illustrated in Figure 1a. Light blue lines connect two core pathways with significant overlaps (p-value ≤ 0.01). The yellow nodes and lines (Figure 1b) represent the extended pathways and the significant overlaps between extended pathways.
18
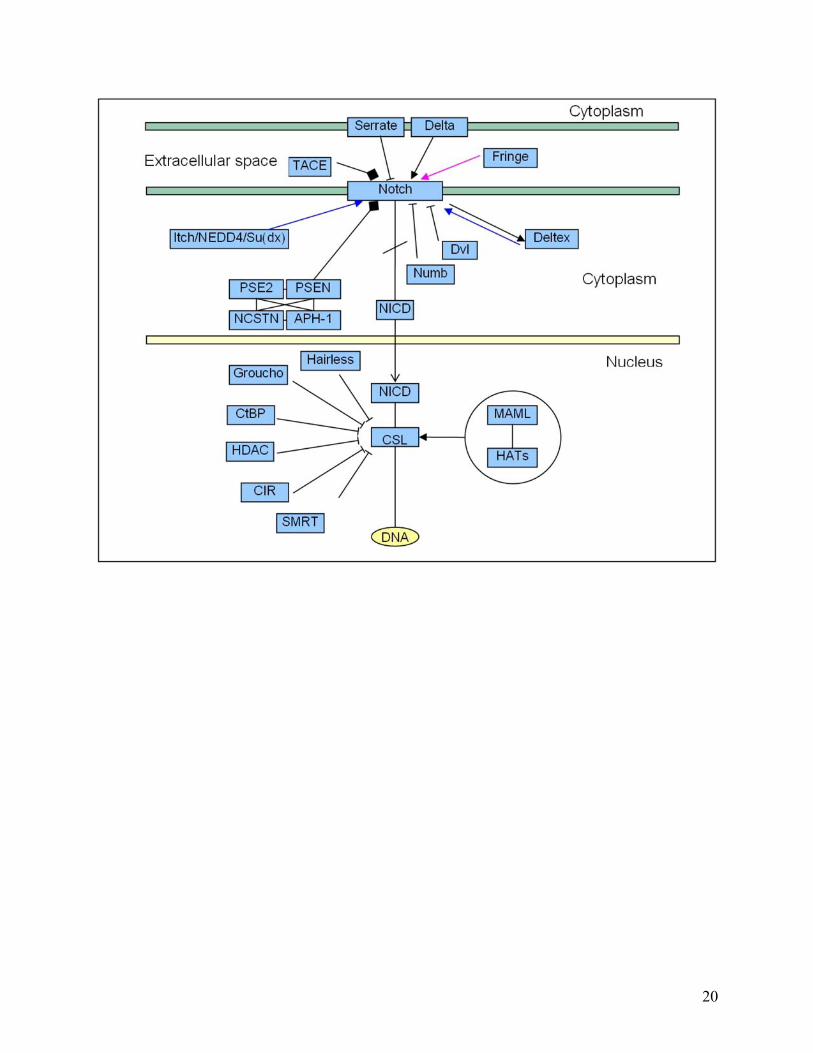
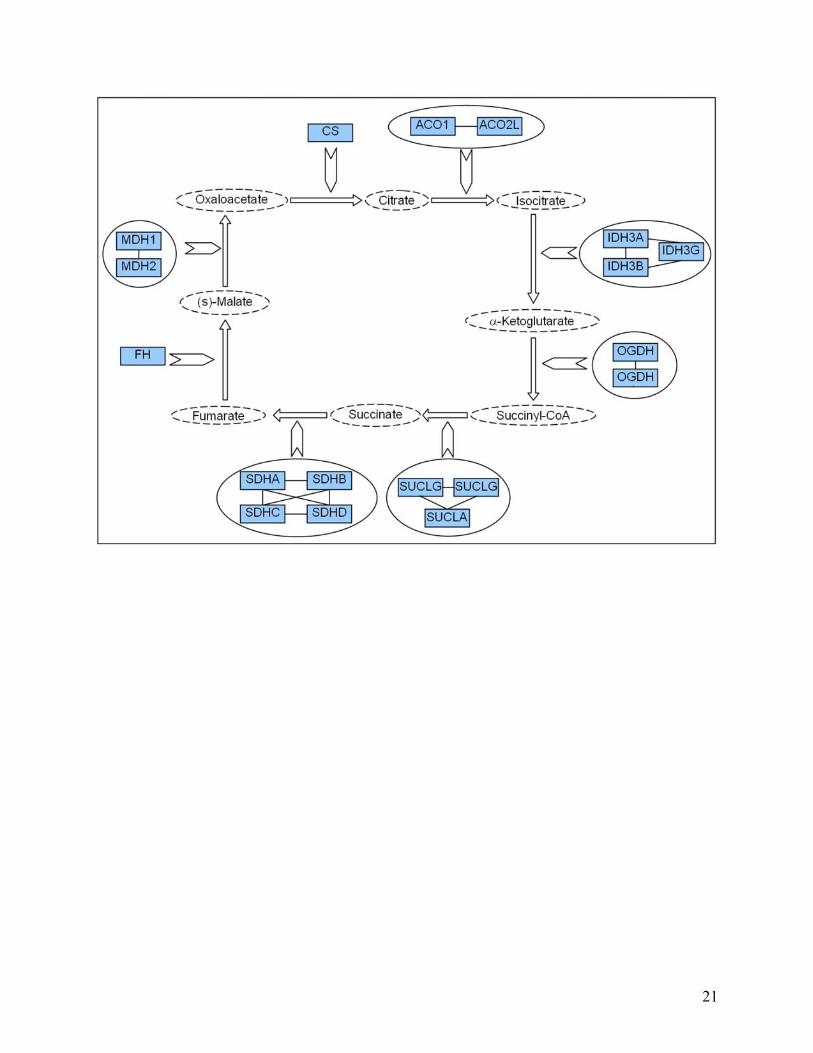
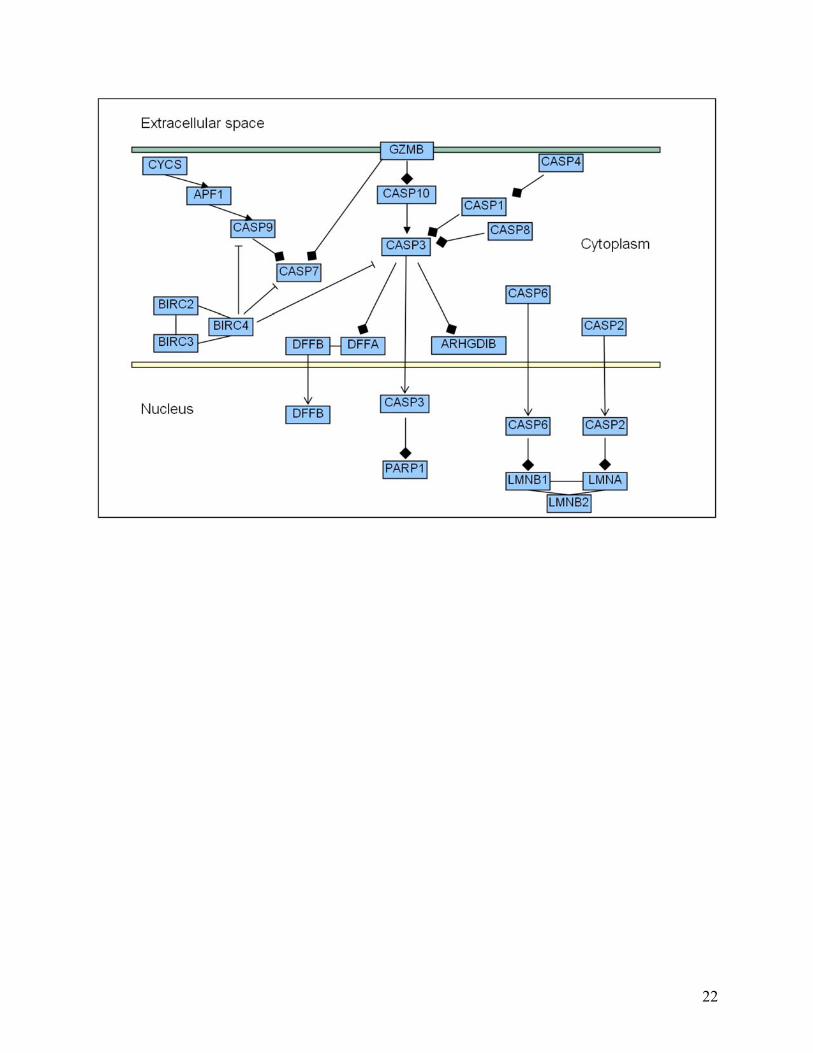
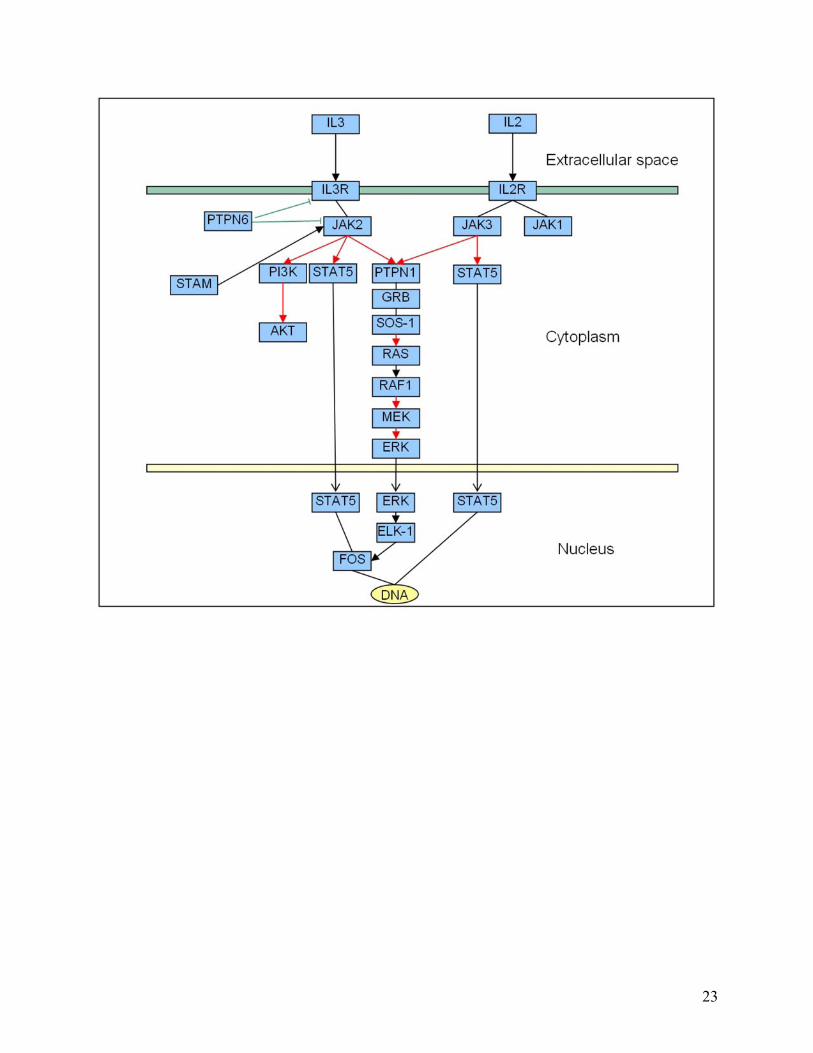
Figure 5. Biochemical pathways redrawn using the new edge ontology. The following illustrates how we propose pathways can be redrawn in a more representative fashion using our proposed new edge ontology. Four different types of pathway are shown to highlight how more information can be conveyed by a more descriptive ontology. In particular, compare (a) below with Figure 2a. In this case, for example, the interaction between TACE and Notch is more clearly seen to be a cleavage reaction in (a) below, whereas in Figure 2a, we are unable to tell what type of biochemical interaction occurs between TACE and Notch. Note, we have used solid ellipses to enclose complexes, and that the complexes are also linked by solid lines to indicate known physical interactions. In other contexts, different lines can be used given our uncertainty in the types of actual association. (a) Notch signaling pathway: Fringe is shown to activate Notch through glycosylation (pink thick arrow). Delta and Serrate have opposite effects: one activating (black thick arrow) and the other inhibiting (black line with bar ending) Notch, respectively. TACE catalyzes the cleavage (black bar with diamond ending) of Notch receptor. We consistently use binding edges among the components of the complex made by PSE2, PSEN, NCSTN, and APH-1 (black solid lines). The Notch intra-cellular domain (NICD) translocates (black thin arrow) into the nucleus and promotes transcription in combination with CSL, MAML, and HATs. (b) Citric acid Cycle: The ‘catalysis’ edge connects an enzyme to a “chemical reaction” edge. The main chemicals that take part in the interactions are represented by dashed ellipses. In the ellipse that includes IDH3A, IDH3B and IDH3G, we found direct interactions between each protein pair. However, in the case one does not know the specific type of interactions involved in a complex, such as in the complexes arising from TAP-tagging experiments, we could use “Association” or “Binding or Association” defined in the edge ontology to represent the pairwise relationship between proteins in this complex. (c) Caspase cascade: This pathway involves mainly cleavage interactions among caspases, enzymes that cleave other proteins after an aspartic acid residue. (d) Jak-STAT signaling pathway: below is a portion of the pathway, including the response to Interleukin 2 and 3 (ILK2 and ILK3). JAKs bind to interleukin receptors and are activated by the binding of the ligand (black thick arrow). JAK1 and JAK3 activate STAT5 by phosphorylation (red thick arrow), which translocates (black thin arrow) to the nucleus and activates transcription of its target genes (black edge). Tyrosine phosphatase (PTPN6) inhibits the cytokine receptor and JAK1 through de-phosphorylation (green line with bar ending). JAK1 and JAK3 activate another protein tyrosine phosphatase (PTPN11), which is bound to GRB and SOS-1. This complex activates the MAPK signaling pathway.
19
20
21
22
23
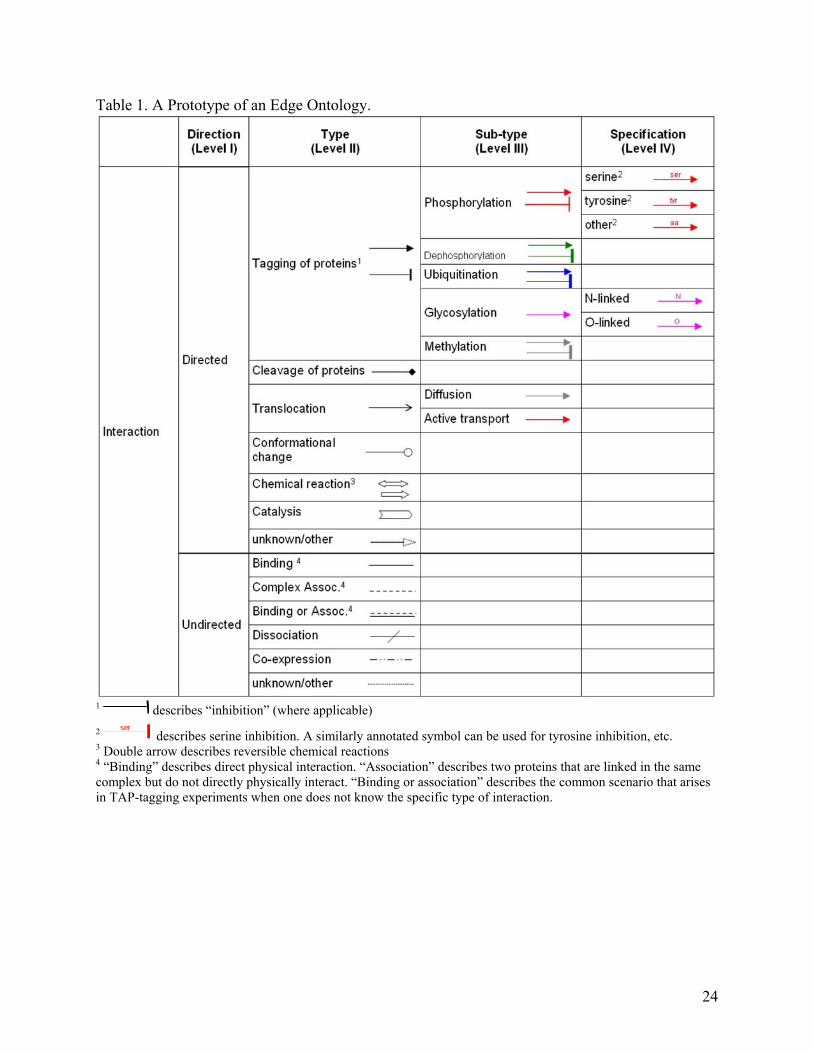
Table 1. A Prototype of an Edge Ontology.
1 describes “inhibition” (where applicable) 2
serdescribes serine inhibition. A similarly annotated symbol can be used for tyrosine inhibition, etc.
3 Double arrow describes reversible chemical reactions 4 “Binding” describes direct physical interaction. “Association” describes two proteins that are linked in the same complex but do not directly physically interact. “Binding or association” describes the common scenario that arises in TAP-tagging experiments when one does not know the specific type of interaction.
24