Embed Size (px)
Citation preview
RISK: Health, Safety & Environment (1990-2002) RISK: Health, Safety & Environment (1990-2002)
Volume 13 Number 1 Article 6
March 2002
Comparing Bottled Water and Tap Water: Experiments in Risk Comparing Bottled Water and Tap Water: Experiments in Risk
Communication Communication
Branden B. Johnson
Follow this and additional works at: https://scholars.unh.edu/risk
Part of the Communication Commons, Environmental Monitoring Commons, Public Health Commons,
and the Water Resource Management Commons
Repository Citation Repository Citation Branden B. Johnson, Comparing Bottled Water and Tap Water: Experiments in Risk Communication, 13 RISK 69 (2002).
This Article is brought to you for free and open access by the University of New Hampshire – Franklin Pierce School of Law at University of New Hampshire Scholars' Repository. It has been accepted for inclusion in RISK: Health, Safety & Environment (1990-2002) by an authorized editor of University of New Hampshire Scholars' Repository. For more information, please contact [email protected].
Comparing Bottled Water and Tap Water: Experiments in Risk Communication Comparing Bottled Water and Tap Water: Experiments in Risk Communication
Cover Page Footnote Cover Page Footnote This research was funded by the New Jersey Department of Environmental Protection (NJDEP).
This article is available in RISK: Health, Safety & Environment (1990-2002): https://scholars.unh.edu/risk/vol13/iss1/6
Comparing Bottled Water and Tap Water:Experiments in Risk Communication
Branden B. Johnson*
IntroductionRisk comparisons have evoked far less empirical study than
rhetorical support.1 Focus groups probing public responses to riskcomparisons found citizens dubious about comparisons involvingdecisions they saw as outside of their control (e.g., facility siting), butopen to risk comparisons relevant to household and personaldecisions. 2 Some of the public response risk comparisons volunteeredby such focus groups were of citizens who compared the quality ofbottled water to the quality of tap water delivered by utilities. Twofocus groups devoted to drinking water information elicitedspontaneous requests for comparisons of a utility's water to bottledwater. 3 A later survey of a different utility's customers found that63% wanted a comparison of their own utility's water quality to that ofother utilities. 4
* Dr. Johnson is a Research Scientist in the'Bureau of Risk Analysis, Division of Science,Research and Technology, New Jersey Department of Environmental Protection (NJDEP),Trenton, NJ. He has a Ph.D. in Geography and an M.A. in Environmental Affairs from ClarkUniversity, and a B.A. in Environmental Values and Behavior from University of Hawaii-Manoa. This research was funded by NJDEP. The views expressed here do not necessarilyrepresent those of the agency. E-mai. [email protected] See e.g. Emilie Roth et al., What Do We Know About Making Risk Comparisons?, 10Risk Anal. 375 (1990); Paul Slovic et al., What Should We Know About Making RiskComparisons?, 10 RiskAnal. 389 (1990); William R. Freudenburg & Julie A. Rursch, TheRisks of "Putting the Numbers in Context" A Cautionary Tale, 14 Risk Anal. 949 (1994);Branden B. Johnson, Stability and Inoculation of Risk Comparisons' Effects Under Conflict:Replicating and Extending the "Asbestos Jury" Study by Slovic et al., Risk Anal. (forthcoming2002); Branden B. Johnson, Are Some Risk Comparisons More Effective Under Conflict?: AReplication and Extension of Roth et al., manuscript under review (2000).2 Branden B. Johnson, Risk Comparisons in a Democratic Society: What People Say TheyDo and Do Not Want, 10 Risk- Health, Safety & Environment 221 (1999).3 Branden B. Johnson, "Consumer Confidence Report" for Drinking WaterContamination: Initial Studies on Public Response, presented at the Society for Risk Analysismeeting (Dec. 10, 1997).4 Branden B. Johnson, Utility Customers' Views of the "Consumer Confidence Report" ofDrinking Water Quality, 11 Risk Health, Safety & Environment 309 (2000).
13 Risk- Health, Safety & Environment 69 [Spring 2002]
This paper reports the results of two small exploratory experimentstesting comparisons of a utility's water quality to that of other utilitiesand to bottled water quality. These experiments tested whether utilitycustomers: (1) welcomed comparisons in practice; (2) changed theirviews of their own utility's relative water quality; (3) changed theirbehavioral intentions to use bottled water or home treatment deviceswhen exposed to a one-time comparison; or (4) preferred a number-only comparison to a more detailed, nuanced contrast. The aim of thetwo exploratory experiments reported here was to provide the firstknown empirical study of the impact of comparisons for a specific riskissue of high salience to citizens (i.e., that of drinking water quality forutility customers).
BackgroundFocus group comments indicated that people desiring comparisons
to other utilities' water quality or to bottled water quality wanted to bereassured that their own utility's water was relatively safe. 5 Utilitystaff also have suggested that such comparisons would reducecustomers' concerns. Thus two possible hypotheses are suggested:* HI. Comparisons will reduce consumers' reports that the quality oftheir water is worse than other utilities' water or bottled water.* H2. Comparisons will reduce consumers' reported concern aboutthe safety of their own tap water.
Bottled water consumption has been increasing in the UnitedStates. 6 A recent statewide New Jersey poll found 60% ofrespondents used bottled or filtered water for drinking, while just 14%used only tap water.7 Reasons given by consumers for shifting fromtap water vary by population and time, health concerns, aestheticcriteria (e.g., taste, odor, color), and convenience. 8
5 Johnson, supra n. 2; Johnson, supra n. 3.6 For example, in 1999 bottled water consumption grew by 11%, to seventeen gallons per
American, "the fastest growing beverage in the country." See Dean E. Murphy, Tap or Bottle?Old Issue, New Slant, 41 N.Y. Times (Sept. 17, 2000).
7 Environmental Attitudes in New Jersey: Treading (Dirty) Water, Release EP 125-4. TheStar-Ledger/Eagleton-Rutgers Poll (April 2, 2000) [hereinafter Environmental Attitudes].8 A study in four small water supply systems in Oregon found that a town with a chronic
water quality problem had significantly higher bottled water consumption than towns withshort-term or no official health-related water quality problem. See Edith C. Anadu & Anna K.Harding, Risk Perception and Bottled Water Use, 92 J. Amer. Water Works Assn. 82 (2000).
Johnson: Bottled & Tap Water: Experiments in Risk Communication 71
Secondary drinking water standards for factors that can affectaesthetic qualities of water are not enforceable. Water that is "safe" forhealth might still offend consumers' taste, smell, or vision (as withdiscolored water). Since many bottled waters come from groundwatersources less prone to some of these aesthetically-offending substances,shifting to bottled water can reduce, or be thought to reduce, aestheticproblems. Because "risk" comparisons based on attributes, such aswhether tap water or bottled water has met primary health standards,does not address aesthetic or convenience issues, it is possible that suchcomparisons to health standards will not shift beliefs about relative
water quality. Because visual and olfactory cues (e.g., smelly or dirty-looking water) can seem to indicate unhealthiness, and even triggersomatic changes reinforcing aversion, they might strengthen mentalmodels of bottled water against messages seeking to correct theirerrors.
9
By contrast, comparisons to other utilities' water quality might havelower salience than comparisons to bottled water. On average,consumers have less of a chance to actually taste any difference betweenother utilities' tap water and their own tap water than they do to tastedifferences with bottled water. Consumers can exploit better waterquality at other utilities only by moving their entire household, whilebottled water is easily accessible. If consumers' mental model of tapwater assumes that tap water is generically bad, a comparison thatshows that their own water is as good as other utilities' water is hardlyreassuring. In other words, changing one's view of the relative quality ofother tap water might occur easily because changing that view has fewconsequences. Thus, one might hypothesize that:a H3. Comparisons will have less of an effect on consumers'judgments of the relative quality of bottled water than on theirjudgments of other utilities' water quality.
9 Donald G. MacGregor & Raymond Fleming, Risk Perception and Symptom Reporting,16 Risk Anal. 773 (1996); Katherine E. Rowan, Effective Explanation of Uncertain andComplex Science, in Communicating Uncertainty- Media Coverage of New and ControversialScience (Sharon M. Friedman et al. eds., 1999).
13 Risk. Health, Safety & Environment 69 [Spring 2002]
Because behavioral intentions are affected by factors beyondexpressed views about risk or relative quality (e.g., habit, otherhousehold members), 10 we should also expect, contrary to opinions of
some utility staff, that:° H4. Comparisons will affect consumers' behavioral intentions on
bottled water use or home treatment of water less than they will affecttheir views or expressed concern about water quality.
Most proposed or tested risk comparisons have been in the form oftables of numbers.1 1 Similarly, the federal government requires thatutilities' annual water quality reports center around a table of numbersabout contaminant levels found in the water and associated healthstandards and goals. 12 Yet, a table of numbers alone might provide aninadequate comparison. For example, utility staff, drinking-waterregulators, and the Natural Resources Defense Council agree that
bottled water and tap water meeting the health standards (i.e.,maximum contaminant limits, or MCLs), are equally safe or unsafe. 13
The probability that bottled water (at least varieties using only groundwater) and tap water suffer (or benefit, in the case of fluoride) from
particular kinds of contaminants varies. 14 These are not caveats thatcan be conveyed by numbers alone, nor do they unequivocally show one
source safer or better than the other. However, some analysts havesuggested that "balanced" stories about risk can have unintendedconsequences. For example, Mazur asserted that positive coverage of
hazards by the mass media can make risks more salient merely bymentioning that they exist, even if there are large net benefits. 1 5
10 See e.g. Irwin Deutscher, What We Say/What We Do (Scott Foresman 1973); Irwin
Deutscher et al., Sentiments and Acts (Aldine de Gruyter 1993).11 See e.g. Bernard Cohen and I-Sing Lee, A Catalog of Risks, 36 Health Physics 707
(1979); Richard Wilson, Analyzing the Daily Risks of Life, 81 Tech. Rev. 40 (1979); Roth etal., supra n. 1; Slovic et al., supra n. 1.12 Johnson, supra n. 4.
13 Erik D. Olson, Bottled Water: Pure Drink or Pure Hype?, attachment to the NRDC
Citizen Petition to the U.S. Food and Drug Administration for Improvements in FDA'sBottled Water Program (February 1999) (available at <www.nrdc.org/water/drinking/bw/bwinx.asp>).14 For example, most bottled waters are not fluoridated, so tap water is better at preventing
tooth decay. Bacterial levels in bottled water are generally lower than in tap water, but about20% of bottled waters in one study contained far higher bateria levels than Cleveland tap water.See Tap Water Has Edge on Fluoride Front, N.Y. Times F8 (Mar. 21, 2000).15 See Allan Mazur, The Dynamics of Technical Controversy, 31 J. Comm. 106 (1981);
Johnson: Bottled & Tap Water: Experiments in Risk Communication 73
"Social amplification of risk" might stem in part from discussions of
both advantages and disadvantages, thus making audiences aware andconcerned about unknown risks. 16 One study found one-sidedmessages more persuasive to those initially favorable to the message andto less-educated people, and two-sided messages more persuasive toinitial opponents and the better-educated. 17 Thus the null hypothesismay or may not be appropriate:0 H5. Comparisons comprised solely of numbers (e.g., percentage ofwaters violating standards) will have the same effect on consumers'views of relative water quality, concern, and behavioral intentions ascomparisons that provide a more balanced, narrative discussion.
The value of these two experiments is that even the empiricalstudies of risk comparisons have either not used specific examples ofsuch comparisons, or have concerned comparisons for which citizendemand was unknown (e.g., risks of industry emissions). Suchcomparisons also appear to violate the principle that a "comparison
between two alternatives is (acceptability)-relevant to the extent that
one of these alternatives can replace the other." 18 People can and dosubstitute bottled water for tap water, or the reverse. However, just as
the risk of a local factory cannot be replaced by the risk of a factoryelsewhere, one cannot easily substitute one utility's water for water fromanother utility. This case thus offers the first test of how people react toa comparison of true replacement alternatives.
MethodExperimental Treatments
Overall, there were four versions of the experimental text: (1) a one-page report on the utility's tap water quality; (2) a one-page reportcomparing the utility's water quality to that of other utilities in New
Jersey; (3) a one-page report comparing the utility's water quality to
Allan Mazur, Nuclear Power, Chemical Hazards, and the Quantity of Reporting, 28 Minerva294 (1990).16 Roger E. Kasperson et al., The Social Amplification of Risk: A Conceptual Framework, 8
RiskAnal. 177 (1988).17 C.I. Hovland et al., Experiments on Mass Communication (John Wiley 1965), cited in
Katherine A. McComas & Cliff W. Scherer, Providing Balanced Risk Information in SurveysUsed as Citizen Participation Mechanisms, 12 Society & Nat. Resources 107, 110 (1999).18 Sven Ove Hansson, Incomparable Risks, in Proceedings: New Risk Frontiers 594, 595(Britt-Marie Drottz-Sj6berg ed., Center for Risk Research 1997).
13 Risk: Health, Safety & Environment 69 [Spring 2002]
that of bottled water sold in New Jersey; and (4) a three-page version ofthe bottled water comparison. 19 Experiment 1 used all four versions.Experiment 2 excluded the inter-utility comparison and used aslightly-abridged version of the long bottled-water comparison. Bothutilities' water met health standards, both in fact and in thesehypothetical reports.
The hypothetical water quality reports grouped contaminants intofive classes (i.e., volatile organic chemicals, inorganic chemicals,synthetic organic chemicals, radioactive substances, total coliformbacteria), and gave the required testing frequencies for each class.Annual reports to customers, required by federal law, must report oneach contaminant found in the drinking water. The grouping used heresaved space, as did the omission of other information required in annualreports. The fact that the utility did not violate health standards washighlighted for each class and was followed by information on detectedlevels of individual contaminants in the class, including comparisons toapplicable standards. 20 The comparisons to other utilities and bottledwater simply added the percentages of all utilities or all regulatedbottled waters with violations or detections to the utility-only format.An example of the one-page reports for bottled water appears in Figure1.
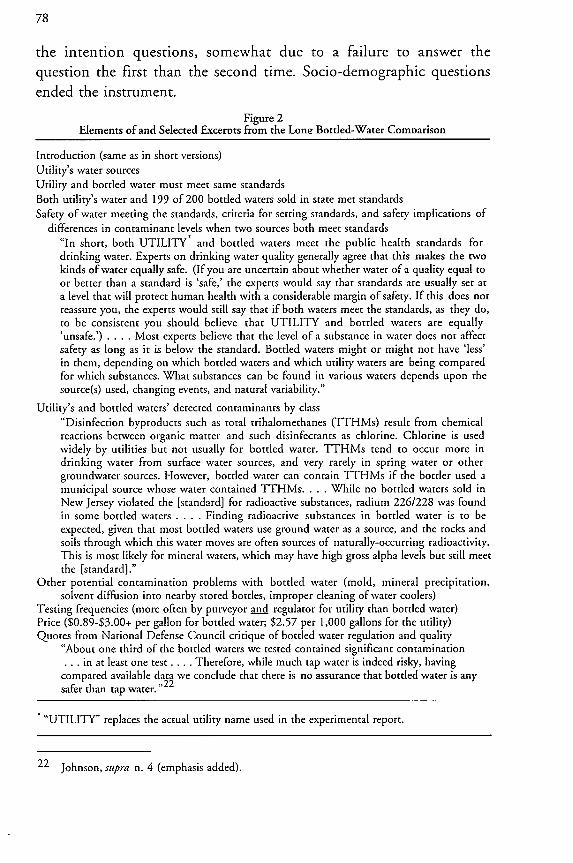
The long comparison to bottled water included all of thisinformation, but in a different format and with added material. SeeFigure 2 for a list of its elements, including selected excerpts fromExperiment 1. Experiment 2's version omitted the section on watersupply sources and trimmed the length of other sections slightly, butretained all themes otherwise. Overall, the long version of the bottled-water comparison provided a more balanced and detailed contrast ofbottled and tap water than did the short version (i.e., Hypothesis 5).For example, the quotations in Figure 2 add explicit messages to theshorter version's risk numbers that experts (and a well-known
19 Data sources were: utility's water quality (utility's annual report); utilities' water quality
statewide (annual report, Bureau of Safe Drinking Water, NJDEP); bottled water quality(annual report, New Jersey Department of Health and Senior Services, which regulates all suchwater sold in the state).20 Thus all experimental texts included a comparison of what was found in the water to the
relevant standard, as required in all annual water quality reports. The aim here was to test theeffect of additional comparisons to the quality of water from other sources.
Johnson: Bottled & Tap Water: Experiments in Risk Communication 75
environmentalist critic of risk managers, the Natural Resources DefenseCouncil) believe bottled water and tap water to be equally safe orunsafe. These quotations also pointed out, in general and for particularclasses of contaminants, that determining whether tap water or bottledwater is cleaner depends upon a variety of factors and that blanketassertions are inappropriate.
The bottled water comparison showed that for four of the fivecontaminant categories, neither the target utility's water nor the 200bottled waters certified in the state violated the public health standard.For the fifth category, inorganic chemicals, one bottled water hadviolated a standard. For two of the five categories, neither the targetutility's water nor bottled waters had detected contaminants below thestandard. For three categories, both the target utility's water andvarying numbers of bottled waters (one, to about 50%) had detectedcontaminants. As for the utility comparison, four of the fivecontaminant categories featured at least one utility violating a standard,up to 6% of all utilities in the state, while the target utility had noviolations. Synthetic organic chemicals had no difference across utilities.Volatile organic chemicals, inorganic chemicals, and radioactivity weredetected in both the target utility's water and in varying percentages(25-100%) of utility water statewide. Thus, one might conclude that:the target utility water was identical both to bottled water and to other
utilities' water on detections of contaminants; that it was similar tobottled water on violations of standards; and that it was superior to afew other utilities on violations. In the long version of the bottled watercomparison, the assertion that tap water was equally safe (or unsafe) wasmeant to reinforce these numbers.
13 Risk- Health, Safety & Environment 69 [Spring 2002]
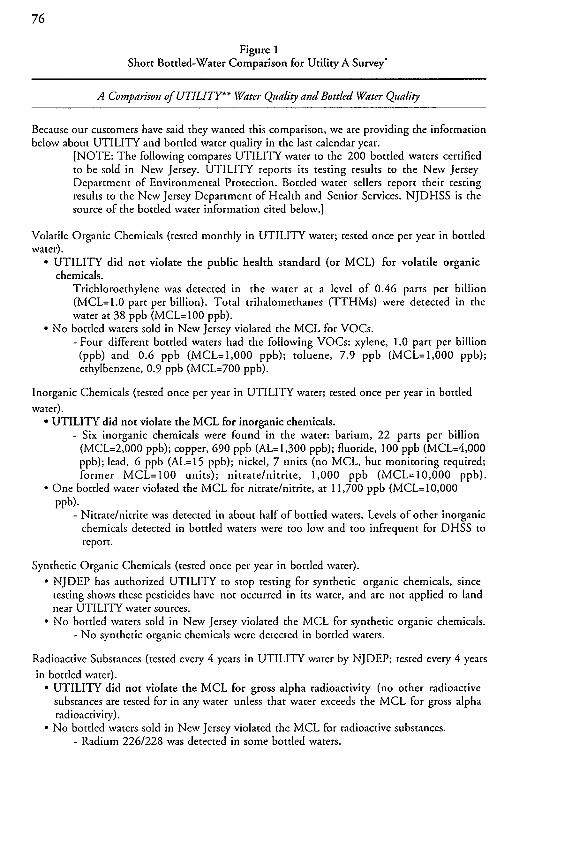
Figure 1Short Bottled-Water Comparison for Utility A Survey*
A Comparison of UTILITY Water Quality and Bottled Water Quality
Because our customers have said they wanted this comparison, we are providing the informationbelow about UTILITY and bottled water quality in the last calendar year.
[NOTE: The following compares UTILITY water to the 200 bottled waters certifiedto be sold in New Jersey. UTILITY reports its testing results to the New JerseyDepartment of Environmental Protection. Bottled water sellers report their testingresults to the New Jersey Department of Health and Senior Services. NJDHSS is thesource of the bottled water information cited below.]
Volatile Organic Chemicals (tested monthly in UTILITY water; tested once per year in bottledwater).
" UTILITY did not violate the public health standard (or MCL) for volatile organicchemicals.
Trichloroethylene was detected in the water at a level of 0.46 parts per billion(MCL=1.0 part per billion). Total trihalomethanes (TTHMs) were detected in thewater at 38 ppb (MCL= 100 ppb).
" No bottled waters sold in New Jersey violated the MCL for VOCs.- Four different bottled waters had the following VOCs: xylene, 1.0 part per billion
(ppb) and 0.6 ppb (MCL=l,000 ppb); toluene, 7.9 ppb (MCL=I,000 ppb);ethylbenzene, 0.9 ppb (MCL=700 ppb).
Inorganic Chemicals (tested once per year in UTILITY water; tested once per year in bottled
water)." UTILITY did not violate the MCL for inorganic chemicals.
- Six inorganic chemicals were found in the water: barium, 22 parts per billion(MCL=2,000 ppb); copper, 690 ppb (AL=I,300 ppb); fluoride, 100 ppb (MCL=4,000ppb); lead, 6 ppb (AL=15 ppb); nickel, 7 units (no MCL, but monitoring required;former MCL=I00 units); nitrate/nitrite, 1,000 ppb (MCL=10,000 ppb).
" One bottled water violated the MCL for nitrate/nitrite, at 11,700 ppb (MCL=10,000ppb).
- Nitrate/nitrite was detected in about half of bottled waters. Levels of other inorganicchemicals detected in bottled waters were too low and too infrequent for DHSS toreport.
Synthetic Organic Chemicals (tested once per year in bottled water).
" NJDEP has authorized UTILITY to stop testing for synthetic organic chemicals, sincetesting shows these pesticides have not occurred in its water, and are not applied to landnear UTILITY water sources.
" No bottled waters sold in New Jersey violated the MCL for synthetic organic chemicals.- No synthetic organic chemicals were detected in bottled waters.
Radioactive Substances (tested every 4 years in UTILITY water by NJDEP; tested every 4 years
in bottled water)." UTILITY did not violate the MCL for gross alpha radioactivity (no other radioactive
substances are tested for in any water unless that water exceeds the MCL for gross alpharadioactivity).
" No bottled waters sold in New Jersey violated the MCL for radioactive substances.- Radium 226/228 was detected in some bottled waters.
Johnson: Bottled & Tap Water: Experiments in Risk Communication 77
Total Coliform Bacteria (tested twice per week in UTILITY water; tested once per week inbottled water; these bacteria do not themselves cause disease, but may signal that othermicroorganisms that do cause disease are in the water).
" UTILITY did not violate the MCL for coliform bacteria.- No coliform bacteria were detected in UTILITY water.
" No bottled waters sold in New Jersey violated the MCL for coliform bacteria.- No coliform bacteria were detected in bottled water.
This excludes the introductory material (definitions, etc.)."UTILITY" replaces actual utility name.
Instrument
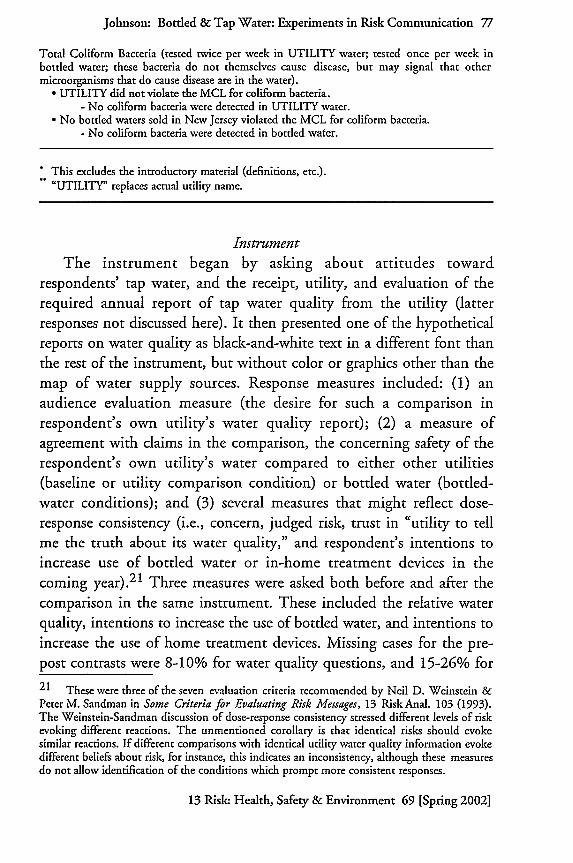
The instrument began by asking about attitudes towardrespondents' tap water, and the receipt, utility, and evaluation of therequired annual report of tap water quality from the utility (latterresponses not discussed here). It then presented one of the hypotheticalreports on water quality as black-and-white text in a different font thanthe rest of the instrument, but without color or graphics other than themap of water supply sources. Response measures included: (1) anaudience evaluation measure (the desire for such a comparison inrespondent's own utility's water quality report); (2) a measure ofagreement with claims in the comparison, the concerning safety of therespondent's own utility's water compared to either other utilities(baseline or utility comparison condition) or bottled water (bottled-water conditions); and (3) several measures that might reflect dose-response consistency (i.e., concern, judged risk, trust in "utility to tellme the truth about its water quality," and respondent's intentions toincrease use of bottled water or in-home treatment devices in thecoming year).2 1 Three measures were asked both before and after thecomparison in the same instrument. These included the relative waterquality, intentions to increase the use of bottled water, and intentions toincrease the use of home treatment devices. Missing cases for the pre-post contrasts were 8-10% for water quality questions, and 15-26% for
21 These were three of the seven evaluation criteria recommended by Neil D. Weinstein &
Peter M. Sandman in Some Criteria for Evaluating Risk Messages, 13 RiskAnal. 103 (1993).The Weinstein-Sandman discussion of dose-response consistency stressed different levels of riskevoking different reactions. The unmentioned corollary is that identical risks should evokesimilar reactions. If different comparisons with identical utility water quality information evokedifferent beliefs about risk, for instance, this indicates an inconsistency, although these measuresdo not allow identification of the conditions which prompt more consistent responses.
13 Risk: Health, Safety & Environment 69 [Spring 2002]
the intention questions, somewhat due to a failure to answer thequestion the first than the second time. Socio-demographic questionsended the instrument.
Figure 2Elements of and Selected Excerots from the Lona Bottled-Water Comparison
Introduction (same as in short versions)
Utility's water sourcesUtility and bottled water must meet same standardsBoth utility's water and 199 of 200 bottled waters sold in state met standardsSafety of water meeting the standards, criteria for setting standards, and safety implications of
differences in contaminant levels when two sources both meet standards"In short, both UTILITY and bottled waters meet the public health standards fordrinking water. Experts on drinking water quality generally agree that this makes the twokinds of water equally safe. (If you are uncertain about whether water of a quality equal toor better than a standard is 'safe,' the experts would say that standards are usually set ata level that will protect human health with a considerable margin of safety. If this does notreassure you, the experts would still say that if both waters meet the standards, as they do,to be consistent you should believe that UTILITY and bottled waters are equally'unsafe.') .... Most experts believe that the level of a substance in water does not affectsafety as long as it is below the standard. Bottled waters might or might not have 'less'in them, depending on which bottled waters and which utility waters are being comparedfor which substances. What substances can be found in various waters depends upon thesource(s) used, changing events, and natural variability."
Utility's and bottled waters' detected contaminants by class"Disinfection byproducts such as total trihalomerhanes (TTHMs) result from chemicalreactions between organic matter and such disinfectants as chlorine. Chlorine is usedwidely by utilities but not usually for bottled water. TTHMs tend to occur more indrinking water from surface water sources, and very rarely in spring water or othergroundwater sources. However, bottled water can contain TTHMs if the bottler used amunicipal source whose water contained TTHMs. . . .While no bottled waters sold inNew Jersey violated the [standard] for radioactive substances, radium 226/228 was foundin some bottled waters . . . .Finding radioactive substances in bottled water is to beexpected, given that most bottled waters use ground water as a source, and the rocks andsoils through which this water moves are often sources of naturally-occurring radioactivity.This is most likely for mineral waters, which may have high gross alpha levels but still meetthe [standard]."
Other potential contamination problems with bottled water (mold, mineral precipitation,solvent diffusion into nearby stored bottles, improper cleaning of water coolers)
Testing frequencies (more often by purveyor and regulator for utility than bottled water)Price ($0.89-$3.00+ per gallon for bottled water; $2.57 per 1,000 gallons for the utility)Quotes from National Defense Council critique of bottled water regulation and quality
"About one third of the bottled waters we tested contained significant contamination... in at least one test .... Therefore, while much tap water is indeed risky, having
compared available data we conclude that there is no assurance that bottled water is anysafer than tap water. 22
"UTILITY" replaces the actual utility name used in the experimental report.
22 Johnson, supra n. 4 (emphasis added).
Johnson: Bottled & Tap Water: Experiments in Risk Communication 79
Data CollectionBoth studies used random samples of New Jersey utility customers,
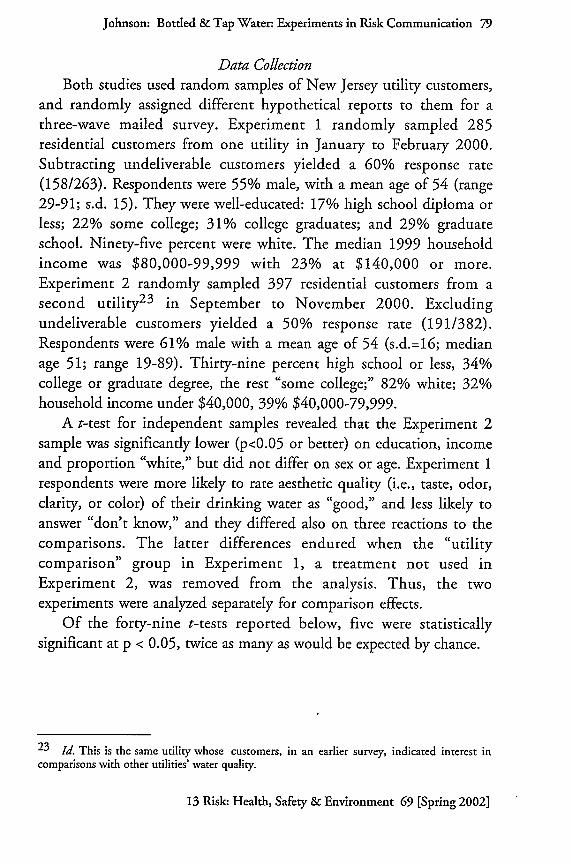
and randomly assigned different hypothetical reports to them for athree-wave mailed survey. Experiment 1 randomly sampled 285residential customers from one utility in January to February 2000.Subtracting undeliverable customers yielded a 60% response rate(158/263). Respondents were 55% male, with a mean age of 54 (range29-91; s.d. 15). They were well-educated: 17% high school diploma orless; 22% some college; 31% college graduates; and 29% graduateschool. Ninety-five percent were white. The median 1999 householdincome was $80,000-99,999 with 23% at $140,000 or more.Experiment 2 randomly sampled 397 residential customers from asecond utility2 3 in September to November 2000. Excludingundeliverable customers yielded a 50% response rate (191/382).Respondents were 61% male with a mean age of 54 (s.d.=16; medianage 51; range 19-89). Thirty-nine percent high school or less, 34%college or graduate degree, the rest "some college;" 82% white; 32%household income under $40,000, 39% $40,000-79,999.
A t-test for independent samples revealed that the Experiment 2sample was significantly lower (p<0.05 or better) on education, incomeand proportion "white," but did not differ on sex or age. Experiment 1respondents were more likely to rate aesthetic quality (i.e., taste, odor,clarity, or color) of their drinking water as "good," and less likely toanswer "don't know," and they differed also on three reactions to thecomparisons. The latter differences endured when the "utilitycomparison" group in Experiment 1, a treatment not used inExperiment 2, was removed from the analysis. Thus, the twoexperiments were analyzed separately for comparison effects.
Of the forty-nine t-tests reported below, five were statisticallysignificant at p < 0.05, twice as many as would be expected by chance.
23 Id. This is the same utility whose customers, in an earlier survey, indicated interest in
comparisons with other utilities' water quality.
13 Risk- Health, Safety & Environment 69 [Spring 2002]
ResultsGeneral Attitudes
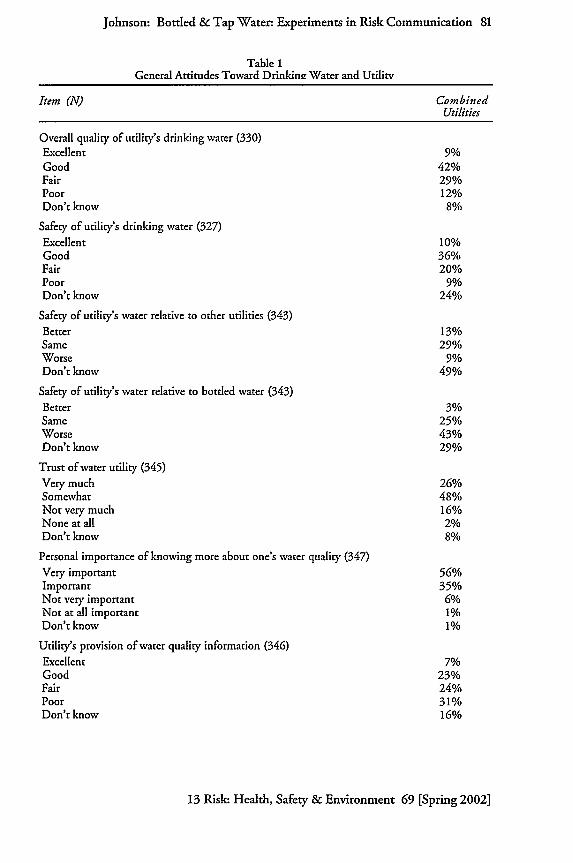
Table 1 shows responses to baseline questions (i.e., before
respondents read hypothetical water quality reports). About half of the
respondents rated their water quality as "fair" or "poor." Half could not
compare the safety of their utility's water to that of other utilities, but
those who did mostly rated it at least as good. A third were unable to
compare it with bottled water, but nearly one-half of the total thought
the utility's water was worse than bottled water. The importance of
knowing about water quality was rated as high; only one-quarter
reported that they were more than "somewhat" trusting of their utility,
and over half rated its provision of water quality information as only
"fair" or "poor."24 About half of the combined samples used bottled
water for half or more of their consumption, and about half used some
home treatment or purification device for their tap water. Overall, 56%
did one or both, consistent with the New Jersey statewide results cited
earlier.25
After reading the provided information (baseline or comparison),
across all conditions, 47% of the respondents were concerned about the
effects of drinking "this water"; 33% felt it presented "a serious health
risk"; and 43% did not trust the utility to be honest about the water
quality. About 84% of those in the baseline and utility conditions
wanted a comparison to other utilities in future water quality reports;
81% of those in the bottled-water conditions wanted a bottled-water
comparison.
24 The two utilities did not differ significantly on this measure, although one had mailed
annual water quality reports to every customer for years on its own initiative, while the othergave such reports to customers only upon request until required to do so by federal regulations.25 Environmental Attitudes, supra n. 7.
Johnson: Bottled & Tap Water: Experiments in Risk Communication 81
Table 1General Attitudes Toward Drinkinz Water and Utility
Item (N) CombinedUtilities
Overall quality of utility's drinking water (330)Excellent 9%Good 42%Fair 29%Poor 12%Don't know 8%
Safety of utility's drinking water (327)Excellent 10%Good 36%Fair 20%Poor 9%Don't know 24%
Safety of utility's water relative to other utilities (343)Better 13%Same 29%Worse 9%Don't know 49%
Safety of utility's water relative to bottled water (343)Better 3%Same 25%Worse 43%Don't know 29%
Trust of water utility (345)Very much 26%Somewhat 48%Not very much 16%None at all 2%Don't know 8%
Personal importance of knowing more about one's water quality (347)Very important 56%Important 35%Not very important 6%Not at all important 1%Don't know 1%
Utility's provision of water quality information (346)Excellent 7%Good 23%Fair 24%Poor 31%Don't know 16%
13 Risk. Health, Safety & Environment 69 [Spring 20021
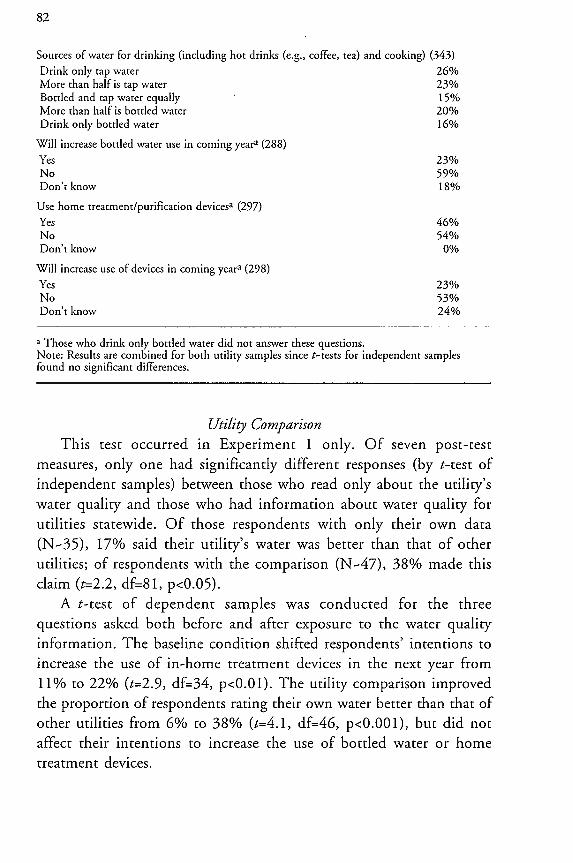
Sources of water for drinking (including hot drinks (e.g., coffee, tea) and cooking) (343)
Drink only tap water 26%More than half is tap water 23%Bottled and tap water equally 15%More than half is bottled water 20%Drink only bottled water 16%
Will increase bottled water use in coming yeara (288)Yes 23%No 59%Don't know 18%
Use home treatment/purification devicesa (297)
Yes 46%No 54%Don't know 0%
Will increase use of devices in coming year a (298)
Yes 23%No 53%Don't know 24%
a Those who drink only bottled water did not answer these questions.Note: Results are combined for both utility samples since t-tests for independent samplesfound no significant differences.
Utility ComparisonThis test occurred in Experiment 1 only. Of seven post-test
measures, only one had significantly different responses (by t-test ofindependent samples) between those who read only about the utility'swater quality and those who had information about water quality for
utilities statewide. Of those respondents with only their own data(N-35), 17% said their utility's water was better than that of otherutilities; of respondents with the comparison (N-47), 38% made thisclaim (t=2.2, df=81, p<0.05).
A t-test of dependent samples was conducted for the threequestions asked both before and after exposure to the water qualityinformation. The baseline condition shifted respondents' intentions toincrease the use of in-home treatment devices in the next year from11% to 22% (t=2.9, df=34, p<0.01). The utility comparison improvedthe proportion of respondents rating their own water better than that ofother utilities from 6% to 38% (t=4.1, df=46, p<0.001), but did notaffect their intentions to increase the use of bottled water or hometreatment devices.
Johnson: Bottled & Tap Water: Experiments in Risk Communication 83
Bottled-Water ComparisonsExperiment 1 found just one significant difference on seven post-
information questions between readers of the short and long bottled-
water comparisons (Ns-55 in both groups). Readers of the long version
were less likely (25% verses 41%) to say that they would increase use of
bottled water in the coming year (t=2.2, df=63, p<0.05); however, this
intention did not shift significantly before or after exposure to the
comparison. No within-group shifts for the two comparisons (separately
or jointly) were significantly different from the baseline condition,
either on relative ratings of water quality or on intentions for use of in-
home treatment devices.
Experiment 2 found no significant differences on post-information
questions between readers of the short and long bottled-water
comparisons (Ns-55 in both groups). There was a significant differencerelative to the baseline (no comparison) condition in how readers of the
comparisons (separately or combined) rated the quality of their water
relative to bottled water (t=3.5, df=173, p<0.001; Ns=66 and 109,
respectively, for the combined analysis). Unlike the results for the
utility comparison, the difference did not stem from ratings of the
utility water as "better" (7% comparisons verses 6% baseline). Rather,
"don't know" responses were greatly reduced (29% verses 58%),
resulting in both more "same" ratings (38% verses 29%) and more"worse" ratings (26% verses 8%). There was less concern but more
judged risk and desire for a bottled-water comparison in future water
quality reports among those seeing the comparison, but neither of these
differences, nor within-group shifts, were statistically significant.
Patterns ofResponseSix of seven post-information measures were recoded to ensure all
reflected, for instance, a high-concern or a high-judged-risk stance, and
subjected to principal component factor analysis. Extraction of factors
with eigenvalues above 1.0 and varimax normalized rotation identified
measures loading high on the same factor. Reliability analysis examined
whether an additive scale compiled from these high-loading measures
was reliable. The aim was to identify a scale that could be the
dependent variable in a multiple regression analysis.
13 Risk Health, Safety & Environment 69 [Spring 2002]
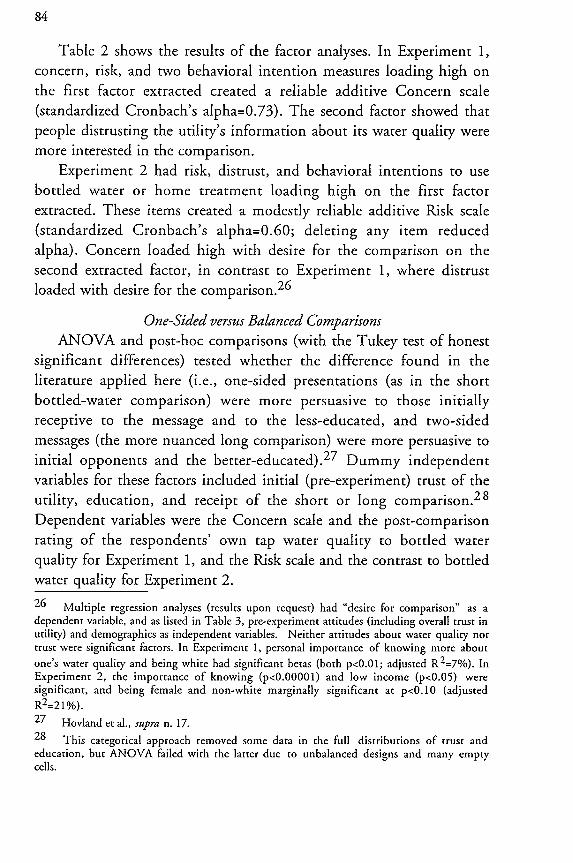
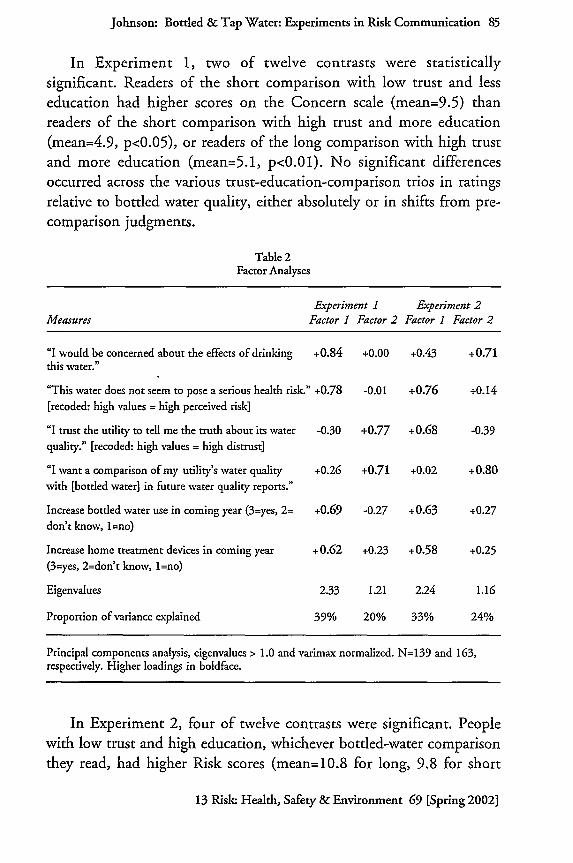
Table 2 shows the results of the factor analyses. In Experiment 1,concern, risk, and two behavioral intention measures loading high onthe first factor extracted created a reliable additive Concern scale(standardized Cronbach's alpha=0.73). The second factor showed thatpeople distrusting the utility's information about its water quality weremore interested in the comparison.
Experiment 2 had risk, distrust, and behavioral intentions to usebottled water or home treatment loading high on the first factorextracted. These items created a modestly reliable additive Risk scale(standardized Cronbach's alpha=0.60; deleting any item reducedalpha). Concern loaded high with desire for the comparison on thesecond extracted factor, in contrast to Experiment 1, where distrustloaded with desire for the comparison. 26
One-Sided versus Balanced ComparisonsANOVA and post-hoc comparisons (with the Tukey test of honest
significant differences) tested whether the difference found in theliterature applied here (i.e., one-sided presentations (as in the shortbottled-water comparison) were more persuasive to those initiallyreceptive to the message and to the less-educated, and two-sidedmessages (the more nuanced long comparison) were more persuasive toinitial opponents and the better-educated). 27 Dummy independentvariables for these factors included initial (pre-experiment) trust of theutility, education, and receipt of the short or long comparison. 2 8
Dependent variables were the Concern scale and the post-comparisonrating of the respondents' own tap water quality to bottled waterquality for Experiment 1, and the Risk scale and the contrast to bottledwater quality for Experiment 2.
26 Multiple regression analyses (results upon request) had "desire for comparison" as a
dependent variable, and as listed in Table 3, pre-experiment attitudes (including overall trust inutility) and demographics as independent variables. Neither attitudes about water quality nortrust were significant factors. In Experiment I, personal importance of knowing more about
one's water quality and being white had significant betas (both p<0.01; adjusted R 2 =7%). InExperiment 2, the importance of knowing (p<0.00001) and low income (p<0.05) weresignificant, and being female and non-white marginally significant at p<0.10 (adjusted
R2 =21%).27 Hovland et al., supra n. 17.
28 This categorical approach removed some data in the full distributions of trust and
education, but ANOVA failed with the latter due to unbalanced designs and many emptycells.
Johnson: Bottled & Tap Water: Experiments in Risk Communication 85
In Experiment 1, two of twelve contrasts were statisticallysignificant. Readers of the short comparison with low trust and lesseducation had higher scores on the Concern scale (mean=9.5) thanreaders of the short comparison with high trust and more education(mean=4.9, p<0.05), or readers of the long comparison with high trustand more education (mean=5.1, p<0.01). No significant differencesoccurred across the various trust-education-comparison trios in ratingsrelative to bottled water quality, either absolutely or in shifts from pre-comparison judgments.
Table 2Factor Analyses
Experiment 1 Experiment 2Measures Factor 1 Factor 2 Factor 1 Factor 2
"I would be concerned about the effects of drinking +0.84 +0.00 +0.43 +0.71this water."
"This water does not seem to pose a serious health risk." +0.78 -0.01 +0.76 +0.14[recoded: high values = high perceived risk]
"I trust the utility to tell me the truth about its water -0.30 +0.77 +0.68 -0.39quality." [recoded: high values = high distrust]
"I want a comparison of my utility's water quality +0.26 +0.71 +0.02 +0.80with [bottled water] in future water quality reports."
Increase bottled water use in coming year (3=yes, 2= +0.69 -0.27 +0.63 +0.27don't know, 1=no)
Increase home treatment devices in coming year + 0.62 +0.23 +0.58 +0.25(3=yes, 2=don't know, 1=no)
Eigenvalues 2.33 1.21 2.24 1.16
Proportion of variance explained 39% 20% 33% 24%
Principal components analysis, eigenvalues > 1.0 and varimax normalized. N=139 and 163,respectively. Higher loadings in boldface.
In Experiment 2, four of twelve contrasts were significant. Peoplewith low trust and high education, whichever bottled-water comparisonthey read, had higher Risk scores (mean=10.8 for long, 9.8 for short
13 Risk: Health, Safety & Environment 69 [Spring 2002]
comparison) than people with high trust, regardless of the latter'seducation level or the comparison they had read (means=5.6 to 6.3, allp<0.01). Again, absolute and shifted relative ratings of bottled waterhad no significant differences across conditions.
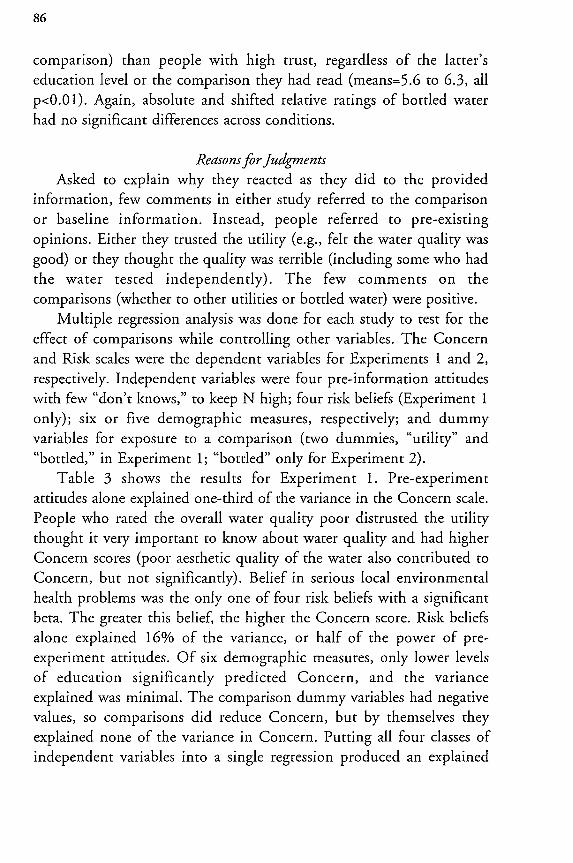
Reasons for JudgmentsAsked to explain why they reacted as they did to the provided
information, few comments in either study referred to the comparisonor baseline information. Instead, people referred to pre-existingopinions. Either they trusted the utility (e.g., felt the water quality wasgood) or they thought the quality was terrible (including some who hadthe water tested independently). The few comments on thecomparisons (whether to other utilities or bottled water) were positive.
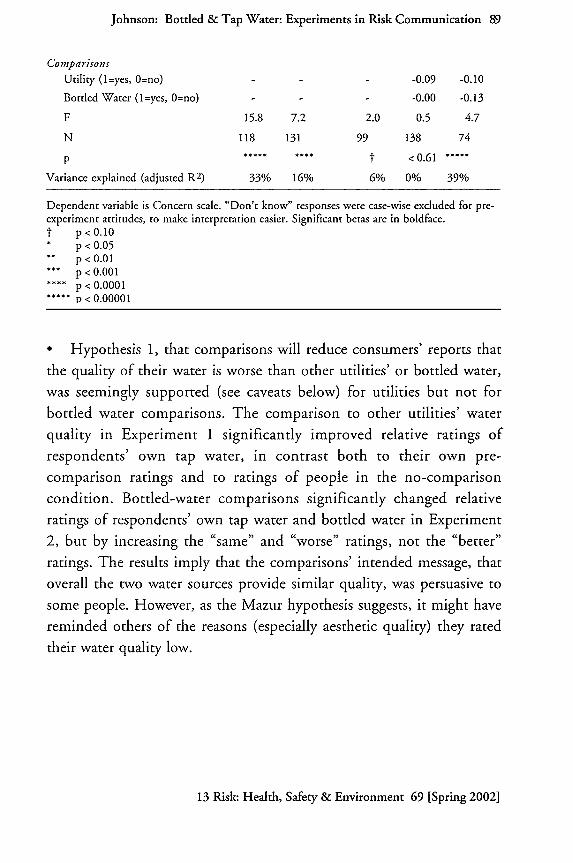
Multiple regression analysis was done for each study to test for theeffect of comparisons while controlling other variables. The Concernand Risk scales were the dependent variables for Experiments 1 and 2,respectively. Independent variables were four pre-information attitudeswith few "don't knows," to keep N high; four risk beliefs (Experiment 1
only); six or five demographic measures, respectively; and dummyvariables for exposure to a comparison (two dummies, "utility" and
"bottled," in Experiment 1; "bottled" only for Experiment 2).Table 3 shows the results for Experiment 1. Pre-experiment
attitudes alone explained one-third of the variance in the Concern scale.People who rated the overall water quality poor distrusted the utilitythought it very important to know about water quality and had higherConcern scores (poor aesthetic quality of the water also contributed toConcern, but not significantly). Belief in serious local environmentalhealth problems was the only one of four risk beliefs with a significantbeta. The greater this belief, the higher the Concern score. Risk beliefsalone explained 16% of the variance, or half of the power of pre-experiment attitudes. Of six demographic measures, only lower levelsof education significantly predicted Concern, and the varianceexplained was minimal. The comparison dummy variables had negativevalues, so comparisons did reduce Concern, but by themselves theyexplained none of the variance in Concern. Putting all four classes ofindependent variables into a single regression produced an explained
Johnson: Bottled & Tap Water: Experiments in Risk Communication 87
variance of 39%, but now only the pre-existing attitude of trust of theutility had a significant beta. Clearly prior attitudes explained far moreConcern than other variables. The inclusion of other variablesstrengthened the contribution of comparisons to reducing Concern, buttheir effect was still not significant.
Table 4 shows Experiment 2 results. The Risk score was shaped bylow aesthetic quality of this utility's water and low trust in the utility.Neither demographics nor exposure to bottled-water comparisons hada significant effect by themselves. When all three categories ofindependent variables entered the regression, aesthetic water qualityand distrust became more important, higher income became marginallysignificant, and exposure to bottled-water comparisons almost reachedmarginal significance (p<0.105) in reducing Risk scores (versusincreasing such scores when entered alone in the analysis). Prior
attitudes toward water quality and the utility dominated otherindependent variables in explaining Concern even more than inExperiment 1. Overall, the results were similar (but not identical) tothose in Experiment 1.
DiscussionThese two pilot studies, despite the small sample sizes, revealed
more statistically significant differences than could be expected bychance. In particular, they suggested that:0 Comparisons of utility-provided drinking water quality to thequality of other utilities' water or bottled water are indeed desired byutility customers. Audience evaluations of actual comparisons, usingreal data, were positive. Earlier expressions of interest in the abstractwere not anomalous. Personal importance of knowing about one's water
quality seemed the primary motivation for this desire. 2 9
29 Environmental Attitudes, supra n. 7.
13 Risk- Health, Safety & Environment 69 [Spring 2002]
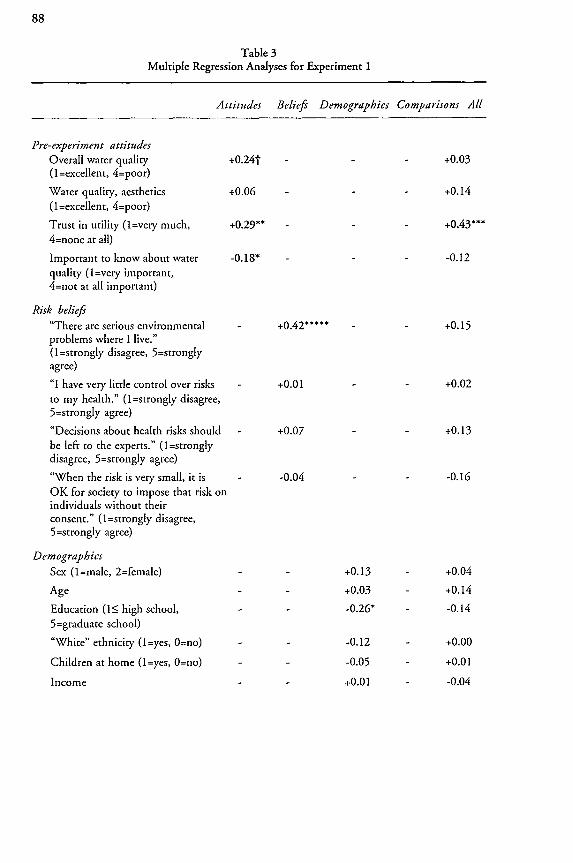
Table 3Multiple Regression Analyses for Experiment 1
Attitudes Beliefs Demographics Comparisons All
Pre-experiment attitudesOverall water quality +0.24t - +0.03(1 =excellent, 4=poor)
Water quality, aesthetics +0.06 - - - +0.14(1=excellent, 4=poor)
Trust in utility (1=very much, +0.29** - - - +0.43***4=none at all)
Important to know about water -0.18* - - - -0.12
quality (1=very important,4=not at all important)
Risk beliefs
"There are serious environmental - +0.42***** - - +0.15problems where I live."(1=strongly disagree, 5=stronglyagree)
"I have very little control over risks - +0.01 - - +0.02to my health." (I =strongly disagree,5=strongly agree)
"Decisions about health risks should - +0.07 - - +0.13be left to the experts." (1=stronglydisagree, 5=strongly agree)
"When the risk is very small, it is - -0.04 - - -0.16OK for society to impose that risk onindividuals without theirconsent." (1=strongly disagree,5=strongly agree)
Demographics
Sex (1=male, 2=female) - - +0.13 - +0.04
Age - - +0.03 - +0.14
Education (1_< high school, - - -0.26* - -0.14
5=graduate school)
"White" ethnicity (1=yes, 0=no) - - -0.12 - +0.00
Children at home (1=yes, 0=no) - - -0.05 - +0.01
Income - - +0.01 - -0.04
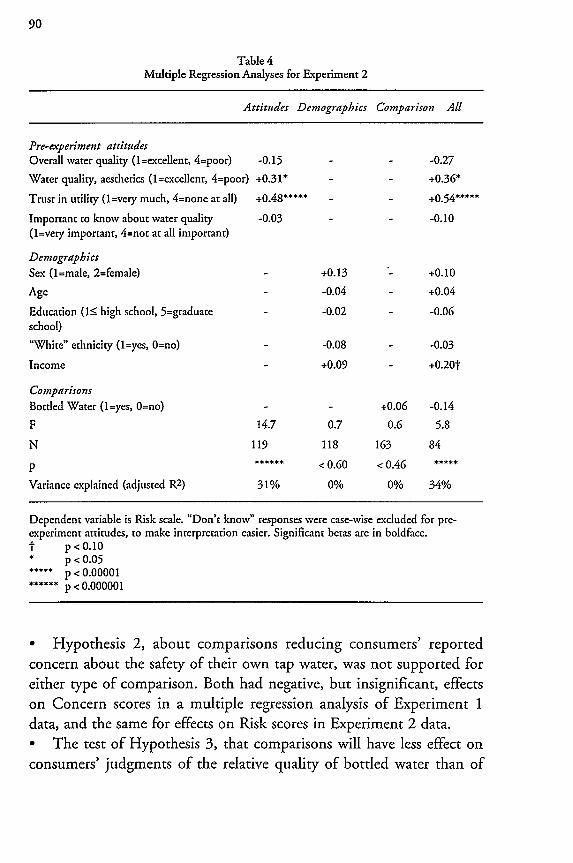
Table 4Multiple Regression Analyses for Experiment 2
Attitudes Demographics Comparison All
Pre-experiment attitudesOverall water quality (1=excellent, 4=poor) -0.15 - - -0.27
Water quality, aesthetics (1=excellent, 4=poor) +0.31* - - +0.36*
Trust in utility (1=very much, 4=none at all) +0.48***** - - +0.54*****
Important to know about water quality -0.03 - - -0.10(1=vey important, 4=not at all important)
DemographicsSex (1=male, 2=female) - +0.13 - +0.10
Age - -0.04 - +0.04
Education (1:5 high school, 5=graduate - -0.02 - -0.06school)
"White" ethnicity (1=yes, 0=no) - -0.08 - -0.03
Income - +0.09 - +0.20t
ComparisonsBottled Water (1=yes, 0=no) - - +0.06 -0.14
F 14.7 0.7 0.6 5.8
N 119 118 163 84
p < 0.60 < 0.46 *****
Variance explained (adjusted R2) 31% 0% 0% 34%
Dependent variable is Risk scale. "Don't know" responses were case-wise excluded for pre-experiment attitudes, to make interpretation easier. Significant betas are in boldface.t p<0.10* p < 0 .0 5
* p <0.00001* p < 0.000001
o Hypothesis 2, about comparisons reducing consumers' reportedconcern about the safety of their own tap water, was not supported foreither type of comparison. Both had negative, but insignificant, effectson Concern scores in a multiple regression analysis of Experiment 1data, and the same for effects on Risk scores in Experiment 2 data.* The test of Hypothesis 3, that comparisons will have less effect onconsumers' judgments of the relative quality of bottled water than of
Johnson: Bottled & Tap Water: Experiments in Risk Communication 89
Comparisons
Utility (l=yes, 0=no) -0.09 -0.10
Bottled Water (1=yes, 0=no) - - - -0.00 -0.13
F 15.8 7.2 2.0 0.5 4.7
N 118 131 99 138 74p ..... ... < 0.61 .....
Variance explained (adjusted R 2) 33% 16% 6% 0% 39%
Dependent variable is Concern scale. "Don't know" responses were case-wise excluded for pre-experiment attitudes, to make interpretation easier. Significant betas are in boldface.
p" p<0.10p < 0.0 5
p < 0.0 1
p< 0 .00 1
p < 0.0001P < 0.00001
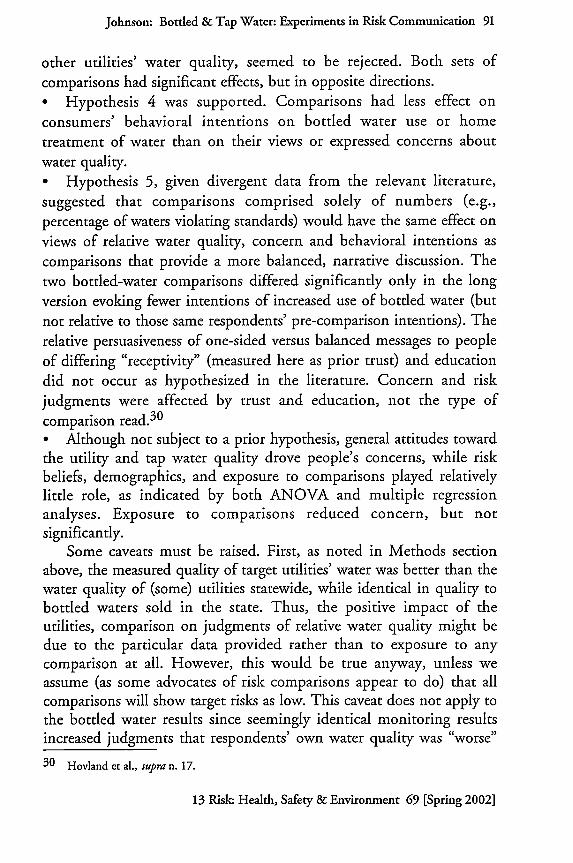
* Hypothesis 1, that comparisons will reduce consumers' reports that
the quality of their water is worse than other utilities' or bottled water,was seemingly supported (see caveats below) for utilities but not for
bottled water comparisons. The comparison to other utilities' water
quality in Experiment 1 significantly improved relative ratings of
respondents' own tap water, in contrast both to their own pre-
comparison ratings and to ratings of people in the no-comparison
condition. Bottled-water comparisons significantly changed relative
ratings of respondents' own tap water and bottled water in Experiment
2, but by increasing the "same" and "worse" ratings, not the "better"
ratings. The results imply that the comparisons' intended message, that
overall the two water sources provide similar quality, was persuasive to
some people. However, as the Mazur hypothesis suggests, it might have
reminded others of the reasons (especially aesthetic quality) they rated
their water quality low.
13 Risk: Health, Safety & Environment 69 [Spring 2002]
Johnson: Bottled & Tap Water: Experiments in Risk Communication 91
other utilities' water quality, seemed to be rejected. Both sets of
comparisons had significant effects, but in opposite directions.0 Hypothesis 4 was supported. Comparisons had less effect on
consumers' behavioral intentions on bottled water use or home
treatment of water than on their views or expressed concerns about
water quality.* Hypothesis 5, given divergent data from the relevant literature,
suggested that comparisons comprised solely of numbers (e.g.,
percentage of waters violating standards) would have the same effect on
views of relative water quality, concern and behavioral intentions as
comparisons that provide a more balanced, narrative discussion. The
two bottled-water comparisons differed significantly only in the long
version evoking fewer intentions of increased use of bottled water (but
not relative to those same respondents' pre-comparison intentions). The
relative persuasiveness of one-sided versus balanced messages to people
of differing "receptivity" (measured here as prior trust) and education
did not occur as hypothesized in the literature. Concern and risk
judgments were affected by trust and education, not the type ofcomparison read.30
* Although not subject to a prior hypothesis, general attitudes toward
the utility and tap water quality drove people's concerns, while riskbeliefs, demographics, and exposure to comparisons played relativelylittle role, as indicated by both ANOVA and multiple regressionanalyses. Exposure to comparisons reduced concern, but notsignificantly.
Some caveats must be raised. First, as noted in Methods sectionabove, the measured quality of target utilities' water was better than thewater quality of (some) utilities statewide, while identical in quality tobottled waters sold in the state. Thus, the positive impact of theutilities, comparison on judgments of relative water quality might bedue to the particular data provided rather than to exposure to anycomparison at all. However, this would be true anyway, unless weassume (as some advocates of risk comparisons appear to do) that allcomparisons will show target risks as low. This caveat does not apply tothe bottled water results since seemingly identical monitoring resultsincreased judgments that respondents' own water quality was "worse"
30 Hovland et al., supra n. 17.
13 Risk: Health, Safety & Environment 69 [Spring 2002]
than bottled water quality, and increased "same" judgments. Asdiscussed for Hypothesis 5 (above in the Background section), this mayreflect the import of personal experience (e.g., better taste of bottledwater) into the judgment process, an import less feasible for otherutilities' water.
A second caveat is that these exploratory studies lacked anymeasure of information processing, except for the open-ended questionasking for reasons for respondents' prior reactions to the informationgiven. These reasons did not mention the comparison often, whichmight imply it did not get a lot of attention. However, it could equallywell reflect the dominance of prior views of tap water quality regardlessof how closely the comparison was read. Because the utilitiescomparison and the short bottled-water comparison were of equallength, it is plausible, but not demonstrated, that the mean processingstrategy (e.g., systematic versus heuristic) across the two subsamplesexposed to these comparisons, did not differ, and thus cannot explainthe divergent results. The lack of significant differences in reactions tothe short and long bottled-water comparisons could imply similardegrees of information processing, or less processing of the longer one.The recent emergence of survey-relevant measures of informationprocessing may allow resolution of these ambiguities in futureresearch.
3'
Are these results representative of likely utility customer reactions tosuch comparisons? The pre-comparison ratings of water quality andtrust in the utility, for example, are similar to those provided bycustomers of other New Jersey utilities.3 2 To the extent that suchreactions are driven more by these views, particularly for bottled water,than by the comparisons themselves, similar results should occur.National data suggests similarities as well. For example, a 1993 surveyfound similar ratings of tap water quality across national regions. Theproportion of the population drinking only bottled water in theNortheast, New Jersey's region, was in the middle of the regionalranges (9%, versus 4-16%), although its residents were less likely thanthose of other regions to use only tap water for drinking (46%, versus
31 For example, as-yet-unpublished efforts by Robert Griffin and colleagues, and Craig
Trumbo (on file with author).32 Johnson, supra n. 4; see also Branden B. Johnson, Public Reaction to Mandated
Language for U.S. Water Quality Reports, 12 Risk: Health, Safety & Environment 153(2002), Branden B. Johnson, Experiments in the Content of Reports on Drinking WaterQuality, manuscript under review (2002).
Johnson: Bottled & Tap Water: Experiments in Risk Communication 93
48-64%). A third expressed "very much" trust in their own utility, with
52% saying they trusted their own utility "somewhat." The national
survey asked the general public to rate tap water's generic quality (notthat of their own utility) for safety and health relative to bottled water.About half (49%) said they were the same, 37% said bottled water wasbetter, and 10% selected tap water.3 3 These limited comparisons
suggest, but cannot prove that the results reported here will generalize
to other populations. This conclusion is reinforced by focus groups thatindicated that meeting or not meeting standards seemed less important
in customers' views of their water quality than the broad relationshipthey had with that utility.34 However, the differing reactions across
the two utilities suggest caution even though the differences seem tohave less to do with comparisons than with attitudes toward the utilityitself. Overall, replication with larger samples or with frequent similar
messages from multiple or more-trusted sources might find that water
quality comparisons have a more significant effect. However, theirimpact relative to other variables, particularly prior attitudes toward the
utility and water quality, seems unlikely to change much.On a more practical point, complying with or improving secondary
water quality standards, so fewer aesthetic problems alienate customers,
seems utilities' best bet for reducing future shifts to bottled-water
sources. However, given varied reasons for using bottled water and theexisting high use of bottled water, utilities should not expect to reduce
that use in the short run.
Conclusions
Theory on risk comparisons is even less developed than is their
empirical testing, which has just begun to examine whether comparisons
change beliefs, attitudes, or behavioral intentions.3 5 The literature to
date shows that people want the risk comparisons they have been
shown, but is less clear on their substantive effect. This study is
33 Robert E. Hurd, Consumer Attitude Survey on Water Quality Issues, AWWA ResearchFoundation and the American Water Works Association 38, 42, 49, 69 (1993).34 Robert Hurd & Joan Becker, AWWA Focus Groups to Develop and Test EffectiveWater Quality Reports: Responding to CCR Requirements in the SDWA (WITAF ProjectNo. 408, Final Report 1998); see also Johnson, supra n. 3.35 See Roth et al., supra n. 1.
13 Risk: Health, Safety & Environment 69 [Spring 2002]
consistent with previous studies. 36 The effect is in the predicteddirection, but too small to be significant, and far less important thanconsumers' prior attitudes (in this case, toward water quality and theutility). Without similar studies, it is too soon to know whether thisresult is restricted to comparisons concerning risk topics on whichpeople already have definite beliefs and behaviors, or reflects thelimited impact of simply providing information, relative to trust andother contextual factors.
36 See Slovic et al., supra n. 1; Johnson (2002), supra n. 1.