Embed Size (px)
Citation preview

224
VI. Comparative Value Chain and Economic
Analysis of the Metal Sector (Crown Cork) in
Ethiopia, Zambia, China and Vietnam

225
VI.1. Crown Cork (Bottle Caps) Products Analysis: Objectives
The purpose of the crown cork products analysis is to assess the current competitiveness
of the subsector and the main opportunities for maintaining and increasing
competitiveness in the future. To do this, a typical product (steel bottle caps) was
analyzed in the following manner:
Examine important issues and trends in the world metals and metal products
market;
Review the structures of the Ethiopian, Zambian, Chinese and Vietnamese metal
goods markets;
Assess the key features, strengths and weaknesses of the existing supply chains
for metal products in Ethiopia, Zambia, China and Vietnam;
Assess the overall economic efficiency of domestic crown cork production in
relation to world prices (as reflected by production prices in China and Vietnam)
using alternative cost projection scenarios to establish current and medium term
competitiveness;
Taking the economic efficiency result as a starting point, analyze the metal
products (crown cork) value chain to identify key strengths, weaknesses and
opportunities or needs for investment, expansion or contraction to maintain and
increase crown cork productivity and competitiveness at the business strategy and
business process levels; and
Provide possible policy options and recommendations to help stimulate growth
and improve competitiveness in the sector.
VI.2. Product Selection Method
Following a review of the first product screening in which 40 products were selected for
consideration for the value chain analysis and feasibility study, the World Bank (WB)
and Global Development Solutions (GDS)/HQ teams immediately agreed on seven out of
the ten products needed for the analysis. The seven products selected by the teams were
as follows:
1. Apparel:
a. Polo shirt; and
b. Underwear
2. Agribusiness:
a. Milk; and
b. Wheat milling
3. Leather:
a. High-end sheepskin loafers
4. Wood:

226
a. Windows/French windows and frames
5. Metal:
a. Padlocks.
To finalize the selection of the remaining products from the wood, metal and leather
sectors, based on the Africa Competitiveness: Phase 1.1 - Preliminary Product Screening
in Ethiopia report (July 2010), the WB and GDS/HQ teams chose six products as
potential candidates to be included in the list of the final ten products to be the target
products for the value chain analysis and feasibility study. The six products included the
following:
1. Wood products:
a. Wooden doors; and
b. Wooden chairs (not upholstered).
2. Leather products:
a. Leather golf gloves; and
b. Sports footwear of leather.
3. Metal products:
a. Metal doors, window-frame (security window frame); and
b. Aluminum doors and windows.
In order to screen the final six products, a product screening survey was developed which
revolved around six factors:
1. Whether these products are currently produced by companies with less than
50 employees;
2. If companies identified in #1 above can be set up with less than US$100,000
in investment capital;
3. The minimum level of skills and know-how required to produce the products;
4. Whether the products produced by the companies in #1 are being exported;
5. Whether products produced by companies in #1 are consolidated by brokers
or other intermediaries for exports; and
6. Whether companies identified in #1 can readily access raw material inputs in
the market to produce the products.
These questions were posed to the wood, metal and leather sector associations in both
China and Vietnam. Following interviews with sector associations, additional interviews
were conducted at the firm level to identify specifically the level of investments and
minimum level of technical skills required for an entrepreneur or existing SMEs to set up
a production operation. These questions were posed to existing operators in China and
Vietnam to identify whether:

227
Barriers to market entry, particularly from a financial and skills
requirement, were sufficiently low to allow entrepreneurs and SMEs in
Ethiopia to easily establish operations; and
These products are currently being produced by SMEs in China and
Vietnam, and are effectively being sold in local and export markets.
The product screening survey identified the following products as viable candidates to be
targeted for the value chain and feasibility analysis.
1. Wood product:
a. Wooden chairs (soft wood); and
b. Wooden door (semi-solid).
Although French windows and their frames made of wood had originally been
preselected for analysis, a decision was made to opt to analyze both wooden
chairs and wooden doors. This decision stemmed from the fact that French
windows require glass thus introducing an outside factor that could influence
the manufacturing of the final product. Wooden doors (without glass) and
wooden chairs (without upholstery) are more representative of wood
processing exclusively.
2. Leather products: Leather golf gloves or sports glove of comparable structure
and weight.
3. Metal products: Both the pre-selected products (security window frame; and
aluminum doors and windows) were screened out of the selection due to
various factors including high initial investment requirements. As a result,
further analyses of products identified during the preliminary product
screening were conducted. Interviews with metal sector associations and
enterprises currently operating in China and Vietnam, as well as interviews
with existing operators in the fabricated metal products sector in Ethiopia
identified crown corks (bottle caps) as a viable candidate to be targeted for
value chain analysis. Crown corks currently are produced in four of the five
countries (not in Tanzania), but Ethiopia continues to import substantial
volumes of this product, including imports from China. As a result, crown
corks have been chosen as the final fabricated metal product to be the focus of
a value chain analysis in the target countries.

228
VI.2.1. Respective Government Definitions of Small, Medium and
Large Enterprises in Ethiopia, Tanzania, Zambia, China and
Vietnam
Ethiopia: For Ethiopia, the classification of enterprises into small, medium and large
scale depends on a number of variables such as level of employment, turnover, capital
investment, production capacity, level of technology and subsector. Accordingly, the
following scales are referred to the classification of enterprises in the Ethiopian context
(Table 117).
Table 117: Company Size Classification Structure for Ethiopia
Small Scale Medium Scale Large Scale
Textile and Apparel 5-9 10 – 49 above 50
According to the Central
Statistics Agency (CSA)
Leather 2-10 21 – 50 above 51
Diary 2-10 21 – 50 above 51
Wheat 2-10 21 – 50 above 51
Wood Processing 2-10 21 – 50 above 51
Metal 2-10 21 – 50 above 51
According to Federal
Medium and Small
Enterprise Development
Agency (FeMSEDA)
Sub-sector Remark
Number of Employees
Source: Ethiopia CSA and FeMSEDA
Tanzania: For Tanzania, the classification of enterprises into small, medium and large
scale depends on a number of variables such as level of employment and capital
investment in machinery. The classification cuts across sectors and subsectors of the
economy. Accordingly, the following scales refer to the classification of enterprises in
the Tanzanian context (Table 118). Note that the small enterprise type is most
appropriate for all sectors studied in this analysis.
Table 118: Company Size Classification Structure for Tanzania
Category Employees
Capital Investment in Machinery
(TZS million) Remarks
Micro enterprise 1 - 4 Up to 5 Majority in the informal sector
Small enterprise 5 - 49 5 - 200 Most in the informal sector
Medium enterprise 50 - 99 200 - 800 Most in the formal sector
Large enterprise 100+ 800+ All in the formal sector Source: Tanzania Chamber of Commerce, Industry and Agriculture (TCCIA)
Zambia: Zambia classifies enterprises as micro, small, medium and large based on
several factors including number of employees, annual revenue and capital investment.
The capital investment category is further delineated by whether the firm is engaged in
manufacturing or if it is a trading/services firm. For microenterprises, the minimum
revenue and investment requirements are kept intentionally low in order to encourage
registration, although few microenterprises actually register.

229
Table 119: Company Size Classification Structure for Zambia
Classification Employees
Annual Revenue
(ZMK million)
Capital Investment for Manufacturing
Firms (ZMK million)
Capital Investment for Trading/ Services
Firms (ZMK million)
Micro < 10 < 20 < 10 < 10
Small 10 - 50 150 - 250 80 – 200 150
Medium 51-100 300 - 800 200 – 500 151 - 300
Large > 100 > 800 > 500 > 300
Source: Zambia Development Agency
China: The China government is challenged in defining sizes of firms. Temporary
definitions have been used for the past several years, and the government promised to
revise the standard in 2010. The definition from the National Bureau of Statistics of
China is complex. The definition was published in 2002 jointly by the Ministry of
Finance, National Bureau of Statistics of China, State Economic and Trade Commission
(no longer exists), and China Planning Commission, which has since split and exists as
the State Development and Planning Commission (SDPC) and the National Development
and Reform Commission (NDRC). A simplified presentation of the company size
classification is shown in Table 120. Note that the Industrial type is most appropriate for
all sectors studied in this analysis.
Table 120: Company Size Classification Structure for China
Type Index Unit Small Medium Large
Employee person Less than 300 300-2000 More than 2000
Revenue million RMB Less than 30 30-300 More than 300
Asset million RMB Less than 40 40-400 More than 400
Employee person Less than 600 600-3000 More than 3000
Revenue million RMB Less than 30 30-300 More than 300
Asset million RMB Less than 40 40-400 More than 400
Employee person Less than 100 100-200 More than 200
Revenue million RMB Less than 30 30-300 More than 300
Employee person Less than 100 100-500 More than 500
Revenue million RMB Less than 10 10-150 More than 150
Employee person Less than 500 500-3000 More than 3000
Revenue million RMB Less than 30 30-300 More than 300
Employee person Less than 400 400-1000 More than 1000
Revenue million RMB Less than 30 30-300 More than 300
Employee person Less than 400 400-800 More than 800
Revenue million RMB Less than 30 30-150 More than 150
Lodging and
Catering services
Industrial
Construction
Wholesale
Retail
Transportation
Post services
Source: National Bureau of Statistics of China
Vietnam: A small firm has less than 50 laborers, while a medium-size firm has 51-200
laborers. Within the small and medium-size classifications, there are some detailed
categories depending on the purpose of research and management. For instance, a firm

230
with less than 10 laborers is called a super small-size firm. Such a regulation is in line
with Social Insurance Law.104
VI.2.2. Product Technical Specifications
Following the identification of products to be targeted for the value chain and feasibility
analysis, a detailed technical profile of each product with an accompanying diagram or
photograph was complied and sent to the field teams to help ensure that product data
collection in the field focused on products with similar - if not identical - technical
specifications.
Table 121 below provides the product technical specifications for all ten products for
which product data are being collected.
Table 121: Product Technical Specifications
Material
Product WeightUnit of
measureUnit of measure
1 Golf gloves 85 - 141 grams Men's medium Sheepskin
Loafer 780 grams Heel Width Insole
Size US = 8 EU = 7 2.5 10 30
3 Padlock* 760 grams 7 7 NA* cm Brass
Thickness Diameter Height
0.24 31.9 6.6
Width Depth Height
45 45 75
Width Depth Height
80 4 210
Protein Lactose Ash Vitamins Fat content
3.5% 4.7% 0.8% B1, B2, C and D Full
Type (German) Type (French) Ash Protein Moisture
550 55 <0.65%approx.
11%<14.5%
9 Polo shirt 250 - 270 grams 100% cotton
10 Underwear 80 - 100 grams80% cotton/
20% spandex
* Overall height is 14 cm with a 2 cm shackle diameter
** The weight of the cover (plastic sole made from PVC) in the internal surface of the cap is 290 mg
Source: Global Development Solutions, LLC
Pine
Wheat or rice
Dimension
All purpose flour
cm
Refer to diagram
Weight
cm
mm
cm
tin free steel
(tfs)
Sheepskin
Pine
mg
kg
kg
liters
Refer to picture
Crown cork
(metal bottle
cap)**
Wooden chair
Wooden door
Milk
Milling
290
6.5
12
0.5
2
4
5
6
7
8
104
Information garnered from
http://laws.dongnai.gov.vn/1991_to_2000/2000/200004/200004280005_en/lawdocum

231
VI.3. Global Metal Products Market
The production of iron and steel ore and products based on these metals are the most
important items in the global metal products trade. As per the classification of the
International Trade Statistics of the International Trade Center, the most significant
products in this market segment are shown in Table 122 below.
Table 122: Iron and Steel Products and Articles of Iron or Steel
Iron and Steel Products Articles of Iron or Steel
1. Pig iron and spiegeleisen in pigs
2. Ferro-alloys
3. Ferrous products obtained by direct reduction
of iron ore (min. pure iron of 99.9 percent)
4. Ferrous waste and scrap; remelting scrap
ingots or iron or steel
5. Granules and powders of pig iron, spiegeleisen,
iron or steel
6. Iron and non-alloy steel in ingots or other
primary forms
7. Semi-finished products of iron/non-alloy steel
8. Flat-rolled products of iron/non-alloy steel
9. Bars and rods
10. Angles, shapes and sections of iron or non-
alloy steel
11. Wire of iron or non-alloy steel
12. Stainless steel in ingots/other primary forms
13. Flat-rolled products of stainless steel
14. Bars and rods, hot rolled in irregular wound
coils of stainless steel
15. Bars and rods of stainless steel, angles and
shapes
16. Wire of stainless steel
17. Alloy steel in ingots/other primary form
18. Flat-rolled products of other alloy
19. Bars and rods other alloy steel hollow drill bars
20. Wire of other alloy steel
1. Sheet piling, etc., of iron/steel
2. Rail, crossing pieces iron/steel
3. Tubes, pipes and hollow profiles of cast iron
4. Structures (roads, angles, plates)
5. Iron and steel reservoirs, tanks, vats (cap>300 l)
6. Iron or steel tanks, casks, drums, cans and boxes
7. Containers for compressed or liquefied gas
8. Iron or steel stranded wire, ropes, cables, etc.,
not electrically insulated
9. Iron and steel wire barbed twisted hoop, etc.
10. Cloth grill, netting and fencing of iron and steel
wire
11. Chain and parts thereof of iron or steel
12. Anchors, grapnels and parts thereof
13. Nails, staples and sim art, iron or steel
14. Iron or steel screws, bolts, nuts, coach-screws
15. Iron and steel sewing, knitting needles and sim
arts for hand use
16. Spring and leaves for springs
17. Iron or steel stoves, ranges, barbecues and semi
non-electrical apparatuses
18. Iron and steel radiators, air heaters and hot air
distributers
19. Iron or steel tables and household articles
20. Sanitary ware and parts thereof
21. Cast articles of iron or steel
22. Articles of iron or steel
Source: International Trade Center
Market Trends: Global iron and steel exports attained the highest export value of
US$529 billion in 2008. Germany was the largest exporter, accounting for 7.6 percent of
the global export in 2008. Global exports experienced a sharp decline (by 47.6 percent)
in 2009 against 2008 due to the economic crisis and registered a substantially lower
export value of US$273 billion. Following Germany, major iron and steel exporters are
Japan, Republic of Korea, USA, Russian Federation, Belgium, China, France,
Netherlands and Ukraine.

232
With regard to import of iron and steel products, the global import value registered in
2008 was the highest, amounting to US$546 billion of which Germany accounted for 7.4
percent, followed by the Republic of Korea (6.5 percent). The leading importers in 2009
were China, Germany, Republic of Korea, Italy, USA, France, Turkey, Belgium,
Netherlands and India.
The aggregated export and import by LDCs in iron and steel accounted for only 0.12
percent and 1.13 percent of the global figures, respectively.
With respect to items made of iron or steel, the global export value in 2008 was US$307
billion, which suffered a 26.5 percent decline the following year to US$226 billion.
China was the leading exporter of items made of iron or steel and accounted for 15.8
percent of global exports in 2008 and 15 percent in 2009. The export values of the major
15 exporting countries are depicted in Table 123 below.
Table 123: Leading Exporters of Items Made of Iron or Steel (US$000)
Exporters Exported value in
2005
Exported value in
2006
Exported value in
2007
Exported value in
2008
Exported value in
2009
World * 172,011,312.00 208,788,640.00 256,712,912.00 306,900,512.00 225,664,352.00
'China 19,032,492.00 26,784,042.00 36,739,592.00 48,419,120.00 33,781,144.00
'Germany 21,490,444.00 26,056,732.00 31,238,204.00 35,632,184.00 28,304,016.00
'Italy 14,381,019.00 17,619,888.00 22,490,508.00 25,388,438.00 17,642,628.00
'United States of America 11,284,488.00 13,490,562.00 14,872,820.00 17,720,372.00 13,797,469.00
'Japan 9,411,485.00 11,033,798.00 12,097,593.00 13,727,355.00 10,524,204.00
'France 8,236,698.00 9,349,253.00 11,882,738.00 13,165,533.00 9,519,684.00
'Republic of Korea 4,425,868.00 5,875,965.00 7,017,940.00 9,062,526.00 8,022,113.00
'Netherlands 3,930,404.00 4,722,160.00 6,197,963.00 7,023,034.00 6,480,614.00
'United Kingdom 5,302,817.00 5,933,115.00 7,254,103.00 7,274,785.00 5,709,821.00
'Belgium 4,339,551.00 5,092,192.00 6,258,115.00 7,260,830.00 5,391,108.00
'Spain 4,406,745.00 4,856,903.00 6,444,109.00 7,759,928.00 5,311,791.00
'Czech Republic 4,056,744.00 4,635,045.00 5,982,851.00 7,365,110.00 4,882,103.00
'Austria 3,916,570.00 4,718,309.00 5,913,590.00 6,918,761.00 4,682,389.00
'Turkey 2,731,357.00 3,336,371.00 4,129,749.00 5,742,371.00 4,550,970.00 *The world aggregation represents the sum of reporting and non-reporting countries
Source: ITC calculations based on COMTRADE statistics
The global import value in items made of iron or steel in 2008 was US$312 billion,
which declined by 24.6 percent to US$235 billion in 2009. The USA is the major
importer, accounting for 12.9 percent and 10.9 percent in 2008 and 2009, respectively.
The import value of the top 15 countries is indicated in Table 124 below.
233
Table 124: Leading Importers of Items Made of Iron or Steel (US$000)
Importers Imported value in
2005
Imported value in
2006
Imported value in
2007
Imported value in
2008
Imported value in
2009
World * 173,021,264.00 208,454,080.00 258,539,712.00 311,837,184.00 235,236,160.00
'United States of America 25,835,268.00 30,343,136.00 33,716,364.00 40,156,844.00 25,569,372.00
'Germany 12,785,598.00 15,235,104.00 18,505,148.00 21,926,012.00 17,981,908.00
'France 8,487,300.00 9,566,788.00 11,922,653.00 13,414,303.00 9,706,551.00
'China 5,696,076.00 6,944,612.00 8,045,630.00 10,547,823.00 8,920,663.00
'Canada 7,031,175.00 8,211,322.00 8,568,208.00 10,179,806.00 7,328,304.00
'Netherlands 3,904,567.00 4,875,406.00 6,116,298.00 7,347,327.00 6,830,941.00
'United Kingdom 6,882,889.00 7,670,878.00 9,891,995.00 9,780,884.00 6,588,334.00
'Republic of Korea 2,553,221.00 3,290,423.00 4,873,724.00 6,324,883.00 6,109,855.00
'Belgium 4,332,092.00 5,056,104.00 6,508,090.00 7,839,085.00 5,347,520.00
'Mexico 5,506,211.00 6,255,126.00 6,643,320.00 6,851,629.00 5,282,210.00
'Japan 4,260,322.00 5,030,303.00 5,691,382.00 6,232,073.00 5,260,056.00
'Italy 4,629,148.00 5,627,897.00 7,483,601.00 8,222,864.00 5,148,014.00
'Algeria 1,015,152.00 2,014,170.00 2,431,646.00 3,545,844.00 4,979,777.00
'United Arab Emirates 1,760,231.00 2,708,042.00 3,732,655.00 5,639,089.00 4,667,359.00
'Kazakhstan 1,565,881.00 1,867,885.00 2,197,255.00 4,387,504.00 4,569,698.00 *The world aggregation represents the sum of reporting and non-reporting countries
Source: ITC calculations based on COMTRADE statistics
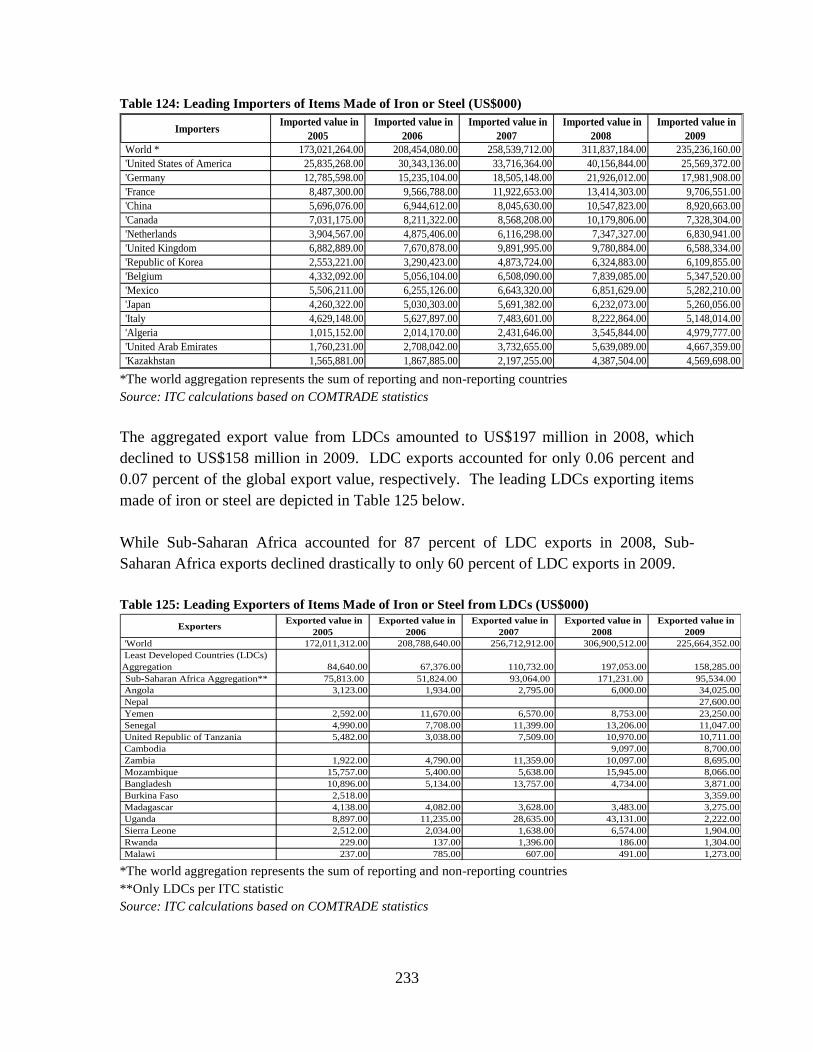
The aggregated export value from LDCs amounted to US$197 million in 2008, which
declined to US$158 million in 2009. LDC exports accounted for only 0.06 percent and
0.07 percent of the global export value, respectively. The leading LDCs exporting items
made of iron or steel are depicted in Table 125 below.
While Sub-Saharan Africa accounted for 87 percent of LDC exports in 2008, Sub-
Saharan Africa exports declined drastically to only 60 percent of LDC exports in 2009.
Table 125: Leading Exporters of Items Made of Iron or Steel from LDCs (US$000)
Exporters Exported value in
2005
Exported value in
2006
Exported value in
2007
Exported value in
2008
Exported value in
2009
'World 172,011,312.00 208,788,640.00 256,712,912.00 306,900,512.00 225,664,352.00
Least Developed Countries (LDCs)
Aggregation 84,640.00 67,376.00 110,732.00 197,053.00 158,285.00
Sub-Saharan Africa Aggregation** 75,813.00 51,824.00 93,064.00 171,231.00 95,534.00
Angola 3,123.00 1,934.00 2,795.00 6,000.00 34,025.00
Nepal 27,600.00
Yemen 2,592.00 11,670.00 6,570.00 8,753.00 23,250.00
Senegal 4,990.00 7,708.00 11,399.00 13,206.00 11,047.00
United Republic of Tanzania 5,482.00 3,038.00 7,509.00 10,970.00 10,711.00
Cambodia 9,097.00 8,700.00
Zambia 1,922.00 4,790.00 11,359.00 10,097.00 8,695.00
Mozambique 15,757.00 5,400.00 5,638.00 15,945.00 8,066.00
Bangladesh 10,896.00 5,134.00 13,757.00 4,734.00 3,871.00
Burkina Faso 2,518.00 3,359.00
Madagascar 4,138.00 4,082.00 3,628.00 3,483.00 3,275.00
Uganda 8,897.00 11,235.00 28,635.00 43,131.00 2,222.00
Sierra Leone 2,512.00 2,034.00 1,638.00 6,574.00 1,904.00
Rwanda 229.00 137.00 1,396.00 186.00 1,304.00
Malawi 237.00 785.00 607.00 491.00 1,273.00 *The world aggregation represents the sum of reporting and non-reporting countries
**Only LDCs per ITC statistic
Source: ITC calculations based on COMTRADE statistics
234
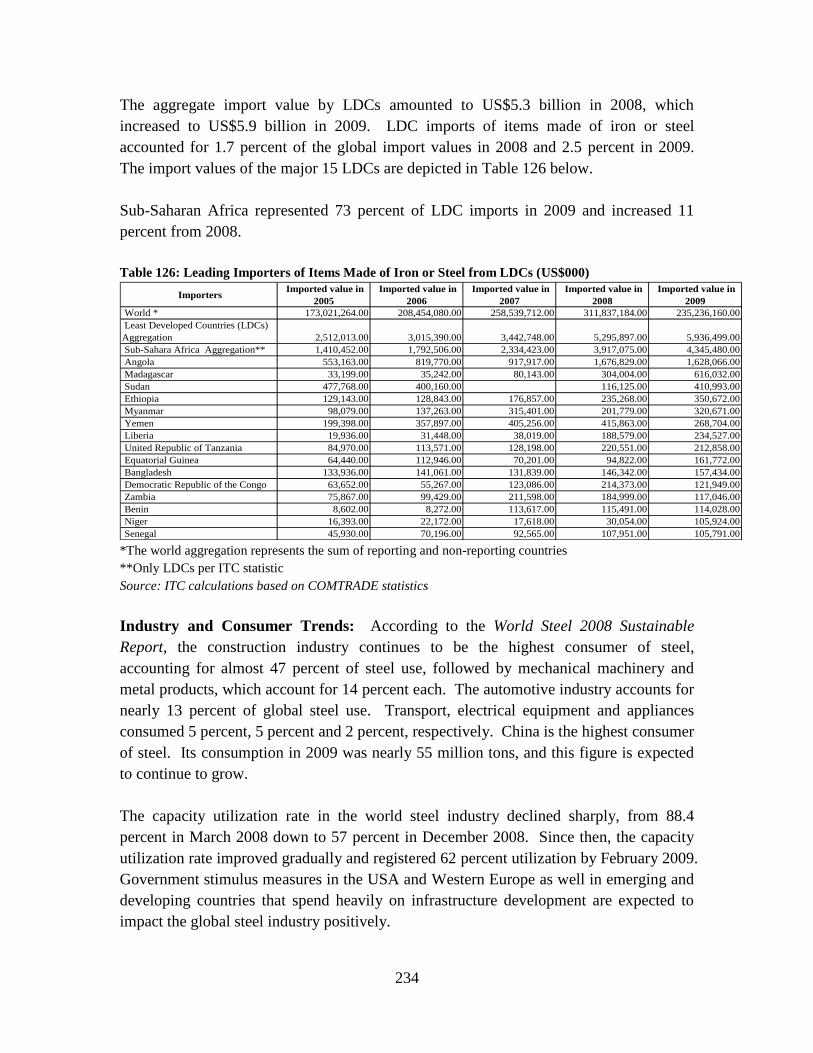
The aggregate import value by LDCs amounted to US$5.3 billion in 2008, which
increased to US$5.9 billion in 2009. LDC imports of items made of iron or steel
accounted for 1.7 percent of the global import values in 2008 and 2.5 percent in 2009.
The import values of the major 15 LDCs are depicted in Table 126 below.
Sub-Saharan Africa represented 73 percent of LDC imports in 2009 and increased 11
percent from 2008.
Table 126: Leading Importers of Items Made of Iron or Steel from LDCs (US$000)
Importers Imported value in
2005
Imported value in
2006
Imported value in
2007
Imported value in
2008
Imported value in
2009
World * 173,021,264.00 208,454,080.00 258,539,712.00 311,837,184.00 235,236,160.00
Least Developed Countries (LDCs)
Aggregation 2,512,013.00 3,015,390.00 3,442,748.00 5,295,897.00 5,936,499.00
Sub-Sahara Africa Aggregation** 1,410,452.00 1,792,506.00 2,334,423.00 3,917,075.00 4,345,480.00
Angola 553,163.00 819,770.00 917,917.00 1,676,829.00 1,628,066.00
Madagascar 33,199.00 35,242.00 80,143.00 304,004.00 616,032.00
Sudan 477,768.00 400,160.00 116,125.00 410,993.00
Ethiopia 129,143.00 128,843.00 176,857.00 235,268.00 350,672.00
Myanmar 98,079.00 137,263.00 315,401.00 201,779.00 320,671.00
Yemen 199,398.00 357,897.00 405,256.00 415,863.00 268,704.00
Liberia 19,936.00 31,448.00 38,019.00 188,579.00 234,527.00
United Republic of Tanzania 84,970.00 113,571.00 128,198.00 220,551.00 212,858.00
Equatorial Guinea 64,440.00 112,946.00 70,201.00 94,822.00 161,772.00
Bangladesh 133,936.00 141,061.00 131,839.00 146,342.00 157,434.00
Democratic Republic of the Congo 63,652.00 55,267.00 123,086.00 214,373.00 121,949.00
Zambia 75,867.00 99,429.00 211,598.00 184,999.00 117,046.00
Benin 8,602.00 8,272.00 113,617.00 115,491.00 114,028.00
Niger 16,393.00 22,172.00 17,618.00 30,054.00 105,924.00
Senegal 45,930.00 70,196.00 92,565.00 107,951.00 105,791.00 *The world aggregation represents the sum of reporting and non-reporting countries
**Only LDCs per ITC statistic
Source: ITC calculations based on COMTRADE statistics
Industry and Consumer Trends: According to the World Steel 2008 Sustainable
Report, the construction industry continues to be the highest consumer of steel,
accounting for almost 47 percent of steel use, followed by mechanical machinery and
metal products, which account for 14 percent each. The automotive industry accounts for
nearly 13 percent of global steel use. Transport, electrical equipment and appliances
consumed 5 percent, 5 percent and 2 percent, respectively. China is the highest consumer
of steel. Its consumption in 2009 was nearly 55 million tons, and this figure is expected
to continue to grow.
The capacity utilization rate in the world steel industry declined sharply, from 88.4
percent in March 2008 down to 57 percent in December 2008. Since then, the capacity
utilization rate improved gradually and registered 62 percent utilization by February 2009.
Government stimulus measures in the USA and Western Europe as well in emerging and
developing countries that spend heavily on infrastructure development are expected to
impact the global steel industry positively.

235
Supply and Demand: According to the World Steel Association (WSA), crude steel
production logged steady growth from 1950 to 1973 (growth rate of 5.8 percent) and
entered a stagnant period from 1974 to 2001 with an average growth rate of only 0.7
percent per annum. World steel production increased from 200 million tons in 1950 to
650 million tons in 1973 and gradually grew to about 800 million tons by 2001. World
crude steel production worldwide has experienced a boom since 2001, registering an
average growth rate of 8.4 percent and attained a total production of 1.33 billion tons in
2008.
Demand for steel is driven broadly by the level of socioeconomic development and the
living standards in a country. In this context, per capita consumption of steel is highest in
industrialized countries and is low in developing countries. A few examples are provided
in Table 127 below.
Table 127: Per Capita Consumption of Steel in Select Countries
Country Per Capita
Consumption in kg
Japan 574.6
USA 372.8
China 132.2
Kenya 65.0
Ethiopia 9.0
Source: Metal Industry Development Institute, Addis Ababa
VI.4. Comparative Sector Profile: Processed Metal Sector
Key Indicators: Employing nearly 3.6 million workers, and with over US$225 billion in
total production in 2009, China is the largest producer of processed metal in the world.
Of the over 24,000 companies operating in China‘s processed metal sector, half are
medium-size companies.
Vietnam, on the other hand, consumes 10.6 million metric tons annually, but over 40
percent of Vietnam‘s steel is imported. Only a fraction of the size of the Chinese market,
the metals sector in Vietnam employs slightly over 130,000 workers. Similar to China,
over 59 percent of the 3,762 firms operating in the sector in Vietnam are medium-size
firms.
In Ethiopia, fabricated metal products accounted for 4.6 percent of the country‘s
industrial production in 2009/10 and employed slightly more than 21,000 workers.
Unlike China and Vietnam, small-scale firms represent 98 percent of the 4,400 firms in
Ethiopia. In all three countries, male workers dominate the sector (73 percent to 91
percent).

236
Zambia is well known as one of the world‘s leading producers of copper. There is,
however, little value addition in terms of processed copper and, further, there is little steel
processing in the country. Reportedly only 43 companies are active in metal processing
in Zambia, with the majority (46.5 percent) being medium size (Table 128).
Table 128: Snapshot of Processed Metal Sectors in China, Vietnam and Ethiopia (2009)
Key Comparative Indicators China Vietnam Ethiopia Zambia
Total Import (US$1,000) 8,920,663 1,548,413 350,672 4,084
Total Export (US$1,000) 33,781,144 706,226 960 9,938
Companies Operating in the Sector 24,547 3,762 4,456 43
Small 20.0% 38.7% 97.0% 32.6%
Medium 50.0% 59.3% 1.6% 46.5%
Large 30.0% 2.0% 0.7% 20.9%
Est. No. of workers in the sector 3,561,638 130,436 21,054 2,360
Male 73.0% 74.0% 91.0% 85.0%
Female 27.0% 26.0% 9.0% 15.0% Source: Global Development Solutions, LLC; COMTRADE
Policy and Regulatory Environment: There is a wide array of tariffs in China covering
processed metal products, but of primary concern for this analysis are tariffs related to
iron sheets and products where the preferential rate for iron sheets is 7 percent and the
tariff rate (regular) for iron products is as high as 90 percent (preferential rate: 20
percent). In Vietnam, tariff rates (preferential) for base metals and metal parts relevant
for this analysis is approximately 27 percent. With this noted, the Common Effective
Preferential Tariff (CEPT) covers other products at an average rate of 2.3 percent.
In China, other taxes and levies relevant to the sector include a 25 percent income tax and
VAT of 17 percent (which is higher than in Vietnam where VAT is 10 percent, but VAT
reimbursements are generally immediate in China). In Vietnam, in addition to the VAT,
enterprises in the processed metal sector face a relatively high income tax (28 percent)
and export tax ranging up to 45 percent. Zambia income tax is high at 35 percent and
VAT is 16 percent. Regardless of raw material or finished goods, duties in Zambia are
25 percent. As Table 129 below indicates, enterprises in Ethiopia face a wide range of
taxes, starting with a VAT (15 percent) – for which refunds are either slow or non-
existent – and income tax ranging up to 35 percent.

237
Table 129: Comparative Policy and Regulatory Environment for the Processed Metal Sector
Iron sheets
(regular) 20%
Padlock, of base metal
(preferential) 27%
Import duties
(COMESA) 18% - 30% Iron ore 25%
Iron sheets
(preferential) 7%
Clasps and frames with
claps, incorporating locks
of base metal (preferential) 27% Customs duty 10% - 30% Iron sheets 25%
Iron product
(regular) 90%
Parts of padlocks and
Locks, of base metal
(Preferential) 27% Iron wire 25%
Iron product
(preferential) 20%
CEPT (over 40,773 fast and
normal track tariff rates)
Average
rate 2.3% Brass alloys 25%
Finished brass products 25%
Finished padlocks 25%
Finished crown cork 25%
VAT 17% VAT 10% VAT 15% VAT 16%
Income tax 25% Income tax 28% Income tax 0 - 35%, 30% Income tax 35%
Other tax 7% Other tax 0% Provident fund tax 10%
Business tax
55 ~ 155
US$ Salary tax 0 - 35%
Export tax 0% - 45% Excise tax 10% - 100%
License fee 1% - 2% Surtax 10%
Turnover tax 2%, 10%
Dividend tax 10%
Royalty tax 5%
Capital gains tax 30%:15%
Withholding tax 3%
Iron sheets 9%
Tax reduction for rural
enterprises
1/7th
reduction of
income tax
rate for 1st
five years
Iron product
5%, 9%,
13%
1 Tariffs
2Taxes and
Levies
3 Subsidies
China (import tariff) Vietnam Ethiopia Zambia
None None
Source: Global Development Solutions, LLC
Enterprises in the processed metal sector in China enjoy a subsidy of 9 percent for iron
sheets and subsidies ranging from 5 percent to 13 percent for iron products. In Zambia,
there are no specific subsidies for the sector but there is a general tax subsidy of 1 1/7th
reduction in income tax for the first five years of operation for rural enterprises. Neither
Vietnam nor Ethiopia enjoys such subsidies, although enterprises in Vietnam enjoy a
preferential rate for electricity and water.
VI.5. Sector Profile for the Processed Metal Sector in Ethiopia, China, and
Vietnam
VI.5.1. Sector Profile: Fabricated Metal Products - Ethiopia
The Ethiopian fabricated metal products sector accounted for 4.6 percent of the country‘s
industrial production in 2009/10. Key products for the year were iron sheets (1,768,355
tons), nails (17,036 tons), iron bars (16,258 tons), wires (2,847 tons), crown cork (1,563
tons), motor vehicle springs (712.2 tons), doors and window frames (42,938 m2) and
ovens/stoves (<100 tons).105
Total imports for the sector amounted to US$240.7 million
(269,101 tons) in 2009; this represented a 46 percent decrease in value and 43 percent
105
The Federal Democratic Republic of Ethiopia Central Statistical Agency, Report on Large and Medium
Scale Manufacturing and Electricity Industry Survey, December 2009, Addis Ababa.

238
less demand from 2008. Leading import partners are China, India, Turkey, Ukraine and
Kazakhstan. There are no fabricated metal exports registered from Ethiopia.
Current capacity of the 14 basic metal companies exceeds 1 million tons. A breakdown
of production by the 14 companies is shown in Table 130 below.
Table 130: Production by 14 Basic Metal Companies in Ethiopia
Item Billet
Reinforced
Bars
Hollow
Section
Corrugated
Sheet Wire Nails
Number of Producers 5 6 4 6 3 4 Source: JICA, Basic Metal and Engineering Industries Firm-Level Study
Eighty-five percent of Ethiopia‘s basic metal and engineering industry product (BMEI)
demand is met by imports. The Ministry of Finance and Economic Development‘s Plan
for Accelerated and Sustained Development to End Poverty II (PASDEP II) will likely
focus on the industry for import substitution. Targets include:
Gross production value in 2014/15 to be five times that of 2010/11;
Steel demand to grow 28 percent per annum until 2014/15: per capita steel
consumption grew from 12.1 kg in EFY 2002 to 34.72 kg in EFY 2007 (3 million
tons total); and
Within five years, demand for BMEI products by major industrial sectors is
expected to be met through local production.
The sector has attracted approximately US$30 million in foreign investment mainly from
India and Pakistan, which each established a steel factory in Ethiopia.
The sector supports 4,456 companies, of which 83.1 percent are informal. Total
employment is estimated to be 21,054 people, with 91 percent being male and 9 percent
female (Table 131).
Table 131: Employment Statistics for Ethiopia Fabricated Metals Sector
Company Size
Estimated Number
of Companies
% of Companies
by Size
Number of
Employees
Average Employees
per Company
Small 4,355 97.7% 15,301 4
Medium 70 1.6% 3,142 45
Large 31 0.7% 2,611 84
Subtotal 4,456 100.0% 21,054
Informal 3,701 83.1%
Formal 754 16.9%
State-owned enterprise 4 0.1% Source: Central Statistical Agency

239
The fabricated metals sector in Ethiopia has the following advantages:
A promising site exists in West Ethiopia, with 22 million tons of ore with high
content of pentoxide vanadium (V2O5) and titanium oxide (TiO2), which increases
value;
Long experience in manufacturing basic metal products;
Availability of manpower commensurate with prevailing technology with the
exception of a few disciplines;
The existence of engineering factories with substantial hardware;
Good experience in structure, tanks, truck body and trailer manufacturing; and
Presence of institutional infrastructure for quality, standardization and services
(QSAE).
Disadvantages are:
High investment requirement for most industries in the metal sector;
Steel industry depends heavily on raw material import; and
Shortage of supply of spare parts.
VI.5.1.1 Supply Chain and Institutional Support Structure: Metal - Ethiopia
Figure 42: Ethiopian Metal Sector Market and Institutional Support Structure Ethiopian Metal Sector Market and Institutional Support Structure
Market structure Institutional Support structure
Old/ Post consumer
metal scraps
- Ministry of Finance
Metal Scrap
Collectors/Dealers
Basic Metal Processing Mfs
Imported
metal ore
Metal Engineering Industry
FDI
LE SMEs
Local Market
- Ministry of Trade and Industry (MOTI)
- Ministry of Finance (MoF)
- Quality & Standard Authority of Ethiopia
(QSAE)
- Ministry of Justice (MOJ)
- Ministry of Capacity Building (MCB)
- Ethiopian Society of Mechanical
Engineers (ESME)
Notes: FDI – Foreign Direct Investment Enterprises; LE – Large enterprises; SMEs – Small and Medium enterprises
Second Hand
metal Products
Imported
fabricated
metal products
Imported
basic metal
products
Local Enterprises
Scrap Collectors: Most of scrap
collectors and dealers are informal
individuals and groups
Basic Metal Processing Mfs:
FDI: 2
Large: 10
Engineering Industry
Small: 4,355
Medium: 70
Large: 19
New/
Industrial
metal scrap
Scrap generators: The main venues of
scrap sourcing are insurance industries
(stocking and selling vehicles and
machines when condemned as total
loss) and service industries like
(Anbessa City Bus, Ethiopian Road
Authority).
Local Industries
LE
Source: Global Development Solutions, LLC

240
VI.5.2. Sector Profile: Fabricated Metal Products - Zambia
Zambia‘s economy has always been dependent on its metal mining industry, dominated
by copper mining, which accounts for about 10 percent of Zambia‘s Gross Domestic
Product (down from 40 percent in 1965) and 90 percent of export revenues. Zambia‘s
industrial sector has long lacked growth, and so has the contribution of the metal and
engineering sector to the national output. The decline in the output levels in Zambia is
also reflected in the reduction of contribution of the industrial sector to GDP from 18.5
percent in 1980 to 10.9 percent in 2008. The situation in the manufacturing sector
decline has been exacerbated by the liquidation of most companies in the mid-1990s,
which resulted in deindustrialization.106
The Zambian metal products subsector has continually only accounted for less than 1
percent of the GDP and only about 1.6 percent of manufacturing output.107
The country‘s
recorded trade deficit of US$108,351,244 in 2009 is on all processed metals.108
Zambia
both imports and exports metal products. According to the Zambia Development Agency,
the major exported items include copper rods, copper wire, power cables, nuts and bolts,
mill balls, aluminum wire, carbon brushes and switch gears.109
The major export
destinations are South Africa, Switzerland, Hong Kong, India, Tanzania, Congo and
Zimbabwe. Padlocks are not produced in Zambia, but the country re-exports a small
number of the imported padlocks (less than 0.5 percent) primarily to Democratic
Republic of Congo. Table 132 shows the export data for all processed metal products for
the period 2007 to 2009.
Table 132: Zambia Metal Sector Exports110
Category 2007 2008 2009
All Processed Metal Products
Volume - Units (kg) 12,854,333 1,369,768 1,726,197
Value (US$) 7,621,779 3,445,798 9,937,652
Crown Cork
Volume - Units (kg) 167,699 17 74,403
Value (US$) 482,833 1,803 175,227
Padlocks
Volume - Units (kg) 352 481 327
Value (US$) 8,734 8,955 7,941 Source: Central Statistical Office/UN COMTRADE
106
Central Statistical Office, Zambia 107
Central Statistical Office, Zambia; Ministry of Commerce Trade and Industry 108
COMSTATS 109
Zambia Development Agency 110
Although this data were reported by both the Central Statistical Office, Zambia and by UN
COMTRADE, nobody was able to provide explanation regarding the variability in values from year to
year.

241
The major sources of imports are China, South Africa, Zimbabwe, Tanzania and Hong
Kong. Table 133 shows the import data for the sector for the period 2007 to 2009.
Table 133: Zambia Metal Sector Imports
Category 2007 2008 2009
All Processed Metal Products
Volume - Units (kg) 1,966,305 2,535,351 1,638,757
Value (US$) 5,017,067 5,906,421 4,084,130
Crown Cork
Volume - Units (kg) 366 7,023 10,010
Value (US$) 440 24,342 40,511
Padlocks
Volume - Units (kg) 98,506 211,740 97,832
Value (US$) 151,927 525,571 303,114 Source: Central Statistical Office/UN COMTRADE
The sector has 43 registered companies and employs approximately 2,360 people. The
male:female ratio is estimated by industry specialists to be 85 percent:15 percent but no
official data is available.
Table 134: Employment Statistics for Zambia Fabricated Metals Sector
Est. no. of firms in the sector (2)
All Processed Metal
Products (Exludes
Ore) Padlocks Crown Cork
Ave no. of
employees
/firm
Small 14 - 0 25
Medium 20 - 0 60
Large 9 - 1 90
Subtotal 43 0 1 2,360
Informal NA 0 0
Formal NA 0 1
State-owned enterprise NA 0 0
Est. no. of workers employed by the sector
% Male 85
% Female 15 Source: Global Development Solutions, LLC; Zambia metals industry experts
Main Issues
Zambia has had a longstanding desire to capture additional economic returns through
value addition to its raw materials before exports. However, for the fabrication of metal
products, the viability of producing and selling these products on a significant scale is
constrained by a number of factors, both on the supply-side and the demand-side.

242
On the supply side, there is little competitive advantage from sourcing metal (copper)
inputs locally, since the price of copper is set by international commodity exchanges and
varies little throughout the world. For example, the only cost advantage that can be
maximized by a Zambian fabricator of copper is in the cost of shipping the cathode for a
fabricator in China. However, that savings is likely to be offset entirely by the Zambian
fabricator having to ship the same weight of (fabricated) copper to China where it will be
used to manufacture the final product. On the demand side, local and regional demand
for semi-manufactures is small due to a lack of an industrial and consumer goods
manufacturing base of any significant size. Additionally, Zambian competitiveness in
this industry on the international market outside Africa is likely to be hampered by
logistical difficulties in servicing these markets reliably.111
Being a landlocked country,
these logistical difficulties include long waiting times at border posts, poor transport
infrastructure and difficulties in accessing seaports. Additional difficulties arise due to
long distance to the major would-be importers.
111
Jobs and Prosperity: Building Zambia‘s Competitiveness (JPC)

243
VI.5.2.1 Supply Chain and Institutional Support Structure: Metal - Zambia
Figure 43: Zambian Metal Sector Market and Institutional Support Structure
Sources of scrap metal are disused mines and equipment. Other sources include waste from processing & engineering
industry.
- Ministry of Mining - Ministry of Commerce
and Industry - Chamber of Mines - Scrap Metal dealers
Association of Zambia - Zambia Development
Agency
- Ministry of Commerce and Industry
- Zambia Development Agency
- Manufacturers Association of Zambia
- Engineering Institution of Zambia
- Zambia Chamber of Commerce and Industry
- Export Board of Zambia - Development Bank of
Zambia
Institutional Support
Structure
Market
Structure Mineral Ore
Mining & Processing
Scrap Metal Dealers and Collectors
Local Enterprises
Basic Metal Processing
LE SME
Local Enterprises
Metal Engineering Industry
LE SME
Export Market
Local Market
Imported Fabricated
Metal Products
Major exports include copper rods, copper
wire, power cables, nuts & bolts, mill balls, aluminum wire, carbon brushes and
switchgear
Overall firm size for the industry: Small: 14 Medium: 20 Large 9
Imported Basic Metal
Products
Imported Metal/All
oys
Notes: i) FDI – Foreign Direct Investment; IS – Informal Sector
ii) Dash line (- - -) indicates a weak linkage, lack of organization, and area where
technical support is required to help strengthen linkages along the supply chain
Dotted arrow indicates scrap
metal from local companies that is recycled back into the supply chain
VI.5.3. Sector Profile: Fabricated Metal Products - China
China is the largest producer and exporter of metals and articles of metal in the world. In
the first six months of 2010, China produced 46 percent of the world‘s crude steel (570
million tons).112
Its output of nonferrous metals is equally strong. According to the
China Nonferrous Metals Industry Association, the output of ten types of nonferrous
metals from China exceeded 26 million tons in 2009 (up 3.99 percent year-on-year).
Refined copper output reached 4.11 million tons, primary aluminum 12.85 million tons,
lead 3.71 million tons, zinc 4.36 million tons, nickel 164,800 tons, tin 134,500 tons,
antimony 165,800 tons, magnesium 500,800 tons, and sponge titanium 61,500 tons.
In terms of exports, after a sharp increase in 2008, metals and articles of metal exports in
2009 decreased to US$115 billion. Almost 7 percent of base metal exports are in the
form of miscellaneous articles. Chinese exports of padlocks, locks, clasps with locks and
keys hover at around US$2 billion per year, making up approximately one-third of the
112
Japan Iron and Steel Federation

244
world trade in this category.113
Chinese exports of stoppers, caps and lids, including
crown corks, increased by 30 percent from 2007 to 2009; at US$130 million per year,
Chinese exports in this category constitute a little less than 40 percent of the world trade
in the category.114
Table 135: Exports of Base Metals and Their Products (Locks and Corks), China, 2007-2009
Total Exports (Value, US$ million) 2007 2008 2009
Base metals and articles of base metal, of which: 77,103$ 144,015$ 115,697$
Miscellaneous articles of base metal, of which: 8,226$ 8,782$ 7,416$
Padlocks, locks, clasps with locks, keys 1,966$ 2,124$ 1,872$
Stoppers, caps and lids, including crown corks 98$ 122$ 130$
Main countries/regions of destination Central Asia, Malaysia, Australia, Japan Source: UN Comtrade
There were nearly 25,000 firms in the metals and metal products industry in China in
2009. The sector employs 3.5 million people.115
Most firms (over 70 percent) are small
or medium-size firms with 100 to 150 employees per firm on average.
One of the world‘s richest countries in terms of resources, China is abundant in metals.
In addition, China has a good technological base and strong economic growth, suggesting
that the country is likely to remain the dominant player in the metals and metal products
113
UN Comtrade 114
UN Comtrade 115
China Statistical Yearbook Network
Tariff on Steel
Ethiopia‘s import tariffs on steel vary according to type of steel.
Tariff Rates for Imported Steel, 2010
Article Tariff rate on CIF value
wire < Ø 6 mm 20%
wire > Ø 6 mm 10%
Sheet metal 5% Source: Ethiopian Customs Agency
With regard to self-sufficiency in steel production, currently there is no basic metal industry that can
extract iron/steel from ore. So far existing engineering companies depend on imported articles of steel.
Recently, a large metals enterprise, Metal and Engineering Corporation (MaEC), has been established
and it is expected to build its capacity and capability to manufacture machinery and equipment for the
entire manufacturing sector. MaEC shall only import components that it cannot manufacture locally. It
may find it plausible to go into basic metal production in the long-run as demand for steel will increase
sharply in light of the rapid development taking place in the country.

245
industry in the near future. Some of the key challenges that are likely to be faced by the
industry relate to:
Ore access – notwithstanding their abundance, metal ores are located in
prohibitively rugged regions of the Chinese northwest. Recent exploration and
site development/modernization deals signed by Chinese metals companies with
multinational firms are illustrations of initiatives aimed at improving ore access in
China.
Energy costs – last year, metal producers in China were stripped of their access to
preferential power rates as utility companies began to address the demand and
supply imbalances with price as well as service interruption interventions. These
measures are expected to increase the price of metal raw materials along the
supply chain.
VI.5.3.1 Supply Chain and Institution Support Structure: Metal - China
Figure 44: Metal Products Market and Institutional Support Structure, China Metal Products Market and Institutional Support Structure, China
Market structure Institutional Support structure
i) FDI – Foreign Direct Investment Enterprises; LE – Large Enterprises; SME – Small and Medium Enterprises ii) Dashed line (- - -) indicates a week
linkage, lack of organization, and areas where technical support is required to help strengthen linkages along the supply chain
Mineral Ores/Mining
Metal Processing
Primary Processed
Metals/Alloys Hardware (Locks,
Corks, etc) FDI LE SME
Local Market Export Market
- Ministry of Land And Resources
- China Iron and Steel Association
o China Metallurgical Construction Association
o China Metallurgical Mining Enterprises Association o China Special Steel Enterprises Association
o China Refractory Materials Industry Association
o China Coking Industry Association
o China Ferroalloy Industry Association o China Structural Steel Association
o China Carbon Industry Association
o Chinese Form-Work Association
o China Scrap Steel Application Association o Metallurgical Planning & Research Institute
o Metallurgical Information & Standardization Research Institute
o Metallurgical Economic Development Research Center
o Metallurgical Information Research Center Metallurgical Human Resources Development Center
o Metallurgical Education Resources Development Center
o Metallurgical Science and Technology Development Center
o Metallurgical Legal Affairs Center o Metallurgical Industry Finance Service Center
o Metallurgical Construction and Quota Center
o Metallurgical Project Quality Supervision Center
o Chinese Society for Metals o Chinese Society for Rare Earth
o Chinese Society for Metallurgical Education
o Metallurgical Council of China Council for the Promotion of International
Trade
- China National Hardware Association
o Tool Hardware Branch Kitchen Apparatus and Stainless Steel
o Building Hardware Branch Lock Branch
o Daily-use Hardware Branch Zipper Branch o Cooking Utensils Branch Shower-bath Products Branch
o Hoods Branch Gas Appliance Branch
FDI LE
Source: Global Development Solutions, LLC
VI.5.4. Sector Profile: Metal – Vietnam
According to the Southeast Asian Iron and Steel Institute (SEAISI), the apparent steel
consumption of total steel products in Vietnam reached approximately 10.6 million

246
metric tons in 2009, just behind Thailand (10.7 million metric tons), and Taiwan (11.7
million metric tons). Over 40 percent of the steel consumed in the country is imported.
(According to the Vietnam Steel Association, the country imported more than 200,000
tons of finished steel products during the first half of 2010.) In addition, Vietnam
imports 94 percent of its metalworking equipment and mechanical products, with only 6
percent of demand met by local manufacturers. Similarly, as industrial production in
Vietnam grows at a pace of 19 percent per year, imports of modern technology continue
to increase at an annual rate of 30 percent.
On the production of raw material, the first cold rolling mill began operating in Vietnam
in 2005, and its rolling capacity is as little as 400,000 tons. As of 2007, there were more
than ten 100 percent privately owned or foreign-invested firms operating in the long
product rolling business. Vietnam continues to be a major importer of low and medium
grade steel products from Japan and also imports even lower grade from Russia, Ukraine
and China, which suggests that the high-grade steel market continues to be limited.
Demand for high-grade hot coil and cold rolled sheets to manufacture mechanical
products such as motorcycles continues to be high, but demand for other high-grade
products such as heavy plates used for large scale industrial production such as
shipbuilding and galvanized steel for automotive production continues to be low.
Despite a period of decline in steel prices earlier in 2010, steel consumption continued to
be slow and producers were suffering from high interest rates. Recently, the declining
price trend reversed and in response to an increase in the price of steel ingots, the
domestic steel price increased in July by VND600,000 – VND700,000 per ton to VND14
– 14.5 million (US$736 - US$762).
Thanks to an increase in price of steel ingots, following a period of decline, the domestic
steel price increased in July by VND600,000 to VND700,000 per ton to VND14 – 14.5
million (US$736 to US$762). Despite the decline in prices, steel consumption continues
to be slow and producers are suffering from high interest rates.
The fabricated metal products sector currently employs approximately 130,436 workers
across 3,762 enterprises (Table 136).
Table 136: Enterprises in the Fabricated Metal Products Sector in Vietnam (2010)
Size Categories No. of Enterprises percent of Total Size of Employees
Small 1,457 38.7 percent < 10
Medium 2,229 59.3 percent 10 – 200
Large 76 2.0 percent >300
Total 3,762 100 percent
Source: Global Development Solutions, LLC

247
Male workers dominate the labor force in the fabricated metal products sector and
represent approximately 74 percent of the workforce.
According to the Ministry of Industry and Trade, as many as 65 steel projects (7 FDI
projects and 58 domestic and joint venture projects) are currently in the pipeline with an
aggregate yearly design capacity of more than 100,000 tons spread across 30 provinces in
the country. In this context, the Ministry has asked cities and provinces to stop granting
new investment licenses to steel projects and revise existing contracts as supply continues
to outstrip demand in the country.
Last year, the industry met 54 percent of the country‘s total demand for steel ingot, and
40 percent of cold steel and 100 percent of building steel demand, but by 2015, it is
estimated that Vietnam will require 15 million tons of steel.
VI.5.4.1 Supply Chain and Institutional Support Structure: Metal - Vietnam
Figure 45: Vietnam’s Iron Ore-to-Steel Market and Institutional Support Structure Vietnam’s Iron ore -to- Steel Market and Institutional Support Structure
Iron ore, scrap steel
Imported
steel scrap
Casting Mfs.
Imported
billet & slabs
Rolling Mills
No. of exploited iron mines: 38
Reserves: 956.415 mil. tons
Long Flat
Export market Domestic market
- Ministry of Industry and Trade (MOIT)
- Vietnam National Coal and Mineral
Industries Group
- Department of Geology and Minerals
of Vietnam
- Ministry of Industry and Trade (MOIT)
- Vietnam Steel Association (VSA)
- Ministry of Planning and
Investment (MPI)
- Local governments
- National Research Institute of
Mechanical Engineering (Narime)
Billets: 11 (MS)
Slabs: 0
Long: 60 (LS: 3; MS: 20; SS: 37) /
Capacity: 6.5mil. tons
Flat: 4 (L/MS) / Capacity: 1,1mil.
tons
Imported flats
(80%)
Notes: i) LS: Large scale; MS: Medium scale; small scale
ii) Dash line (- - -) indicates a week linkage, lack of organization, and areas where technical support is required
to help strengthen linkages along the supply chain
Source: Global Development Solutions, LLC

248
VI.6. Economic Efficiency and Competitiveness in Metal Processing – Crown
Corks
VI.6.1. Ethiopia: Crown Cork
The aim of this section is to establish the basic economics of a representative metal
products activity, crown corks (bottle tops), and its competitiveness vis-à-vis imports.
The comparison with imports is justified because Ethiopia is a net importer of crown
corks, as it is with most metal products. The analysis provides a complement to the VCA
by establishing whether the domestic industry is, can become, or can remain competitive.
The VCA itself looks in more detail at the strategic and business process opportunities for
cost reduction, upgrading, expansion and investment at each production stage over the
next five years.
Only one firm produces crown corks in Ethiopia, and although the VCA survey shows it
is operating at close to full capacity, its cost of production is high, its wastage rates are
high, its labor productivity is low and it is operating with very old equipment. In the case
of crown corks, the survey reveals Vietnam to be a higher productivity, lower cost
production location than China (although the surveyed firms in Vietnam do not appear to
be exporting yet). Ethiopia is importing crown corks, and the price data collected for the
survey indicate a wide range of prices: CIF Djibouti of US$0.0043 to US$0.0110 per
piece.
The average unit economic cost of the Ethiopian producer (calculated by omitting import
tariffs and VAT and estimating an annual capital charge) is approximately $0.0058/piece,
and of this 73 percent is composed of directly imported inputs largely of steel (Table 137).
Production appears profitable, however, since the average selling price of approximately
$0.008/piece is high in comparison with domestic prices in China and Vietnam.
Table 137: Ethiopia Crown Cork: Average Unit Economic Cost
Average
Cost/Piece
Revenue 5729938.0 0.0080
Costs
Imported Inputs 3056040.0 0.0042
Domestic Inputs 0 0
Packaging 129388.8 0.0002
Labor 103316.4 0.0001
Electricity 69065.8 9.59E-05
Water/Fuel 266341.6 0.0004
Laboratory Testing 49642.0 6.89E-05

249
Professional Services 25016.4 3.47E-05
R and M 126935.5 0.0002
Admin 271655.8 0.0004
Capital Cost 97818.7 0.00014
Total Cost 4195221.0 0.0058
Average Unit Cost 0.0058
Source: Global Development Solutions, LLC
The level of Ethiopian production efficiency will depend on what CIF price is used as a
comparison against domestic productions costs. Given the high wastage rates and old
equipment, product quality is likely to be low, which implies that the lower end of the
range of CIF prices is the most appropriate price comparison. Note, however, that this
low CIF price of US$0.0043 is very close to the bottom end of the range of domestic
prices reported for Vietnam. At this CIF price, domestic production in Ethiopia is highly
economically inefficient. Total costs of foreign exchange (allowing for indirect foreign
exchange effects) are greater than the saving of foreign exchange derived if output is
valued at US$0.0043/piece. The net foreign exchange effect is thus negative, creating a
negative DRC indicating significant economic inefficiency (see Table 138 below). This
implies that imported materials are in total being converted into products of lower value
than the cost of the materials themselves (due to the high wastage and inefficient
equipment).
However, the result is very sensitive to the assumed CIF price, and the switching value
price at which the DRC ratio becomes 1.0 is approximately $0.00583 (or approximately
35 percent above the bottom of the current range of CIF prices). In other words, if a CIF
price 35 percent higher is assumed, the production of crown corks becomes competitive.
Table 138: Ethiopia Crown Cork: Economic Efficiency 2010
CIF Price 0.0043
Costs
Imported Inputs 3056040.0
Domestic Inputs
Packaging 129388.8
Labor 103316.4
Electricity Local 34532.9
Electricity: Foreign 34532.9
Fuel: Local 159805.0
Fuel: Import 106536.6
Laboratory Testing 49642.0
Professional Services 25016.4
R and M 126935.5
Admin 271655.8

250
Capital Cost: Local 36339.6
Capital Cost: Import 61479.0
Total 4195221.0
Foreign Exchange
Savings 3096000.0
Direct Use 3056040.0
Indirect Use 202548.6
Net -162588.0
Domestic Resources 936632.3
DRC -5.76
Source: Global Development Solutions, LLC
As with the previous products discussed, two ways in which the economic efficiency of
crown corks could improve are a) better productivity, and b) a realignment of real
exchange rates. Accordingly, as with other products, the assumption is to increase
(double) labor productivity, and then examine how far the Dong or RMB would need to
appreciate in order to render Ethiopian production competitive (i.e., the switching value
of the currencies).
The projections for 2015 with an exchange rate appreciation scenario are complicated
because Vietnam, not China, is the marginal product supply source, but none of the
imports required for local production come from Vietnam. Thus in the calculations for
2015, any projected real appreciation of the Dong has no impact on import costs of
Ethiopian production. Labor is a very small element in total cost (2.5 percent), and even
if labor productivity (pieces per person day) doubles in Ethiopia by 2015, which would
bring it to the average level reported for China in the VCA survey but still below the
level for Vietnam, it would have only a very marginal impact on overall efficiency.
Table 139 gives the DRC result for 2015 assuming a) a doubling of labor productivity,
and b) the real appreciation of the Dong required to make Ethiopian domestic production
competitive assuming an import price of $0.0043/piece remains constant in real terms. It
also shows the new switching value CIF price with higher labor productivity and a
constant real value of the Dong.
Table 139: Summary DRC Results for 2015 Different Scenarios Summary
Assumptions
Doubling labor
productivity, constant real
Dong
Switching value for real
appreciation of Dong
with a doubling of labor
productivity
Switching value for real
CIF price with a doubling
of labor productivity and
constant real Dong
DRC Ratio DRC = -5.44 34 percent appreciation
DRC=1.0
$0.00575/piece
DRC = 1.0

251
Level of
Competitiveness
HIGHLY
INEFFICIENT
MARGINALLY
EFFICIENT
MARGINALLY
EFFICIENT
Source: Global Development Solutions, LLC
Production will remain highly inefficient in 2015 with a doubling of labor productivity
alone. By 2015, on these assumptions a 34 percent real appreciation of the Dong would
also be required to make domestic production competitive with imports from Vietnam. A
real adjustment of this size is very unlikely to occur. At a constant real value of the Dong,
and with the assumed doubling of labor productivity, the effective import price would
need to rise to $0.00575/piece, about 33 percent higher than that currently prevailing.
Based on the above results, current production of crown corks in Ethiopia is
economically uncompetitive, with little prospect for medium term competitiveness
through higher real levels of prices from competing economies like Vietnam and China.
Complete re-equipment to increase productivity through lower material wastage and
lower production costs looks to be the main possibility of producing domestically without
the need for protection.
VI.6.2. Zambia: Crown Cork
The aim of this section is to establish the basic economics of a metal product and its
competitiveness in Zambia. We analyze metal crown corks, which are in significant local
demand as an input into the beverage industry. The VCA looks in detail at the strategic
and business process opportunities for cost reduction, upgrading, expansion and
investment at each production stage, while as in the other cases, the DRC analysis
complements the VCA by establishing whether the industry can be competitive, the
ground that it has to cover to become competitive or, alternatively, how well it can
maintain competitiveness.
The DRC cost adjustment methodology is based on a separate methodological annex –
‗The Methodology for Efficiency and Competitiveness Analysis.‘
In Zambia, crown corks are produced locally and run a positive trade balance, denoting a
product that is exportable at the margin, and where the reference price for the DRC
analysis would therefore be the FOB price. An existing production unit in Zambia has
been taken for this analysis. Average unit economic cost is calculated using firm-level
financial data from the VCA survey adjusted to economic values as follows:
Import tariffs are removed from the value of imported inputs;
VAT is removed from the value of domestic items;

252
An annual capital charge is estimated based on the application of a capital
recovery factor for 12 percent over 10 years to the replacement value of assets;
Overhead costs are allocated to crown cork on the basis of their share in total firm
revenue; and
To allow for indirect foreign exchange content, it is assumed that 80 percent of
fuel and electricity cost is for foreign exchange.116
Table 140: DRC Analysis: Crown Corks – Zambia (US$)
Output (pcs p.a.)
477,440,000
Revenue p.a.
$3,247,800.0
Cost Financial Economic Per kg
Imported
PVC compound (liner) 350000.00 301724.14 0.00063
Tin-free steel 1575997.00 1358618.10 0.00285
Printing inks/varnish/lacquers 126000.00 96183.21 0.00020
Domestic
Printing inks/varnish/lacquers 171509.90 147853.36 0.00031
Cartons 74136.65 74136.65 0.00016
Poly bags/Wrap 6326.33 6326.33 0.00001
Salary/wage for primary output 126810.97 126810.97 0.00027
Electricity 84251.97 84251.97 0.00018
Fuel 25163.77 25163.77 0.00005
Testing equipment 68.85 68.85 0.00000
Safety equipment 1.06 0.00 0.00000
Lab supplies 68.85 68.85 0.00000
Prof services 19254.66 19254.66 0.00004
R and M 42594.00 42594.00 0.00009
Admin 377952.59 377952.59 0.00079
Capital charge 135540.31 135540.31 0.00028
Total cost 2796547.73
Average unit cost 0.00586
Source: Global Development Solutions, LLC
As shown in Table 140, the average unit cost per piece is US$0.00586, which is very
similar to the average unit cost found for Ethiopia of US$0.00583. The domestic selling
price for this firm is reported as US$0.0077, which is a little below the selling price in
Ethiopia. Unlike the Ethiopian firm surveyed, the Zambian firm reports the export of
around 25 percent of its output to the Congo at an FOB price of US$0.0068. No
116
This is an assumption but given the relatively small share of fuel in total cost the results are not sensitive
to it.

253
competing imports are reported into Zambia.117
In the Ethiopian case, Vietnam was a
more competitive exporter than China, but import prices varied widely with quality and
scale of purchase.
Zambia is selling to the Congo at a price that is higher than the bottom of the CIF range
reported for Ethiopia. However, these exports indicate an ability to compete in the
regional market, probably due to transport and marketing advantages relative to China
and Vietnam. Using the FOB price as a measure of value for the product gives a DRC of
0.68, indicating it is competitive, as it can be produced at a cost well below the regional
market export price (Table 141).
Table 141: DRC Estimate: Crown Corks - Zambia (US$)
FOB price 0.0068
Import content
Fuel 0.80
Electricity 0.80
Foreign exchange output 3246592.00
Imported inputs 1756525.45
Indirect imports 87532.59
Net foreign exchange 1402533.96
Domestic resources 952489.70
DRC 0.68
Source: Global Development Solutions, LLC
Medium term Outlook - 2015
Crown cork production currently is competitive in the regional market (e.g., Congo).
Productivity is relatively high under good management, with very low wastage and
absenteeism rates. Production is, however, highly import-intensive with imported steel
nearly 50 percent of total cost, so that any significant adverse relative price shift for steel
on the world market could undermine future competitiveness. If there were a RMB/ZMK
exchange rate realignment by 2015 that saw an appreciation of the Chinese currency, this
would strengthen Zambia‘s competitive position in the medium term, although there
almost certainly would need to be re-equipment of the Zambian plant to ensure adequate
productivity levels are maintained. There is, however, no presumption that unit labor
costs (and the RER) will shift in Zambia relative to China in the medium term.
117
Indian supplies have been quoted as low as US$5.25 per 1000 caps, but no imports have been made.
This is probably because of long standing agreements between the crown cork company and the bottlers,
and partly because demand for corks is highly price inelastic (since they are such a small component of
total cost).

254
VI.7. Value Chain Analysis: Crown Cork (Bottle Caps) 118
The cost of producing crown cork (bottle caps) in Ethiopia is estimated to be about
US$6.60 per 1,000 pieces. In contrast, the same quality caps cost approximately
US$5.66 per 1,000 pieces in Zambia, US$5.28 per 1,000 pieces in China and US$5.01 in
Vietnam. In Ethiopia, crown corks were produced using imported tin-free steel at a
delivered price of US$1,414/ton. In Vietnam, locally available tin-free steel is used at a
price of approximately US$1,360/ton. In China, however, where tin-free steel is readily
available, the delivered price of tin-free steel at the factory gate is approximately
US$1,106/ton. The delivered price in Zambia is highest among the four countries at
US$1,610/ton, largely due to transport logistics.
Key Characteristics: Raw materials account for more than 85 percent of the overall
value chain for the production of bottle caps. The primary raw material (tin-free steel)
accounts for a large portion of the value chain in Ethiopia, Zambia and Vietnam (65
percent, 58 percent and 72 percent, respectively), while in China, however, given the low
price of locally available tin-free steel, it only accounts for 42 percent of the overall value
chain.
The distribution of resources across the value chain is somewhat similar for all countries.
Excluding the primary raw material, the seal making and sealing stage of the production
accounts for 14 percent to 30 percent of the value chain, of which more than 78 percent is
comprised of consumables such as PVC compound and bonding chemicals.
For enterprises in Ethiopia and China, coating and printing is the third largest segment of
the value chain and accounts for 9 percent to 17 percent of the overall value chain. Here
again, consumables account for more than 78 percent of the inputs for this segment of the
value chain. In Vietnam, however, cutting and shaping was the third largest segment of
the value chain, accounting for approximately 5.4 percent of the overall value chain. In
Zambia, coating and painting is the second highest cost contributor to the value chain
(16.8 percent). This is attributed to the high cost of consumables but also the fact that the
technology in Zambia requires LPG (liquid petroleum gas) to run the printing operation
(which adds nearly 19 percent to the coating and painting cost component). The reliance
upon LPG can cause a problem with operations. The LPG is sourced from South Africa
and if it is not available for any reason, as was the case for a week in January 2011, the
printing operations cannot be executed and the line has to shut down.
118
Value chain diagrams in this section reflect actual data from export oriented best practice firms.

255
Figure 46: Crown Cork Value Chain Diagram, Ethiopia
Crown Cork Addis Ababa Ethiopia Unit production cost 6.60 $ (per 1,000) Price of Imported Tin-Free Steel $/ton 1,414 $ Skilled:Unskilled Worker Ratio 1:1.02
Raw material Coating & Painting
Cutting and Shaping
Seal Making & Sealing Packing Admin
65.0% 8.6% 0.8% 17.1% 3.3% 5.2%
Tin-free steel 100.0% Raw material 78.2% Raw material 78.2% Labor 4.0% Labor 1.5% Electricity 4.3% Fuel/oil/ water 17.4%
R & M 11.6% R & M 1.6% Raw material 5.61 $ 85.1% Labor 0.11 $ 1.6%
Packing material 0.21 $ 3.1% Global Development Solutions, LLC

256
Figure 47: Crown Cork Value Chain Diagram, Zambia
Crown Cork Ndola Zambia Unit production cost 5.66 (per 1,000) 0.005661 $ Price of Imported Tin-Free Steel $/ton 1,610 Skilled:Unskilled Worker Ratio 2.8:1
Raw material Coating & Painting
Cutting and Shaping
Seal Making & Sealing Packing Admin
58.3% 16.8% 2.6% 14.4% 3.4% 4.5%
Tin-free steel 100.0% Raw material 65.5% Raw material 89.9%
Fuel/oil/LPG 18.8% Labor 8.5% Labor 8.1% R&M 0.9%
R&M 4.0%
Raw material 4.66 $ 82.3% Labor 0.27 $ 4.7% Packing material 0.17 $ 3.0% Global Development Solutions, LLC

257
Figure 48: Crown Cork Value Chain Diagram, China
Figure 49: Crown Cork Value Chain Diagram, Vietnam
Crown Cork HCMC Viet Nam Unit production cost 5.01 $ (per 1,000) Price of Domestic Tin-Free Steel $/ton 1,360 $ Skilled:Unskilled Worker Ratio 1:0.2
Raw material Coating & Painting
Cutting and Shaping
Seal Making & Sealing Packing Admin
72.4% 3.8% 5.4% 14.8% 2.3% 1.2%
Tin-free steel 100.0% Labor 24.9% Raw material 95.6% Electricity 12.6% Labor 1.1%
Raw material 3.82 $ 86.2% R & M 2.9% Electricity 2.1% Labor 0.22 $ 5.0% Consumables 57.4% R & M 0.8%
Packing material 0.11 $ 2.5% Global Development Solutions, LLC
Crown Cork Guangdong China Unit production cost 5.28 $ (per 1,000 pieces) Price of Local Tin-Free Steel $/ton 1,106 $ Skilled:Unskilled Worker Ratio 1:9
Raw material Coating & Painting
Cutting and Shaping
Seal Making & Sealing
Packing Admin
42.0% 17.1% 3.4% 30.9% 4.2% 2.5%
Tin-free steel 100.0% Raw material 83.9% Raw material 93.2% Labor 15.4% Labor 6.4% Electricity 0.2% Electricity 0.1%
R & M 0.4% R & M 0.2% Raw material 4.50 $ 85.1% Labor 0.69 $ 13.1%
Packing material 0.04 $ 0.8% Global Development Solutions, LLC

258
VI.7.1. Benchmarking Key Variables
The difference in the cost of tin-free steel between Ethiopia and China is approximately
28 percent. However, the average unit cost differential between Ethiopia and China is
more than 36 percent, despite the fact that labor costs for skilled workers in Ethiopia are
less than 58 percent of those in China. These figures suggest that there are substantial
inefficiencies in the only enterprise currently producing bottle caps in Ethiopia. When
compared with Zambia, the cost of tin-free steel is 14 percent higher in Zambia than in
Ethiopia yet in Zambia the unit cost of crown cork production is 18 percent lower than in
Ethiopia.
Capacity utilization at the only production facility for bottle caps in Ethiopia is 99 percent,
and demand for bottle caps in the domestic market continues to outstrip supply as local
breweries prepare to double production. Given quality issues and lack of supply, major
bottlers such as Pepsi and Coca Cola continue to import caps with most coming from
India (44.5 percent) and the EU (42 percent) with some as well from China (4.5 percent).
The situation in Zambia is quite the opposite of that in Ethiopia. Factory utilization for
the lone plant in Zambia is only 52 percent and yet the plant meets more than 75 percent
of the local market demand. While the Ethiopian producer cannot meet demand, the
Zambian producer would benefit greatly from export markets.
Table 142: Benchmarking Key Variables for Crown Cork Production China Vietnam Ethiopia Zambia
1.0 Factory
1.1 Capacity utilization 95% - 100% 70% - 100% 99% 52%
1.2 Installed capacity (x1,000 piece/day) 427 - 2,500 800 - 8,000 5,000 2,667
1.3 Labor absenteeism rate (%) 1% - 2% 0% - 5% 7% 3%
1.4 Average salary/wage/month
1.5 Skilled $265 - $369 $168 - $233 $181 $510
1.6 Unskilled $192 - $265 $117 - $142 $89 $342
1.7 Days of operation/month 26 - 28 26 - 30 30 22
1.8 Average age of major equipment 4.5 - 5.3 1.3 - 1.8 28 11.3
2.0 Exported Output (finished primary product)
2.1 Direct Export without consolidator/broker 0% 0% 0% 26%
2.2 Indirect Export Through Local Consolidator 20% - 60% 0% 0% 0%
2.3 Indirect Export Through Overseas Consolidator 0% 0% 0% 0%
3.0 Domestically Sold Output (finished primary product)
3.1 Direct Sales to Wholesalers/Retailers w/out consolidator 0% 100% 100% 74%
3.2 Direct Sales Through Own Outlets/Shops/Showrooms 40% - 100% 0% 0% 0%
3.3 Indirect Sales Through Local Consolidator/Trader 0% 0% 0% 0%
4.0 Unit production cost ($/1,000 pieces) $4.81 - $5.32 $4.43 - $5.01 $6.91 $5.67
5.0 Avg Selling Price ($/1,000 pieces)
5.1 Factory gate $5.75 - $6.64 $5.13 - $5.80 8.64$ $6.79
5.2 Wholesale $5.90 - $7.08 -$
5.3 FOB price $6.19 - $7.08 -$
Source: Global Development Solutions, LLC
Demand exceeds supply;only one plant in ET
High labor absenteeism
Competitive labor wages bu t narrow
gap compared to VN
Old equipment
High unit productioncost reflects use of
inefficient equipment
Low capacity utilization
As the benchmarking data above indicates, the factory in Ethiopia suffers from high
absenteeism (7 percent) when compared to factories in Zambia, China and Vietnam.

259
Perhaps more notable is the fact that, while labor costs in Ethiopia are competitive, the
labor cost differential between China and Vietnam, particularly for skilled workers, is
substantially less than the gap found in other less technical sectors such as the apparel
sector where the cost of skilled labor in Ethiopia was less than one-third that of China.
This suggests that while labor cost is competitive in Ethiopia, in sectors requiring
technical and engineering skills, low labor costs alone may be insufficient to sustain
competitiveness over the medium- and long-term. The labor cost differential between
Ethiopia and Zambia further illustrates the point considering that the Zambian labor costs
are more than double that of Ethiopia yet unit production cost in Zambia remains lower
than in Ethiopia.
An example of the need for technically skilled labor can be found in the high unit cost of
crown corks produced in Ethiopia, which in part can be attributed to the age of the
equipment (averaging 28 years old) where manual and semi-manual operations continue
to be a part of the production line. The consequence of continuing to use old manual and
semi-manual equipment is reflected in the wastage rate, where 32 percent of the tin-free
steel ends up as scrap.119
In Zambia, China and Vietnam, where newer, automated
equipment is used, the scrap rate is well below 5 percent (refer to Table 143 below).
Table 143: Benchmarking Key Variables for Crown Cork Production (cont.) China Vietnam Ethiopia Zambia
6.0 Avg Spoilage & Reject rate: List different types (3)
6.1 Rejected by firm 2% 0% - 5% 3% 1.5%
6.2 Rejected by clients 3% 0% - 1% 0% 0%
7.0 Waste and Losses
7.1 Metal scrap 5% 1% - 2% 32% 2.5%
7.2 Plastic scrap 5% 1%
8.0 Electricity
8.1 On grid (Cost/kWh) $0.12 - $0.15 $0.05 0.05$ $0.03
8.2 Off grid (Cost/kWh) - self generated 0.19$
8.3 % of time off grid/month 8% 10%
9.0 Water (m³) $0.54 - $0.59 $0.24 - $0.25 0.33$
10.0 Fuel & Oil (liter) $0.92 - $2.95 $0.83 - $0.94 0.64$ $1.45
11.0 Productivity & Efficiency
11.1 Labor productivity (factory level): pieces/person/day (x1,000) 12.9 - 25.1 24.7 - 26.7 10.4 201.9
11.2 Electricity usage: On-grid (kWh/million pieces) 37- 80 1,115 - 1,633 1,050 2,079
11.3 Electricity usage ($/million pieces) $4.60 - $11.76 $56.99 - $83.46 57.55$ $61.76
11.4 Water usage (m³/million pieces) 1.7 - 5.1 9.3 - 11 6.40
11.5 Water usage ($/million pieces) <$0.01 $2.25 - $2.78 2.14$
11.6 Fuel & oil usage (liters/million pieces) 0.5 - 2.8 41 - 42 344.3 0.1
11.7 Fuel & oil usage ($/million pieces) $0.47 - $2.56 $34.78 - $38.69 219.81$ $14.50
11.8 Transport ($/km-ton) $0.08 - $0.18 $0.11 - $0.23 $0.48
Source: Global Development Solutions, LLC
Unsustainable wasteage rate
Low labor productivity
High fuel usage reflects old
equipment and poor quality electricity
Automated processes gives high efficiency
High fuel and oil usage (344 liters per million pieces) is also symptomatic of the age and
inefficiency of the equipment. The fuel consumption rate for a factory in Ethiopia is
119
If the factory in Ethiopia is able to reduce the scrap rate to 5 percent, which is the average rate in China,
holding all other production costs constant, the unit production cost per 1,000 pieces would come down to
approximately US$5.20, which would place the factory in Ethiopia well within a competitive range with
China, but still would not be competitive with a similar facility in Vietnam.

260
more than 300 times that of a factory in China.120
Inevitably, all of these factors add up
to the low labor productivity rate in Ethiopia, where factory workers produce less than
one-half that of their counterparts in China and Vietnam and nearly a factor of twenty
less than in Zambia where the processes are fully automated.
As the benchmarking data suggests, even when all high-cost imported input materials are
excluded from the production costs, due to the use of outdated equipment, fabricating
crown corks is highly uncompetitive in Ethiopia. Specifically, fabrication costs
(excluding the cost of all input material) in Ethiopia are 30 percent higher than in China
and nearly 68 percent higher than in Vietnam (Table 144).
Table 144: Benchmarking Fabrication Costs for Crown Cork
Average Fabrication Costs for Crown Cork (Bottle Caps)*
China Vietnam Ethiopia Zambia
Avg Processing Costs (US$/ton) $0.60 $0.47 $0.78 $0.60
* US$/1,000 pieces
Source: Global Development Solutions, LLC
Despite its inefficiency and high market price, the Ethiopian manufacturer is able to
command a high market price and stay in business.
Currently, there are no policy or regulatory barriers prohibiting or limiting market entry
in this subsector, but the close supplier relationship between bottlers/breweries and crown
cork manufacturers makes it very difficult for new market entrants to penetrate the supply
chain. As the beverage sector prepares to double its production capacity, the Ethiopian
crown cork manufacturer is exploring options to expand production capacity, but in the
absence of plant modernization, it is not anticipated that Ethiopia can remain competitive
in this product segment.
VI.8. Conclusions: Policy Issues and the Possibilities and Actions for Achieving
Competitiveness in the Manufacture of Crown Corks
Current Competitiveness
Ethiopian production currently is characterized by high import-intensity (low domestic
value added), obsolete equipment and high wastage rates of materials. These factors
make local production highly inefficient and only sustainable through forms of protection
(which is not recommended). Even with the projected advantage of lower costs through
120
In Ethiopia, the fuel is used to run backup generators (note that off grid time per month in Ethiopia for
this plant is above 8 percent).

261
reduced RER of the Birr relative to the Yuan and the Dong, with current technology and
practices there is no potential for competitiveness.
Future Competitiveness
The only possibility for production becoming competitive is with re-equipment and
modernization accompanied by appropriate skills upgrading. New equipment is likely to
be accompanied by lower fuel costs and lower repairs and maintenance. The very low
Ethiopian wage levels do not have much bearing on the issue because labor costs are a
very small proportion of the total costs of production.
However, while re-equipment would probably improve competitiveness, it may be that
the combination of economies of scale and low transport costs of crown corks in/from
Asian countries would still prevent crown corks being a priority opportunity for local or
foreign Asian investors in Ethiopia compared to exporting from Asian countries.
Currently, the only viable policy recommendation is to ensure that both financial and
non-financial incentives (e.g., duty free imports, accelerated depreciation, concessionary
loan and trade finance, subsidized training for skills upgrading, etc.) are in place to
reward investments in capital equipment as a part of a broader program to rehabilitate and
upgrade the equipment and technology in the metal products sector, not only for the
purpose of improving price competitiveness, but also to reduce both material and energy
waste.
262
Comparative Value Chain and Economic Analysis
of the Agribusiness Sector (Wheat Milling) in
Ethiopia, Tanzania, Zambia, China and Vietnam

263
VI.9. Wheat Milling Analysis: Objectives
The purpose of the wheat milling analysis is to assess the current competitiveness of the
subsector. To do this, a typical product (production of wheat flour) is analyzed in the
following manner:
Examine important issues and trends in the world agribusiness and food market;
Review the structures of the Ethiopian, Tanzanian, Zambian, Chinese and
Vietnamese milling markets;
Assess the key features, strengths and weaknesses of the existing supply chains
for milling in Ethiopia, Tanzania, Zambia, China and Vietnam;
Assess the overall economic efficiency of domestic wheat flour production in
relation to world prices (as reflected by production prices in China) using
alternative cost projection scenarios to establish current and medium term
competitiveness;
Taking the economic efficiency result as a starting point, analyze the wheat
milling value chain to identify key strengths, weaknesses and opportunities or
needs for investment, expansion or contraction to maintain and increase
productivity and competitiveness of the milling sector at the business strategy and
business process levels; and
Provide possible policy options and recommendations to help stimulate growth
and improve competitiveness in the sector.
VI.10. Product Selection Method
Following a review of the first product screening in which 40 products were selected for
consideration for the value chain analysis and feasibility study, the World Bank (WB)
and Global Development Solutions (GDS)/HQ teams immediately agreed on seven out of
the ten products needed for the analysis. The seven products selected by the teams were
as follows:
1. Apparel:
a. Polo shirt; and
b. Underwear
2. Agribusiness:
a. Milk; and
b. Wheat milling
3. Leather:
a. High-end sheepskin loafers
4. Wood:

264
a. Windows/French windows and frames
5. Metal:
a. Padlocks.
To finalize the selection of the remaining products from the wood, metal and leather
sectors, based on the Africa Competitiveness: Phase 1.1 - Preliminary Product Screening
in Ethiopia report (July 2010), the WB and GDS/HQ teams chose six products as
potential candidates to be included in the list of the final ten products to be the target
products for the value chain analysis and feasibility study. The six products included the
following:
1. Wood products:
a. Wooden doors; and
b. Wooden chairs (not upholstered).
2. Leather products:
a. Leather golf gloves; and
b. Sports footwear of leather.
3. Metal products:
a. Metal doors, window-frame (security window frame); and
b. Aluminum doors and windows.
In order to screen the final six products, a product screening survey was developed which
revolved around six factors:
1. Whether these products are currently produced by companies with less than
50 employees;
2. If companies identified in #1 above can be set up with less than US$100,000
in investment capital;
3. The minimum level of skills and know-how required to produce the products;
4. Whether the products produced by the companies in #1 are being exported;
5. Whether products produced by companies in #1 are consolidated by brokers
or other intermediaries for exports; and
6. Whether companies identified in #1 can readily access raw material inputs in
the market to produce the products.
These questions were posed to the wood, metal and leather sector associations in both
China and Vietnam. Following interviews with sector associations, additional interviews
were conducted at the firm level to identify specifically the level of investments and
minimum level of technical skills required for an entrepreneur or existing SMEs to set up
a production operation. These questions were posed to existing operators in China and
Vietnam to identify whether:

265
Barriers to market entry, particularly from a financial and skills
requirement, were sufficiently low to allow entrepreneurs and SMEs in
Ethiopia to easily establish operations; and
These products are currently being produced by SMEs in China and
Vietnam, and are effectively being sold in local and export markets.
The product screening survey identified the following products as viable candidates to be
targeted for the value chain and feasibility analysis.
1. Wood product:
a. Wooden chairs (soft wood); and
b. Wooden door (semi-solid).
Although French windows and their frames made of wood had originally been
preselected for analysis, a decision was made to opt to analyze both wooden
chairs and wooden doors. This decision stemmed from the fact that French
windows require glass thus introducing an outside factor that could influence
the manufacturing of the final product. Wooden doors (without glass) and
wooden chairs (without upholstery) are more representative of wood
processing exclusively.
2. Leather products: Leather golf gloves or sports glove of comparable structure
and weight.
3. Metal products: Both the pre-selected products (security window frame; and
aluminum doors and windows) were screened out of the selection due to
various factors including high initial investment requirements. As a result,
further analyses of products identified during the preliminary product
screening were conducted. Interviews with metal sector associations and
enterprises currently operating in China and Vietnam, as well as interviews
with existing operators in the fabricated metal products sector in Ethiopia
identified crown corks (bottle caps) as a viable candidate to be targeted for
value chain analysis. Crown corks currently are produced in four of the five
countries, but Ethiopia continues to import substantial volumes of this product,
including imports from China. As a result, crown corks have been chosen as
the final fabricated metal product to be the focus of a value chain analysis in
the target countries.

266
VI.10.1. Respective Government Definitions of Small, Medium and
Large Enterprises in Ethiopia, Tanzania, Zambia, China and
Vietnam
Ethiopia: For Ethiopia, the classification of enterprises into small, medium and large
scale depends on a number of variables such as level of employment, turnover, capital
investment, production capacity, level of technology and subsector. Accordingly, the
following scales are referred to the classification of enterprises in the Ethiopian context
(Table 145).
Table 145: Company Size Classification Structure for Ethiopia
Small Scale Medium Scale Large Scale
Textile and Apparel 5-9 10 – 49 above 50
According to the Central
Statistics Agency (CSA)
Leather 2-10 21 – 50 above 51
Diary 2-10 21 – 50 above 51
Wheat 2-10 21 – 50 above 51
Wood Processing 2-10 21 – 50 above 51
Metal 2-10 21 – 50 above 51
According to Federal
Medium and Small
Enterprise Development
Agency (FeMSEDA)
Sub-sector Remark
Number of Employees
Source: Ethiopia CSA and FeMSEDA
Tanzania: For Tanzania, the classification of enterprises into small, medium and large
scale depends on a number of variables such as level of employment and capital
investment in machinery. The classification cuts across sectors and subsectors of the
economy. Accordingly, the following scales refer to the classification of enterprises in
the Tanzanian context (Table 146). Note that the small enterprise type is most
appropriate for all sectors studied in this analysis.
Table 146: Company Size Classification Structure for Tanzania
Category Employees
Capital Investment in Machinery
(TZS million) Remarks
Micro enterprise 1 - 4 Up to 5 Majority in the informal sector
Small enterprise 5 - 49 5 - 200 Most in the informal sector
Medium enterprise 50 - 99 200 - 800 Most in the formal sector
Large enterprise 100+ 800+ All in the formal sector Source: Tanzania Chamber of Commerce, Industry and Agriculture (TCCIA)
Zambia: Zambia classifies enterprises as micro, small, medium and large based on
several factors including number of employees, annual revenue and capital investment.
The capital investment category is further delineated by whether the firm is engaged in
manufacturing or if it is a trading/services firm. For microenterprises, the minimum
revenue and investment requirements are kept intentionally low in order to encourage
registration, although few microenterprises actually register.

267
Table 147: Company Size Classification Structure for Zambia
Classification Employees
Annual Revenue
(ZMK million)
Capital Investment for Manufacturing
Firms (ZMK million)
Capital Investment for Trading/ Services
Firms (ZMK million)
Micro < 10 < 20 < 10 < 10
Small 10 - 50 150 - 250 80 – 200 150
Medium 51-100 300 - 800 200 – 500 151 - 300
Large > 100 > 800 > 500 > 300
Source: Zambia Development Agency
China: The China government is challenged in defining sizes of firms. Temporary
definitions have been used for the past several years, and the government promised to
revise the standard in 2010. The definition from the National Bureau of Statistics of
China is complex. The definition was published in 2002 jointly by the Ministry of
Finance, National Bureau of Statistics of China, State Economic and Trade Commission
(no longer exists), and China Planning Commission, which has since split and exists as
the State Development and Planning Commission (SDPC) and the National Development
and Reform Commission (NDRC). A simplified presentation of the company size
classification is shown in Table 148. Note that the Industrial type is most appropriate for
all sectors studied in this analysis.
Table 148: Company Size Classification Structure for China
Type Index Unit Small Medium Large
Employee person Less than 300 300-2000 More than 2000
Revenue million RMB Less than 30 30-300 More than 300
Asset million RMB Less than 40 40-400 More than 400
Employee person Less than 600 600-3000 More than 3000
Revenue million RMB Less than 30 30-300 More than 300
Asset million RMB Less than 40 40-400 More than 400
Employee person Less than 100 100-200 More than 200
Revenue million RMB Less than 30 30-300 More than 300
Employee person Less than 100 100-500 More than 500
Revenue million RMB Less than 10 10-150 More than 150
Employee person Less than 500 500-3000 More than 3000
Revenue million RMB Less than 30 30-300 More than 300
Employee person Less than 400 400-1000 More than 1000
Revenue million RMB Less than 30 30-300 More than 300
Employee person Less than 400 400-800 More than 800
Revenue million RMB Less than 30 30-150 More than 150
Lodging and
Catering services
Industrial
Construction
Wholesale
Retail
Transportation
Post services
Source: National Bureau of Statistics of China
Vietnam: A small firm has less than 50 laborers, while a medium-size firm has 51-200
laborers. Within the small and medium-size classifications, there are some detailed
categories depending on the purpose of research and management. For instance, a firm

268
with less than 10 laborers is called a super small-size firm. Such a regulation is in line
with Social Insurance Law.121
VI.10.2. Product Technical Specifications
Following the identification of products to be targeted for the value chain and feasibility
analysis, a detailed technical profile of each product with an accompanying diagram or
photograph was complied and sent to the field teams to help ensure that product data
collection in the field focused on products with similar - if not identical - technical
specifications. Table 149 below provides the product technical specifications for all ten
products for which product data are being collected.
Table 149: Product Technical Specifications
Material
Product WeightUnit of
measureUnit of measure
1 Golf gloves 85 - 141 grams Men's medium Sheepskin
Loafer 780 grams Heel Width Insole
Size US = 8 EU = 7 2.5 10 30
3 Padlock* 760 grams 7 7 NA* cm Brass
Thickness Diameter Height
0.24 31.9 6.6
Width Depth Height
45 45 75
Width Depth Height
80 4 210
Protein Lactose Ash Vitamins Fat content
3.5% 4.7% 0.8% B1, B2, C and D Full
Type (German) Type (French) Ash Protein Moisture
550 55 <0.65%approx.
11%<14.5%
9 Polo shirt 250 - 270 grams 100% cotton
10 Underwear 80 - 100 grams80% cotton/
20% spandex
* Overall height is 14 cm with a 2 cm shackle diameter
** The weight of the cover (plastic sole made from PVC) in the internal surface of the cap is 290 mg
Source: Global Development Solutions, LLC
Pine
Wheat or rice
Dimension
All purpose flour
cm
Refer to diagram
Weight
cm
mm
cm
tin free steel
(tfs)
Sheepskin
Pine
mg
kg
kg
liters
Refer to picture
Crown cork
(metal bottle
cap)**
Wooden chair
Wooden door
Milk
Milling
290
6.5
12
0.5
2
4
5
6
7
8
VI.11. Global Agribusiness Market
Agribusiness is a very wide sector with numerous subsectors and many products within
each subsector. Dairy products and wheat flour are selected for consideration as the
focus of the African Competitiveness (AC) project.
121
Information garnered from
http://laws.dongnai.gov.vn/1991_to_2000/2000/200004/200004280005_en/lawdocum

269
Market Trend (wheat flour): 2008 saw the highest global export in wheat flour, tallying
a total of US$5.2 billion. Exports, however, experienced a sharp decline of 27 percent
and registered a total value of US$3.8billion in 2009. Kazakhstan exported US$849
million worth of wheat flour in 2008 but showed a significant 32 percent decline and
exported wheat flour worth US$574 million in 2009. Turkey became the top exporter in
2009 by exporting wheat flour valued at US$581 million. Argentina, France, Belgium
and Germany are also among the top exporters of wheat flour (See Table 150 below).
Table 150: Leading Exporters of Wheat or Meslin Flour Products (US$000)
Exporters
Exported value in
2005
Exported value
in 2006
Exported value
in 2007
Exported value
in 2008
Exported value
in 2009
World* 2,286,726.00 2,258,634.00 3,476,889.00 5,216,523.00 3,780,594.00
Turkey 426,152.00 272,850.00 424,486.00 617,572.00 581,471.00
Kazakhstan 142,307.00 172,344.00 339,122.00 849,228.00 574,450.00
Argentina 1,473.00 35,006.00 250,082.00 435,452.00 294,838.00
France 157,845.00 177,986.00 242,549.00 359,897.00 259,418.00
Belgium 195,241.00 190,433.00 276,316.00 386,580.00 249,577.00
Germany 145,462.00 160,319.00 200,411.00 295,991.00 222,727.00
United States of America 49,677.00 51,293.00 125,942.00 137,254.00 132,282.00
Russian Federation 42,847.00 43,615.00 92,444.00 197,579.00 121,495.00
United Kingdom 46,401.00 42,404.00 70,581.00 102,131.00 99,047.00
Canada 80,946.00 88,051.00 96,009.00 133,239.00 98,886.00
China 85,667.00 97,033.00 210,520.00 77,368.00 96,003.00
Japan 72,924.00 67,849.00 65,740.00 80,317.00 58,209.00
United Arab Emirates 60,098.00 47,341.00 38,115.00 121,337.00 54,031.00
Netherlands 61,095.00 74,055.00 52,311.00 82,255.00 52,189.00
Australia 64,726.00 64,105.00 74,573.00 108,768.00 44,867.00
*The world aggregation represents the sum of reporting and non reporting countries
Source: Compiled by Global Development Solutions, LLC based on COMTRADE statistics
Global import of wheat flour declined from US$4.9 billion in 2008 to US$3.8 billion in
2009. The top importers of wheat flour are Iraq, Uzbekistan, Indonesia, Brazil, Angola
and the Netherlands. In 2009, Afghanistan became the leading importer of wheat flour
by importing product worth US$360 million (see Table 151).

270
Table 151: Leading Importers of Wheat or Meslin Flour Products (US$000)
Importers
Imported value
in 2005
Imported value
in 2006
Imported value
in 2007
Imported value
in 2008
Imported value
in 2009
World* 2,281,332.00 2,320,998.00 3,420,186.00 4,889,996.00 3,829,739.00
Afghanistan 162,443.00 359,929.00
Iraq 257,854.00 124,676.00 174,131.00 319,660.00 283,251.00
Uzbekistan 66,430.00 71,608.00 160,629.00 314,703.00 223,453.00
Indonesia 128,009.00 143,110.00 180,317.00 271,263.00 223,184.00
Brazil 6,000.00 31,041.00 175,866.00 291,833.00 194,363.00
Angola 76,046.00 91,547.00 122,624.00 169,243.00 128,778.00
Netherlands 93,020.00 86,544.00 127,389.00 223,068.00 117,860.00
Bolivia 26,092.00 33,187.00 67,719.00 115,836.00 103,776.00
United States of America 71,687.00 83,010.00 88,611.00 133,059.00 99,947.00
Tajikistan 48,690.00 52,140.00 101,117.00 153,838.00 99,213.00
Ireland 38,540.00 39,029.00 53,912.00 68,653.00 97,341.00
Hong Kong (SARC) 62,851.00 64,701.00 73,460.00 95,046.00 93,411.00
Spain 11,242.00 51,438.00 103,571.00 112,525.00 92,297.00
France 57,563.00 54,844.00 79,547.00 113,802.00 87,373.00
Belgium 42,846.00 49,325.00 67,827.00 99,240.00 84,455.00 *The world aggregation represents the sum of reporting and non reporting countries
Source: Compiled by Global Development Solutions, LLC based on COMTRADE statistics
The aggregate contribution of LDCs in export of wheat flour in 2009 was only 1 percent
(US$63 million) of the global export value of US$3.8 billion. Although small in value,
the major exporting countries of wheat flour are Zambia, Mozambique and Tanzania (see
Table 152 below).
Table 152: Leading Exporters of Wheat or Meslin Flour of LDCs (US$000)
Exporters
Exported value
in 2005
Exported value
in 2006
Exported value
in 2007
Exported value
in 2008
Exported value
in 2009
World* 2,286,726.00 2,258,634.00 3,476,889.00 5,216,523.00 3,780,594.00
Least Developed Countries
(LDCs) Aggregation 43,890.00 38,195.00 76,775.00 79,839.00 62,915.00
Zambia 6,990.00 11,530.00 15,062.00 24,782.00 20,073.00
Mozambique 2,201.00 692.00 695.00 1,750.00 17,209.00
United Republic of Tanzania 13,786.00 11,567.00 41,074.00 36,669.00 15,585.00
Senegal 2,047.00 5,430.00 4,222.00 6,077.00 3,319.00
Nepal - - - - 2,057.00
Yemen 4,673.00 3,920.00 998.00 4,685.00 1,421.00
Benin 4,568.00 2,403.00 1,439.00 865.00 1,157.00
Togo 7,881.00 3,896.00 132.00 691.00
Uganda 457.00 1,907.00 3,526.00 1,667.00 495.00
Bhutan 1,060.00 - 446.00
Mali - 31.00 795.00 - 159.00
Burundi - - 10.00 - 104.00
Gambia - - - - 73.00
Guinea-Bissau - - - - 37.00
Myanmar - - - 82.00 25.00 *The world aggregation represents the sum of reporting and non reporting countries
Source: Compiled by Global Development Solutions, LLC based on COMTRADE statistics

271
For imports, the LDCs took 22 percent of the global value of US$3.8 billion in 2009.
Afghanistan stands out as a major importer taking 41 percent (US$870 million) of the
total imports by LDCs. Angola is the second largest importer of wheat flour and
accounts for 14 percent of the aggregate LDC import. Although not very significant, the
Democratic Republic of Congo, Somalia, Ethiopia, Guinea and the Sudan are also among
the leading LDC importers of wheat flour (Table 153).
Table 153: Leading Importers of Wheat or Meslin Flour of LDCs (US$000)
Importers
Imported value
in 2005
Imported value
in 2006
Imported value
in 2007
Imported value
in 2008
Imported value
in 2009
World* 2,281,332.00 2,320,998.00 3,420,186.00 4,889,996.00 3,829,739.00
Least Developed Countries
(LDCs) Aggregation 325,068.00 355,418.00 425,576.00 686,665.00 870,211.00
Afghanistan 162,443.00 359,929.00
Angola 76,046.00 91,547.00 122,624.00 169,243.00 128,778.00
Democratic Republic of the
Congo 25,060.00 29,468.00 54,640.00 69,742.00 41,837.00
Somalia 26,598.00 33,230.00 29,185.00 50,099.00 37,167.00
Ethiopia 36.00 456.00 417.00 3,450.00 28,660.00
Guinea 12,431.00 17,233.00 20,216.00 24,619.00 28,460.00
Sudan 10,416.00 5,266.00 4,997.00 28,380.00
Chad 7,978.00 9,006.00 17,805.00 22,992.00 22,497.00
Haiti 12,192.00 17,693.00 16,478.00 21,736.00 21,759.00
Madagascar 13,756.00 13,412.00 12,206.00 2,815.00 21,085.00
United Republic of Tanzania 838.00 1,027.00 337.00 631.00 17,221.00
Djibouti 5,023.00 6,798.00 10,597.00 19,974.00 12,105.00
Burkina Faso 13,896.00 12,017.00
Mali 4,866.00 23,097.00 18,055.00 11,972.00 11,325.00
Maldives 5,646.00 5,672.00 7,769.00 12,936.00 11,019.00 *The world aggregation represents the sum of reporting and non reporting countries
Source: Compiled by Global Development Solutions, LLC based on COMTRADE statistics
Industry and Consumer Trend: According to FAO, per capita caloric intake globally
generally has been increasing since the mid-1960s, although not equally across regions.
The supply of calories remained almost stagnant in Sub-Saharan Africa. In contrast, the
per capita supply of energy has shown a significant increase in Eastern Asia by almost
1,000 kcal per capita per day, mainly in China, and almost 700 kcal per person per day in
East/North Africa. The global average per capita kilocalorie intake per day stands at
2,940. Specifically, it is 3,440 kcal per capita per day in industrialized countries and
2,850 kcal per capita per day in developing countries. The average kilocalorie per capita
per day supply of energy for Sub-Saharan Africa is 2,360.
Dairy Products - Industry and Consumer Trend: According to FAO and
Euromonitor,122
consumer food prices remained high in 2009 and the number of dairy
product consumers is expected to increase by 50 percent over the next seven years.
Overall, the global demand for dairy products is rising by about 2 percent every year.
122 Special Report, Consumer Food Prices Remained High in 2009, FAO and Euromonitor, 2009

272
This increase is driven by population growth in general and the growing per capita
consumption in Asia, particularly in China. Increasing dairy product intake is in line with
the healthy lifestyle trend of the present modern generation.
Wheat flour - Industry and Consumer Trend: According to FAO‘s projection,123
world
wheat production in 2010 will be 646 million tons; down 5 percent from 2009 but still the
third highest on record. World wheat utilization has been raised by 6 million tons,
mainly driven by the expected higher wheat-based feed use in the Russian Federation,
which traditionally uses barley, but its production is expected to drop by 50 percent in
2010. As a result of the combination of a decrease in world wheat production along with
an increase in demand, it is forecasted that wheat stocks by the end of 2011 would be
only 181 million tons, down by 9 percent from its average eight-year level. The stock-to-
use ratio for wheat in 2010/11 is projected to reach 27 percent, down 3 percentage points
from the previous season, but still 5 percent higher than the 30-year low in 2007/08. The
forecast for world wheat trade (including wheat flour) also has been lowered in 2010,
mostly on higher international priceswhich may curb imports of wheat, especially for
animal feeding.
Dairy Products - Supply and Demand: Global milk output in 2009 was 699 million
tons, registering a growth rate of only 1.6 percent against the previous year. Demand
growth from 2008 to 2009, however, was 2 percent resulting, therefore, in a 0.4 percent
gap in demand growth verses production growth. The slow growth pace is attributed to
an increased price for animal feed and poor pasture conditions in South America. The
overall increase in price of animal feed is related to poor harvest of cereal in the major
exporter countries. The global financial crisis has also eroded purchasing power of
consumers as evidenced by a sharp decline of cheese imports – US$1.1billion in 2008
versus US$891million in 2009 – into the Russian Federation, the largest importer of
cheese in the world.
Wheat flour - Supply and Demand: According to FAO, the world cereal production in
2010 fell to 2,238 million tons (including rice in milled terms) from 2,280 million tons in
2009. However, even at this lower level, world cereal output in 2010 would be the third
highest on record and above the five-year average. Among the major cereals, wheat
accounts for most of the reduced production as a result of adverse weather in the leading
producer countries.
At present, it is forecasted that world cereal utilization would slightly exceed production
in 2010/11. This will result in a 2 percent contraction in world ending stocks from their
123
FAO/GIEWS Global Watch Global Cereal Supply and Demand Update, Sep 2010

273
eight-year high opening levels and this, in turn, could lead to a small decline in world
cereal stocks-to-use ratio to 23 percent which is well above the 19.5 percent low level
witnessed in the 2007/08 food crisis period.
VI.12. Comparative Sector Profile: Agribusiness/Food Sectors
Key Indicators: With over US$990 billion in total production, China has become a
major player in the global agribusiness/food sector. For Vietnam, the agribusiness/food
sector is the largest productive sector of the economy and contributes to over 20 percent
of total output (US$22 billion).
In all five countries, the agribusiness/food sector has relatively few large companies. In
China, more than 75 percent of the firms are SMEs; this figure is 94 percent in Vietnam,
92 percent in Ethiopia, 79 percent in Tanzania and 99 percent in Zambia. In China, the
sector employs nearly 10 million workers, of which more than 73 percent are men,
whereas in Vietnam it is estimated that 451,000 are employed of which 45 percent are
men. In Ethiopia, of the 46,000 agribusiness/food sector workers, 76 percent are male.
In Tanzania, the sector employs 44,000 workers, 73 percent of whom are male. In
Zambia, 330,000 work in agribusiness; of these 83 percent are male (Table 154).
Table 154: A Snapshot of the Agribusiness/Food Sectors in China, Vietnam, Ethiopia, Tanzania and
Zambia
Key Comparative Indicators China Vietnam Ethiopia Tanzania* Zambia
Total Imports (Value - US$1,000)* 6,596$ 25,360$ 28,660$ 17,221$ 12$
Total Exports (Value - US$1,000)* 96,003$ 15,848$ 5$ 15,585$ 20,000$
Companies Operating in the Agribusiness/Food Sector 12,903 5,979 1,926 203 33
Small 35% 45.4% 80% 64% -
Medium 40% 48.7% 12% 15% -
Large 25% 5.9% 8% 21% 100%
Estimated Number of Workers* 9,956,316 451,360 46,183 43,792 20,160
Male 73% 45% 76% 73% 83%
Female 27% 55% 24% 27% 17%
* Trade data refers to wheat flour only
** Year 2008 figures in the case of Tanzania. Does not include micro and small firms with less than 10 employees.
Global Developmenrt Solutions, LLC from interviews and national statistics. Trade data from Comtrade.
Policy and Regulatory Environment: For all countries, the agribusiness/food sectors
have a wide array of tariffs (too many to list here). In the case of China, there are over
722 tariffs in the agribusiness/food sector with an average rate of 15 percent. In the case
of Vietnam, there are over 40,773 tariff lines in the Fast and Normal tracks of the
Common Effective Preferential Tariff (CEPT) scheme, which on average has come down
to as low as 2.3 percent. Ethiopia is covered under COMESA with an import duty that
ranges from 18 percent to 30 percent.
Concerning taxes and levies, China has a relatively high tax rate ranging from 10 percent
for fish to 20 percent for maize with a VAT of 17 percent, whereas in Vietnam, the VAT

274
rate is on average 10 percent. Although there are a range of taxes and levies imposed on
the agribusiness/food sector in China, there are also tax refunds that range from 8 percent
for rice to 15 percent for maize, with an average tax refund of 16 percent. Producers in
the other countries do not enjoy a subsidy or tax-refund.
Tanzania does not maintain any direct subsidies or tax preferences for the agribusiness
sector or related agricultural production. As a result, the policy and regulatory impact on
agribusinesses is primarily through external trade tariffs. Like all member countries of
the East African Community (ECA), Tanzania is bound by the Common External Tariffs
(CET). For agriculture and agribusiness goods, member countries commonly apply
exemptions (so called ‗stays‘) on CET.124
For wheat, much to the chagrin of wheat
millers in all ECA countries, most ECA countries maintain a duty of 10 percent on wheat
grains.125
Like in Kenya and other ECA countries, local wheat production is limited and
meets only a small fraction of local demand,126
yet a tariff protective of local producers is
maintained. According to local wheat millers in Tanzania, this tariff generally is a
reflection of regional governments‘ policy goals of propping up domestic wheat prices so
as to protect/stimulate local production. Such a policy generally is considered among
agribusinesses/millers to have no impact on production and leads to final consumer price
increases, because local producers in the region, including in Tanzania, receive
international prices for their wheat anyway, yet their production levels are poor due to
factors other than price that make wheat production in the region uncompetitive. It is
during periods of spikes in international prices (as was the case in 2010 after Russia
imposed a ban on grain exports) that millers have most difficulties with passing on the
duty costs to final consumers of wheat flour – as a substitute food, wheat flour
consumption is highly sensitive to prices increases according to local specialists.
Other tariffs on some major food products are illustrated in Table 155 below.
124
Countries regularly seek exemptions from CET depending on grain and other foods situations in the
local and international markets. Kenya for example has an exemption on maize imports at 0 percent (ECA
duties on maize from COMESA countries is 25 percent and from all other countries is 50 percent). 125
The official ECA tariff for wheat was 35 percent in 2010: Tanzania levied an effective duty rate of 10
percent, Kenya levied an effective duty of 25 percent and consequently reduced it to 10 percent, Rwanda
proposed to ECA to reduce all wheat duties to 0 percent. 126
10 percent-15 percent of local demand of 600,000 tons/year in Tanzania and 30 percent-35 percent
percent of local demand of 900,000 tons/year in Kenya.

275
Table 155: Comparative Policy and Regulatory Environment for the Agribusiness/Food Sector
Preferential
tariff
Average rate
15%Import duties
(COMESA) 18% - 30%
ECA External
Tariffs (non-
COMESA origin):
CEPT (over
40,773 fast
and normal
truck rates)
Average rate
2.3%
Customs duty 10% - 30% Wheat 10%
Wheat/
wheat
flour 0
Maize 50% All dairy 7%
Wheat/meslin flour 60%
Cereal flours other
than wheat/meslin 25%
Milk 60%
Cream/yoghurt
sweetened 25%
Most other
processed foods 25%
VAT 17% VAT 10%
Rice 10% Income tax 28% Income tax 30% VAT 18% VAT 16%
Legume
vegetable13% Other tax 0%
Provident fund Tax 10% Income tax 30%
Income
tax 0%
Maize 20% Business
tax55 ~ 155US$
Salary Tax 0 - 35%
Presumptive
Turnover Tax 1.1%-3.3%
Fish 10% Export tax n.a.Excise tax 10 - 100%
License fee 1% 2%Export Tax 0%
Export levy (tax) -
cashew nuts 15%
Turn over tax (TOT) 2%, 10%
Dividend tax 10%
Royalty tax 5%
Capital gains tax 0%
Tax refund 16% None None None None
Rice 8%
Legume
vegetable11%
Maize 15%
Fish 7%
Wine, soft
drinks,
tobacco,
petroleum
China Vietnam
Over 722
different tariffs
in
agribusiness/
food sectors
Average
rate 15%
3 Subsidies
1 Tariffs
Ethiopia Tanzania Zambia
2
Taxes
and
Levies
Excise duties
Source: Global Development Solutions, LLC
VI.13. Sector Profile for the Agribusiness/Food Sectors in Ethiopia, Tanzania,
Zambia, China, and Vietnam
VI.13.1. Sector Profile: Agribusiness/Food Sectors in Ethiopia
Ethiopia has an agrarian economy and the agriculture sector accounts for 43 percent of its
GDP, 83 percent of its exports and 85 percent of total employment (2008/2009 statistics).
The sector overall has been growing at an average rate of 8.5 percent per annum during
the past four years.127
Major staple crops include coffee, cereals, pulses and oilseeds.
The principal cereals – the main element in the local diet – are teff, wheat, barley, maize,
sorghum and millet. Oilseeds are an important element in the diet stemming from the
fact that the Ethiopian Orthodox Church forbids consumption of animal fats on
Wednesdays and Fridays and other times throughout the year. Niger, flax and sesame
seeds are the most significant oilseeds.
127
NEWBUSINESSETHIOPIA.COM; ―Ethiopia GDP Per Capita Hikes To 217 USD, Says Government‖,
04June2010

276
Agribusiness exports for Ethiopia in 2008/09 totaled approximately US$625 million.
Data from 2007 show green coffee to be Ethiopia‘s leading agribusiness export in terms
of both volume (158,234 tons) and value (US$416,783). Coffee is actually the leading
export overall and the primary foreign exchange earner for the country. Aside from
animal meats and skins, green coffee has the highest unit value (US$2,634/ton) of all
other leading Ethiopian agriculture exports (Table 156).
Table 156: Ethiopia Leading Agriculture (Food) Exports, 2007
Product
Quantity
(Tons)
Value
(1,000 US$)
Unit Value
US$/Ton)
Green coffee 158,234 416,783 2,634
Sesame seed 139,653 132,764 951
Beans, dry 71,194 39,192 550
Chick peas 43,891 25,177 574
Oilseeds (nes) 23,377 19,837 849
Sugar, raw 25,285 16,532 654
Broad & horse beans, dry 41,016 14,783 360 Source: FAOSTAT
Despite the agricultural potential of Ethiopia, the WFP estimates that more than 5 million
people will depend on emergency food aid in 2010. Droughts are common in the country
(six major droughts in the past two decades) and rainfall has been erratic over the past
two years. Complicating the situation are the high food and fuel prices that hit the
country in 2008 along with the persisting global financial crisis. Supplying 65.5 percent
of the total, the US is by far the biggest import partner for fruits and vegetables going to
Ethiopia. Next are Somalia (9.4 percent), Italy, Djibouti and Sudan. Prepared vegetables,
fruits and nuts are imported from France (19.4 percent), UAE (19.2 percent) and Saudi
Arabia (18.3 percent) with five-year cumulative totals of US$4.65 million, US$4.6
million and US$4.38 million respectively. Cereals imported for 2009 totaled more than
US$368 million (US 30.3 percent, Italy 28.1 percent, Romania 14.4 percent, Bulgaria
11.8 percent). Milled grains import for 2009 total was US$54.1 million (US 28.5 percent,
Italy 23 percent, Belgium 20 percent, France 10.4 percent, Ukraine 6.3 percent).
Sector employment is estimated to be 46,183 of which 76 percent are male and 24
percent are female. The majority of companies (63.2 percent) are operating informally
(Table 157).
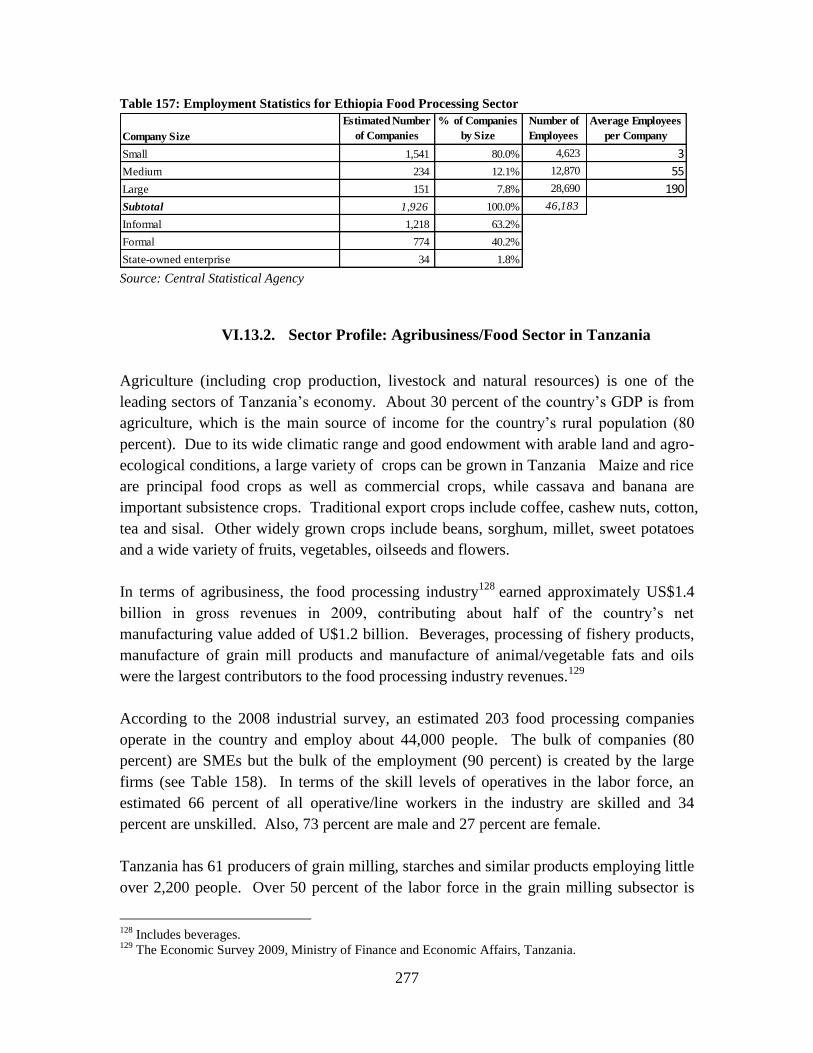
277
Table 157: Employment Statistics for Ethiopia Food Processing Sector
Company Size
Estimated Number
of Companies
% of Companies
by Size
Number of
Employees
Average Employees
per Company
Small 1,541 80.0% 4,623 3
Medium 234 12.1% 12,870 55
Large 151 7.8% 28,690 190
Subtotal 1,926 100.0% 46,183
Informal 1,218 63.2%
Formal 774 40.2%
State-owned enterprise 34 1.8% Source: Central Statistical Agency
VI.13.2. Sector Profile: Agribusiness/Food Sector in Tanzania
Agriculture (including crop production, livestock and natural resources) is one of the
leading sectors of Tanzania‘s economy. About 30 percent of the country‘s GDP is from
agriculture, which is the main source of income for the country‘s rural population (80
percent). Due to its wide climatic range and good endowment with arable land and agro-
ecological conditions, a large variety of crops can be grown in Tanzania Maize and rice
are principal food crops as well as commercial crops, while cassava and banana are
important subsistence crops. Traditional export crops include coffee, cashew nuts, cotton,
tea and sisal. Other widely grown crops include beans, sorghum, millet, sweet potatoes
and a wide variety of fruits, vegetables, oilseeds and flowers.
In terms of agribusiness, the food processing industry128
earned approximately US$1.4
billion in gross revenues in 2009, contributing about half of the country‘s net
manufacturing value added of U$1.2 billion. Beverages, processing of fishery products,
manufacture of grain mill products and manufacture of animal/vegetable fats and oils
were the largest contributors to the food processing industry revenues.129
According to the 2008 industrial survey, an estimated 203 food processing companies
operate in the country and employ about 44,000 people. The bulk of companies (80
percent) are SMEs but the bulk of the employment (90 percent) is created by the large
firms (see Table 158). In terms of the skill levels of operatives in the labor force, an
estimated 66 percent of all operative/line workers in the industry are skilled and 34
percent are unskilled. Also, 73 percent are male and 27 percent are female.
Tanzania has 61 producers of grain milling, starches and similar products employing little
over 2,200 people. Over 50 percent of the labor force in the grain milling subsector is
128
Includes beverages. 129
The Economic Survey 2009, Ministry of Finance and Economic Affairs, Tanzania.

278
employed by the seven (out of nine) wheat milling companies that are currently operating
in Tanzania. Capacity utilization in the food processing industry as a whole is estimated
at 44 percent130
and in the wheat milling subsector it currently stands at 62 percent.131
Table 158: Employment Statistics for Tanzania Food Processing Sector
Company Size
Estimated
Number of
Companies
% of Companies
by Size
Number of
Employees
Average
Employees per
Company
Small 129 64% 2,319 18
Medium 31 15% 2,164 70
Large 43 21% 39,309 914
Subtotal 203 100% 43,792
% of Total % of Total
Manufacturing of grain mill products 61 30% 2,205 5%
Manufacturing of wheat mill products* 7 3% 1,350 3%
State-owned enterprise 11 5%
Ministry of Industry Trade and Marketing, Annual Survey of Industrial Production and Performance, 2008
* Tanzania Grain Millers Association
Note: Does not include micro/small firms employing less than 10 employees
Interviews, Global Development Solutions, LLC
VI.13.3. Sector Profile: Agribusiness/Food Sector in Zambia
Two of the challenges facing the Zambian Government are diversification of the
economy and ensuring that the growth process includes the poor. In its Fifth National
Development Plan (2006-2011), the government recognized agriculture as a niche sector
that can contribute to inclusive and sustained accelerated economic growth in Zambia.
In Zambia, agricultural production is dominated by small-scale producers who account
for more than 70 percent of the farming population. They play a critical role in the
supply of staple foodstuffs, mainly maize. Despite this role, at least 25 percent of small-
scale farmers are food insecure each year. Most of the crops produced by small-scale
farmers are not captured in post-harvest surveys, which makes it difficult to assess
outputs in this area. Most of the recognized agricultural gains are confined to large-scale
producers and emerging farmers, i.e., new entrants to agribusiness that have achieved
some scale. The World Fact Book (2003) reveals that the number of households in the
small-scale farming category has been increasing, while the numbers of medium- and
large-scale farmers have remained largely unchanged over the years. Increased
unemployment, which was estimated at 50 percent in 2006, has encouraged many people
to take up small-scale farming.
The composition of Zambia‘s GDP has not changed significantly during the past decade.
The proportion attributable to agriculture remained virtually unchanged at around 20
percent of GDP. The contribution of the agriculture sector to output, especially crop
130
Annual Survey of Industrial Production and Performance, 2008. 131
Interviews, Tanzania Grain Millers Association, February 2011.

279
production, has varied mainly because the sector is highly weather-dependent. Frequent
droughts in some years and unusually heavy rains during others have often resulted in
widespread crop failure that is further exacerbated by land degradation, poor husbandry
practices and lack of appropriate seed varieties. The sector contribution to GDP of 20
percent is well below the average of 32 percent in sub-Saharan Africa.
Figure 50: Zambia GDP by Source, 1994-2008 (Billion ZMK)
Source: Constructed from CSO database
The sector‘s contribution to GDP measured at current prices has increased from 15.5
percent in 1996 to 20 percent in 2000 (Figure 50). By 2008, agriculture comprised 19.3
percent of GDP. The percentage change in sector contribution to GDP averaged 1.5
percent between 2005 and 2008. GDP data further reveals that agro-processing industries
that depend directly on agriculture constitute 60 percent of Zambia‘s manufacturing.
The rapid growth in copper and copper by-product manufactured exports reduced the
share of agricultural exports from 25 percent of total exports in 2001 to 9 percent in 2009
(Figure 51). Though some agricultural products are exported as raw materials, the bulk is
exported as processed products such as foodstuffs, textiles and garments.

280
Figure 51: Agricultural Products Share of Non-traditional and Total Exports
Source: Compiled by ZDA Exporter Audit Reports, various issues.
Similarly, agricultural products‘ contribution to non-traditional exports (NTEs) declined
from 65 percent in 2001 to 47 percent in 2008. This is explained by rapid growth in the
export of metal products stimulated by the strong performance of copper production,
especially between 2005 and 2008 (Figure 52).
Figure 52: Proportion of Agricultural Exports in Non-Traditional Exports, 2001-
2008 (US$000)
Source: Compiled from ZDA and CSO data sets.
The composition of agricultural exports is presented in Table 159. Primary agricultural
products accounted for more than half of total agricultural exports between 2004 and
2008, with tobacco, maize, coffee and tea the highest contributors.
Total exports

281
Table 159: Prominent Agricultural Exports
Product Export Markets
Beef Angola, Kenya, Malawi, Namibia, Tanzania
Beeswax EU, South Africa, US
Coffee Asia, EU, South Africa, US
Cotton EU, South Africa, US
Cotton lint Asia
Eggs Angola, Kenya, Malawi, Tanzania, Namibia
Floriculture and horticulture products EU, South Africa, US
Honey EU, South Africa, US
Leather EU, South Africa, US
Maize Democratic Republic of the Congo, Zimbabwe
Processed foods Botswana, Burundi, Rwanda, Swaziland
Spices EU, South Africa, US
Sugar Angola, Botswana, Burundi, EU, Democratic Republic of the
Congo, Kenya, Malawi, Namibia, Rwanda, South Africa,
Swaziland, Tanzania, US, Zimbabwe
Tea Angola, Democratic Republic of the Congo, Kenya, Malawi,
Namibia, Tanzania, Zimbabwe
Textiles EU, South Africa, US
Tobacco Asia, EU, South Africa, US Source: Compiled by Global Development Solutions, LLC, based on ZDA exporter audit reports and CSO
database.
In terms of employment, the agriculture sector is the largest employer in Zambia. It
absorbs about two-thirds (70 percent) of the labor force and thus is the main source of
income and employment for the majority of Zambians in rural and peri-urban areas.
Agriculture offers both informal and formal employment opportunities in the country.
However, only a limited number of those employed in the agricultural sector are formally
employed, that is, engaged on a contract that guarantees them periodic pay such as a
monthly salary. In terms of formal employment, the sector accounted for an average of
15 percent between 1960 and 2006. Agriculture has consistently been the second largest
source of formal employment after the services sector, which absorbs over two-thirds of
the formally employed Zambians due to the large pool of government employees in
education and health services. Agriculture sector employment is estimated to be 330,500
of which 83 percent are male and 17 percent are female. The majority of companies are
operating informally (85 percent).

282
Table 160: Employment Statistics for Zambia Food Processing Sector
Company Size
Estimated
Number of
Companies
Percent of
Companies
by Size
Estimated
Number of
Employees
Average
Employees
per Company
Small 10,000 83.42% 200,000 20
Medium 2,000 16.50% 120,000 60
Large 100 0.08% 10,500 105
Subtotal 12,100 100% 330,500
Informal 10,285 85% 280,925
Formal 1,815 15% 49,575
Gender
% Male 83%
% Female 17% Source: MCTI, CSO and Zambia National Farmers Union
The key challenges facing the agricultural sector in Zambia generally are related to value
addition and productivity. Factors that affect crop productivity include:
Lack of government and institutional support;
Limited irrigation (rain dependent);
Inadequate research and development for improved seed varieties;
Weak business orientation of farmers;
High transaction costs including high transport costs;
Non-codified land tenure system;132
Poor trade policies and low competitiveness; and
Limited agricultural finance.
Factors affecting livestock productivity include:
High prevalence of animal diseases;
High cost of veterinary drugs;
Inadequate livestock nutrition and water;
Poor animal husbandry practices/management;
Inadequate marketing infrastructure; and
Lack of appropriate livestock research.
VI.13.4. Sector Profile: Agribusiness/Food Sector in China
Accounting for approximately 12 percent of GDP, China‘s agricultural sector grows
approximately 8 percent annually. More than 300 million people work in agriculture
132
About 80 percent of the land in Zambia is under customary law governed by traditional rulers versus
individually owned and deeded. Land users typically do not have title or ability to use the land as collateral
to secure financing and can be evicted from land by the tribal rulers/chiefs at any time.

283
related jobs, which is almost half of the Chinese workforce. China is the world‘s leading
producer of many crops, including significant staples of soybeans, wheat, rice and corn.
Arable land in China is less than 1ha per household (versus 100ha in the US, for
example). More than 75 percent of the country‘s arable land is used for producing food
crops – a full quarter of the country‘s arable land is used for cultivation of its most
strategic crop, rice.
The Chinese agricultural technology is slowly improving, but the production efficiency
continues to lag behind western countries. With decreasing supply of soybeans, corn and
wheat in the face of increasing demand, China has changed from being a net exporter to
being a net importer of major agricultural crops. In 2009, China imported agricultural
products worth US$46 billion while it exported US$38 billion worth of the same. The
most sizeable trade imbalances were in oilseeds oleaginous fruits (net import of US$19
billion), animal or vegetable fats and oils (US$7 billion) and meats (US$1 billion).133
In the case of the Chinese dairy industry, according to National Bureau of Statistics of
China, total annual output in 2009 was 35 million tons worth US$29 billion. The sector
employs 10 million people. More than 13,000 firms are involved in milk production
alone.
Some of the key challenges of the agricultural sector in general are related to:
Agricultural productivity/technology – because China feeds so many people
(1.3 billion) on relatively small land size, the country needs increasingly
higher utilization of high productivity/technology agriculture to meet its
increasing food needs. To date, Chinese agriculture is relatively limited in
terms of high productivity/technology compared to developed economies. For
example, some experts estimate that by 2030, if water usage continues at
current levels, there will be a shortage of water that will put China into a crisis
level - China uses 70 percent of its water for agriculture but improved
irrigation techniques are not commonplace.
The rural-urban migration – in 1960s, 20 percent of China‘s population was
urban. In 2007, the urban population was 42 percent of the total. By 2025, 65
percent of Chinese are expected to live in urban areas. This seemingly
unstoppable urbanization of the Chinese population has serious implication
for labor availability in rural/agricultural areas.
133
Data compiled from UN Comtrade

284
VI.13.5. Sector Profile: Agribusiness in Vietnam
Vietnam‘s growing agricultural sector accounts for over 27 percent of the country‘s
combined GDP and employs over 70 percent of its workforce. In 2009, Vietnam
achieved bumper harvests of its two main export crops, rice and coffee. The production
of rice reached 35.6 million tons (up 6.8 percent), of which 5.75 million tons were
exported during 2009 – 2010. Export of coffee grew 7.3 percent to reach nearly 1.2
million tons. With domestic consumption of coffee being less than 5 percent of
production, the coffee sector is highly reliant on export markets. The total export of food
and agricultural products is estimated to be approximately US$3.2 billion.
Despite strong growth in the agribusiness sector, according to the Ministry of Industry
and Trade (MOIT), the country continues to import significant amounts of food and farm
products. During the first two months of 2010, the country imported over US$280
million worth of food and agricultural products, an increase of 56 percent from the
previous year. The largest increase in imports included vegetables (127 percent); refined
vegetable oil and fat from Indonesia and Malaysia (96 percent); finished products from
cereals, starch and milk from Australia (99 percent); and fish and animal meat from India
and US (79 percent). In 2008, total import of food and agricultural products was
approximately US$7.3 billion. Vietnam‘s main sources of imports for food and
agricultural products are: India (16 percent), US (13 percent), China (11 percent), Hong
Kong (7 percent) and Indonesia (6 percent).
Under the ASEAN-China Free Trade Agreement and CEPT, commitments among
ASEAN countries have made import products cheaper where import tariffs are between 0
– 5 percent. While such agreements are favorable for consumers, there is concern that
Vietnam will need to reduce its reliance on imported food and agricultural products
through more stringent application of technical and quality specifications.
VI.14. Economic Efficiency and Competitiveness in Food Processing - Wheat
Milling
VI.14.1. Ethiopia: Wheat Milling
The aim of this section is to establish the basic economics of a representative agro-
processing activity - the wheat milling industry - and its competitiveness vis-à-vis
imports. The comparison with imports is justified because Ethiopia is a net importer of
milled grains. The analysis provides a complement to the VCA by establishing whether
the industry can be competitive, the ground that it has to cover to become competitive or,
alternatively, how well it can maintain competitiveness. The VCA itself looks into more
detail at the strategic and business process opportunities for cost reduction, upgrading,
expansion and investment at each production stage over the next five years.

285
The six Ethiopian firms covered in the VCA survey produce wheat flour for the domestic
market only. A composite domestic wheat mill has been created for this analysis by
taking a weighted average of the cost structure of these firms. Average unit economic
cost is calculated according to the following procedures:
Import duties and VAT are deducted from the market price data; and
Capital assets are valued at replacement cost, and an annual charge is derived by
the application of a capital recovery factor for a ten-year life and 12 percent
discount rate.
In order to assess the economics of wheat milling, it is necessary to take into account the
by-products of the mill and how far the overheads and operating costs are allocated to by-
products. The output data from the VCA refer to milled wheat flour, and the share of
output of the by-products bran, waste and germ is applied to these output figures to
estimate total by-products. The reported share of bran is approximately 25 percent of
output for all of the surveyed firms, and here this is valued at the local market price,
which is equivalent to approximately US$90/ton; lower valued by-products of waste and
germ are small enough in both quantity and value to be ignored. For the composite firm,
the value of by-products derived in this way is deducted from production cost to give the
net cost of milled flour. Hence, by-products are not included in the benefit stream for the
efficiency calculations.
Before the adjustment for by-products, the average unit economic cost is US$391/ton of
wheat flour, with domestic wheat providing the bulk of this (around 75 percent). When
by-product costs are deducted, the economic cost of milled wheat alone is US$368/ton
(Table 161).
Table 161: Ethiopia Wheat Milling: Average Unit Economic Cost for Composite Firm
Composite Total Average Unit Cost
Quantity 111471.2
Revenue 57040791.0 511.71
Imported Inputs 5982535.0 53.67
Domestic Inputs 33681768.0 302.16
Packaging 95012.8 0.85
Labor 291800.0 2.62
Electricity 142662.8 1.28
Water/Fuel 77845.2 0.70
Laboratory Testing 64074.2 0.57
Professional Services 10592.6 0.10
R and M 77185.2 0.70

286
Admin 2414267.0 21.66
Capital Cost 754500.2 6.77
Total 43592243.0
Average Unit Cost 391.06
By-Product 2508102.0 22.50
Average Unit Cost Net of By-Products 368.56
Source: Global Development Solutions, LLC
This composite average economic cost is below the range of market price costs (US$415
- US$458) reported in the VCA survey largely due to the omission of import duties and
VAT. For the economic analysis, wheat flour is treated as an importable, and the average
unit cost in Ethiopia is compared with the reported FOB prices from China plus transport
margin to Ethiopia. A range of FOB prices of US$295 to US$324 are reported in the
VCA survey, and the bottom of the range plus a 33 percent margin for transport and other
trade costs (i.e., US$392/ton) is used as the regional CIF price for exports from China
into the region. The high transport and trade margin is based on data collected for the
study on the cost of shipping by container from Chinese ports to Djibouti with an
addition for the cost of port handling and insurance. The estimated figure of
approximately US$96/ton refers to shipment in 20-foot containers with a cargo of 20 tons.
This margin added to an FOB price of US$295 is used as the maximum possible import
price in the regional market.
As with other products, the indirect foreign exchange content of electricity, water/fuel
and capital costs is approximated and the net foreign exchange effect is calculated by
taking output valued at the CIF price from China minus the sum of direct and indirect
imports. Currently, with an average unit economic cost of US$368, Ethiopian production
is efficient due to the strong natural protection afforded by distance from China, showing
a DRC ratio of 0.93 (Table 162). The value attributed to domestic wheat is the key
element in determining costs, and were this to rise by 8 percent it would make domestic
wheat milling uncompetitive with Chinese flour.
Two sources of possible increase in competitiveness are examined: a) Ethiopian
productivity, and b) real exchange rates of competitor sources.
With regard to productivity, the VCA analysis does not show significant differences
between mill-level labor efficiencies in Ethiopia and China/Vietnam and therefore no
‗catch-up‘ effect has been projected in Ethiopia through these means. Labor costs are a
very small component of total milling costs in Ethiopia compared to China/Vietnam
because of very low Ethiopian wages. Thus even if there were potential labor
productivity gains in the mill they would not make a significant difference to
competitiveness.

287
Since wheat milling currently is competitive, any advantage obtained by exchange rate
movements would be unnecessary. Any real appreciation of the RMB in the medium
term serves to improve the competitive position of Ethiopia. Table 162 shows the DRC
estimate in 2015 for alternative real appreciations of 8 percent and 16 percent of the
RMB (assuming all imported flour imports into domestic milling come from China) and
the switching values for the cost of domestic wheat. Under these scenarios, the DRC
ratios fall to 0.86 and 0.80, respectively. In such cases, it would be possible for the price
of domestic wheat to increase and still remain a competitive product.
Table 162: Competitiveness Table
Year 2010 2010 2015 2015
Assumptions Base Year No by-products
8 percent real
RMB
appreciation
16 percent real
RMB appreciation
DRC Ratio 0.93 1.0 0.86 0.80
Level of
Competitiveness EFFICIENT
MARGINALLY
EFFICIENT EFFICIENT EFFICIENT
Source: Global Development Solutions, LLC
The sale of by-products partly to offset the costs of milling is an important factor in
making the wheat mills competitive, and with no allowance for by-products, milled flour
is only marginally competitive in 2010 with a DRC of almost exactly 1.0. For current
competitiveness it is thus important to ensure adequate revenues are obtained from by-
products.
The capacity utilization of Ethiopian mills at 70 percent is well below those of China
(100 percent reported) partly because Chinese mills are both smaller in scale and closer to
sources of supply, resulting also in lower wastage rates, transport costs, etc.
Downscaling and decentralizing milling activities may be an important strategy for
Ethiopian investors to consider in order to maintain competitiveness. But, short of the
longer term change in technology and organization, there do not seem from the data to be
major potential relative productivity gains in milling. The major cost of milling derives
from further up the value chain, that is, in the cost of material inputs, which in Ethiopia
comprise over 80 percent of costs (at market prices currently paid). Therefore, the key
long term change that would decrease production costs further is improvement in
agricultural practices leading to higher productivity through methods like greater use of
irrigation and higher yielding seeds.
In the medium term, Ethiopian wheat milling will maintain its competitiveness against
Chinese imports due to natural protection through high transport costs from China and
from anticipated changes in relative exchange rates. Modernization and improvement in

288
agricultural practices would ensure this position vis-à-vis more distant competitors,
although competition from neighboring African countries might be a factor.
Table 163: Ethiopia Wheat Milling: Efficiency Estimates 2010
Costs
Imported Inputs 5982535
Domestic Inputs 33681768
Packaging 95012.75
Labor 291800
Electricity: Local 71331.41
Electricity: Foreign 71331.41
Fuel/Water: Local 46707.13
Fuel/Water: Foreign 31138.09
Laboratory Testing 64074.22
Professional Services 10592.59
R and M 77185.19
Admin 2414267
Capital Cost: Local 280296.8
Capital Cost: Foreign 474203.4
Total 43592243
Foreign Exchange
Saving 43735725
Use 6559208
Net 37176517
Domestic Resources 34524933
DRC 0.928676
Source: Global Development Solutions, LLC
VI.14.2. Tanzania: Wheat Milling
The aim of this section is to establish the basic economics of a representative agro-
processing activity - the wheat milling industry - and its competitiveness vis-à-vis
imports. Tanzania is a net importer of wheat, and therefore, for the purposes of
estimating efficiency, we compare domestic costs with the import price. The VCA looks
in detail at the strategic and business process opportunities for cost reduction, upgrading,
expansion and investment at each production stage, while as in the other cases, the DRC
analysis complements the VCA by establishing whether the industry can be competitive,
the ground that it has to cover to become competitive or, alternatively, how well it can
maintain competitiveness.

289
The DRC cost adjustment methodology is based on a separate methodological annex –
‗The Methodology for Efficiency and Competitiveness Analysis.‘
A composite domestic wheat mill has been created for this analysis by taking a weighted
average of the cost structure of the surveyed firms. Average unit economic cost is
calculated according to the following procedures:
Import duties and VAT are deducted from the market price data; and
Capital assets valued at replacement cost and an annual charge is derived by the
application of a capital recovery factor for a ten-year life and 12 percent discount
rate.
In order to assess the economics of wheat milling, it is also necessary to take into account
the by-products of the mill and how far the overheads and operating costs are allocated to
by-products. Based on output data from the VCA, the share of bran, waste and germ is
approximately 25 percent of output for the surveyed firms, and this value was deducted
from production cost to give the net cost of milled flour.
Wheat milling in Tanzania is based on imported wheat, which is imported duty free at a
price of around US$265/ton. Local milling has a conversion ratio of approximately 1.3
tons of wheat per ton of grain. Wheat flour sells in the local market at around US$435
per ton, with the by-product wheat bran selling at around US$110/ton. Only limited data
on productions costs were reported in the VCA survey and the replacement cost of capital
assets has been based on the depreciation charge.
Unit economic cost per ton of wheat flour before deduction of by-product revenue is
US$421, and net of by-product revenue it is US$394 (Table 164). These figures are
between US$26 and US$30/ton higher than in Ethiopia. No data is available on
competing imports of wheat flour to Tanzania. In the Ethiopian case, the competitor
price was taken as the FOB price from China and adjusted for trade and transport margins,
which gave a CIF price to East Africa of US$392/ton of flour. At this price, wheat flour
in Tanzania is marginally uncompetitive with a DRC of slightly above unity (Table 165).

290
Table 164: DRC Analysis: Wheat Milling - Tanzania (US$ cost per ton of flour)
Costs Financial Economic
Wheat 362.08 362.08
Wharfage 10.18 10.18
Stevedoring 7.29 7.29
Insurance 0.44 0.44
Transport charge – port to silo 7.22 7.22
Milling:
Plant/Health/Official Inspections 0.10 0.10
Tallying 0.08 0.08
Power 9.70 9.70
Salaries/Wages 6.00 6.00
R and M (plant/machinery) 1.50 1.50
R and M (building) 1.00 1.00
Insurance of plant machinery 0.35 0.35
Packing material 5.50 4.74
Capital charge 10.00 10.00
Total 421.45 420.69
Minus bran sales 27.50 27.50
Net 393.95 393.19
Conversion 1.39 tons of wheat/ton of flour.
Assume zero tariff on wheat imports.
Depreciation used as capital charge.
Bran by-product 25 percent, i.e., 0.25 tons per ton of flour at US$110.
Source: Global Development Solutions, LLC
Table 165: DRC Estimate: Wheat Milling - Tanzania
CIF Price per ton
US$392.00
Foreign exchange savings 392.00
Direct imports 362.08
Indirect imports 7.76
Net foreign exchange 22.16
Domestic resources 23.35
DRC 1.05
Breakeven price 393.19
percent increase for breakeven 1.00
Source: Global Development Solutions, LLC
Medium term Outlook - 2015
Wheat milling appears from this data currently to be marginally internationally
competitive. In the medium term, it requires only a 1 percent increase in overall
productivity to bring the DRC ratio down to unity, which suggests this is a promising

291
area for further investment. However, wheat used in the plants surveyed is imported and
is around 85 percent of total cost. Hence, the operation is highly sensitive to the price
and availability of wheat. Current calculations use an import price to Tanzania of
approximately US$260 per ton. If this price were to rise in real terms, it would clearly
undermine the viability of operations.
VI.14.3. Zambia: Wheat Milling
The aim of this section is to establish the basic economics of food processing and its
competitiveness with respect to wheat milling in Zambia. The VCA looks in detail at the
strategic and business process opportunities for cost reduction, upgrading, expansion and
investment at each production stage, while as in the other cases the DRC analysis
complements the VCA by establishing whether the industry can be competitive, the
ground that it has to cover to become competitive or, alternatively, how well it can
maintain competitiveness.
The DRC cost adjustment methodology is based on a separate methodological annex –
‗The Methodology for Efficiency and Competitiveness Analysis.‘
In Zambia, wheat is a net export and is therefore valued by reference to export prices.
Wheat milling is based on domestic wheat, but both the milling cost and selling price of
milled wheat flour in Zambia are well above those in both Ethiopia and Tanzania. The
reason for this is partly due to high fertilizer and transport costs. In Zambia, wheat flour
sells for as much as US$700/ton as compared with US$435 per ton in Tanzania (the
reason for the wide discrepancy both between costs and selling price and across countries
may be partly explained by a government regulatory barrier requiring a premix in the
flour). The by-product wheat bran sells at around US$90/ton.
Despite this high price and cost structure, Zambia is a net exporter of wheat flour to
neighboring countries, with an average export unit value of US$690/ton in 2009. Data on
production costs were taken from the VCA survey for two representative firms, with the
data for one appearing to be the more reliable. Efficiency estimates are based on costs
for this firm. No data on the replacement cost of capital assets were reported, and the
per-unit capital charge applicable to Ethiopian mills is used. As in the other country
cases, unit costs are estimated net of by-product revenue, with the by-product output and
price reported by the firm used to derive by-product revenue.
For the economic analysis, the following adjustments are made to financial values:
VAT at 16 percent is deducted from items on which it is imposed;

292
Domestic wheat is supplied from elsewhere in the corporation at a transfer price
of $500 per ton. As this is above the market price for domestic wheat of
US$400/ton, (as reported by the other firm in the VCA survey), the lower price is
used to value domestic wheat; and
An indirect foreign exchange content of 80 percent is assumed for fuel and
electricity.
Unit economic cost per ton of wheat flour before deduction of by-product revenue is
US$543/ton (as compared with US$421 in Tanzania), and net of by-product revenue it is
US$518 (as compared with US$394 in Tanzania) (Table 166). These figures are around
US$150/ton higher than in Ethiopia. In the Ethiopian case, the competitor price was
taken as the FOB price from China and adjusted for trade and transport margins, which
gave a CIF price to East Africa of US$392/ton of flour. At this price, wheat flour in
Zambia clearly is uncompetitive with a DRC of 1.33. However, if exports to the regional
market at the price of US$690/ton are sustainable, then production is competitive at this
high export price with a DRC of 0.75 (Table 167).
Table 166: DRC Analysis: Wheat Milling – Zambia (US$ per ton)
Wheat 24000 tons US$ per ton 622.30
Bran 5040 tons US$ per ton 90.00
Cost Financial Economic Per ton
Imports 248900.0 248900.0 10.37
Domestic 14936000.0 11948800.0 497.87
Packaging 188323.4 162347.8 6.76
Wire/thread 7180.9 6190.4 0.26
Plastic bags 212.8 183.4 0.01
Labor 111063.8 111063.8 4.63
Electricity 3191.5 3191.5 0.13
Fuel 29783.0 29783.0 1.24
Safety equipment 3000.0 3000.0 0.13
R and M 6383.0 6383.0 0.27
Admin 339439.8 339439.8 14.14
Capital charge 35280.0 7.00
Total cost 15873478.1 12894562.6
Average unit cost 542.80
Less By-product 453600.0
Total economic cost 12440962.6
Average unit economic cost 518.37
Source: Global Development Solutions, LLC

293
Table 167: DRC Estimates: Wheat Milling - Zambia
Border price CIF US$392 FOB US$690
Foreign exchange value 9408000.0 16560000.0
Direct imports 250000.0 250000.0
Indirect imports 26379.6 26379.6
Net foreign exchange 9131620.4 16283620.4
Domestic 12165683.1 12216883.1
DRC 1.33 0.75
Source: Global Development Solutions, LLC
Medium Term Outlook – 2015: While the DRC estimates suggest wheat milling is likely
to be actually or potentially competitive, the differential in effective border prices shows
that there is considerable uncertainty regarding price data for wheat milling in Zambia.
When compared with Chinese imports of wheat flour to East Africa, domestic costs are
very high, and the activity is uncompetitive. However, Zambia is a net exporter at a price
well above the CIF price from China and also well above domestic prices in Ethiopia and
Tanzania. Transport cost advantages and bilateral trade preferences may explain some of
this differential, along with government regulation, but such a high differential is unlikely
to persist into the medium term, especially if maintained by regulation or market
irregularities. In these circumstances, competitiveness of the sector will require a
reorganization of some markets (e.g., fertilizer) or a major restructuring to bring costs
down to the level in other regional economies. Since wheat is the bulk of the cost of
wheat flour, the price of wheat is the critical variable in determining competitiveness.
The cost in Zambia of US$400/ton of wheat is well above the cost of imported wheat to
Tanzania (of around US$260/ton), and unless wheat prices are lowered in Zambia, it is
unlikely that the sector will be internationally competitive.
VI.15. Value Chain Analysis: Milling (Wheat) 134
The cost of milling wheat in Ethiopia ranges from US$415 - US$458 per ton (including
the cost of processing all by-products such as bran, germ and waste). By comparison,
costs in Tanzania range from US$420 – US$512 per ton, and in Zambia US$662 –
US$758 per ton. China ranges from US$322 - US$377 per ton and Vietnam from
US$359 - US$463 per ton. The key difference is the cost of wheat, type of wheat used
(hard vs. soft wheat), time of wheat sourced (as prices fluctuate widely in international
and local markets) and origin and mix of wheat used (local vs. imported). In Ethiopia,
for example, the cost of locally produced wheat averages around US$333/ton, which is
73 percent higher than the cost of domestic wheat in China (US$192/ton) and nearly 40
134
Value chain diagrams in this section reflect actual data from export oriented best practice firms.

294
percent higher than domestic wheat in Vietnam (US$269/ton).135
In Tanzania, local
wheat prices reached as high as US$365 in 2010. In Zambia, domestic wheat prices are
the highest and millers reported paying from US$400 to as much as US$500 per ton in
2010.136,137
Note that 2010, the year pertaining to this analysis, was an exceptional year in the world
wheat markets. Due to weather conditions mainly in Russia (and to some degree in
Canada), wheat prices in international markets soared more than 40 percent in one month
in August, the highest monthly increase in over 50 years. In Tanzania, for example,
Russian soft wheat was quoting in April at US$237/ton FOB Dar es Salaam, and by
September prices of the same wheat shot up to over US$350/ton. International wheat
prices continued to change thereafter in 2010, albeit the rate of change was not as high as
the July/August spike. Therefore, price variations of raw materials (wheat) presented in
this analysis, as reported by producers in the select African countries, should be read
within this context of extreme wheat price volatility during 2010.
Key Characteristics: The cost of raw material (wheat) generally constitutes the largest
portion of wheat milling value chain.
Table 168: Raw Material Input Comparison
Raw material inputs as % of
value chain
Total cost of raw material per
ton of wheat flour* $322
% of Total
Input $323
% of Total
Input $408
% of Total
Input $363
% of Total
Input $625
% of Total
Input
Wheat (cost/ton): Domestic $192 60% $269 $333 $300 - $365 $400 - $500 68%
Wheat (cost/ton): Imported none none $208 $304 $261 - $328 none none
* Amount reflects by-product content in wheat grains, conversion losses and waste - Includes 10% duty for imported wheat in Tanzania
Global Development Solutions, LLC
78.1% NA
China Vietnam
85% 81%
73.7%
Ethiopia Tanzania Zambia
93% 86% 87%
Given the high cost of domestic wheat, raw material input accounts for more than 93
percent of the overall value chain in Ethiopia, while in Vietnam wheat accounts for only
81 percent of the entire value chain (refer to above). Note, however, that in both Ethiopia
and Vietnam, the price of imported wheat is less expensive (by as much as 29 percent in
the case of Vietnam) than locally produced wheat, which raises some concerns regarding
the efficiency of farming operations in both countries, as well as the difference in
incentive structures that impact the cost of agricultural inputs in all three countries.
135
Raw material input as a percentage of the value chain reflects the total value of wheat required to
produce one ton of flour. The difference with percentage of cost for wheat price reflects by-products,
waste and milling losses. 136
Raw material input as a percentage of the value chain reflects the total value of wheat required to
produce one ton of flour. The difference with percentage of cost for wheat price reflects by-products,
waste and milling losses. 137
The company reporting US$500 per ton of wheat in Zambia was acquiring the raw material through a
sister company and has no flexibility to shop for lower price. The parent company states that this is market
rate with costs of transport and handling fees factored in to the price.

295
As the value chain diagrams below indicate, the distribution of costs along the value
chain differs between the countries compared.138
Specifically, in the case of Ethiopia,
administrative overhead, and transport and delivery (to buyer) costs accounted for more
than 6 percent of value chain, while in Tanzania, handling/transport to mill and milling
and packing account for little over 10 percent of the value chain. In Zambia,
administrative overhead alone contributes more than 11 percent in the VCA as shown in
Figure 55 but reportedly is as high as 20 percent in some companies. High overhead
costs in Zambia are attributed to high export taxes (10 percent) and duties (5 percent). In
China, handling and storage, and transport and delivery (to buyer) account for nearly 10
percent of the value chain, of which cost of labor accounts for over 73 percent of both
activities. In Vietnam, however, milling and packing accounts of nearly 10 percent of the
value chain, while administrative overhead cost accounted for 6 percent of the value
chain.
In Tanzania, all the imported wheat comes in via the port of Dar es Salaam, where,
according to millers, major bottlenecks occur. Mandatory stevedoring charges (paid to
Tanzania Port Authority - TPA) range between US$6/ton to US$8/ton; the cost of doing
business is increased further by the following inefficiencies at the port:
TPA infrastructure for unloading dry bulk is often dysfunctional and importers
have to pay additional stevedoring charges to private companies – US$600 per
days to hire a grab unloader.
TPA port weighbridge(s) at port are either inaccurate (500 kg variance on 10,000
MT weighing is commonly reported)139
when they function or are dysfunctional
and private services have to be hired (US$800/day).
Unloading a 10,000 MT load takes approximately 6 days.
Once the wheat is loaded onto trucks, millers generally do not report any major
transportation-related or other bottlenecks. Even though traffic congestion is a problem,
most mills generally are within the vicinity of the port. Due to the short distances, the
transport costs from port to mill are generally US$0.25-US$0.50 per kilometer-ton for
10-20 kilometer trips. Transportation cost of domestic wheat over much longer distances
(500-1200 kilometers) is much cheaper (US$0.05/km-ton).
The Zambian mills interviewed reported using only domestic wheat. Although the prices
are high, according to interviews and backed by trade statistics, wheat imported into
Zambia is even more costly. UN Comtrade statistics displayed in Table 169 show the
extremely high cost of imported wheat for Zambia.
138
The raw material (wheat) value includes by-products, conversion losses and waste. 139
According to third party information, such as information bulletins to its members sent by ship
insurance and risk underwriters P&I Club from the UK, ―the Club strongly recommends 1. That members
be aware that port weighbridge figures in Dar es Salaam could be suspect…‖. UK P&I Club, Bulletin 258.

296
Table 169: Zambia Imported Wheat Prices
Year Ton Value (US$) US$/ton
2008 29,954.8 17,988,127 $600.51
2009 14,072.7 7,232,213 $513.92
2010 0.5 1,479 $2,749.07 Source: UN Comtrade Compiled by Global Development Solutions, LLC

297
Figure 53: Wheat Milling Value Chain Diagram, Ethiopia
Figure 54: Wheat Milling Value Chain Diagram, Tanzania
Wheat milling Dar es Salaam Tanzania Unit production cost ($/ton) 421 $ Price of Wheat $/ton Imported $261-$328 Domestic $365 Skilled:Unskilled Worker Ratio 2 Additional income from sales of bran ($/ton) $110 - $150
Raw material Transport (to mill)
Handling/Storage (Silo or Mill) Milling/Packing
Transport/Deliver y (to buyer) Admin/OH
86.0% 5.9% 0.3% 5.5% 0.0% 2.4%
Wheat 90.9% Port Charges 50.9% Labor 26.0% Duty 9.1% Insurance 1.3% Electricity 42.1%
Transport 47.8% Packing 23.9% Other 8.0% Global Development Solutions, LLC
Wheat milling Kality Ethiopia Unit production cost ($/ton) 439 $ Price of Wheat $/ton Imported $304 Domestic $333 Addition income from sales of bran ($/ton) $89 Skiled:Unskilled Worker Ratio 1:7
Raw material Transport (to mill)
Handling/Storage (Silo or Mill)
Milling/ Packing
Transport/Delivery (to buyer) Admin/OH
92.9% 0.2% 0.1% 0.4% 0.5% 5.9%
Wheat 100.0% Labor 39.6% Admin OH 98.9% Fuel/oil/ water 26.5% Financing charges 0.7%
Raw material 407.54 $ 92.9% R & M 5.9% Prof services 0.3% Labor 2.30 $ 0.5% Packing material 28.0%
Packing material 0.79 $ 0.2% Global Development Solutions, LLC

298
Figure 55: Wheat Milling Value Chain Diagram, Zambia
Figure 56: Wheat Milling Value Chain Diagram, China
Wheat milling Jiangsu China Unit production cost 322 $ per ton Price of Domestic Wheat $/ton $192 Addition income from sales of bran ($/ton) $230 Skilled:Unskilled Worker Ratio 1:9
Raw material Transport (to mill)
Handling/Storage (Silo or Mill)
Milling/ Packing
Transport/Delivery (to buyer)
Admin/OH
85.1% 1.8% 6.9% 1.9% 2.9% 1.4%
Wheat 100.0% Labor 75.4% Labor 72.9%
Fuel/oil/ water 3.0% Packing material 20.1% Raw material 273.91 $ 85.1% Electricity 9.8% Fuel/oil/ water 3.6% Labor 33.71 $ 10.5% R & M 11.9% Electricity 1.7%
Packing material 1.85 $ 0.6% Global Development Solutions, LLC
Wheat milling Chisamba Zambia Unit production cost ($/ton) 730 $ Price of Wheat $/ton Domestic $500 Addition income from sales of bran ($/ton) $89 Skilled:Unskilled Worker Ratio 1:5
Raw material Transport
(to mill) Handling/Storage
(Silo or Mill) Milling/ Packing
Transport/Delivery (to buyer)
Admin/OH
87.0% 0.0% 0.0% 0.5% 1.0% 11.4%
Wheat 98.4% Labor 0.6% Admin OH 17.0%
Fuel/oil/ water 14.0% Taxes & levies 82.2%
Raw material 635.42 $ 87.0% R & M 0.2% Labor 3.24 $ 0.4% Packing material 85.3%
Global Development Solutions, LLC

299
Figure 57: Wheat Milling Value Chain Diagram, Vietnam
Wheat milling Binh Duong Viet Nam Unit production cost 400 $ Price of Wheat $/ton Imported $172 - $243 Domestic $264 - $273 Addition income from sales of bran ($/ton) $259 Skilled:Unskilled Worker Ratio 1:2.3
Raw material Transport (to mill)
Handling/Storage (Silo or Mill)
Milling/ Packing
Transport/ Delivery (to buyer) Admin/OH
81.2% 0.5% 0.0% 9.6% 2.7% 6.0%
Wheat 100.0% Labor 46.2% Admin OH 69.4% Electricity 33.2%
Raw material 324.56 $ 81.2% R & M 20.6% Labor 18.81 $ 4.7% Global Development Solutions, LLC
Packing material 10.93 $ 2.7%
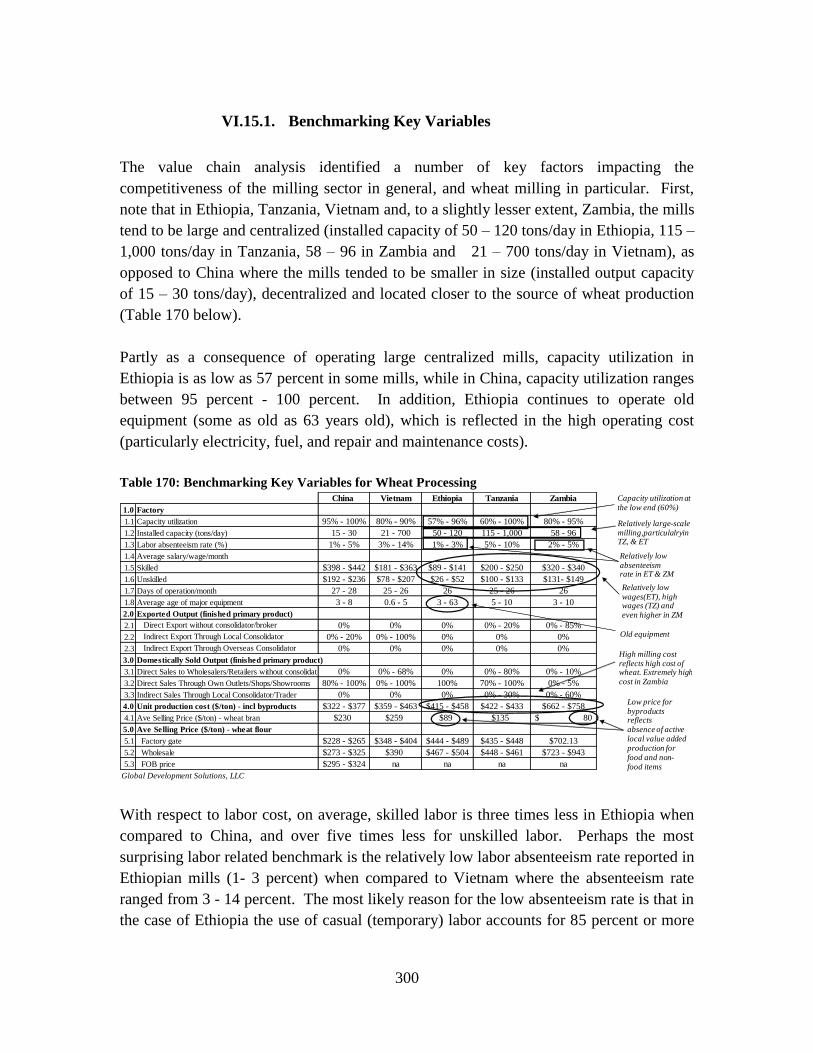
300
VI.15.1. Benchmarking Key Variables
The value chain analysis identified a number of key factors impacting the
competitiveness of the milling sector in general, and wheat milling in particular. First,
note that in Ethiopia, Tanzania, Vietnam and, to a slightly lesser extent, Zambia, the mills
tend to be large and centralized (installed capacity of 50 – 120 tons/day in Ethiopia, 115 –
1,000 tons/day in Tanzania, 58 – 96 in Zambia and 21 – 700 tons/day in Vietnam), as
opposed to China where the mills tended to be smaller in size (installed output capacity
of 15 – 30 tons/day), decentralized and located closer to the source of wheat production
(Table 170 below).
Partly as a consequence of operating large centralized mills, capacity utilization in
Ethiopia is as low as 57 percent in some mills, while in China, capacity utilization ranges
between 95 percent - 100 percent. In addition, Ethiopia continues to operate old
equipment (some as old as 63 years old), which is reflected in the high operating cost
(particularly electricity, fuel, and repair and maintenance costs).
Table 170: Benchmarking Key Variables for Wheat Processing China Vietnam Ethiopia Tanzania Zambia
1.0 Factory
1.1 Capacity utilization 95% - 100% 80% - 90% 57% - 96% 60% - 100% 80% - 95%
1.2 Installed capacity (tons/day) 15 - 30 21 - 700 50 - 120 115 - 1,000 58 - 96
1.3 Labor absenteeism rate (%) 1% - 5% 3% - 14% 1% - 3% 5% - 10% 2% - 5%
1.4 Average salary/wage/month
1.5 Skilled $398 - $442 $181 - $363 $89 - $141 $200 - $250 $320 - $340
1.6 Unskilled $192 - $236 $78 - $207 $26 - $52 $100 - $133 $131- $149
1.7 Days of operation/month 27 - 28 25 - 26 26 25 - 26 26
1.8 Average age of major equipment 3 - 8 0.6 - 5 3 - 63 5 - 10 3 - 10
2.0 Exported Output (finished primary product)
2.1 Direct Export without consolidator/broker 0% 0% 0% 0% - 20% 0% - 85%
2.2 Indirect Export Through Local Consolidator 0% - 20% 0% - 100% 0% 0% 0%
2.3 Indirect Export Through Overseas Consolidator 0% 0% 0% 0% 0%
3.0 Domestically Sold Output (finished primary product)
3.1 Direct Sales to Wholesalers/Retailers without consolidator 0% 0% - 68% 0% 0% - 80% 0% - 10%
3.2 Direct Sales Through Own Outlets/Shops/Showrooms 80% - 100% 0% - 100% 100% 70% - 100% 0% - 5%
3.3 Indirect Sales Through Local Consolidator/Trader 0% 0% 0% 0% - 30% 0% - 60%
4.0 Unit production cost ($/ton) - incl byproducts $322 - $377 $359 - $463 $415 - $458 $422 - $433 $662 - $758
4.1 Ave Selling Price ($/ton) - wheat bran $230 $259 $89 $135 80$
5.0 Ave Selling Price ($/ton) - wheat flour
5.1 Factory gate $228 - $265 $348 - $404 $444 - $489 $435 - $448 $702.13
5.2 Wholesale $273 - $325 $390 $467 - $504 $448 - $461 $723 - $943
5.3 FOB price $295 - $324 na na na na
Global Development Solutions, LLC
Capacity utilization at the low end (60%)
Relatively low absenteeismrate in ET & ZM
Relatively low wages(ET), high wages (TZ) and even higher in ZM
Old equipment
High milling cost reflects high cost of wheat. Extremely high cost in Zambia
Low price for byproducts reflectsabsence of active local value addedproduction for food and non-food items
Relatively large-scalemilling,particulalryin TZ, & ET
With respect to labor cost, on average, skilled labor is three times less in Ethiopia when
compared to China, and over five times less for unskilled labor. Perhaps the most
surprising labor related benchmark is the relatively low labor absenteeism rate reported in
Ethiopian mills (1- 3 percent) when compared to Vietnam where the absenteeism rate
ranged from 3 - 14 percent. The most likely reason for the low absenteeism rate is that in
the case of Ethiopia the use of casual (temporary) labor accounts for 85 percent or more

301
of the work force in mills, while in Vietnam and China, permanent (albeit unskilled
labor) accounts for majority of the labor force in the mills.
The cost of producing a ton of wheat flour (including processing costs for other by-
products) ranges from US$415 – US$458/ton in Ethiopia, which is on average 25 percent
higher than in China where processing cost ranges from US$322 – US$377/ton.
Similarly, the cost of wheat processing in Ethiopia is approximately 6 percent higher
(US$359 – US$463) than in Vietnam.
Typical for milling operations, the ability to process and sell wheat by-products (such as
bran and germ) in addition to the wheat flour is vital in the overall economics of a mill.
As Table 170 above indicates, wheat flour production cost is higher than the average
selling price of wheat flour. This is because the millers recuperate a significant portion of
the milling costs by processing and selling by-products. In this context, the selling price
of flour does not include proceeds from sales of bran and other by-products.
In China and Vietnam, by-products are highly valued thanks to a well-developed value-
added food processing and animal feed sector. There, millers are able to fetch between
US$230 – US$259/ton for bran, which is the most abundant by-product of wheat milling.
In Ethiopia, however, the market value of bran is only US$89/ton, suggesting a
potentially underdeveloped feed and food processing sector where there is limited
demand for highly nutritious consumables such as bran. The case is similar in Zambia
where bran price is even less at US$80/ton.
In China, wheat flour sells for roughly 30 percent over and above the price of wheat. In
Ethiopia, wheat flour sells for nearly 50 percent over and above the price of wheat. Thus,
in the current conditions, Ethiopian flour prices are significantly high and uncompetitive,
not only because the wheat prices are higher in Ethiopia, but also because millers pass on
a very high proportion of the already pricy wheat to the price of flour due to their
inability to obtain favorable prices for bran and other wheat by-products. Although the
markup is not quite as high in Zambia (40 percent over the price of wheat) the situation is
similar in Zambia. With the low value of bran, millers have to compensate for the high
production cost by charging higher margins: they cannot recover costs by selling bran. In
Tanzania, wheat bran in 2010 sold, on average, for US$135/ton, with exports to the
Middle East commanding higher prices.

302
Table 171: Wheat Purchase Price vs. Wheat Flour Selling Price
China Ethiopia Tanzania Zambia
Wheat grain $192 $320 $316 $500
Wheat flour (factory gate) $250 $470 $446 $702
Price of flour over grain 30% 47% 41% 40%
Global Development Solutions, LLC
In addition to the substantially higher price of domestic wheat, millers in Ethiopia must
operate under poor operating conditions where the percentage of time off the electricity
grid is as high as 4 percent to 12 percent. The poor quality of electricity in Ethiopia is
reflected in the high fuel and oil usage which ranges from 0.42 to 1.15 liters/ton of milled
wheat (67 percent higher than in China and 39 percent higher than in Vietnam).
Table 172: Benchmarking Key Variables for Wheat Processing (Part 2)
China Vietnam Ethiopia Tanzania Zambia
6.0 Avg Spoilage & Reject rate: List different types (3)
6.1 Reject rate by client 0% - 1% 0% 0%
6.2 Product rejection at factory 1% - 3% 1% - 2% 1% 0% - 2%
7.0 Avg Waste & losses: List different types (% of total )
7.1 Milling ratio 70% 75% 75% 72% - 77% 79%
7.2 Other waste 0% - 1% 0% - 1%
8.0 Electricity
8.1 On grid (Cost/kWh) $0.15 $0.04 - $0.06 $0.04 - $0.05 $0.06 - $0.14 0.04$
8.2 Off grid (Cost/kWh) - self generated 0 $0.26 - $0.28 $0.24
8.3 % of time off grid/month 0% - 10% 1% - 8% 4% - 12% 0% - 20% 5%
9.0 Water (m³) $0.44 - $0.45 $0.25 - $0.28 $0.11 - $0.28 na
10.0 Fuel & Oil (liter) $0.96 - $1.01 $0.63 - $0.83 $0.78 - $0.99 $1.13 $1.49
11.0 Productivity & Efficiency
11.1 Labor productivity: Tons/person/day 0.2 - 0.4 0.6 - 8.6 0.6 - 1.9 1 -22 0.62 - 1.57
11.2 Electricity usage: On-grid (kWh/ton) 9.3 - 14.8 2.07 - 37.49 7.8 - 48.8 57 - 65 4.16 - 61
11.3 Electricity usage ($/ton) $1.23 - $2.19 $0.11 - $2.02 $0.43 - $2.67 $8.01 - $9.70 $0.16 - $2.44
11.4 Water usage (m³/ton) 0.31 - 0.47 0.04 - 0.12 0.08 - 0.4 na
11.5 Water usage ($/ton) $0.14 - $0.21 $0.01 - $0.03 $0.01 - $0.06 na
11.6 Fuel & oil usage (liters/ton) 0.36 - 0.58 0.02 - 1.11 0.42 - 1.15 na 1.05 - 10.12
11.7 Fuel & oil usage ($/ton) $0.61 - $0.89 $0.02 - $0.92 $0.20 - $0.99 na $1.56 - $15.07
11.8 Transport ($/km-ton) $0.15 - $0.66 $0.03 $0.05 - $0.11 $0.05 - $0.50 $0.03 - $0.06
Global Development Solutions, LLC
Poor quality ofelectricity
High fuel consumption forgenerating electricity
High cost of fuel
In addition, given the old age of the milling equipment used in Ethiopia, the electricity
consumption rate of mills in Ethiopia is, on average, 2.3 times (7.8 – 48.8 kWh/ton) more
than smaller, more efficient mills in China.
Despite all of the high costs associated with milling in Ethiopia, given the use of
inexpensive casual labor, the average wheat processing costs in Ethiopia – excluding the
cost of wheat grain and packaging – is US$29.46/ton, over 85 percent less expensive than
China (US$54.55/ton) and more than twice as inexpensive as similar plants in Vietnam
(US$89.49) and Zambia (US$88.32) (refer to Table 173 below).

303
Table 173: Benchmark of Average Wheat Processing Costs (Excluding Wheat and Packaging)
China Vietnam Ethiopia Tanzania Zambia
Avg. Processing Costs ($/ton) $55 $89 $29 $23 $88
Global Development Solutions, LLC
The value chain analysis suggests that despite all of its challenges, wheat processing is
seemingly competitive in Ethiopia. With this noted, however, the industry is destroying
value by selling valuable by-products in the local market at a price nearly three times
lower than the international market. While there is a need to reduce the cost of producing
wheat in Ethiopia, equally important is the need to develop a more robust value-added
food and animal feed sector able to absorb and transform by-products into marketable
products for both local and regional markets.140
With respect to the production of wheat in Ethiopia, there are a host of challenges
requiring attention. Specifically, yield rate for wheat in Ethiopia is generally less than 1
ton/ha, while in Zambia and China yield rate can reach as high as 6 tons/ha and in
Vietnam, approximately 4 tons/ha. In this context, Ethiopia suffers from a number of
challenges in producing staple crops:
Shortage of high yielding variety seed supply and agricultural inputs;
Lack of irrigated farming;
High concentration of smallholder and subsistence farmers and few commercial
farms;
Lack of infrastructure for appropriate storage;
Absence of market mechanism to predictably stabilize prices; and
Lack of working capital for wholesalers.
In this context, the critical challenge for Ethiopia is to identify and secure consistent
sources of cash crops until such time that some of the fundamental problems facing the
agricultural sector are addressed. At the same time, given the high value losses
associated with by-products, it is not obvious that Ethiopia should actually import wheat
to be milled locally, but rather to import flour instead to help curve the loss of value
through milling. In this context, the challenges and bottlenecks identified in the wheat
milling value chain analysis point to a much larger issue of the need to develop a more
robust value added food and animal feed sector in the country.
140
Given the low volume and high cost of wheat production, combined with high cost of shipping,
exporting bran without any further value added processing would not be economically viable. In this
context, investments in further local value addition are required to maximize the potential of the milling
sector in Ethiopia.

304
VI.15.2. Benchmarking Best Practice Firms
Benchmarking the best practice firms in China and Ethiopia provides some insights into
the difference in production approach taken by the two countries. Specifically, the size of
decentralized mills in China have installed capacity which are one-sixth that of Ethiopia,
but at the same time the capacity utilization is 100 percent in the small scale mill as
opposed to the large, centralized mill in Ethiopia where the capacity utilization rate is
only 67 percent (refer to Table 174 below).
Table 174: Benchmarking Selected Variable for Best Practice Firms in China and Ethiopia
Benchmarking Best Practice Firms - Milling China Ethiopia
Capacity utilization 100% 67%
Installed capacity (tons/day) 21 120
Average age of major equipment 8.0 3.0
Skilled 398$ 98$
Unskilled 206$ 43$
Unit production cost ($/ton) - incl byproducts 322.49$ 426.84$
Ave Selling Price ($/ton) - wheat bran $230 88.89$
Milling conversion ratio 70% 75%
Electricity usage: On-grid (kWh/ton) 9.52 23.01
% of time off grid/month 10% 4%
Fuel & oil usage (liters/ton) 0.43 0.59
Global Development Solutions, LLC
The labor costs in China are more than 4.5 times that of Ethiopia, but given the high cost
of wheat in Ethiopia, the unit production cost is 32 percent higher in Ethiopia. Perhaps
equally important is the loss of value reflected in the selling price of wheat bran. The
average selling price of wheat bran is nearly 2.6 times in China, which reflects the
robustness of the value added food and feed sector in China and its capacity to transform
by-products into marketable products.
Although the Chinese mill is using equipment five years older than that of Ethiopia, the
electricity usage rate in the Ethiopian mill is nearly 2.5 times more. Furthermore, the
decentralized mill in China is closer to the source of wheat production, which places
them somewhat off the main electricity grid. This is reflected in the fact that the
percentage of time off the grid per month for the Chinese mill is more than two times that
of the mill in Ethiopia. And yet, the fuel and oil usage rate (primarily to operate backup
generators) in Ethiopia is approximately 40 percent higher than in China. These figures
provide insights into challenges faced by millers in Ethiopia with respect to level of
inefficiency and production management, both which seem to be rooted in the low level
of labor and management skills.

305
VI.16. Conclusions: Policy Issues and the Possibilities and Actions for Achieving
and Maintaining Competitiveness in Wheat Milling
Given the differences in agricultural practices, land productivity and processing
technology the target countries, this chapter has examined the potential for wheat milling
in Ethiopia to become competitive. Combining economics and VCA in a medium term
framework, a series of recommendations have been developed on how milling costs can
remain competitive with imports. Domestic production costs are high by international
standards and the cost of milling in Ethiopia is significantly (between 15 percent - 25
percent) above reported FOB prices in China. However, wheat flour is a low value-to-
weight product and the relatively high transport and other trade costs associated with
moving wheat from East Asia to East Africa gives significant natural protection (although
this is not protection relative to other regional competitors). Hence, despite its current
short-term competitiveness, the industry needs to improve on existing levels of cost for
its longer-term viability.
The key conclusions that underlie increased efficiency at the industry level fall into three
broad categories as follows:
1. Effects of relative exchange rate changes
Taking into account wheat and its by-products, in the shorter run the key condition for
increasing the competitiveness of the Ethiopian milling industry relative to East Asian
producers over the next five years is the likely changes in relative Real Exchange Rates.
Even though Ethiopian mills are import-intensive (importing raw materials), it is likely
that relative movements in the Chinese and Vietnamese RER still will benefit Ethiopia by
increasing the relative costs of these competitive suppliers.
2. Effects of mill-level labor productivity changes
Because of the extremely low real wage costs in Ethiopia compared to China and
Vietnam, labor productivity changes in Ethiopia would make an insignificant difference
to its competitiveness. In fact, survey data do not in any case point to major differences
in factors such as absenteeism or wastage rates compared to other industries. Thus such
changes have not been factored in.
3. Effects of longer term changes in technology and agricultural practice
Because material inputs comprise the large part of the costs of milled wheat, Ethiopian
costs per se will only tend to fall significantly in the longer term as a result of changes in

306
agricultural practices such as greater use of irrigation and higher yielding seeds. Costs
could probably also fall due to changes in wheat processing technology and organization,
which might increase capacity utilization and lower transport costs and wastage rates
(through reducing the scale and changing location of the mills to be closer to the farms).
Although wheat is competitive with imports from China based on current technology,
securing its longer term position vis-à-vis, for example, other African producers would
require developments in technology and organization at both farm and processing stages.