Embed Size (px)
Citation preview

Bioresource Technology 164 (2014) 221–231
Contents lists available at ScienceDirect
Bioresource Technology
journal homepage: www.elsevier .com/locate /bior tech
Comparative study on two-step concentrated acid hydrolysisfor the extraction of sugars from lignocellulosic biomass
http://dx.doi.org/10.1016/j.biortech.2014.04.0840960-8524/� 2014 Elsevier Ltd. All rights reserved.
⇑ Corresponding author at: Clean Energy Research Center, Korea Institute ofScience and Technology, Seoul 136-791, Republic of Korea. Tel.: +82 2 958 6811.
E-mail address: [email protected] (C.S. Kim).
Yanuar Philip Wijaya, Robertus Dhimas Dhewangga Putra, Vania Tanda Widyaya, Jeong-Myeong Ha,Dong Jin Suh, Chang Soo Kim ⇑Clean Energy Research Center, Korea Institute of Science and Technology, Seoul 136-791, Republic of KoreaDepartment of Clean Energy and Chemical Engineering, Korea University of Science and Technology, Daejeon 305-350, Republic of Korea
h i g h l i g h t s
� Two-step concentrated acid hydrolysis has been conducted with oak, pine, and EFB.� Oak, pine, and EFB have been characterized in the compositional and XRD analysis.� Crystalline structure change in raw biomass has been clearly shown in XRD analysis.� Optimum condition was selected on the highest sugar recovery in the shortest time.� Pine has the highest recalcitrance based on the CrI and sugar recovery correlation.
a r t i c l e i n f o
Article history:Received 10 March 2014Received in revised form 22 April 2014Accepted 23 April 2014Available online 5 May 2014
Keywords:Concentrated acid hydrolysisCrystallinityEFBOak woodPine wood
a b s t r a c t
Among all the feasible thermochemical conversion processes, concentrated acid hydrolysis has beenapplied to break the crystalline structure of cellulose efficiently and scale up for mass production as lig-nocellulosic biomass fractionation process. Process conditions are optimized by investigating the effect ofdecrystallization sulfuric acid concentration (65–80 wt%), hydrolysis temperature (80 �C and 100 �C),hydrolysis reaction time (during two hours), and biomass species (oak wood, pine wood, and empty fruitbunch (EFB) of palm oil) toward sugar recovery. At the optimum process condition, 78–96% sugars out oftheoretically extractable sugars have been fractionated by concentrated sulfuric acid hydrolysis of thethree different biomass species with 87–90 g/L sugar concentration in the hydrolyzate and highest recal-citrance of pine (softwood) was determined by the correlation of crystallinity index and sugar yield con-sidering reaction severity.
� 2014 Elsevier Ltd. All rights reserved.
1. Introduction
The world’s energy consumption has progressively increasedwith the rapid population growth and economic development asmore countries have intensified their industrial activities overthe last century. Problems of fossil fuel sources such as depletionof unevenly distributed resources, environmental damage causedby greenhouse gases emission, and price fluctuation of oil andgas have increased the need for renewable energy sources. Amongmany options of renewable energy sources, lignocellulosic biomassis still considered as the only large-scale sustainable carbon sourcecurrently available for the future energy supply. The great
potential of lignocellulosic biomass utilization has still stronglyencouraged the researches that can be applied into industriallyand economically viable processes for conversion of biomass toenergy, fuels, and chemicals (Moe et al., 2012).
Lignocellulosic biomass refers to nonstarch, fibrous part of plantbiomass that is composed of three major constituents: cellulose,hemicellulose, and lignin (Basu, 2010). It can be classified into fourmain sources: (1) agricultural residues (corn stalk, corn stover,sugarcane bagasse), (2) forestry residues (wood waste, sawdust,mill scrap), (3) energy-woody crops (willow, poplar, switch grass),and (4) industrial and municipal solid wastes (paper mill sludges,recycled newspaper, wasted paper) (Sathitsuksanoh et al., 2010).Lignocellulosic biomass can be processed into biofuel productionwithout competing with food production. In addition, biofuelproduction from lignocellulosic biomass will generate lignin as res-idue that can be upgraded into valuable fuel additives or used for

222 Y.P. Wijaya et al. / Bioresource Technology 164 (2014) 221–231
power generation. The process is designed to reuse all aqueousstreams and to convert all solids into economically profitable anduseful products (Farone and Cuzens, 1996). Among the various lig-nocellulosic biomass, wood is one of the most potentially usedmaterials in acid hydrolysis since wood and its residues are thedominant form of lignocellulosic biomass resources (Basu, 2010).
The conversion of lignocellulosic biomass includes two pro-cesses: hydrolysis of cellulose into fermentable sugars and fermen-tation of the sugars to ethanol (Sun and Cheng, 2002). Thehydrolysis reaction for cellulose conversion into sugar is princi-pally the degradation of chemical bonds in cellulose, involvingthe hydrolytic cleavage of b-1,4-glycosidic bond which is catalyzedby H+ ions of an acid or by the action of a cellulolytic enzyme. Thehomogeneous hydrolysis of a glycoside in an acid aqueous mediumis understood as a replacement process of its initial OR group by ahydroxyl group regenerating H+ ion by the addition and heterolyticcleavage of a water molecule (Klemm et al., 1998). The acid hydro-lysis of glycosidic bonds follows a first-order rate law. The reactionrate depends on the H3O+ ion concentration, the reaction temper-ature, and the chemical environment of the glycosidic bond andthe rate is increased with the increasing acid ion concentrationand temperature (Klemm et al., 1998; Saeman, 1945).
The conventional methods for hydrolysis process currently arebased on thermochemical route (acid-catalyzed hydrolysis) andbiochemical route (enzyme-catalyzed hydrolysis), both of whichrequire pretreatment step to utilize lignocellulosic biomass.Among various methods of hydrolysis, concentrated acid hydroly-sis, one of the promising methods based on thermochemical route,has several advantages with respect to the milder operating condi-tion (the lower operating temperature and pressure), the higherconversion rate, and the higher sugar recovery. Compared to diluteacid hydrolysis, the advantages of this process are the higher effi-ciency of sugar recovery, which can reach over 90% of theoreticalyield for both glucose and xylose (Guha et al., 2010; Shahbaziand Zhang, 2010; Taherzadeh and Karimi, 2007), and the milderoperating temperature and pressure (Iranmahboob et al., 2002)thus the decreasing sugar yield due to inhibitors formation canbe minimized (Moe et al., 2012). In comparison with enzymatichydrolysis, concentrated acid hydrolysis has the higher reactionrate, which directly implies the shorter reaction time. The majorchallenge in employing enzymatic hydrolysis is finding the appro-priate pretreatment and less costly enzyme preparation methodsto increase the lignocellulosic substrates availability (Moe et al.,2012; Sun et al., 2011). Due to highly complex and strong recalci-trance of lignocellulosic biomass, the thermochemical route hasbeen regarded more preferable in order to overcome slow reactionby multiple cellulase enzymes (Selig et al., 2013). The disadvan-tages of concentrated acid hydrolysis are the higher toxicity andcorrosivity that required corrosive-resistant reactors or specializednon-metallic constructions and the indispensable need for acidrecovery process to make the process economically feasible (Moeet al., 2012; Sun and Cheng, 2002).
Despite the disadvantages, concentrated acid hydrolysis is stillattractive and relevant today as this process was claimed to havea low overall cost for the ethanol production (Groenestijn et al.,2006). Arkenol, Inc., a technology and project development com-pany in the United States, has reported that the concentrated acidhydrolysis process could be made economically viable and readyfor commercial implementation. Arkenol-developed technologyhas used commercially available ion exchange resins to separateremaining acid-sugar solution into its acid and sugar componentswithout diluting the sugar. This process was claimed to be capableof producing a clean stream of mixed sugar (both hexoses and pen-toses) for fermentation, because the separated sulfuric acid wasrecirculated and reconcentrated to the level required by decrystal-lization and hydrolysis steps; and the small quantity of acid left in
the sugar solution was neutralized with lime to make hydrategypsum, CaSO4�2H2O, an insoluble precipitate which could beseparated from the sugar solution and used as an agricultural soilconditioner. The Masada Resource Group has also developedfull-scale cellulosics-to-ethanol projects in North America(Taherzadeh and Karimi, 2007). Although concentrated acid hydro-lysis was previously regarded as economically not viable processdue to the requirement of the large amounts of acid, the develop-ment of effective acid recovery technologies and the high flexibilityof this process toward different feedstocks have renewed its inter-est (Janga et al., 2012; Moe et al., 2012).
This study aimed to investigate the effect of decrystallizationacid concentration, hydrolysis temperature, and hydrolysis reac-tion time toward sugar recovery in various biomass species. Crys-tallinity degree of the raw biomass has also been analyzed toconduct a preliminary study about the effect of its crystallinestructure on the digestibility of substrate in the hydrolysis process.Although two-step concentrated acid hydrolysis has been a com-mercialized technology, its application on various lignocellulosicbiomass is still an interesting subject to study as the resulting datacan be contributed to the researches in biomass utilization area asa basis for the selection of potential lignocellulosic feedstocks.
2. Methods
2.1. Materials and apparatus
Raw biomass used in this experiment were obtained from oakwood, pine wood, and empty fruit bunch (EFB) of palm oil whichrepresented hardwood, softwood, and non-woody biomass,respectively. All the raw biomass was first ground and sieved topass 18 mesh (1 mm) screen before being fed to the reactor. Sulfu-ric acid (H2SO4, 96%) was purchased from Daejung Chemicals andMetals, Co., Ltd., South Korea. The initial concentrations of sulfuricacid used in decrystallization process were 65, 70, 75, and 80 wt%.The solid loading (acid to biomass) ratio was averagely 2.0 in dryweight basis.
The reactor was 250 mL round bottom flask with four necks(DURAN� Schott, Germany), and equipped with an overhead stirrer(Techno Lab-system, Poong Lim, South Korea) and a Teflon-coatedstirring rod. A condenser was used to prevent the vapor productescaped from the reactor during the process. An electric heaterwas connected to a heating mantle and equipped with a digitaltemperature controller (DX7, Han Young, South Korea) and a ther-mocouple. Quenching water was provided to suspend the reactionin the samples in order to prevent further degradation of thedesired products.
2.2. Lignocellulosic feedstocks characterization
Feedstocks characterization conducted in this experimentincludes: (1) ultimate and proximate analysis (to analyze the ele-mental composition), (2) compositional analysis (to determinethe lignocellulosic component), and (3) crystallinity index analysis(to determine the crystallinity degree) of the raw biomass. Alpha–cellulose fiber (approximately 99.5%) and lignin alkali model com-pounds were purchased from Sigma Chemical Company andSigma–Aldrich, USA to determine the crystallinity degree of cellu-lose used as a comparable reference to the crystallinity degree ofraw biomass.
2.2.1. Ultimate and proximate analysisThe ultimate (elemental) analysis was conducted by Advanced
Analysis Center at KIST, South Korea. It was carried out in Flash2000 Organic Elemental Analyzer for carbon (C), hydrogen (H),

Y.P. Wijaya et al. / Bioresource Technology 164 (2014) 221–231 223
nitrogen (N), sulfur (S), and in Fisons EA 1108 Elemental Analyzerfor oxygen (O).
The proximate analysis was carried out by thermogravimetricanalysis (TGA) method in a TA Q600 TGA instrument based onthe procedure described elsewhere (Kneller, 1986; Warne, 1996).The system was initially flushed with nitrogen for 10 min at a flowrate of 50 cm3/min. Sample was placed in a platinum pan andheated up to 110 �C at constant heating rate of 20 �C/min, held iso-thermally during 15 min to measure the moisture content (M)which was the weight loss due to water removal, then continuallyheated up to 950 �C at 20 �C/min and again held there to constantweight to give the loss due to volatile matters (VM). At this point,air was permitted to flow through the system at a flow rate of50 cm3/min to oxidize the remaining organic matters yielding theweight loss due to the burning away of the fixed carbon (FC). Theremaining weight of sample is the amount of residual ash (ASH).
2.2.2. Compositional analysisThe lignocellulosic composition of each raw biomass was quan-
titatively determined based on the laboratory analytical procedure(LAP) developed by National Renewable Energy Laboratory (NREL)with appropriate adjustment (Sluiter et al., 2008, 2010; Templetonet al., 2010). The sample of each biomass (0.3 g, dry basis) was firsttreated with 72 wt% H2SO4 at 30 �C for 1 h in a round bottom flaskreactor and stirred every 15 min with a glass stirring rod. Deion-ized water (84 mL) was added into the decrystallized sample toobtain 4 wt% H2SO4 solution. The mixture was then heated to121 �C in a pressure tube glass (8648-30 ACE Glass) with screwon Teflon caps and o-ring seals (5845-47 plug) and kept static for1 h in a vacuum oven. After cooling to the room temperature, theliquid products were further purified using a 0.2 lm filter andthe dissolved sugars were quantified using high performanceliquid chromatography (HPLC). The liquid products were also ana-lyzed in a UV–Vis-NIR Spectrophotometer (Cary 5000, Varian Inc.)to determine the amount of acid-soluble lignin (ASL) by absor-bance at 200–205 nm and typical absorptivity of 110 L g�1 cm�1
at recommended wavelength (Hatfield and Fukushima, 2005).The amount of acid insoluble lignin (AIL) was determinedgravimetrically in the mass balance after separating the solid prod-ucts using vacuum filtration. AIL was calculated as the amount ofacid and water-free solid residue after subtraction by the ashamount measured in the proximate analysis.
2.2.3. Crystallinity index (CrI) analysisXRD analysis was performed on a four circle goniometer (XRD-
6000 Lab X Shimatzu) using CuKa radiation generated at 40 kV and30 mA. Scans were obtained from 5 to 90� 2h with the scan speedof 4�/min. The samples, consisted of raw biomass (oak wood, pinewood, and EFB) and lignin as the side product from hydrolysis ofeach raw biomass (oak lignin, pine lignin, and EFB lignin), werecrushed and sieved into size of 106–150 lm and they all weremounted onto a quartz holder during the analysis.
2.3. Concentrated acid hydrolysis process stages
In general, the experiment consists of three major stages:decrystallization reaction, hydrolysis reaction, and products sepa-ration. The first two reactions can also be considered as two-stepconcentrated acid hydrolysis in which the combination of bothhigher and lower concentrated sulfuric acid are used. The overallexperimental process stages are represented in the work flow dia-gram in Fig. 1.
Initially the raw biomass and the concentrated acid solutionwere gradually fed into the reactor. The stirring was adjusted at75 rpm to ensure complete biomass wetting (intimate contactbetween acid and biomass). This feeding process was performed
until the wood and acid mixed well, indicated by dark color ofthe mixture. The decrystallization reaction was carried out ataround 30 �C and atmospheric pressure within 30 min. Afterdecrystallization, some amount of deionized water at the roomtemperature was added to dilute the substrate to �30 wt% acidconcentration. At this point, the sample was taken immediatelyto investigate the concentration and distribution of sugars at theend of decrystallization stage. Afterwards, the mixture was heatedup to the hydrolysis temperature (80 �C and 100 �C) and the hydro-lysis reaction continued during two hours. The mixture was sam-pled every 30 min and the sample was immediately quenchedprior to centrifugation to separate the liquid and solid fraction.The reactor was cooled down to the room temperature after thehydrolysis reaction had been completed. The mixture was thenseparated in a vacuum filtration process. The liquid product (fil-trate) contained acid and sugars, while the solid product (acid-insoluble residue) contained some amount of unconverted wood,acid, and water.
2.4. Product analysis
The liquid product was analyzed in YL9100 HPLC system (YoungLin, Anyang, South Korea) after being cooled at the room tempera-ture and the concentrations of sugars (glucose, xylose, and cellobi-ose) were determined by an ion exchange chromatography column(Aminex HPX-87 H, Bio-Rad, 300 mm � 7.8 mm) operated at 60 �C.The eluent (mobile phase) used was 5 mM sulfuric acid. The pumpwas operated at flow rate of 0.06 mL/min in the isocratic mode andthe sample injection volume was 40 lL. The filtrate was syringedthrough a 0.5 lm filter and diluted with distilled water in a volumeratio of 1/30. Sugars (cellobiose, glucose and xylose) were detectedby a refractive index detector (YL9170 RID) at 36 �C. Actual concen-tration of the products can be determined after 20 min analysistime by calculating the concentration of each compound fromthe peak area and the standard calibration curve of each compo-nent. This quantification procedure was performed according tothe NREL standardized method (Sluiter et al., 2008) with appropri-ate adjustment.
Solid product from the filtration process was then neutralizedby washing with copious amount of water, dried in the oven at90 �C until the weight remained constant, and then utilized inthe XRD analysis as amorphous lignin sample. The amount of net(acid and moisture-free) solid residue in the final product wasdetermined from the material balance. In the calculation, the filtra-tion process was assumed to be ideal, means the filtrate containedno wood (solid fraction of hydrolyzate) and the solid residue con-tained no sugars (all sugars were collected in the filtrate), thusthere was no material accumulation in the system (zero mass loss).
3. Results and discussion
3.1. Lignocellulosic feedstocks characterization
3.1.1. Ultimate and proximate analysisThe ultimate and proximate analysis data of all the raw biomass
are presented in Table 1. The result shows that pine wood has thehighest carbon and hydrogen content but the lowest oxygen to car-bon (O/C) ratio. EFB contained nitrogen (that contributed to proteincontent in biomass) and the highest ash amount.
3.1.2. Compositional analysisThe lignocellulosic composition data of all the raw biomass (in
dry weight basis) are shown in Table 2. The measurement was per-formed with duplicate samples and each sample was analyzedthree times in HPLC to determine the amount of dissolved sugars
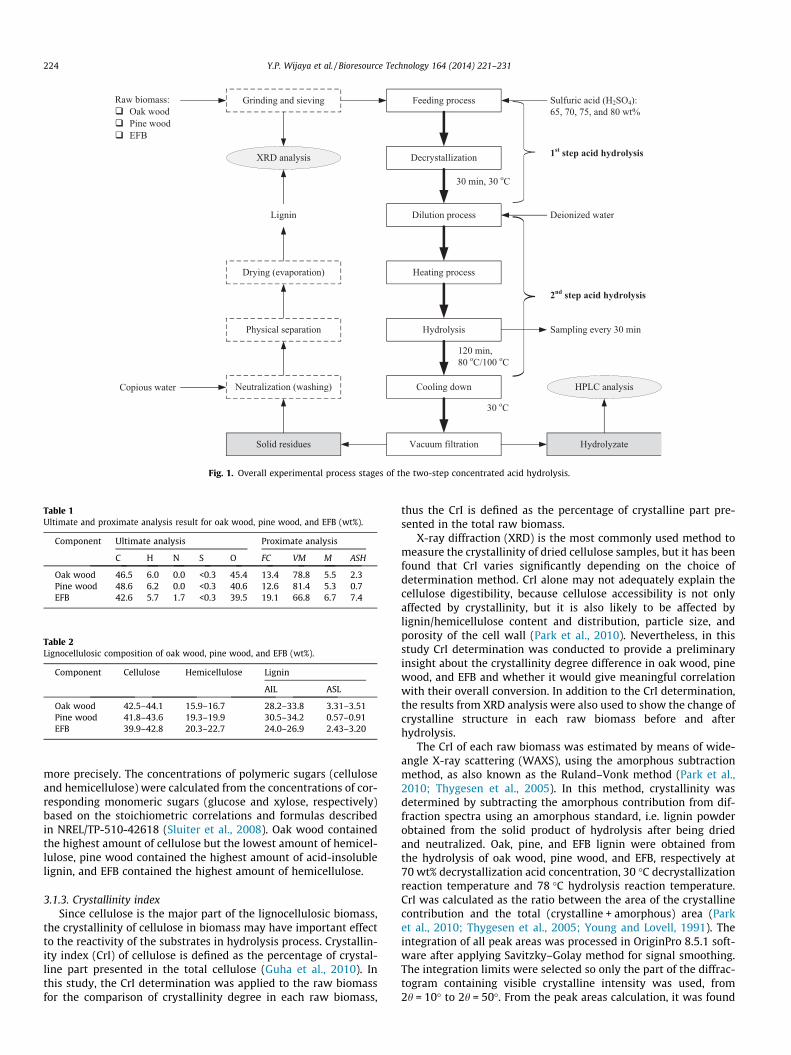
Fig. 1. Overall experimental process stages of the two-step concentrated acid hydrolysis.
Table 1Ultimate and proximate analysis result for oak wood, pine wood, and EFB (wt%).
Component Ultimate analysis Proximate analysis
C H N S O FC VM M ASH
Oak wood 46.5 6.0 0.0 <0.3 45.4 13.4 78.8 5.5 2.3Pine wood 48.6 6.2 0.0 <0.3 40.6 12.6 81.4 5.3 0.7EFB 42.6 5.7 1.7 <0.3 39.5 19.1 66.8 6.7 7.4
Table 2Lignocellulosic composition of oak wood, pine wood, and EFB (wt%).
Component Cellulose Hemicellulose Lignin
AIL ASL
Oak wood 42.5–44.1 15.9–16.7 28.2–33.8 3.31–3.51Pine wood 41.8–43.6 19.3–19.9 30.5–34.2 0.57–0.91EFB 39.9–42.8 20.3–22.7 24.0–26.9 2.43–3.20
224 Y.P. Wijaya et al. / Bioresource Technology 164 (2014) 221–231
more precisely. The concentrations of polymeric sugars (celluloseand hemicellulose) were calculated from the concentrations of cor-responding monomeric sugars (glucose and xylose, respectively)based on the stoichiometric correlations and formulas describedin NREL/TP-510-42618 (Sluiter et al., 2008). Oak wood containedthe highest amount of cellulose but the lowest amount of hemicel-lulose, pine wood contained the highest amount of acid-insolublelignin, and EFB contained the highest amount of hemicellulose.
3.1.3. Crystallinity indexSince cellulose is the major part of the lignocellulosic biomass,
the crystallinity of cellulose in biomass may have important effectto the reactivity of the substrates in hydrolysis process. Crystallin-ity index (CrI) of cellulose is defined as the percentage of crystal-line part presented in the total cellulose (Guha et al., 2010). Inthis study, the CrI determination was applied to the raw biomassfor the comparison of crystallinity degree in each raw biomass,
thus the CrI is defined as the percentage of crystalline part pre-sented in the total raw biomass.
X-ray diffraction (XRD) is the most commonly used method tomeasure the crystallinity of dried cellulose samples, but it has beenfound that CrI varies significantly depending on the choice ofdetermination method. CrI alone may not adequately explain thecellulose digestibility, because cellulose accessibility is not onlyaffected by crystallinity, but it is also likely to be affected bylignin/hemicellulose content and distribution, particle size, andporosity of the cell wall (Park et al., 2010). Nevertheless, in thisstudy CrI determination was conducted to provide a preliminaryinsight about the crystallinity degree difference in oak wood, pinewood, and EFB and whether it would give meaningful correlationwith their overall conversion. In addition to the CrI determination,the results from XRD analysis were also used to show the change ofcrystalline structure in each raw biomass before and afterhydrolysis.
The CrI of each raw biomass was estimated by means of wide-angle X-ray scattering (WAXS), using the amorphous subtractionmethod, as also known as the Ruland–Vonk method (Park et al.,2010; Thygesen et al., 2005). In this method, crystallinity wasdetermined by subtracting the amorphous contribution from dif-fraction spectra using an amorphous standard, i.e. lignin powderobtained from the solid product of hydrolysis after being driedand neutralized. Oak, pine, and EFB lignin were obtained fromthe hydrolysis of oak wood, pine wood, and EFB, respectively at70 wt% decrystallization acid concentration, 30 �C decrystallizationreaction temperature and 78 �C hydrolysis reaction temperature.CrI was calculated as the ratio between the area of the crystallinecontribution and the total (crystalline + amorphous) area (Parket al., 2010; Thygesen et al., 2005; Young and Lovell, 1991). Theintegration of all peak areas was processed in OriginPro 8.5.1 soft-ware after applying Savitzky–Golay method for signal smoothing.The integration limits were selected so only the part of the diffrac-togram containing visible crystalline intensity was used, from2h = 10� to 2h = 50�. From the peak areas calculation, it was found

Y.P. Wijaya et al. / Bioresource Technology 164 (2014) 221–231 225
that pine wood has the highest crystallinity (CrI = 0.66), followedby EFB (CrI = 0.65) and oak wood (CrI = 0.61), respectively. Theresults are comparable to the alpha–cellulose (CrI = 0.75).
The different states of cellulose crystalline structure in each rawbiomass between the pre- and post-hydrolysis are illustrated inFig. 2. The pre-hydrolysis state is represented by the original rawbiomass diffraction spectra while the post-hydrolysis state is rep-resented by the amorphous lignin diffraction spectra. The ratiobetween amorphous peak area (after hydrolysis) and peak areacontained both crystalline and amorphous diffraction (beforehydrolysis) has been used to determine CrI. Significant change inthe peak intensity can be observed especially around 2h = 22.5�,indicating the cellulose crystallinity was dramatically reducedafter hydrolysis. Special notice addressed to EFB diffraction spectrawhere the abnormal peaks could be seen above 2h = 25� (specifi-cally at 26.78�, 40�, and 50�) which were likely attributed to thehigh impurities content in EFB. As also shown in EFB lignin spectra,crystal structure in the impurities was not broken under strongacid condition. The proximate analysis data, clearly showed thatEFB contained the highest amount of ash (inorganic solid residues,rock, dirt, and other impurities) among all the raw biomass, cansupport this XRD result thus the CrI of EFB was determinedwithout calculating these abnormal peak areas.
3.2. Selection of the operating parameters
Several studies have been conducted on acid hydrolysis for bio-mass conversion to investigate the effect of operating variables onsugar recovery and subsequent sugar degradation (Janga et al.,2012; Lenihan et al., 2010; Moe et al., 2012). Among the possibleoptions of operating variables, including: acid concentration, reac-tion temperature, and residence time at decrystallization andhydrolysis stage, biomass species, solid loading (acid to biomass)
Fig. 2. Comparison of cellulose crystalline structure in alpha–cellulo
ratio, and solid particle size, there are four input parameters variedin this work: (1) decrystallization acid concentration, (2) hydroly-sis temperature, (3) hydrolysis reaction time, and (4) biomassspecies. In this work, five output parameters were observed tostudy the effect of decrystallization acid concentration, hydrolysistemperature, hydrolysis reaction time, and biomass species:
(1) Hydrolyzate (sugar) concentration, refers to monomericsugar concentration, is the sum of glucose and xylose con-centration from HPLC analysis.
(2) Glucose/xylose ratio, represents the degree of decrystalliza-tion when it is combined with glucose yield as well as thedegree of hydrolysis when it is combined with xylose yield.In the fermentation process of sugar streams containingboth hexose and pentose sugars, this parameter might beimportant as the sugars could be fermented simultaneouslyand thus advantageously obviating the need for the sugarsseparation (Farone and Cuzens, 1996).
(3) Glucose yield, can be interpreted as the decrystallizationdegree of cellulose, was calculated on the basis of initialdry raw biomass.
(4) Sugar yield, is the sum of monomeric sugars (glucose andxylose) and oligomers (cellobiose) amount in the hydroly-zate compared to the initial dry raw biomass.
(5) Sugar recovery efficiency, is the ratio between the totalamount of sugars in the hydrolyzate and the totalamount of sugars in the biomass (when all cellulose andhemicellulose in the biomass could be fully converted intosugars).
3.3. The effect of decrystallization acid concentration
The use of the high sulfuric acid concentration ranged from 65to 80 wt% was necessary to effectively reduce the cellulose
se, oak wood, pine wood, and EFB before and after hydrolysis.

226 Y.P. Wijaya et al. / Bioresource Technology 164 (2014) 221–231
crystallinity, dismantle the lignocellulosic structure, and increasethe porosity of lignocellulosic materials (Sun and Cheng, 2002) inthe shorter reaction time (which means the faster degradation ofcellulose could be achieved), so that the cellulose in biomass wouldbe more easily accessible in the following hydrolysis process.
The concentration and distribution of sugars resulted from theend of decrystallization reaction are shown in Fig. 3. The resultsare quite different among the raw biomass, but still comparabletendencies can be observed. At the lower acid concentration(65–70 wt%), the production of glucose was less significant thanof xylose as glucose was still existed in its oligomers form (cellobi-ose), indicating that xylose, the derivative of hemicellulose, was
3.42 3.39
8.63
5.10
8.77 10.20
4.28
2.73
0.00
2.28 5.10
2.73
0
2
4
6
8
0
2
4
6
8
10
12
14
16
18
20
65 70 75 80
1.13
4.76
8.25
4.47 2.36
7.18
4.57
3.25
0.00
4.17 5.52
2.55
0
2
4
6
8
0
2
4
6
8
10
12
14
16
18
20
65 70 75 80
4.00 5.89
1.38 1.89
5.77
11.14
5.45 2.67
0.00
0.00
2.53
2.78
0
2
4
6
8
0
2
4
6
8
10
12
14
16
18
20
65 70 75 80
Initial acid concentration (wt%)
Cellobiose Xylose Glucose Monomeric sugar yield
(a)
(b)
(c)
Fig. 3. Product distribution at the end of decrystallization reaction from: (a) oakwood, (b) pine wood, (c) EFB, at various initial acid concentration. The primary andsecondary vertical axis represents sugar concentration (g/L) and monomeric sugaryield (wt%), respectively.
liberated at the higher production rate. However, the productionof xylose was decreased with the increasing acid concentration,while the production of glucose started to increase when the acidconcentration was increased, from 70 to 75 wt%.
The effect of decrystallization acid concentration toward sugarconcentration, glucose to xylose ratio, glucose and sugar yield arepresented in Fig. 4. All the output parameters were calculated atthe end of hydrolysis process after the sugars were collected inthe filtrate.
In oak wood hydrolysis, the increasing acid concentration from65 to 75 wt% resulted in the increasing sugar concentration andsugar yield (significantly at 80 �C and slightly at 100 �C), as shownin Fig. 4(a) and (b), but when the acid concentration was increasedfurther to 80 wt%, the sugar concentration was decreased, mainlyrelated to the decreasing xylose concentration at the more acidicenvironment due to the formation of smaller chemicals. Glucose/xylose ratio tended to increase with the increasing acid concentra-tion. The highest value of glucose/xylose ratio was 7.92 thatachieved at 80 wt% and 100 �C, which was the most severe condi-tion in this experiment. The highest sugar concentration was80.02 g/L with glucose/xylose ratio of 2.27, glucose yield of31.50 wt%, and sugar yield of 52.39 wt%, achieved at 75 wt% and80 �C.
In pine wood hydrolysis, comparable with those happened inoak wood hydrolysis as shown in Fig. 4(c) and (d), the amount ofsugar yield also tended to increase with the increasing acid con-centration but slightly decrease at the more acidic environment.The increasing acid concentration also contributed to the increas-ing glucose/xylose ratio, but the values were not as high as thoseobtained in oak wood or EFB hydrolysis, indicating the more stablehemicellulose structure of softwood which contains mostly gluco-mannans (Saha, 2003). Some portions of glucose could also bederived from the glucomannans thus in the decomposition ofhemicellulose some of the glucoses were also reduced togetherwith the xyloses. The highest value of glucose/xylose ratio wasonly 2.77 that was also achieved at 80 wt% and 100 �C. The highestsugar concentration was 84.62 g/L with glucose/xylose ratio of2.04, glucose yield of 29.83 wt%, and sugar yield of 50.47 wt%,achieved at 80 wt% and 80 �C.
In EFB hydrolysis, the results were quite different as shown inFig. 4(e) and (f) where the increasing acid concentration from 75to 80 wt% still significantly increased the sugar yield. It was relatedto the highest moisture content in EFB which contributed to thelowering acid concentration used compared to those used in oakor pine wood hydrolysis. Therefore, the less reaction severity at80 �C resulted in the zero inhibitors formation, as confirmed inthe HPLC analysis results. Similar with those happened in oakand pine wood hydrolysis, glucose/xylose ratio in EFB hydrolysisalso increased with the acid concentration. The highest value ofglucose/xylose ratio was 7.53 that was also achieved at 80 wt%and 100 �C. The highest sugar concentration was 81.63 g/L withglucose/xylose ratio of 1.95, glucose yield of 32.23 wt%, and sugaryield of 57.03 wt%, achieved at 80 wt% and 80 �C.
In summary, among all biomass species, there has been a com-parable evidence with some results from dilute acid hydrolysisprocess (Hong et al., 2013; Lenihan et al., 2010) that increasingthe acid concentration is generally more effective way to maximizeoverall sugar yield than increasing the operating temperature. Inthe use of 65–75 wt% sulfuric acid and especially at 80 �C, no sugardegradation products were identified. Acid concentration is themost important parameter for release of sugar (Rahman et al.,2006; Roberto et al., 2003). However, it is always necessary to con-sider the upper limit of acid concentration where the sugar can stillremain formed effectively, because beyond that limit the reactionenvironment will be more severe and the sugar decomposition intosmaller species will inevitably happen.

Fig. 4. The effect of decrystallization acid concentration on sugar concentration, glucose/xylose ratio (left), and sugar yield (right) in the hydrolysis of: (a and b) oak wood,(c and d) pine wood, (e and f) EFB, at various hydrolysis temperature.
Y.P. Wijaya et al. / Bioresource Technology 164 (2014) 221–231 227
3.4. The effect of hydrolysis temperature
The hydrolysis reaction was preceded by the dilution of themixture aimed to hydrolyze the formed oligosaccharides to a mix-ture of hexoses and pentoses. In this process, water cleaved theglycosidic bonds in polysaccharides so that the cellulose and hemi-cellulose would be broken into simple sugars (monosaccharides).Fig. 4 also represents the effect of hydrolysis temperature towardsugar concentration, glucose/xylose ratio, glucose yield, and sugaryield.
In all biomass species, especially at the acid concentration rangefrom 70 to 80 wt%, the increasing temperature generally decreasedsugar concentration, glucose yield, and sugar yield, as well asincreased glucose/xylose ratio. However, the increasing tempera-ture at 65 and 70 wt% acid concentration slightly increased the glu-cose yield. This might indicate that the use of below 70 wt% acidconcentration was not strong enough to completely decrystallizethe cellulose thus it is necessary to add the severity of the reaction
environment by increasing the temperature in order to obtainmore glucoses.
Glucose/xylose ratio tended to increase with the temperature.At all acid concentrations, the values of glucose/xylose ratio at100 �C are always higher than at 80 �C because of the sugar degra-dation at the higher temperature. Even though at both hydrolysistemperatures the increasing acid concentration always contributedto the increasing glucose/xylose ratio, but the reason behind thisevidence was not exactly the same. At 80 �C the increasing glu-cose/xylose ratio was mainly attributed to the increasing of glucoseamount. However, at 100 �C the increasing glucose/xylose ratiowas attributed to the decreasing of xylose amount that was greaterthan the decreasing of glucose amount.
The glucose yield at 100 �C was always lower than at 80 �C,especially at the higher acid concentration (75–80 wt%). It wasan evidence that at the higher acid concentration, the higher tem-perature promoted the decreasing of glucose yield while at thelower acid concentration (65–70 wt%) some data still showed the

228 Y.P. Wijaya et al. / Bioresource Technology 164 (2014) 221–231
higher glucose yield at 100 �C. There are some possible reasonsbehind this evidence. After decrystallization reaction, cellulose(which is the major source of glucose) existed in the substrate ashigh molecular cellulose (partially broken cellulose), oligomers(more broken high molecular cellulose), monomers, and hydro-lyzed monomers to smaller chemicals. At the lower acid concentra-tion, high molecular cellulose existed more than oligomers while atthe higher acid concentration, oligomers existed more than highmolecular cellulose. During hydrolysis, after the lower decrystalli-zation acid concentration treatment, substrates were hydrolyzedto have more oligomers and also monomers at both 80 �C and100 �C. After the higher decrystallization acid concentration treat-ment, substrates were hydrolyzed to have more monomers at 80 �Cwhile to have monomers as well as over-hydrolyzed chemicalsfrom monomers at 100 �C, as confirmed in the HPLC chromatogramafter 20 min analysis time. Some studies have reported that thehigher temperature leads to the decomposition of glucoses into
Fig. 5. Comparison of glucose and xylose concentration profile from the hydrolysis of:
hydroxymethylfurfural (HMF) which, on continued heating, willyield levulinic acid and formic acid (Hong et al., 2013; Lenihanet al., 2010; Saeman, 1945; Taherzadeh and Karimi, 2007).
Nevertheless, compared to glucose, xylose is more susceptibleto the harsh condition, due to its amorphous structure (Rahmanet al., 2007) and reactivity. Therefore, xylose is easier and fasterto degrade than glucose, which is more resistant to harsh condition(Taherzadeh and Karimi, 2007). Xylose is liberated during thedecomposition of hemicellulose. At the higher temperature, xylosedegrades into furaldehydes and the acetylxylan in hemicellulosewas hydrolyzed into acetic acid (Shahbazi and Zhang, 2010). Itwas clearly observed that in all biomass species and at all acid con-centrations, the increasing hydrolysis temperature contributed tothe decreasing xylose yield.
At above the 65 wt% acid concentration, the sugar yield resultedfrom hydrolysis at 100 �C was always lower than at 80 �C. This evi-dence has confirmed that hydrolysis temperature is the main
(a and b) oak wood, (c and d) pine wood, (e and f) EFB, at all process conditions.

Y.P. Wijaya et al. / Bioresource Technology 164 (2014) 221–231 229
parameter responsible for the sugar degradation into variousbyproducts. It has more significant detrimental effect than acidconcentration in the decrystallization stage.
3.5. The effect of hydrolysis reaction time
In Fig. 5, it is clearly seen that sugar concentration tended todecrease over time after two hours reaction, especially at the moresevere reaction condition, i.e. 80 wt% acid concentration and 100 �Chydrolysis temperature. The decreasing sugar concentration wasmainly associated with the degradation of xylose, which was fasterthan glucose, as indicated by the sharper curve slope of xyloseconcentration profile.
The starting point (t = 0 min) was actually counted as the timewhen the hydrolysis reaction had just started at the desired tem-perature. It was the time when the temperature had reached80 �C (or 100 �C). When monomeric sugar yields are comparedbetween Figs. 3 and 4, the sugar concentrations at the end ofdecrystallization stage were still far below the sugar concentra-tions at the beginning of hydrolysis stage, thus it implies that thesugars production mainly occurred at the heating stage with thehighest hydrolysis reaction rate of cellobiose into glucose.
At the lower acid concentration (65–70 wt%) and 100 �C, glu-cose concentration tended to increase over time while at thehigher acid concentration (�80 wt%) and 100 �C, glucose concen-tration significantly decreased over time. This happened becauseof the different reaction rate between those two conditions. Thehigher acid concentration could significantly convert cellulose intoglucose in the shorter time while the lower acid concentrationneeded the longer time to hydrolyze as much as possible celluloseinto glucose, before it was finally decomposed afterwards. That iswhy at the lower acid concentration, glucose concentrationseemed to increase over time. Hydrolysis reaction time affectedsugar (especially xylose) concentration more significantly at thehigher temperature (�100 �C). It was also observed that at above70 wt% acid concentration, the maximum sugar concentration
Table 3Summary of the optimum results for the two-step concentrated acid hydrolysis of oak wo
Input parameter Output
Raw material CH2SO4 (wt%) Thydrolysis (�C) thydrolysis (min) G/X rat
Oak wood 65 80 90 0.27100 60 0.49
70 80 30 2.23100 30 1.17
75 80 30 2.06100 30 1.61
80 80 30 2.11100 30 2.61
Pine wood 65 80 120 0.62100 90 0.86
70 80 120 1.16100 60 1.38
75 80 90 1.62100 30 1.65
80 80 30 1.87100 30 2.08
EFB 65 80 60 0.17100 30 0.23
70 80 60 0.79100 30 1.07
75 80 60 1.41100 30 1.69
80 80 30 1.51100 30 2.17
Notation: CH2SO4 = initial sulfuric acid concentration, Thydrolysis = hydrolysis temperature,(glucose and xylose) concentration, Yglucose = glucose yield, Ysugar = sugar (glucose, xylose
generally could have been achieved after 30 min reaction. Extend-ing the hydrolysis reaction time had just decreased the overallsugar yield. Compared to decrystallization acid concentration andhydrolysis temperature, hydrolysis reaction time also played a roleas severity factor but with the less impact.
3.6. The effect of biomass species
Among all the raw biomass, the lowest sugar yield was found inpine wood hydrolysis as it was the most difficult to convert. Asobserved at the decrystallization stage, the pine wood was rela-tively hard to be uniformly wetted and penetrated by acid solution.Crystallinity has been reported to affect cellulose accessibility byacids (Zhao et al., 2006), thus the high recalcitrance of pine wood(softwood) in hydrolysis may also be attributed to the highercellulose crystallinity of pine wood as compared to oak wood(hardwood) (Janga et al., 2012; Newman, 1994). The results fromXRD analysis have confirmed this report. Moreover, it has also beenreported that softwoods are less easily treated than hardwoods andusually need a combined chemical, such as SO2 or H2SO4 andsteam-aqueous treatment for fractionation (Janga et al., 2012;Overend et al., 1987). Hemicellulose solubilization was alsoaffected by the dominance of a thermally stable glucomannanbackbone in softwood hemicellulose, compared to simply xylanbackbone in hardwood hemicellulose (Janga et al., 2012; Saha,2003). During hydrolysis, the presence of higher amount ofcondensed lignin in softwoods may also hinder the swelling ofthe cell wall (Janga et al., 2012; Phaiboonsilpa et al., 2010).
3.7. Determination of optimum process condition for each biomassspecies
Summarizing all the experimental results, the effect of decrys-tallization acid concentration, hydrolysis reaction temperature,and hydrolysis reaction time toward sugar yield among the differ-ent raw biomass have been recognized well. These operating
od, pine wood, and EFB.
parameter
io Csugar (g/L) Yglucose (wt%) Ysugar (wt%) Sugar recovery (%)
37.66 4.12 20.67 33.1537.01 6.75 20.40 32.7268.45 27.41 43.60 69.9461.18 19.72 39.54 63.4390.39 34.53 59.98 96.2366.97 23.69 41.56 66.6889.07 34.46 59.51 95.4880.76 34.18 52.67 84.50
50.63 9.84 27.37 41.1049.53 11.77 26.75 40.1867.82 19.54 39.64 59.5469.79 20.78 38.72 58.1685.36 27.99 51.91 77.9778.29 27.31 48.45 72.7887.48 29.94 52.28 78.5377.20 26.53 43.58 65.45
43.72 3.78 26.87 39.7741.04 4.46 24.77 36.6761.86 16.27 39.15 57.9662.14 19.67 39.21 58.0480.52 28.11 50.56 74.8574.95 27.87 48.21 71.3788.20 31.68 61.36 90.8475.67 30.50 48.10 71.20
thydrolysis = hydrolysis reaction time, G/X ratio = glucose to xylose ratio, Csugar = sugar, and cellobiose) yield.

Table 4Summary of the optimum process condition for the two-step concentrated acidhydrolysis of oak wood, pine wood, and EFB.
Oak wood Pine wood EFB
Initial acid concentration (wt%) 75 80 80Hydrolysis temperature (�C) 80 80 80Hydrolysis reaction time (min) 30 30 30Sugar concentration (g/L) 90.39 87.48 88.20Glucose/xylose ratio 2.06 1.87 1.51Glucose yield (wt%) 34.53 29.94 31.68Sugar yield (wt%) 59.98 52.28 61.36Sugar recovery efficiency (%) 96.23 78.53 90.84
230 Y.P. Wijaya et al. / Bioresource Technology 164 (2014) 221–231
parameters can actually affect the sugar recovery, either individu-ally or synergistically. In order to enhance the sugar yield, oneparameter should be kept in a low value if the value of otherparameters was desired to rise, unless the sugar decompositionwould be unavoidable.
The optimum process condition for each raw biomass wasdetermined based on the highest sugar recovery in the shortesthydrolysis reaction time after comparing the values of sugar yieldin all process conditions. Based on the calculation corresponding tothe carbohydrate composition data in Table 2, the average amountof holocellulose (cellulose and hemicellulose) in oak wood, pinewood, and EFB was 60.68, 61.86, and 65.35 wt%, respectively. Theaverage amount of sugars theoretically obtained from the carbohy-drate conversion of these three consecutive biomass was 62.33,66.58, and 67.56 wt%. Table 3 summarizes the optimum resultsof the two-step concentrated acid hydrolysis overall experimentalresults.
The different results could be recognized, especially in terms ofglucose and sugar yield, and were associated with the differentreactivity among the different biomass species. Reactivity is thecombined effect of crystallinity (in all biomass species), hornifica-tion (in EFB), and lignin composition (in pine wood and EFB), whichis related to the cellulose accessibility by sulfuric acid. In otherwords, crystallinity, hornification (Diniz et al., 2004), and lignincomposition interfere the solvent diffusivity into the cellulosestructure. At the lower sulfuric acid concentration (�65 wt%), crys-tallinity is the dominant factor for the reducing solvent diffusivity,as shown by the low glucose production in all the raw biomass. Asthe sulfuric acid concentration increased, lignin composition andhornification might affect the degree of cellulose conversion wherecellulose crystallinity had been reduced by the higher sulfuric acidconcentration (>75 wt%). As previously mentioned, the lowestsugar recovery efficiency in pine wood hydrolysis has been attrib-uted to the highest crystallinity as one of the possible reactivityfactors while oak wood which showed the lowest crystallinitygained the highest sugar recovery efficiency. Finally, the optimumprocess conditions are summarized in Table 4.
Even though the results have indicated that there could be animportant correlation between CrI and sugar yield to explain thecellulose digestibility in lignocellulosic biomass, it is still necessaryto conduct further studies about the effect of other factors affectingcellulose accessibility such as lignin/hemicellulose content anddistribution, hornification, particle size, and porosity of cell wallin order to gain more comprehensive understanding on thecellulose digestibility in various lignocellulosic biomass.
4. Conclusions
Concentrated acid hydrolysis has been successfully applied tobreak cellulose crystal structure and extract sugars without furtherhemicellulose degradation from oak wood, pine wood, and EFB.Reaction severity, which is mainly the combination between
decrystallization sulfuric acid concentration and hydrolysis tem-perature, affected the sugar yield showing the compromisebetween glucose and xylose yield. At the optimum process condi-tion, 78–96% sugars out of theoretically extractable sugars havebeen fractionated with 87–90 g/L sugar concentration in thehydrolyzate. Pine showed the highest recalcitrance followed byEFB and oak based on the correlation between CrI and sugar recov-ery efficiency.
Acknowledgements
This work has been supported by Korea Institute of Science andTechnology (KIST) institutional project and KIST-UBC on-sitelaboratory program.
References
Basu, P., 2010. Biomass Gasification and Pyrolysis: Practical Design and Theory.Academic Press, Elsevier.
Diniz, J.F., Gil, M., Castro, J., 2004. Hornification—its origin and interpretation inwood pulps. Wood Sci. Technol. 37, 489–494.
Farone, W.A., Cuzens, J.E. 1996. Method of Producing Sugars Using Strong AcidHydrolysis of Cellulosic and Hemicellulosic Materials. U.S. Patent No. 5,562,777.
Groenestijn, J.V., Hazewinkel, O., Bakker, R., 2006. Pretreatment of lignocellulosewith biological acid recycling (Biosulfurol process). Sugar Indust./Zuckerindust.131, 639–641.
Guha, S.K., Kobayashi, H., Fukuoka, A., 2010. Conversion of cellulose to sugars.Thermochemical Conversion of Biomass to Liquid Fuels and Chemicals, vol. 1.RSC Publishing, pp. 344–364.
Hatfield, R., Fukushima, R.S., 2005. Can lignin be accurately measured? Crop Sci. 45,832–839.
Hong, J.Y., Kim, Y.S., Oh, K.K., 2013. Fractionation and delignification of empty fruitbunches with low reaction severity for high sugar recovery. Bioresour. Technol.146, 176–183.
Iranmahboob, J., Nadim, F., Monemi, S., 2002. Optimizing acid-hydrolysis: a criticalstep for production of ethanol from mixed wood chips. Biomass Bioenerg. 22,401–404.
Janga, K.K., Hägg, M.-B., Moe, S.T., 2012. Influence of acid concentration,temperature, and time on decrystallization in two-stage concentrated sulfuricacid hydrolysis of pinewood and aspenwood: a statistical approach.BioResources 7, 391–411.
Klemm, D., Philipp, B., Heinze, T., Heinze, U., Wagenknecht, W., 1998. Generalconsiderations on structure and reactivity of cellulose. Comprehensive CelluloseChemistry: Fundamentals and Analytical Methods, vol. 1. Wiley-VCH VerlagGmbH & Co. KGaA, pp. 83–86.
Kneller, W., 1986. Physicochemical characterization of coal and coal reactivity: areview. Thermochim. Acta 108, 357–388.
Lenihan, P., Orozco, A., O’neill, E., Ahmad, M., Rooney, D., Walker, G., 2010. Diluteacid hydrolysis of lignocellulosic biomass. Chem. Eng. J. 156, 395–403.
Moe, S.T., Janga, K.K., Hertzberg, T., Hägg, M.-B., Øyaas, K., Dyrset, N., 2012.Saccharification of lignocellulosic biomass for biofuel and biorefineryapplications – a renaissance for the concentrated acid hydrolysis? EnergyProcedia 20, 50–58.
Newman, R.H., 1994. Crystalline forms of cellulose in softwoods and hardwoods. J.Wood Chem. Technol. 14, 451–466.
Overend, R., Chornet, E., Gascoigne, J., 1987. Fractionation of lignocellulosics bysteam-aqueous pretreatments [and discussion].. Philos. Trans. R. Soc. Lond. A.Math Phys. Sci. 321, 523–536.
Park, S., Baker, J.O., Himmel, M.E., Parilla, P.A., Johnson, D.K., 2010. Cellulosecrystallinity index: measurement techniques and their impact on interpretingcellulase performance. Biotechnol. Biofuels 3, 1–10.
Phaiboonsilpa, N., Lu, X., Yamauchi, K., Saka, S., 2010. Chemical conversion oflignocellulosics as treated by two-step hot-compressed water. In: Zero-CarbonEnergy Kyoto 2009. Springer, pp. 166–170.
Rahman, S., Choudhury, J., Ahmad, A., 2006. Production of xylose from oil palmempty fruit bunch fiber using sulfuric acid. Biochem. Eng. J. 30, 97–103.
Rahman, S., Choudhury, J., Ahmad, A., Kamaruddin, A., 2007. Optimization studieson acid hydrolysis of oil palm empty fruit bunch fiber for production of xylose.Bioresour. Technol. 98, 554–559.
Roberto, I.C., Mussatto, S.I., Rodrigues, R.C., 2003. Dilute-acid hydrolysis foroptimization of xylose recovery from rice straw in a semi-pilot reactor. Ind.Crops Prod. 17, 171–176.
Saeman, J.F., 1945. Kinetics of wood saccharification-hydrolysis of cellulose anddecomposition of sugars in dilute acid at high temperature. Ind. Eng. Chem. 37,43–52.
Saha, B.C., 2003. Hemicellulose bioconversion. J. Ind. Microbiol. Biotechnol. 30, 279–291.
Sathitsuksanoh, N., Zhu, Z., Rollin, J., 2010. Solvent fractionation of lignocellulosicbiomass. Bioalcohol Production: Biochemical Conversion of LignocellulosicBiomass, vol. 1. Woodhead Publishing Limited.

Y.P. Wijaya et al. / Bioresource Technology 164 (2014) 221–231 231
Selig, M.J., Thygesen, L.G., Johnson, D.K., Himmel, M.E., Felby, C., Mittal, A., 2013.Hydration and saccharification of cellulose Ib, II and IIII at increasing dry solidsloadings. Biotechnol. Lett. 35, 1599–1607.
Shahbazi, N., Zhang, B., 2010. Dilute and concentrated acid hydrolysis oflignocellulosic biomass. Bioalcohol Production: Biochemical Conversion ofLignocellulosic Biomass, vol. 1. Woodhead Publishing Limited.
Sluiter, A., Hames, B., Ruiz, R., Scarlata, C., Sluiter, J., Templeton, D., Crocker, D., 2008.Determination of structural carbohydrates and lignin in biomass. In: LaboratoryAnalytical Procedure (LAP), NREL/TP-510-42618. National Renewable EnergyLaboratory, Golden, Colorado.
Sluiter, J.B., Ruiz, R.O., Scarlata, C.J., Sluiter, A.D., Templeton, D.W., 2010.Compositional analysis of lignocellulosic feedstocks. 1. Review anddescription of methods. J. Agric. Food Chem. 58, 9043–9053.
Sun, Y., Cheng, J., 2002. Hydrolysis of lignocellulosic materials for ethanolproduction: a review. Bioresour. Technol. 83, 1–11.
Sun, Z.-Y., Tang, Y.-Q., Iwanaga, T., Sho, T., Kida, K., 2011. Production of fuel ethanolfrom bamboo by concentrated sulfuric acid hydrolysis followed by continuousethanol fermentation. Bioresour. Technol. 102, 10929–10935.
Taherzadeh, M.J., Karimi, K., 2007. Acid-based hydrolysis processes for ethanol fromlignocellulosic materials: a review. BioResources 2, 472–499.
Templeton, D.W., Scarlata, C.J., Sluiter, J.B., Wolfrum, E.J., 2010. Compositionalanalysis of lignocellulosic feedstocks. 2. Method uncertainties. J. Agric. FoodChem. 58, 9054–9062.
Thygesen, A., Oddershede, J., Lilholt, H., Thomsen, A.B., Ståhl, K., 2005. On thedetermination of crystallinity and cellulose content in plant fibres. Cellulose 12,563–576.
Warne, S.S.J., 1996. Thermal analysis and coal assessment: an overview with newdevelopments. Thermochim. Acta 272, 1–9.
Young, R.J., Lovell, P.A., 1991. Introduction to Polymers, 199. Chapman and Hall,London, pp. 263–267.
Zhao, H., Kwak, J.H., Wang, Y., Franz, J.A., White, J.M., Holladay, J.E., 2006. Effects ofcrystallinity on dilute acid hydrolysis of cellulose by cellulose ball-millingstudy. Energy Fuels 20, 807–811.