Embed Size (px)
Citation preview
Omas Bulan SAMOSIR, “Comparative Study on the Effects of Socio-economic Factors, Industrialisation, and Urbanisation on Mortality in Indonesia and Japan”, CICRED Seminar on Mortality as Both a Determinant and a Consequence of Poverty and Hunger, Thiruvananthapuram, India, February 23-25, 2005, pp. 1-23. Draft paper before publication, please do not use it as reference
Comparative Study on the Effects of Socioeconomic Factors, Industrialization, and Urbanization on Mortality in
Indonesia and Japan
Omas Bulan Samosir Triasih Djutaharta
Demographic Institute
Faculty of Economics University of Indonesia
The research project was made possible by the research grant from the Sumitomo Foundation in the 2000/2001 fiscal year

O.B. SAMOSIR
2
Abstract Japan is a country in the world that has lowest mortality and longest life expectancy. The improvement of health in this country has been remarkable. In the other hand, Indonesia is also experiencing improvement in health condition, but in much lower pace. It is accepted that development programs contribute to this improvement of human quality. Therefore it is important to compare the effects of socioeconomic factors, industrialization, and urbanization on mortality in Indonesia and Japan. The unit analysis is province for Indonesia and prefecture for Japan. The independent factors are low-income, industrialization, and urbanization. These three factors are the composite variables of 11 original variables. The reduction of the dimension of the original independent variables was done using the factor analysis. To test the effects of the three factors on mortality the multivariate regression analysis was employed. The indicator of mortality is the age specific death rate (grouped into 0-14, 15-59, and 60 or over) and the cause specific death rate (grouped into communicable, non-communicable, and injury and other). For Indonesia the time span of both independent and dependent variables was 1990-1995. For Japan, it was 1990-1997. The results of the study show that the age specific death rate and the cause specific death rate are correlated. In addition, low-income factor and urbanization is important predictor of mortality in Indonesia. In Japan low-income factor, urbanization, and industrialization affect mortality significantly. 1. Introduction The governments, international communities and non-government organizations have been committed and willing to integrate population concerns into all aspects of economic and social activities in order to achieve a better quality of life for all individual and future generation. It was agreed in the International Conference on Population and Development (ICPD) in Cairo in 1994. More than 180 states took part in the finalization of programs of action of the ICPD that have to be implemented in the next 20 years from 1994 (United Nations 1995). Among the actions are health-related activities. Many of actions in human development have been conducted such as increasing women education, supply of health services and campaign of healthy life. They all have a purpose to increase the quality of life of people. In health terms, better quality of life can be measured through the declining of morbidity, disability, and mortality or through the increasing of the life expectancy. However, in fact, in the 1960s many governments, especially in developing countries, started improving the health services in their countries, as a response to the high mortality levels. As the results, in the 1990s many countries, including Japan and Indonesia, have experienced decline in mortality levels. Japan experienced sharp increase in its health condition during the 1950-99. In 1950, the life expectancy at birth
COMPARATIVE STUDY ON THE EFFECTS OF SOCIO-ECONOMIC FACTORS …
3
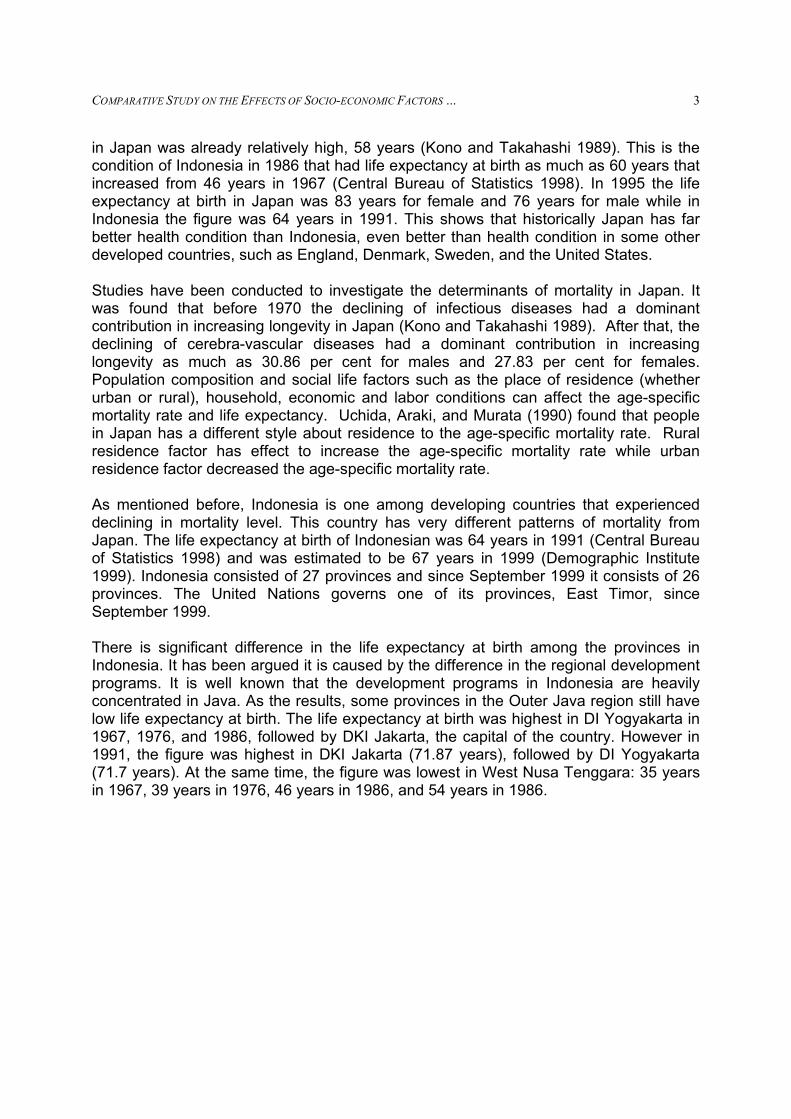
in Japan was already relatively high, 58 years (Kono and Takahashi 1989). This is the condition of Indonesia in 1986 that had life expectancy at birth as much as 60 years that increased from 46 years in 1967 (Central Bureau of Statistics 1998). In 1995 the life expectancy at birth in Japan was 83 years for female and 76 years for male while in Indonesia the figure was 64 years in 1991. This shows that historically Japan has far better health condition than Indonesia, even better than health condition in some other developed countries, such as England, Denmark, Sweden, and the United States. Studies have been conducted to investigate the determinants of mortality in Japan. It was found that before 1970 the declining of infectious diseases had a dominant contribution in increasing longevity in Japan (Kono and Takahashi 1989). After that, the declining of cerebra-vascular diseases had a dominant contribution in increasing longevity as much as 30.86 per cent for males and 27.83 per cent for females. Population composition and social life factors such as the place of residence (whether urban or rural), household, economic and labor conditions can affect the age-specific mortality rate and life expectancy. Uchida, Araki, and Murata (1990) found that people in Japan has a different style about residence to the age-specific mortality rate. Rural residence factor has effect to increase the age-specific mortality rate while urban residence factor decreased the age-specific mortality rate. As mentioned before, Indonesia is one among developing countries that experienced declining in mortality level. This country has very different patterns of mortality from Japan. The life expectancy at birth of Indonesian was 64 years in 1991 (Central Bureau of Statistics 1998) and was estimated to be 67 years in 1999 (Demographic Institute 1999). Indonesia consisted of 27 provinces and since September 1999 it consists of 26 provinces. The United Nations governs one of its provinces, East Timor, since September 1999. There is significant difference in the life expectancy at birth among the provinces in Indonesia. It has been argued it is caused by the difference in the regional development programs. It is well known that the development programs in Indonesia are heavily concentrated in Java. As the results, some provinces in the Outer Java region still have low life expectancy at birth. The life expectancy at birth was highest in DI Yogyakarta in 1967, 1976, and 1986, followed by DKI Jakarta, the capital of the country. However in 1991, the figure was highest in DKI Jakarta (71.87 years), followed by DI Yogyakarta (71.7 years). At the same time, the figure was lowest in West Nusa Tenggara: 35 years in 1967, 39 years in 1976, 46 years in 1986, and 54 years in 1986.
O.B. SAMOSIR
4
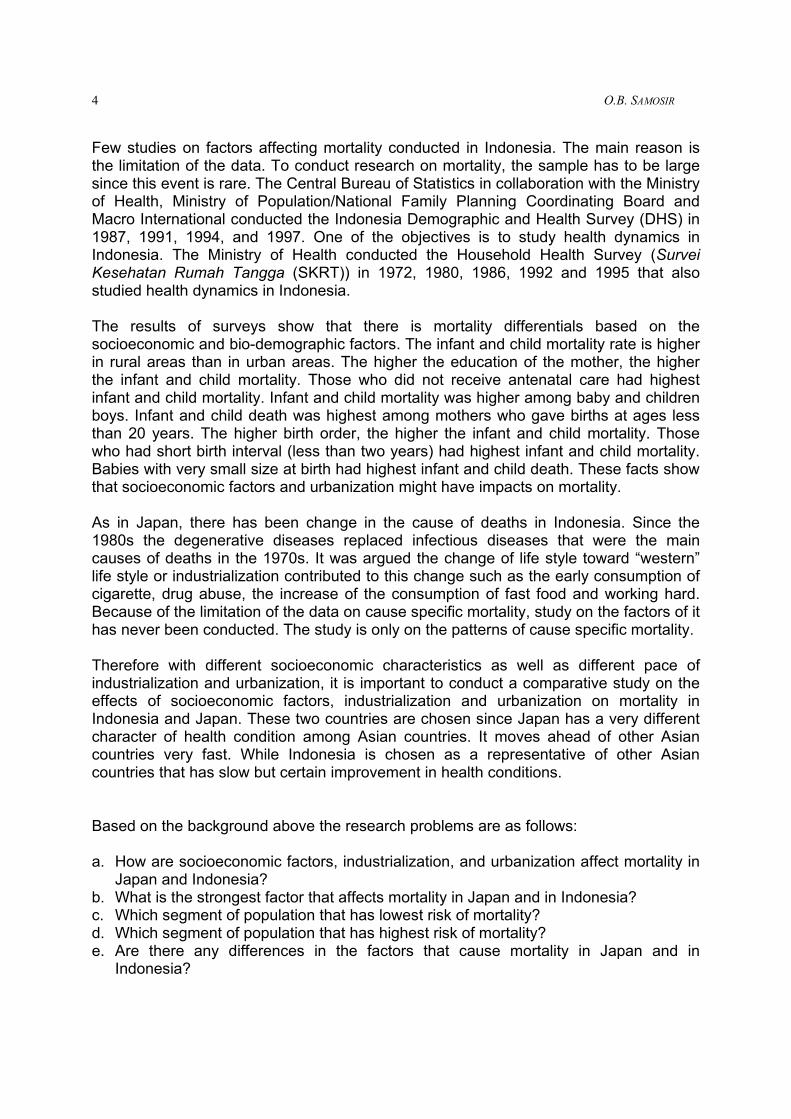
Few studies on factors affecting mortality conducted in Indonesia. The main reason is the limitation of the data. To conduct research on mortality, the sample has to be large since this event is rare. The Central Bureau of Statistics in collaboration with the Ministry of Health, Ministry of Population/National Family Planning Coordinating Board and Macro International conducted the Indonesia Demographic and Health Survey (DHS) in 1987, 1991, 1994, and 1997. One of the objectives is to study health dynamics in Indonesia. The Ministry of Health conducted the Household Health Survey (Survei Kesehatan Rumah Tangga (SKRT)) in 1972, 1980, 1986, 1992 and 1995 that also studied health dynamics in Indonesia. The results of surveys show that there is mortality differentials based on the socioeconomic and bio-demographic factors. The infant and child mortality rate is higher in rural areas than in urban areas. The higher the education of the mother, the higher the infant and child mortality. Those who did not receive antenatal care had highest infant and child mortality. Infant and child mortality was higher among baby and children boys. Infant and child death was highest among mothers who gave births at ages less than 20 years. The higher birth order, the higher the infant and child mortality. Those who had short birth interval (less than two years) had highest infant and child mortality. Babies with very small size at birth had highest infant and child death. These facts show that socioeconomic factors and urbanization might have impacts on mortality. As in Japan, there has been change in the cause of deaths in Indonesia. Since the 1980s the degenerative diseases replaced infectious diseases that were the main causes of deaths in the 1970s. It was argued the change of life style toward “western” life style or industrialization contributed to this change such as the early consumption of cigarette, drug abuse, the increase of the consumption of fast food and working hard. Because of the limitation of the data on cause specific mortality, study on the factors of it has never been conducted. The study is only on the patterns of cause specific mortality. Therefore with different socioeconomic characteristics as well as different pace of industrialization and urbanization, it is important to conduct a comparative study on the effects of socioeconomic factors, industrialization and urbanization on mortality in Indonesia and Japan. These two countries are chosen since Japan has a very different character of health condition among Asian countries. It moves ahead of other Asian countries very fast. While Indonesia is chosen as a representative of other Asian countries that has slow but certain improvement in health conditions.
Based on the background above the research problems are as follows:
a. How are socioeconomic factors, industrialization, and urbanization affect mortality in Japan and Indonesia?
b. What is the strongest factor that affects mortality in Japan and in Indonesia? c. Which segment of population that has lowest risk of mortality? d. Which segment of population that has highest risk of mortality? e. Are there any differences in the factors that cause mortality in Japan and in
Indonesia?

COMPARATIVE STUDY ON THE EFFECTS OF SOCIO-ECONOMIC FACTORS …
5
It is hoped that by knowing the factors affecting the age and cause specific mortality and who have highest and lowest mortality, health programs can be improved so they will reach the target population. It is also hope it will add the understanding of the cause of deaths in the two countries in order to achieve health for all. This paper consists of six sections. Section 1 describes the background, problems, and objectives of the research. In Section 2 results of previous studies on mortality in Japan and Indonesia are reviewed. Section 3 presents data sources, operational definition of variables used in the analysis, and methods of data analysis. Descriptions of socioeconomic, industrialization, and urbanization characteristics as well as the Age Specific and Cause Specific Death Rates in both countries are presented in Section 4. The results of factor analysis are also presented in Section 4. The results of the analysis of the effects of socioeconomic factors, industrialization, and urbanization on mortality in Japan and Indonesia are given in Section 5. Conclusions and policy recommendations are presented in Section 6. 2. Mortality in Indonesia and Japan Before the discussion of the literature review on mortality in Indonesia and Japan is presented, the facts about both countries are given here. One same feature that characterizes both countries is that they are two countries among countries in the world that has large number of population. Indonesia is the fourth and Japan is the seventh. The 2000 Indonesia Population Census results show that the number of population was 203 million (Central Bureau of Statistics 2000). With the rate of natural increase of 1.6 percent per annum it is projected that the population of Indonesia will be 273 million in 2025 and double in 44 years. Meanwhile, Japan population was estimated to be 127 million in 2000 (Population Reference Bureau 2000). With the rate of natural increase of 0.2 percent per annum, the Japanese is estimated to decline to 121 million in 2025 and to double in 462 years. Other demographic facts in 2000, except the Crude Death Rate (CDR) which was the same (eight people per 1000 population), of the two countries differ significantly (Population Reference Bureau 2000). The Total Fertility Rate (TFR) of Japan was estimated to be 1.3 children per woman while it was 2.8 for Indonesia. The Infant Mortality Rate (IMR) was 3.5 infant deaths per 1000 live births in Japan while it was 46 in Indonesia. The life expectancy at birth was 81 years for Japanese and 64 years for Indonesian. The percentage of population aged 65 years or over was 17 in Japan and 4 in Indonesia. As an industrialized country, the Urbanization Rate (UR) in Japan was twice of the UR in Indonesia (78 and 39 percent respectively). One economic fact is the Gross National Product, which also differs substantially. In 1998, the period after economic crisis began, it was estimated to be US$ 32,250 for Japan and less than one-fiftieth, US$ 640, for Indonesia. As a developing country Indonesia was characterized by poor living conditions in the 1940s and 1950s. Food was scarce and infectious diseases were widespread. In

O.B. SAMOSIR
6
addition, there were wars for independence. These resulted in high mortality levels. Health development programs developing countries in the 1970s, such as immunization program, were successful in reducing mortality, in particular deaths caused by infectious diseases. The CDR of Indonesia was estimated to be 19 deaths per 1000 and the Infant Mortality Rate of Indonesia was 142 infant deaths per 1000 live births based on the 1971 Population Census The results of the 1997 IDHS suggest that almost half of infant deaths in Indonesia happened in the first month of lives and the rest happened in the aged 1-11 months (Central Bureau of Statistics et al. 1998)..Hence in Indonesia more attention still needs to be given to newly born babies in order to reduce infant mortality. Meanwhile the Maternal Mortality Ratio is high in Indonesia. It is highest among the South East Asian countries. The figure was 450 maternal deaths per 100,000 live births based on the 1986 Household Health Survey and declined to 390 based on the 1994 IDHS (Central Bureau of Statistics et al. 1995). In the pre-industrial Tokugawa period (1603-1867) Japan was characterized by high birth and high death rates and stagnant population growth due to many reasons such as famines, epidemics, abortion, infanticide and postponement of marriage (Kuroda 1984). Janetta (1992) wrote that during the eighteenth and early nineteenth centuries Japan experienced mortality crisis where many people died of starvation. It was in the Meiji Government in the 1880s the death rate started to decline. The CDR was 25.4 per thousand people in 1920 that was exceptionally high due to the influenza epidemic. It declined to 16.2 in 1940-1942. The Infant Mortality Rate (IMR) was above 160 per 1000 live births until 1923, then rapidly declined to levels below 90 after 1941 (Kobayashi 1976). Mortality history in Indonesia is not well documented although the Central Bureau of Statistics already started to conduct the Population Census since 1961. It hardly produces the patterns and differentials of mortality by background characteristics of Indonesian. This information finally can only be obtained after the Indonesia Demographic and Health Surveys were conducted since 1987. Since mortality level in Indonesia is still high the differentials on mortality by background characteristics still exist. This argument is confirmed by the results of the Indonesia Demographic and Health Surveys. These surveys produce infant and child mortality patterns and differentials by socioeconomic and bio-demographic characteristics of children. By province, infant and child mortality was lowest in DI Yogyakarta and highest in West Nusa Tenggara. The IMR was 23 infant deaths per 1000 live births while it was 111 in West Nusa Tenggara. The U5MR was 30 under-five deaths per 1000 under-five population while it was 150 in West Nusa Tenggara. D.I. Yogyakarta is well known as student-city. This fact might cause lower infant and child mortality in this province. On the other hand, infant and child mortality has been consistently highest in West Nusa Tenggara that might be caused by unhealthy cultural practice in caring babies and children. In this province, newly born babies are usually given banana that has been

COMPARATIVE STUDY ON THE EFFECTS OF SOCIO-ECONOMIC FACTORS …
7
chewed by the mothers. Besides, the decision where to deliver a baby is usually on the community leaders. Although, pregnant women go to health personnel for antenatal care, most of their births are helped by untrained traditional birth attendance. Infant and child mortality is lowest among higher-educated women and highest among women who had no education. The U5MR was 35 under-five deaths per 1000 under-five population among women who had some secondary or higher education. It was more than three times, 108, among women who had no education. Maternal health facilities are not yet universally and uniformly available for all women in Indonesia. This fact might also contribute to the differentials in infant and child mortality. Women who had no antenatal or delivery care for their births had higher infant deaths than women who had both cares. The IMR was 96 infant deaths per 1000 live births for the former and only 40 for the later. Since the past Japanese women consistently have lower mortality than Japanese men. A study by Janetta (1992) cited that during the famine in pre-industrial Japan there were more men who died than women. It indicates that women withstand semi-starvation better than men. She also cited that research on biology of human starvation affirms that men and women respond differently to a decrease in the food supply because women have larger stores of body fat that is used as body fuel. In Indonesia, Java and Bali region is much more developed and industrialized than other regions. Health facilities are more available in this region. As a result, infant and child mortality was lower in the Java-Bali region than in the Outer Java-Bali regions. The IMR was 47 infant deaths in the provinces in Java-Bali region (DKI Jakarta, West Java, Central Java, DI Yogyakarta, and East Java). It was 58 in the provinces in the Outer Java-Bali I region (DI Aceh, North, West, and South Sumatra, Lampung, West Nusa Tenggara, West and South Kalimantan, and North and South Sulawesi). It was 61 in the provinces in the Outer Java-Bali II region (Riau, Jambi, Bengkulu, East Nusa Tenggara, East Timor, Central and East Kalimantan, Central and South East Sulawesi, Maluku, and Irian Jaya). A study by Mosk and Johansson (1986) showed that in Japan before the World War mortality rates were higher in more industrialized prefectures. It was caused these prefectures had worse environment than less industrialized prefectures. Investments on public health technology after the World War enjoyed most by more industrialized, hence higher income, prefectures that resulted in lower mortality levels in these prefectures. The 1997 Indonesia DHS results show that there is a significant different in infant and child mortality between urban and rural areas. The IMR was 36 infant deaths per 1000 live births in urban areas while it was 58 in rural areas. The CMR was 12 child deaths per 1000 children in urban areas while it was 22 in rural areas. The U5MR was 48 under-five deaths per 1000 under-five population in urban areas while it was 79 in rural areas.

O.B. SAMOSIR
8
Mosk and Johansson (1986) reported that prior to economic development in Japan mortality rates were consistently higher in urban areas than in rural areas, as it was the case in the West. It caused by the fact that high-income urban areas were more populous. This could cause in frequent contact to all manners of airborne pathogens, while crowding facilitated the spread of water- and filth-borne pathogens. In addition, urban areas continually attracted migrants who came more often bearing a fresh supply of mew pathogens. However, after Japan conducted efficient public health technology that controlled environmental-caused diseases, mortality rates were lower in urban areas than in rural areas. The ongoing concentration of Japan’s population in the urban sector acted as an accelerator of continued mortality decline. When mortality levels are high it is important to examine the factors cause it especially among children. This is the case of Indonesia. Since mortality level in Indonesia is still quite high therefore the study on factors influencing mortality among children is still important. However, to date, there is only one study already conducted for that purpose. Most studies examined the patterns and differentials of mortality. Dadi (2000) investigated the effect of environmental sanitation on child mortality controlled for bio-demographic factors. He used main water source of household, type of toilet facility, and the distance between water source and septic tank as environmental sanitation factors. He found that main water source of household and type of toilet facility had statistically significant effect on post neonatal (1-11 months), infant (0-11 months), child (1-4 years), and under-five (0-4 years) mortality. The relationships were consistent even after controlling for bio-demographic factors (the age of mother at birth, birth order, birth interval, and sex of child). Since mortality levels are already low in Japan, more intensive studies on factors affecting mortality such as for specific age or cause of death have been conducted. Mosk and Johansson (1986) found a reverse J-shaped relationship between the price-adjusted real income and the age-specific death rate for males in Japan in 1908-1960. When public health technology minimal income and mortality were strongly and positively related. When it was inefficient they were weakly and positively related. When it was more efficient they were strongly and negatively related. When it was very efficient they were weakly and negatively related. Using twelve socioeconomic factors, Motohashi (1991) investigated secular trends in suicide in Japan for the periods 1953-72 and 1973-86. From the study it was found that the rates of suicide for both males and females in 1953-72 were closely related to unemployment rate and the labor force but between 1973 and 1986, divorce rate and the proportion in tertiary industry were most influential. It was concluded that the changes of the factors reflect the socioeconomic changes in industrial structure in Japan in transition from an industrial to a service economy. Goldman, Takahashi, and Hu (1995) examined the factors affecting mortality among Japanese singles using the 1975-90 period data. They found that marriage type

COMPARATIVE STUDY ON THE EFFECTS OF SOCIO-ECONOMIC FACTORS …
9
statistically and significantly influenced mortality. Mortality was higher in the prefectures were arranged marriages were higher. In addition, they found a large and significant effect of urbanization: mortality of singles was higher in higher proportion of rural population prefectures. There has been a shift of the leading causes of death in Indonesia from communicable, maternal, perinatal, and natural conditions to non-communicable disease. The results of the Household Health Surveys in Indonesia show that in 1980 two infectious diseases, diarrhea and upper respiratory infections, caused 18.8 and 17.8 per cent of deaths respectively. A generative disease, cerebra-vascular, only contributed 9.9 per cent of deaths. In 1992 the share of infectious diseases declined (9.5 per cent for upper respiratory infections and 8.0 per cent for diarrhea) and was replaced by cerebra-vascular disease (16.5 per cent). However, the contribution of tuberculosis increased from 6.0 per cent in 1971 to 11.4 per cent in 1992. In 1995 more than one-fourth of deaths caused by infectious and parasitic diseases. By age, in 1992 the leading cause of deaths among infant was upper respiratory infections. These diseases caused more than one-third of infant deaths. Among children aged 1-4 years, the leading cause of deaths was diarrheic (22.6 per cent) and respiratory infections (17.2 per cent). Diarrheic and malaria were the main causes of death among population aged 5-14 (16 per cent respectively). Among population aged 15-64 and 65 or over the leading cause of deaths were cerebra-vascular (16.4 and 29.5 per cent respectively) and tuberculosis (16.1 and 14.6 per cent respectively). The results above show that the health system of Indonesia is facing a double burden. It has to alleviate various risk factors attributed to the development of non-communicable diseases such as smoking, increased motor vehicle use, sedentarism, and unhealthy life style. In addition, there are a growing number of old but new-fashioned infectious diseases. In 1837 both measles and smallpox were mentioned as causes of death and caused high mortality primarily among the young aged 0-9 years in Japan (Jannetta 1992). At the beginning of the twentieth century and after the World War ended, infectious and parasitic diseases such as tuberculosis and diarrheic were widespread in Japan. Tuberculosis, dysentery, enteritis, and pneumonia were common causes of deaths on children and youth (Kono and Takahashi 1989). In addition, many young people who were in need of protein experienced malnutrition. It is believed that protein is important in forming blood vessel structure. Lack of animal protein and malnutrition are believed have important role in the weakening blood vessel system that are vulnerable to cerebral hemorrhage. Between 1950 and 1960 the rapid increase in life expectancy at birth among Japanese males were largely contributed by the decline in mortality caused by infectious diseases such as gastro-enteritis, tuberculosis, pneumonia and bronchitis. Between 1970 and 1980, it was largely caused by the decline in mortality caused by cerebra-vascular disease.

O.B. SAMOSIR
10
Based on the discussion above therefore the analytical framework of the comparative study of the effects of socioeconomic factors, industrialization, and urbanization on mortality in Indonesia and Japan is as follows:
Figure 2.1. The Analytical Framework of the Comparative Study on the Effects of Socioeconomic Factors, Industrialization, and Urbanization on Mortality in Indonesia and
Japan.
With this analytical framework, it is assumed that both in Indonesia and Japan socioeconomic factors, urbanization and industrialization affect mortality even after taking into account the correlation between the measures of mortality: the Age-Specific Death Rate and the Cause-Specific Death Rate. Based on the analytical framework above the hypothesis of the study are: 1. Socioeconomic factors, urbanization, and industrialization affect mortality in
Indonesia and Japan. 2. The relationships between socioeconomic factors, urbanization, and industrialization
and mortality in Indonesia and Japan persist even after taking into account the relationship between the measures of mortality: the age-specific death rate and cause-specific death rate.
3. Methodology In the study the unit of analysis is province for Indonesia and prefecture for Japan. Since the time of observation of the study for Indonesia is until 1998 where the East Timor was still part of Indonesia, therefore there are 27 provinces in the study for Indonesia. In the study for Japan there are 47 prefectures. The dependent variables in the analysis are the Age-Specific Death Rate (ASDR) and the Cause-Specific Death Rate (CSDR). In the analysis the ASDR is grouped into three age groups, namely 0-4, 5-59, and 60 or above. The grouping is based on the reason that mortality risks are different among the age groups. For Indonesia the ASDR0-4, ASDR5-59, and ASDR60+ by province are obtained from the 1996 and 1998 National Socioeconomic Survey (Susenas). For Japan the ASDR0-4, ASDR5-59, and ASDR60+ by
Socioeconomic
Industrialization
Urbanization
Age-Specific Death Rate
Cause-Specific Death Rate

COMPARATIVE STUDY ON THE EFFECTS OF SOCIO-ECONOMIC FACTORS …
11
prefecture are obtained from the Vital Statistics of Japan in 1997 and 1998, published by the Ministry of Health and Welfare. There will be three CSDR in each model: CSDR1 for communicable diseases, CSDR2 for non-communicable diseases, and CSDR3 for injury and other causes. For Indonesia the CSDR1, CSDR2, and CSDR3 are obtained from the 1995 Household Health Survey (Survei Kesehatan Rumah Tangga (SKRT)). For Japan the CSDR1, CSDR2, and CSDR3 are obtained from the Vital Statistics of Japan in 1997 and 1998. The 1995 SKRT was conducted using the core sample of the 1995 National Socioeconomic Survey. Medical doctors were trained to conduct a verbal autopsy approach to get information about the deceased from their families. There were 204,00 households in the sample and 3,400 deaths were recorded for one year preceding the survey. It is argued that this small case of deaths was underreporting. Therefore, breaking down this number should be done cautiously. The independent variables used for Indonesia are: 1. The percentage of young persons aged 14 and below (X1) 2. The average number of household member (X2) 3. The proportion of farmers, fishermen and forest workers (X3) 4. The percentage of urban workers (X4) 5. The percentage of population entering courses of higher education (X5) 6. The average number of hospital and clinics per regency or municipality (X6) 7. The percentage of poor people (X7) 8. The employment rate (X8) 9. The percentage of population aged 60 or above (X9) 10. The natural growth rate in population (X10) 11. The Net Migration Rate (X11) 12. The In-Migration Rate (X12) For Japan the independent variables are: 1. The percentage of young persons aged 14 and below (X1) 2. The average number of household member (X2) 3. The proportion of farmers, fishermen and forest workers (X3) 4. The percentage of commuters (X4) 5. The percentage of population entering courses of higher education (X5) 6. The number of hospital and clinics per prefecture (X6) 7. The number of households assisted by livelihood protection per 1,000 household
(monthly average, X7) 8. The employment rate (X8) 9. The percentage of population aged 60 or above (X9) 10. The natural growth rate in population (X10) 11. The Net Migration Rate (X11) For Japan, the percentage of commuters is used to indicate the percentage of population working away for home. This is the number of commuting workers per 100

O.B. SAMOSIR
12
workers. This information is not available for Indonesia. So in order to measure this factor the percentage of urban workers is used for Indonesia. This is the number of urban workers per 100 workers. The percentage of population entering courses or higher education is the number of population aged 10 or above that had senior high school education or higher per 100- population aged 10 or above. For Indonesia the average number of hospital and clinics is calculated per regency or municipality. This is the average number of hospital and clinics, including family planning posts, and integrated service posts, per regency or municipality. For Japan, it is the number of hospitals and clinics in each prefecture. The indicator of low income in Indonesia is the percentage of poor people. It is the number of people that consumed 2,100 calories everyday per 100 population. For Japan the number of households assisted by livelihood protection per 1,000 household (monthly average) is used. Many kinds of regression estimation only use one dependent variable and more than one independent variable (univariate analysis). In reality, in many cases, several of dependent variables depend on the same independent variables while they are correlated. This is because of several dependent variables are amassed simultaneously with a given independent set (Timm, 1975). For this purpose, multivariate linear regression analysis is more suitable to be used. In this study dependent variables (Y) are the ASDR and CSDR. For Indonesia the ASDR is divided for population aged 0-14 (ASDR1_96), 15-59 (ASDR2_96), and 60 or above (ASDR3_96). For Japan, the ASDR is for population aged 0-14 (ASDR1_97), 15-64 (ASDR2_97), and 65 years or above (ASDR3_97). The CSDR is also grouped into three in both countries, namely communicable diseases (CD), non-communicable diseases (NCD), and injuries and other causes of deaths (INJURY). It is assumed that independent variables happen before or at the same time as the dependent variables. For Indonesia the model used is:
Y = X B + Eo (27 x 6) (27 x 4) (4 x 6) (27 x 6) For Japan the model used is:
Y = X B + Eo (47 x 6) (47 x 4) (4 x 6) (47 x 6) Both models above assume that socioeconomic factors, industrialization, and urbanization affect the Age-Specific and Cause-Specific Death Rate after taking into account the correlation between the Age-Specific and Cause-Specific Death Rate.

COMPARATIVE STUDY ON THE EFFECTS OF SOCIO-ECONOMIC FACTORS …
13
4. Characteristics of Socioeconomic Factors, Industrialization, Urbanization, and Mortality in Indonesia and Japan
Socioeconomic factors used are rural residence factors, low-income factor, and the proportion of young population. In Indonesia the percentage of young person aged 14 or below varied from 25.7 in DI Yogyakarta to 43.5 in East Timor in 1995. In Japan the figure in 1995 was much lower, ranged from 12.7 in Tokyo to 22.1 in Okinawa. In Indonesia the average number of household member varied from 3.61 in DI Yogyakarta to 5.10 in Maluku in 1995. In Japan the figure in 1995 ranged from 2.34 in Tokyo to 3.45 in Yamagata. In Indonesia the proportion of farmers, fishermen, and forest workers ranged from 0.83 in DKI Jakarta to 74.60 in Irian Jaya in 1995. As an industrialized country, the figure in 1995 was much lower in Japan, ranged from 0.46 in Tokyo to 19.56 in Iwate. The urbanization factors include the percentage of population working away from home, the percentage of population entering courses or higher education, and the number of hospital and clinics per residential area. The percentage of population working away from home used for Indonesia is the percentage of urban workers. For Japan the percentage of commuters is used. The percentage of urban workers in Indonesia in 1995 varied from 7.77 in East Timor to 100.00 in DKI Jakarta. In Japan the percentage of commuters in 1995 ranged from 14.75 in Aomori to 56.35 in Kanagawa. The percentage of population entering courses of higher education in Indonesia ranged from 10.47 in East Nusa Tenggara to 64.03 in DKI Jakarta in 1995. In Japan the figure in 1990 varied from 44.15 in Iwate to 63.73 in Tokyo. The third urbanization factor is the average number of hospital and clinics per residential area. For Indonesia the residential area is regency or municipality and for Japan it is prefecture. In Indonesia this figure varied from 2.77 in East Timor to 93.20 in DKI Jakarta in 1993. In Japan the figure in 1995 ranged from 569 in Tottori to 11,976 in Tokyo. The factor of low income is the expenses of family income supplement per population. However, since the data is not available therefore the percentage of poor people in 1993 was used for Indonesia and the number of persons assisted by livelihood protection per 1,000 persons (monthly average) in 1995 was used for Japan. The figure for Indonesia varied from 2.47 in DKI Jakarta to 31.47 in East Timor. For Japan, the figure ranged from 1.98 in Toyama to 16.39 in Fukuoka. The industrialization factors consist of the employment rate, the percentage of population aged 60 or above, and the migration rate. The employment rate for Indonesia in 1995 varied from 88.08 in DKI Jakarta to 97.43 in East Nusa Tenggara. For Japan the figure in 1995 ranged from 89.74 in Okinawa to 97.60 in Shimane. The second industrialization factor is the percentage of population aged 60 or above. The figure for Indonesia in 1995 varied from 1.65 in Irian Jaya to 12.58 in DKI Jakarta. For Japan the figure in 1995 was higher, ranged from 15.14 in Saitama to 28.92 in Shimane. Another low-income factor is the natural growth rate in population. This figure in Indonesia in the 1990-1995 period varied from –1.21 in DI Yogyakarta to 16.90 in East Kalimantan. In Japan the figure in 1995 ranged from –1.80 in Akita to 7.20 in Okinawa.
O.B. SAMOSIR
14
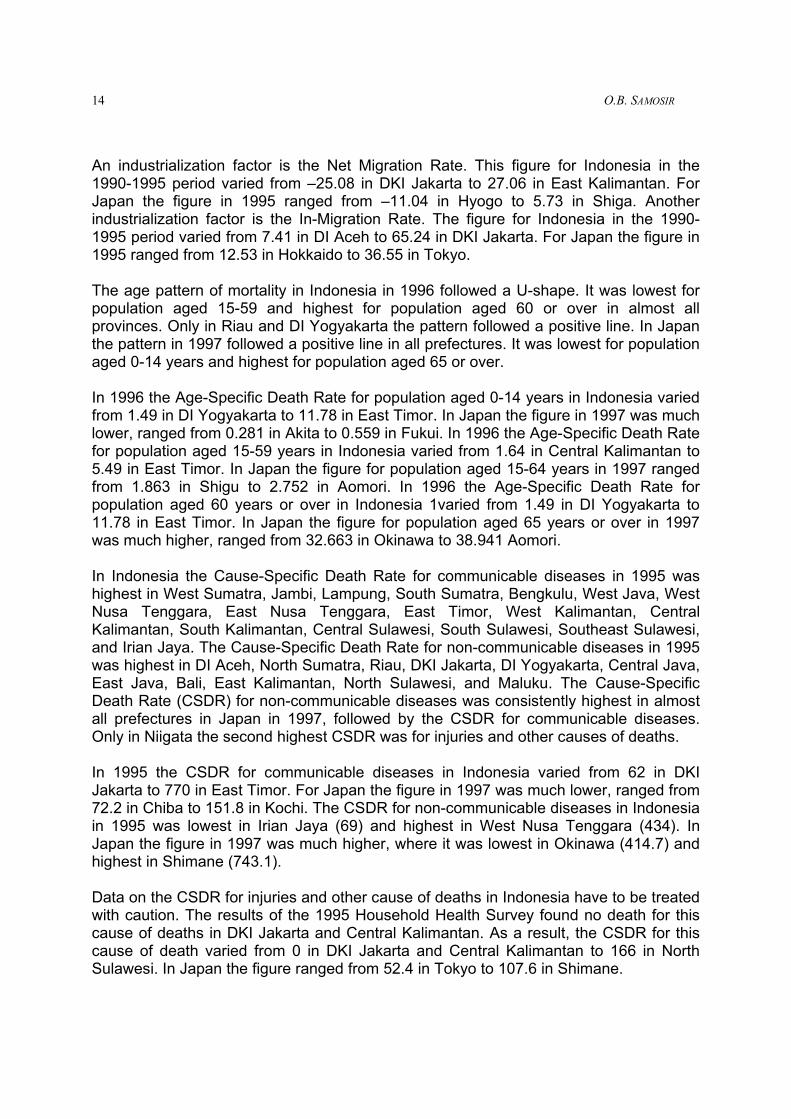
An industrialization factor is the Net Migration Rate. This figure for Indonesia in the 1990-1995 period varied from –25.08 in DKI Jakarta to 27.06 in East Kalimantan. For Japan the figure in 1995 ranged from –11.04 in Hyogo to 5.73 in Shiga. Another industrialization factor is the In-Migration Rate. The figure for Indonesia in the 1990-1995 period varied from 7.41 in DI Aceh to 65.24 in DKI Jakarta. For Japan the figure in 1995 ranged from 12.53 in Hokkaido to 36.55 in Tokyo. The age pattern of mortality in Indonesia in 1996 followed a U-shape. It was lowest for population aged 15-59 and highest for population aged 60 or over in almost all provinces. Only in Riau and DI Yogyakarta the pattern followed a positive line. In Japan the pattern in 1997 followed a positive line in all prefectures. It was lowest for population aged 0-14 years and highest for population aged 65 or over. In 1996 the Age-Specific Death Rate for population aged 0-14 years in Indonesia varied from 1.49 in DI Yogyakarta to 11.78 in East Timor. In Japan the figure in 1997 was much lower, ranged from 0.281 in Akita to 0.559 in Fukui. In 1996 the Age-Specific Death Rate for population aged 15-59 years in Indonesia varied from 1.64 in Central Kalimantan to 5.49 in East Timor. In Japan the figure for population aged 15-64 years in 1997 ranged from 1.863 in Shigu to 2.752 in Aomori. In 1996 the Age-Specific Death Rate for population aged 60 years or over in Indonesia 1varied from 1.49 in DI Yogyakarta to 11.78 in East Timor. In Japan the figure for population aged 65 years or over in 1997 was much higher, ranged from 32.663 in Okinawa to 38.941 Aomori. In Indonesia the Cause-Specific Death Rate for communicable diseases in 1995 was highest in West Sumatra, Jambi, Lampung, South Sumatra, Bengkulu, West Java, West Nusa Tenggara, East Nusa Tenggara, East Timor, West Kalimantan, Central Kalimantan, South Kalimantan, Central Sulawesi, South Sulawesi, Southeast Sulawesi, and Irian Jaya. The Cause-Specific Death Rate for non-communicable diseases in 1995 was highest in DI Aceh, North Sumatra, Riau, DKI Jakarta, DI Yogyakarta, Central Java, East Java, Bali, East Kalimantan, North Sulawesi, and Maluku. The Cause-Specific Death Rate (CSDR) for non-communicable diseases was consistently highest in almost all prefectures in Japan in 1997, followed by the CSDR for communicable diseases. Only in Niigata the second highest CSDR was for injuries and other causes of deaths. In 1995 the CSDR for communicable diseases in Indonesia varied from 62 in DKI Jakarta to 770 in East Timor. For Japan the figure in 1997 was much lower, ranged from 72.2 in Chiba to 151.8 in Kochi. The CSDR for non-communicable diseases in Indonesia in 1995 was lowest in Irian Jaya (69) and highest in West Nusa Tenggara (434). In Japan the figure in 1997 was much higher, where it was lowest in Okinawa (414.7) and highest in Shimane (743.1). Data on the CSDR for injuries and other cause of deaths in Indonesia have to be treated with caution. The results of the 1995 Household Health Survey found no death for this cause of deaths in DKI Jakarta and Central Kalimantan. As a result, the CSDR for this cause of death varied from 0 in DKI Jakarta and Central Kalimantan to 166 in North Sulawesi. In Japan the figure ranged from 52.4 in Tokyo to 107.6 in Shimane.

COMPARATIVE STUDY ON THE EFFECTS OF SOCIO-ECONOMIC FACTORS …
15
Results of factor analysis The first factor analysis was to form rural residence factor (F123). This factor is a composite variable from the percentage of young person aged 14 or below (X1_95), the average number of household member (X2_95), and the proportion of farmers, fishermen, and forest workers (X3_95). The results of factor analysis for F123 for Indonesia give the KMO statistics as much as 0.616 that is enough and Bartlett test of sphericity as much as 41.337 that is significant at 5 percent level. The eigenvalue for this factor is 2.356 and the factor explains 78.535 percent variation in X1_95, X2_95, and X3_95. The factor is as follows: F123 = 0.403 ZX1_95 + 0.359 ZX2_95 + 0.364 ZX3_95 ZX1_95 is the standardized X1_95 (X1_95 is subtracted by its means and then divided by its standard deviation. ZX2_95 is the standardized X2_95. ZX3_95 is the standardized X3_95. The results of factor analysis for F123 for Japan give the KMO statistics as much as 0.655 that is enough and Bartlett test of sphericity as much as 17.786 that is significant at 5 percent level. The eigenvalue for this factor is 1.769 and the factor explains 58.972 percent variation in X1_95, X2_95, and X3_95. The factor is as follows: F123 = 0.436 ZX1_95 + 0.443 ZX2_95 + 0.423 ZX3_95 The second factor analysis was to form low-income factor (FLI). This factor is a composite variable from rural residence factor (F123), the percentage of poor people (X7_93), and the natural growth rate in population (X10_90). The results of factor analysis for FLI for Indonesia give the KMO statistics as much as 0.389 that is bad but give Bartlett test of sphericity as much as 28.582 that is significant at 5 percent level. The eigenvalue for this factor is 1.918 and the factor explains 63.922 percent variation in F123, X7_93, and X10_90. The factor is as follows: FLI = 0.497 F123 + 0.347 ZX7_93 + 0.393 ZX10_90 The results of factor analysis for FLI for Japan give the KMO statistics as much as 0.500 that is enough but give Bartlett test of sphericity as much as 4.026 that is significant at 5 percent level. The eigenvalue for this factor is 1.294 and the factor explains 64.706 percent variation in F123 and X7_95. The factor is as follows: FLI = 0.622 F123 - 0.622 ZX7_95 The third factor analysis was to form industrialization factor (FIND). This factor is a composite variable from the employment rate (X8_95), the percentage of population aged 60 or above (X9_93), and the in-migration rate (X12_95).

O.B. SAMOSIR
16
The results of factor analysis for FIND for Indonesia give the KMO statistics as much as 0.513 that is enough but give Bartlett test of sphericity as much as 1.575 that is not significant at 5 percent level. The eigenvalue for this factor is 1.266 and the factor explains 42.204 percent variation in X8_95, X9_95, and X12_95. The factor is as follows: FIND = 0.609 ZX8_95 + 0.290 ZX9_95 - 0.579 ZX12_95 The results of factor analysis for FIND for Japan give the KMO statistics as much as 0.558 that is enough and give Bartlett test of sphericity as much as 24.985 that is significant at 5 percent level. The eigenvalue for this factor is 1.812 and the factor explains 60.405 percent variation in X8_95, X9_95, and X12_95. The factor is as follows: FIND = 0.378 ZX8_95 + 0.485 ZX9_95 - 0.417 ZX12_95 The fourth factor analysis was to form urbanization factor (FUR). This factor is a composite variable from the percentage of population working away from home (X4_95), the percentage of population entering courses or higher education (X5_95), and the number of hospital and clinics per residential area (X6_95). The results of factor analysis for FUR for Indonesia give the KMO statistics as much as 0.746 that is good and give Bartlett test of sphericity as much as 71.738 that is significant at 5 percent level. The eigenvalue for this factor is 2.700 and the factor explains 89.985 percent variation in X4_95, X5_95, and X6_95. The factor is as follows: FUR = 0.358 ZX4_95 + 0.353 ZX5_95 + 0.343 ZX6_95 The results of factor analysis for FUR for Japan give the KMO statistics as much as 0.724 that is good and give Bartlett test of sphericity as much as 64.975 that is significant at 5 percent level. The eigenvalue for this factor is 2.361 and the factor explains 78.716 percent variation in X4_95, X5_90, and X6_95. The factor is as follows: FUR = 0.379 ZX4_95 + 0.385 ZX5_90 + 0.363 ZX6_95 5.1. Correlation between the Age-Specific and Cause-Specific Death Rate Results of correlation analysis for Indonesia show that the ASDR for population aged 0-14 is significantly and positively correlated with the ASDR for population aged 15-59 and the CSDR for communicable diseases but negatively correlated with the CSDR for non-communicable diseases. The ASDR for population aged 15-59 is significantly and positively correlated with the ASDR for population aged 60 or over and with the CSDR for communicable diseases. The CSDR for communicable diseases is significantly and negatively correlated with the CSDR for non-communicable diseases. The correlation matrix is:

COMPARATIVE STUDY ON THE EFFECTS OF SOCIO-ECONOMIC FACTORS …
17
ASDR1_96 ASDR2_96 ASDR3_96 CD NCD INJURY ASDR1_96 1.00 0.748** 0.244 0.755**-0.445* -0.005 ASDR2_96 1.000 0.531** 0.695**-0.265 0.302 ASDR3_96 1.000 0.277 -0.058 0.355 CD 1.000 -0.424* -0.131 NCD 1.000 0.008 INJURY 1.000 Correlation coefficients with * sign are significant at α = 5 per cent and with ** sign are significant at α = 1 per cent. Results of correlation analysis for Japan show that the ASDR for population aged 0-14 is significantly and positively correlated with the ASDR for population aged 65 or over, the CSDR for communicable diseases, the CSDR for non-communicable diseases, and the CSDR for injury and other cause of deaths. The ASDR for population aged 65 or over is significantly and positively correlated with the ASDR for population aged 60 or over and with the CSDR for communicable diseases, with the CSDR for non-communicable diseases, and with the CSDR for ASDR1_97 ASDR2_97 ASDR3_97 CD NCD INJURY ASDR1_97 1.000 0.056 0.245 0.272 -0.024 0.021 ASDR2_97 1.000 0.581** 0.590** 0.676** 0.494** ASDR3_97 1.000 0.698** 0.669** 0.506** CD 1.000 0.799** 0.559** NCD 1.000 0.811** INJURY 1.000 Correlation coefficients with * sign are significant at α = 5 per cent and with ** sign are significant at α = 10 per cent. 5.2. Factors Influencing Mortality in Indonesia and Japan The factor analysis for Indonesia did not give a satisfactory result in forming the industrialization factor. In addition, the multivariate regression analysis results show that this factor statistically is not significant on all dependent variables even at α = 25%. Therefore this variable is dropped from the model.

O.B. SAMOSIR
18
For Indonesia the estimates of B is (ASDR1_96) (ASDR2_96) (ASDR3_96) (CD) (NCD) (INJURY) 6.24 3.39 29.68 354.67 292.89 68.11 = 1.32* 0.11 -0.95 77.76* -81.04* –20.21* (FLI) -0.34 -0.36** -3.72 -56.32** 13.63 –20.51* (FUR) Estimates with * sign are significant at α = 5 per cent and with ** sign are significant at α = 10 per cent. For Japan the estimates of B is (ASDR1_97) (ASDR2_97) (ASDR3_97) (CD) (NCD) (INJURY) 0.410 2.32 87.98 110.68 603.74 81.82 = -0.003 -0.12* -1.48* -10.13* -27.62* 1.17 (FLI) -0.030* -0.13* -2.58* -11.62* -21.67* -3.71** (FUR) -0.030* 0.03 0.26 7.35* 65.97* 9.04* (FIND) Estimates with * sign are significant at α = 5 per cent and with ** sign are significant at α = 10 per cent. The effects of low-income factor The results above show that each independent factor influences mortality differently in each country. Low-income factor positively and significantly affects the ASDR for aged 0-14 in Indonesia. It means the higher the low-income factor, the higher the ASDR for aged 0-14. However, this factor has negative impact on the ASDR for aged 0-14 in Japan although it is insignificant. Low-income factor has positive but insignificant effect on the ASDR for aged 15-59 in Indonesia. In Japan it also has negative but significant effect on the ASDR for aged 15-64. It means that in the prefectures where low-income factor is higher, the ASDR for aged 15-64 is lower. In Indonesia low-income factor has negative but insignificant effect on the ASDR for aged 60 or over. It also has negative but significant impact on the ASDR for aged 65 or over in Japan. It means that the higher the low-income factor the lower the ASDR for aged 65 or over. Low-income factor is positively and significantly associated with the CSDR for communicable diseases in Indonesia. It is reasonable for a developing country like Indonesia that is still struggling to cope with these diseases. In Japan this factor is

COMPARATIVE STUDY ON THE EFFECTS OF SOCIO-ECONOMIC FACTORS …
19
negatively and significantly associated with the CSDR for communicable diseases. It is also reasonable for a developed country like Japan that is already successful in handling communicable diseases. In Indonesia low-income factor is negatively and significantly associated with the CSDR for non-communicable diseases. It is as expected since these diseases is usually common in more advantaged areas. It also happens in Japan. The CSDR for injury and other cause of deaths is negatively and significantly influenced by low-income factor in Indonesia. It means the higher low-income factor the lower the CSDR for injury and other cause of deaths. In Japan this factor has positive but insignificant effect. The effects of urbanization factor Urbanization factor has negative but insignificant impact on the ASDR for aged 0-14 in Indonesia. Perhaps this factor is not yet able to differentiate mortality between more urbanized and less urbanized areas for population aged 0-14 in Indonesia. However, this factor also has negative but significant impact on the ASDR for aged 0-14 in Japan. It means the higher the urbanization factor, the lower the ASDR for aged 0-14. It can be accepted since more urbanized areas usually have more health facilities and hence lower mortality. Urbanization factor has negative and significant effect on the ASDR for aged 15-59 in Indonesia. In Japan it also has negative and significant effect on the ASDR for aged 15-64. It means that in the areas where urbanization factor is higher, the ASDR for aged 15-64 is lower. In Indonesia urbanization factor has negative but insignificant effect on the ASDR for aged 60 or over. It also has negative but significant impact on the ASDR for aged 65 or over in Japan. It means that the higher the urbanization factor the lower the ASDR for aged 65 or over. Urbanization factor is negatively and significantly associated with the CSDR for communicable diseases in Indonesia. In Japan this factor is also negatively and significantly associated with the CSDR for communicable diseases. It is sensible since in more urbanized areas health facilities are usually more available and people are more educated and therefore mortality is lower. In Indonesia urbanization factor is positively but insignificantly associated with the CSDR for non-communicable diseases. It may be caused by the fact that in more urbanized areas in Indonesia people are more exposed to fast but less-nutritious food and therefore has higher risk of degenerative diseases. In Japan urbanization factor has negative and significant effect. It means the more urbanized a prefecture, the lower the CSDR for communicable diseases. Perhaps in more urbanized prefectures Japanese are more careful in their eating habits as well as in taking care of their health.

O.B. SAMOSIR
20
The CSDR for injury and other cause of deaths is negatively and significantly influenced by urbanization factor in Indonesia. It means the higher urbanization factor the lower the CSDR for injury and other cause of deaths. In Japan this factor also has negative and significant effect. The effects of industrialization factor Industrialization factor has no significant effect on mortality in Indonesia. Perhaps it is caused by the fact that actually Indonesia is not industrialized yet. Industrialization factor negatively and significantly affects the ASDR for aged 0-14 in Japan. It means the higher the low-income factor, the lower the ASDR for aged 0-14. It is true in Japan since modernization and industrialization in this country is accepted to contribute to the decline of young population in the country. Industrialization factor has positive but insignificant effect on the ASDR for aged 15-64 in Japan. It means that in the prefectures where industrialization factor is higher, the ASDR for aged 15-64 is also higher. This fact might be caused by the fact that industrialization has bad effects on environment in Japan and hence has increased mortality among population in this age group. In Japan industrialization factor has positive but insignificant effect on the ASDR for aged 65 or over. It means that the higher the industrialization factor the higher the ASDR for aged 65 or over. Perhaps environmental deterioration caused by the industrialization also has caused the increase in mortality among the old in Japan. Industrialization factor is positively and significantly associated with the CSDR for all causes of death in Japan. This fact might also be caused by environmental deterioration caused by the industrialization that in turn has caused the increase of deaths for all causes. It is also the case in England in the 1800s where industrialization caused higher mortality that was attributed to environmental deterioration caused by the industrialization (Mosk and Johansson 1986). In addition, hard-work culture among industrialized Japanese might also contribute to this phenomenon. In summary, low-income factor has different impact on the ASDR for aged 0-14 and 15-59 and for the CSDR for communicable diseases in Indonesia and Japan. Urbanization factor has different effect only on the CSDR for non-communicable diseases in the two countries. The different marked the different both in economy and development between both countries. 6. Conclusions and Policy Recommendations 6.1. Conclusions Comparative study on the effects of socioeconomic factor, industrialization, and urbanization on mortality in Indonesia and Japan conclude that:

COMPARATIVE STUDY ON THE EFFECTS OF SOCIO-ECONOMIC FACTORS …
21
a. Low-income factor has positive effect on the ASDR for aged 0-14 and 15-64 and negative effect on the ASDR for aged 15-59 in Indonesia. In Japan it has negative effect on all ASDR.
b. Low-income factor has negative effect on all CSDR in Indonesia and Japan. c. Urbanization has negative effect on mortality except on the CSDR for non-
communicable diseases in Indonesia. In Japan it has negative effect on mortality. d. Industrialization has no significant effect on mortality in Indonesia. In Japan it has
positive effect on mortality except on the ASDR for aged 0-14. e. Low-income factor is the strongest factor that affects mortality in Indonesia. f. Urbanization factor is the strongest factor that affects mortality in Japan. g. In Indonesia provinces with higher low-income factor has highest risk of mortality. h. In Japan prefectures with higher industrialization has highest risk of mortality. i. In Indonesia provinces with lower urbanization factor has lowest risk of mortality. j. In Japan prefectures with lower industrialization has lowest risk of mortality. k. Low-income factor has different impact on the ASDR for aged 0-14 and 15-59 and
for the CSDR for communicable diseases in Indonesia and Japan. Urbanization factor has different effect only on the CSDR for non-communicable diseases in the two countries. The two factors have same effect on other mortality measures in both countries.
6.2. Policy Recommendations Indonesia is facing double burden in its health system. In one case deaths caused by infectious diseases are still high and in another case deaths caused by degenerative diseases are increasing. Urbanization caused higher mortality due to non-communicable diseases that might be due to increasing unhealthy eating habits (such as consumption of fast and less nutritious food), declining age of first smoking, and less sport. This phenomenon should prompt the government to continuously promote healthy and nutritious food as well as healthy lives. It is hoped urbanization that increases the quality of lives in term of education can bring down mortality. Low-income factor caused higher deaths among population aged 0-59 and deaths caused by communicable diseases as well as maternal, perinatal, and nutritional condition. The Government should also handle this in order to increase the health status of Indonesian. In case of Japan continuous effort in handling environmental deterioration caused by the industrialization should be carried out since it causes higher mortality.

O.B. SAMOSIR
22
References Central Bureau of Statistics, State Ministry of Population/National Family Planning
Coordinating Board, Ministry of Health, and Demographic and Health Surveys (1995) The 1994 Indonesia Demographic and Health Survey. Macro International Inc.
Central Bureau of Statistics (1997) Estimasi Fertilitas dan Mortalitas berdasarkan Survei
Penduduk Antar Sensus 1995 (Fertility and Mortality Estimation based on the 1995 Intercensal Survey).
Central Bureau of Statistics, State Ministry of Population/National Family Planning
Coordinating Board, Ministry of Health, and Demographic and Health Surveys (1998) The 1997 Indonesia Demographic and Health Survey. Macro International Inc.
Central Bureau of Statistics (2000) Preliminary Results of the 2000 Population Census. Dadi. (2000) ‘Faktor-faktor yang Mempengaruhi Kematian Anak di Indonesia: Analisa
Data SDKI 1997 (Factors Affecting Child Mortality: Data Analysis of the 1997 Indonesia Demographic and Health Survey)’. Unpublished MSc Thesis at the Study Program on Population and Manpower. Postgraduate Program of the University of Indonesia.
Demographic Institute (1999) Population Projection of Indonesia in 1995-2025 Scenario:
“Normal” and “Crisis”. Faculty of Economics, University of Indonesia, Depok, West Java.
Goldman, N. Shigesato Takahashi & Yuanreng Hu (1995) ‘Mortality among Japanese
Singles: A Re-investigation’. Population Studies, 49. Jannetta (1992) ‘Famine Mortality in Nineteenth-Century Japan: The Evidence from a
Temple Death Register’. Population Studies, 46. Kobayashi, Kazumasa (1976) ‘Regional Summary of Demographic Changes and
Socioeconomic Correlates in East Asia—Hongkong, Japan and Taiwan’. Paper presented at Seventh Summer Seminar in Population, East West Population Institute. June 1976. The Center for Southeast Asian Studies. Kyoto University. Hyoto. Japan.
Kono, Shigemi and Shigesato Takahashi (1989) ‘Mortality Trends in Japan: Why has the
Japanese Life Expectancy Kept on Increasing’. Working Paper Series of the Institute of Population Problems Ministry of Health and Welfare No. 1. Tokyo: Institute of Population Problems.
Mosk, Carl and S. Ryan Johansson (1986) ‘Income and Mortality: Evidence from
Modern Japan’. Population and Development Review, 12.

COMPARATIVE STUDY ON THE EFFECTS OF SOCIO-ECONOMIC FACTORS …
23
Population Reference Bureau (1999) World Population Data Sheet: Demographic Data and Estimates for the Countries and Regions of the World. Washington DC.
Population Reference Bureau. 2000. World Population Data Sheet: Demographic Data and Estimates for the Countries and Regions of the World. Washington DC.
Timm, Neil H (1975) Multivariate Analysis with Application in Education and Psychology.
California: Brooks/Cole Publishing Company. Uchida, E., Araki S., and Murata K. (1992) ‘Socioeconomic Factors Affecting the
Longevity of the Japanese Population: A Study for 1980 and 1985’. Journal of Biosocial Science, 4:497-504.
United Nations (1995) Population and Development: Programme of Action adopted at
the International Conference on Population and Development, Cairo, 5-13 September 1994.