Embed Size (px)
Citation preview

1
Comparative Study of the Performance of Trained Primary School Teachers with and Without
In-service Training and Development of a Strategy for Future
Syed Manzoor Hussain ShahRoll No.J-7658827
Submitted in partial fulfillment of the requirement for the Degree of Master of Philosophy in Education,
Educational Planning & Management DepartmentFaculty of Education,
Allama Iqbal Open University, Islamabad May 2003

2
In the Name of
The most Beneficent
The most Merciful’

3
DEDICATION
This dissertation is dedicated to my parents (who are not
alive) who had continuously supported me during my
whole education carrier. They had a vision about my
future higher education since along. This dream would
have not been reality without their precious and loveful
support and contribution.
4
FORWARDING SHEET
The thesis entitled “A Comparative Study of the Performance of Trained Primary
School Teachers with and Without Inservice Training in Hazara Division and
Development of a Strategy for Future”. Has been completed under my guidance and I am satisfied
with the quality of students research work.
Supervisor
Dr. R.A. Farooq
5
APPROVAL SHEET
The thesis entitled “A Comparative Study of the Performance of Trained Primary
School Teachers with and Without Inservice Training in Hazara Division and
Development of a Strategy for Future” is accepted in partial fulfillment of the requirements
for the Degree of Master of Philosophy in Education with (Specialization in Educational
Planning & Management).
sdAdvisor/Supervisor
Dr. R.A. Farooq
External Examiner
sdChairmanEducational Planning & Management Deptt.Allama Iqbal Open University, Islamabad
sdDeanFaculty of Education,.Allama Iqbal Open University, Islamabad
Dated:_______________

6
CONTENTS
Chapter 1 INTRODUCTION Page No
1.1 Introduction 1-5
1.2 Statement of Problem 5
1.3 Objectives of The Study 5
1.4 Significance of The Study 6
1.5 Hypothesis 8
1.6 Procedure of The Study 8
1.6 .1 Population 8
1.6.2 Sample 8
1.7 Instruments 9
1.8 Data Collection 9
1.9 Analysis & Interpretation Of Data 9
1.10 Delimitation Of Study 10
CHAPTER 2 REVIEW OF LITERATURE
2.1 Review of Literature 11
2.2 Introduction 11
2.3 Importance Of Primary Education 13
2.4 Project And Plan Provisions For Primary Education In Pakistan 17
2.5 System Of Primary Education 20
2.6 Teachers Education 21

7
2.7 Teachers Education In Pakistan 28
2.8 Primary Teachers Training 30
2.9 Training Of Elementary School 33
2.10 Teachers (P-Sec) 33
2.11 In Service Teachers Training 34
2.12 Teachers Training Methods 40
2.13 Primary Schools in N.W.F.P 40
2.14 Primary Education at District 41level (upto June 2001)
2.15 Primary Education at District 42level from (July 2001 todate)
2.16 Teachers Training Programme 43in N.W.F.P.
2.16.1 Short Term Course 43
2.16.2 Education Extention Center 43
2.16.3 Government Colleges of In-service education 44
2.16.4 Primary & Non Formal Wing 44(Ministry Of Education)
2.16.5 New Primary Teachers Orientation Programme 45
2.16.6 PIP- ILE 47
2.16.7 Pep (Ministry of Education) 49
2.16.8 Teachers Training Project 50
2.16.9 Nazia Quran Training Project 51
2.17 Research in some In-service Training Programmes 51
2.17.1 Zamirul Haq 51
2.17.2 Khalid Mehmood 52

8
2.17.3 Misbah Khurshid 53
2.17.4 Dr. Tayyab Alam 54
2.17.5 Nighat Hashmi 54
2.17.6 Semiotics Consultants Pvt Ltd 54
2.17.7 N-PTOC Project 55
CHAPTER 3
3.1 Method & Procedure of Study 56
3.2 Population 56
3.3 Sample57
3.4 Sample Select 58
3.5 Instruments 58
3.5.1 Structure of instrument 59
3.5.2 Pilot Testing 59
3.5.3 Finalization 59
3.6 Questioner 60
3.7 Procedure Of Data 60
3.8 Analysis & Implementation Of Data 61

9
ACKNOWLEDGEMENT
I am highly grateful to Prof. Dr. R.A. Farooq, University Institute of Educational
Research, University of Arid, Rawalpindi supervisor/advisor of the thesis, for his enriched
professional and valuable guidance and suggestion in the completion of this study.
I am also thankful to all the EDO’s, Head Masters and Teachers of Primary Schools
in Hazara Division for their kind co-operation which they served in the process of data
collection. My thanks are for Mr. Imtiaz Ali, Raja Shahid Mehmood of Haripur, Qazi
Nadeem Sultan, Razia Khatoon of Abbotabad, Anwar Khurshid and Abdul Latif of
Mansehra and Noor Habib Fida and Fida Muhammad for their cooperation in the process
of data collection in respective districts.
I am also grateful to Dr. Aisha Akbar and Dr. Hamid Khan Niazi EPM Department,
Allama Iqbal Open University, Islamabad for their guidance and encouragement
throughout my course work as well as research work. I am especially thankful for Dr.
Muhammad Rashid, Dean Faculty of Education, Allama Iqbal Open University, Islamabad
for his special guidance regarding finalizing of this thesis.
S. Manzoor Hussain Shah

10
CHAPTER I
INTRODUCTION
Education is a continuous process which changes the behavior of an individual
towards certain objectives. It is mainly concerned with teaching-learning programme. As
our society is changing rapidly, so new techniques are being adopted in education to meet
these needs. Education has become more important in the modern world and is a base for
over all development especially of developing countries.
Education is accepted as a fundamental right of all members of a society. The
purpose of education is not merely to inculcate new knowledge and skills in the individuals
but also to prepare children for social responsibility and to meet the challenge of the time.
It is quite evident that the development of nation is greatly depends on the
development of education. No country can march forward without taking into
consideration the demands of changed circumstances. Every nation develops its education
system keeping in view the developmental needs of its people. According to
Guruge,A.W.P (1981 p.83.84)
For development, a country needs people with a variety of skills. It needs farmers to produce food; mineralogists and miners to tap the natural resources; hydrologists to tame its water resources; doctors and medical personnel to ensure health, engineers, architects, designers and construction workers to built roads and railways, bridges, houses, ports and airports, hospitals, etc; scientists to conduct research, to discover new products, to invent machines and equipment, industrialists and factory workers to produce machinery automobile, ship and airplanes etc, police and armed forces for defense and maintenance of law and order managers

11
and administrators to coordinate organize, direct and control enterprises and teachers, writers, entertainers and host of other skilled personnel of all kinds of service. One can imagine how could any country exist without them. Development of a country is directly proportional to expansion of education and especially primary education, as it is a stepping stone-towards higher education i.e. general, technical and vocational.
Education at any stage has a number of related objectives. Education is an essential
tool for human resource development and a necessary ingredient for sustainable socio-
economic growth. Economic Survey of Pakistan 2001-2002 (p.159) provides that;
Education especially basic (primary and lower-secondary) education helps reduce poverty by increasing the productivity of the poor, by reducing fertility and improving health, and by equipping people with the skills they need to participate fully in the society. More generally, education helps strengthen civil institutions and build national capacity and good governance in the implementation of sound economic and social policies. Education has a positive impact on individual earnings and also yields substantial externalities: parents education and mother’s literacy and education is associated with low infant mortality rates, higher enrolment and achievement rates of children and less gender differences in enrollment of children.
Education Policy 1998-2010 (1998, p.25) conceded “that Education is a process
through which a nation generally develops its self-consciousness by sensitizing individuals
who compose it. Education plays a vital role in determining the destiny of a nation. It
provides mental, physical, ideological and moral training to the individuals of the nation”.
In recent decades, elementary education has been gradually increasing specially in
developing countries. It is a fact that the teacher occupies the most crucial position in the
entire spectrum of educational activities. It is also a fact that the teacher is a changing
agent of the society. The challenges of the present century can be met if our teacher is
dedicated to his profession and is well equipped with modern teaching techniques. Today

12
the task of a common teacher has become challenging. The third regional conference of
Ministers of Education of Asian Countries (1976) observed that as long as education is
needed and knowledge about education and children continues to increase, the teacher has
always something new to learn.
Within the education system, elementary education has special importance and
consideration therefore, it has been recognized as a fundamental right throughout the
world. According to the Universal Declaration of Human Rights (1948) everyone has the
‘right to education’.
The early period of formal education is known as elementary education and its
duration vary from country to country. Primary education is the basis of any education
system. Completion of primary education is the unquestionable right of every child. The
primary education is the foundation for a child to built up his career. It has two functions
to perform. One is to prepare child for higher formal education and thereby to lay the
foundation for his future life and the other is to make the individual literate and bring the
minimum required development in different aspects. This is essential and helpful to
become a good and useful citizen in later life.
Since its inception, Pakistan is making efforts to eradicate illiteracy and promote
primary education. All educational policies and plans have been based on the provisions
of primary education irrespective to urban/rural disparity, improving its quality, expanding
access for out of school children, capacity building and institutional development.

13
Pakistan Educational Conference (1947, p.20) emphasizing primary education
remarked, “There is now general agreement that in its own interest the state should provide
for its boys and girls universal compulsory and free basic education which is the primary
requisite of training in democracy”.
The National Education Conference (1989, p.62) states that primary education
should be recognized as a basic fundamental right of every Pakistani child, and primary
education should be made free and compulsory forthwith. For the quality aspect of
education it was recommended that a separate directorate of teacher training should be
established. Chances of upward mobility should be provided for PTC Teachers. The
quality of teachers should be improved by gradually increasing the period of training for
PTC, CT and B.Ed.
The Education Policy 1998-2010 (p.28) provides that access to elementary
education should be increased through effective and optimum utilization of existing
facilities and services was well as provision of new facilities and services. Teacher
competence should be improved and the relevance of training programs for teachers should
be ensured.
Attainment of free and universal primary education is the immediate objective of
the Government of Pakistan. Therefore the objectives of elementary education in our
country have recently been set in view of national needs and requirements as well as
international commitments, such as, World Declaration on Education For All (1990), Delhi

14
Summit Declaration (1993), and subsequent E-9, Ministerial Review Meetings, and UN
Convention on the Rights of the Child (1989).
It is a widely accepted phenomenon that making education universalized and more
meaningful, one thing that always prominently matters is the teacher, the quality of his
preparation and his maintenance as a professional. His performance is the most crucial
input in the field of education. In educational process the teacher has a pivotal role. The
PTC teachers join the Government service after one year pre-service training being
imparted by different Colleges of Elementary Education and Allama Iqbal Open University
(AIOU) and afterwards they receive different in-service training to develop their
knowledge and teaching skills. Though the pre-service training is considered to be
sufficient for the teacher but today every one needs to update his knowledge and renew his
skills in order to enable himself/herself to prove competitively, effective and acceptable in
the society. The Elementary Colleges provide pre-service training as well as in-service
training with different packages and duration. Similarly in NWFP under the Primary
Education Programme, Improvement of the Learning Environment (PIP-ILE) efforts have
been undertaken to divide the province into zones for cluster based information and
training opportunities for teachers/head teachers and L Cs. The Asian Development Bank
assisted Middle School Project(MSP), Girls Primary Education Programme (GPEP) and
the Teachers Training Project (TTP)working through out the country which have elements
of addressing quality through decentralized arrangement by establishment of various
training outposts in selected areas. Apart from them different foreign agencies, are also
involved in the in-service training to primary school teachers. Amongst them the NORAD

15
(1991-1999) has major contributions. Similarly Primary Education Development
Programme (PEDP) NWFP (1989-99) sponsored by Federal Government and USAID has
also contributed for teachers training as well.
Keeping in view the pivotal role of the primary teachers and the difference in-
service training programme, this research was designed to study the performance of trained
primary school teachers with pre-service and in-service training and trained primary school
teachers without in-service training and to develop a strategy for future.
1.1 STATEMENT OF THE PROBLEM
This study was designed to observe class room performance of trained primary
school teachers with and without in-service teacher training in Hazara Division and to
make a comparison between the two groups in order to develop a strategy for future in-
service teachers training.
1.2 OBJECTIVES OF THE STUDY
Following were the objectives of the study;
1. To observe the class room performance of trained primary school
teachers with and without in-service training in Hazara division.
2. To compare the application of teaching skills by the trained primary
school teachers with and without in-service training in Hazara division.
3. To elicit opinion of the heads of schools about the performance of
trained primary school teachers with and without in-service training.

16
4. To develop future strategy for in-service training of primary school
teachers.
1.3 SIGNIFICANCE OF THE STUDY
The study is significant because of the following;
1. This study would provide insight of innovative techniques to improve the
teaching-learning environment, teaching skills and to enhance the professional
competence of teachers and to restructure the traditional set up of the system.
2. The study is hoped to provide guidelines to all the concerned with the
development of teacher teaching skills
3. The study is likely to be useful for foreign agencies and the students who are
interested to study the problems and issues related with elementary education in
Pakistan.
4. This research study will be of value to researchers with respect to the evaluation
of effectiveness of trained primary school teachers with and without in-service
training
5. This research study will also help the administrators, organizers and all the
agencies of both pre and in-service teacher training programs at primary level,
their staff and teachers to review their existing programs and to meet the future
educational challenges.
1.4 HYPOTHESES

17
1. There is no significant difference in the performance of the trained primary
school teachers with in-service training and trained primary school teachers
without in-service training
2. There is no significant difference in the performance of the PIT male teachers
and PIT female teachers.
3. There is no significant difference in the performance of the PIT urban teachers
and PIT rural teachers.
4. There is no significant difference in the performance of the PIT urban male
teachers and PIT urban female teachers.
5. There is no significant difference in the performance of the PIT rural male
teachers and PIT rural female teachers.
6. There is no significant difference in the performance of PIT and NIT teachers in
accordance with their head's views.
7. There is no significant difference in the performance of PIT male teachers and
PIT female teachers in accordance with their head's views.
8. There is no significant difference in the performance of PIT urban teachers and
PIT rural teachers in accordance with their head's views.
9. There is no significant difference in the performance of PIT Urban male
teachers and PIT Urban female teachers in accordance with their head's views.
10. There is no significant difference in the performance of PIT Rural male teachers
and PIT Rural female teachers in accordance with their head's views.

18
1.5 DELIMITATIONS OF THE STUDY
The study was delimited to the following;
1. Only Government Primary schools (male and female) were
included in the study
2. Primary School teachers with secondary school certificate
and PTC were included in the study
3. Trained primary school teachers with in-service training of at
least two weeks after 1995 were included in the study.
4. Only those schools were taken for the study where one teacher has the required
in-service training at his/her credit and another trained teacher without in-
service training was also available there.
1.6 METHODOLOGY AND PROCEDURE OF THE STUDY
The following methodology and procedure was adopted for this study.
1.6.1 Population
Following was the population of the study;
1. All districts of Hazara Division
2. All Government primary schools in Hazara Division
3. All trained primary school teachers (male and female) without in-service
training (NIT)
4. All trained primary school teachers(male and female) with in-service training of
at least 2 weeks (PIT)

19
5. All Heads of Primary schools in Hazara division
1.6.2 Sample
The sample consisted of 210 trained primary teachers with and without in-service
training for the period from 1995 to 2002 with at least 2 weeks in-service training. Name
of primary schools included in the sample are given at Appendix ‘A’
1.7 Description of Instruments
For the collection of required data of the study, an observation schedule was
developed. The observation schedule comprised eight items. The main teaching
skills/concepts of pre-service and in-service primary teachers training programme were
included in the observation schedule. Each item of the observation schedule consisted of
three to eight statements in the area of each skill. Each statement had five point scale
having strongly agree, agree, uncertain, disagree and strongly disagree. The observation
schedule is given at Appendix ‘B’
A questionnaire was developed for the head teachers comprising ten different
essential items of different teaching skills pertaining to the teacher concerned. The
purpose was to know the general views and observations of the head teachers regarding the
overall performance of concerned primary teacher. Each item was based on five point
rating scale. The questionnaire is given at appendix ‘C’.
1.8 Data Collection
20
The data was collected by the researcher and research associates from the four
districts of Hazara Division selected randomly. The research associates were formally
briefed about the study. They were M.Ed and B.Ed having sufficient teaching experience at
primary level and familiar with in-service and pre-service training structure. The list of
research associate is given at Appendix ‘D’. They visited different randomly selected
schools and observed the class room performance of the teachers included in the sample.
Similarly data from the heads was collected by administering the questionnaire.
1.9 Analysis and Interpretation of Data
The data was obtained through field visits and observing the performance of trained
teachers with and without in-service training. A questionnaire was also administered to the
head teachers of the respective schools. The data collected through observation schedule
and questionnaire was tabulated and interpreted in percentage, mean score. Besides, the
tabulated data was given t test to see the significant difference of various groups. On the
basis of findings of research, recommendations were formulated and future strategy was
developed.

21
DEFINITION OF IMPORTANT TERMS
ADO Assistant District OfficerAIOU Allama Iqbal Open UniversityB.Ed Bachelor of EducationBT Bachelor of TeachingCT Certificate in TeachingDEO District Education OfficerDO District OfficerEDO Executive District OfficerINSET In-service Education and TrainingINSTOP In- service Teachers Orientation ProgrammeJV Junior VernacularLCs Learning CoordinatorsNIT Not provided in-service trainingNORAD Norwegian Aid AgencyNPTOC New Primary Teachers Orientation CourseOT Oriental TeacherPC-I Project Cycle -IPEP Primary Education ProjectPIT Provided in-service trainingPITE Provincial Institute of Teacher EducationPEP-ILE Primary Education Programme Improvement of Learning EnvironmentPTC Primary Teaching CertificatePTOC Primary Teachers Orientation CourseSV Senior VernacularTRC Teachers Resource CenterTTMDC Teacher Training and Material Development CellTTP Teachers Training Project

22
CHAPTER 2
REVIEW OF RELATED LITERATURE
This chapter contains discussion on related literature. The discussion is focused on
importance of education, different aspects of teacher education with special reference to
N.W.F.P. and research work carried out in the relevant field.
2.1 IMPORTANCE OF EDUCATION
Education is an indispensable ingredient of development and a fundamental right of
every individual. Education is a power-catalyzing agent, which provides mental, physical,
ideological and moral training to individuals, so as to enable them to have full
consciousness of their purpose in life and equip them to achieve that purpose. It is an
instrument for the spiritual development as well as the material fulfillment of human needs.

23
Generally it is believed that education is a process by which individual’s
socialization takes place. Education is a socializing factor. It is consciously controlled
process where by changes in behavior is produced in the person and through the person
within the group. The statement that “Man is a social animal” is a famous saying. A man is
born in a society and lives in a society. He breathes in the social atmosphere. Society is
around him and within him. Speaking broadly education is the process of transferring
man’s original nature into human and therefore social nature directed toward the goal of
making living in the world good and worth while.
Education is a social process, which ensures the development of an individual from
a similar and lower position to a more complex and higher one. Various aspects of human
development are kept under consideration during an educational process. Goraha, M.A.
(1981, p.2) states that;
Every society in the world organizes education in the light of its aims and philosophy of life, its social system and traditions. But the world is so diverse in pattern and belief that general consensus on the goals of education is hard to discern. The Muslim education aimed at producing pious and practicing Muslims. American education is wedded by and large to the production of democratic individuals while the socialist system endeavors to produce true “Socialists”. Typical stamp can be seen in the end products of various systems of education; thus goals vary from society to society and efforts are made to achieve them through education.
Education must inculcate the people needs in order to take effective part in the fast
development taking place all over the globe. Education refers to the needs of the individual
and society. According to Ali S.A. and H.S. (1979, p.ix) “Education is a process involving
three references; the individual, the society or national community to which he or she

24
belongs, and the whole content of reality, both material and spiritual, which plays a
dominant role in determining the nature and destiny of man and society”.
Education ensure the preservation and transformation of the human culture and
heritage towards future which is uncertain. Its function of preparing people for
development has, therefore become all the more difficult to discharge because of the
extremely rapid changes taking place and the constantly increasing complexity and
diversity of their forms.
Jafar N. (1990, p.14) says that:
Foremost principle of education is that it should be harmonious, coordinated and a synthetic experience as a result of mutual and co-operative effort of the society, the teachers and the educated men. It should be an accepted and agreed form of activity of individual as well as of collective nature, and in essence should amount to an idealistic interpretation of the cultural experience or of the social heritage of the existing generation to the coming ones.
Education has been playing its role in the development of the individual and society
constantly. According to Siddiqui S.A. (1982, p.i)
The meaning and scope of education is much wider than that of literacy. A highly literate person can be illiterate as well. This obviously sounds paradoxical but this is a fact known to all scholars in different fields of knowledge. General literacy is not enough in the world of today. Several other specialized forms of literacy are essential for meaningful effective dealing in life. Education is responsible for overall development of individual and society.
Education is called human capital as it directly promotes the quality and capability
of human being. In the process of production, which is the key to development, the quality

25
of human beings accounts, as it is this quality which makes physical capital what it is
worth. According to Gupta, S.M. (1997, p.47),
Education improves productive skills and this development of human resources increases the national product and national wealth. So it can be said that education produces a society which has more productive power. It is the responsibility of teacher education institution to produce teachers who can explore the creative potential of students and can direct this potential towards appropriate channels.
The purpose of education, according to Rohidekar, S.R. (1997, p.79) is “to convert
savage into sage by providing opportunities and guiding each to develop to the maximum
his/her potential abilities and aptitudes into appropriate knowledge, skills and qualities of
head and heart. Only quality education can achieve this goal”. If education is to built
nation builders, teacher education should concern itself with providing master builders,
well equipped physically, intellectually, emotionally and spiritually.
2.2 IMPORTANCE OF PRIMARY EDUCATION
The education and especially primary education is backbone and basic foundation
of further education. An ignorant society resists change. It rejects all innovational methods,
which guarantee development and prosperity. History of the nation proves the veracity of
the claim. Education and to be more precise, primary education is a reasonable and cheaper
means, which inspires the people to accept the change and enjoins them to think critically.
It simulates the capabilities of the individuals by which they change economical, social,
political, moral and cultural systems, prevailing the society and summon for independent
and prosperous life.

26
While considering the concept of quality education our attention is usually focussed
on the higher institutions of learning, whereas primary education is the foundation of every
learning. The better the foundation, better the edifice. Moreover, it has been analyzed
through extensive research studies that return of primary education is higher than that of
higher education. Therefore, primary education needs more attention and inputs to raise its
standards and quality. Universities, Colleges and other institutions of technical education
are no doubt, important in their own right, but personality of men and women gets its
shape from early childhood. Primary education plays a vital role in the producing civilized
citizen and pioneers to lead the nation through crises.
There is general consensus among economists of the world that for economic
development, the material resources are not enough: the importance of human resources
cannot be underestimated. Examples do not want those nations with less material
resources but with the proper training and use of human resources, made progress by leaps
and bounds. However it is possible when primary education is properly planned and
provided to all children corresponding to age group (5-11).
2.3 POLICY AND PLAN PROVISIONS FOR PRIMARY EDUCATION IN PAKISTAN
Emergence of Pakistan as an independent nation brought new hopes, expectations,
problems and responsibilities, in the wake. Reconstruction needed not only utilization of
existing facilities but also to extend benefits of education to vast majority, who were
illiterate. The conference of educationists held in November 1947 at Karachi surveyed the
existing and future opportunities in educational field in the light of national requirements

27
and priorities. The conference announced that it was the responsibility of the state to
provide free and compulsory education to the people at the primary level within the
shortest possible time. The objective of free and compulsory primary education was
accepted as a basic policy of the state.
Fazal ur Rehman (1951, p.1) the then Central Minister for Education in his address
to the Pakistan Educational Conference expressed the desire as follows:
Our first and foremost concern must invariably be determined and vigorously attacked on the formidable problems of illiteracy and its evil consequences. It goes without saying that the existence of a large bulk of illiterate population constitutes a grave menace to the security and well being of the state. There is now general agreement that in its own interest, the state should provide for its boys and girls universal, compulsory and free basic education which is the primary requisite for training in democracy.
The Commission on National Education (1959, p.185) recommended compulsory
primary education. It considered education necessary at elementary level as indispensable
for the skilled manpower and educated citizenship. The commission for the first time
provided guidelines to look for alternative means in view of the financial constraints to
achieve the goal of universalization of primary education but these means were assumed
ambitiously as a result additional finances could not be provided to achieve the goals.
The commission also recommended that the target of five years compulsory
schooling should be achieved within a period of ten years instead of eight years.
Consequently, the “Asian Model” of planning compulsory education up to seven years
was drawn up in 1965 but in the case of Pakistan the estimate was only 45% of primary
school age children were in schools, so “Asian Model” was not applicable for
implementation in Pakistan.

28
After Pakistan Educational Conference 1947, Six Year Plan (1951-57) was
formulated to implement the recommendations of the conference. Zaki, W.M, (1969, p.
57) referring to the plan said that the six year plan was a planned attempt to spell out the
educational needs of the country in terms of money, men and material but it did not make
provisions for universal primary education and the problem was left unsolved to the
development efforts in future.
Haq (1970, p.238) showing his concern for the same issue analyzed first five-year
plan 1955-60 and agreed that education was treated as an important field and was accorded
as a separate sector but no suitable guidelines were provided for universal primary
education.
The goals set by the Commission on National Education, 1959 for the development
of education and for providing universal primary education were to be achieved through a
national plan. It was for this reason that the educational reforms recommended by the
commission were reflected in the Second Five-Year Plan. According to Haq (1970, p.80)
"the progress in the field of primary education, during the plan period was encouraging.
Facilities for primary schools were substantially increased and annual growth ration was
7.2 percent".
Efforts in this respect continued and the Third Five-Year Plan 1965-70 envisaged
an annual ratio of increase of 12.4 percent in the enrolment of children at primary level.

29
Similarly Education Policy 1972 (p.6) which is considered target oriented policy,
also highlighted the significance of primary education and "envisaged universalization of
primary education by 1979 in cases of boys and by 1984 for girls".
National Education Policy 1979 (p.2) dealing with the universalization of primary
education recommended new strategies which were set out in the Fifth Five Year 1978-83.
The policy envisaged the programme of achieving universalization of primary education
for boys by 1987 and for girls by 1992, which like previous efforts proved to be too
ambitious and failed to achieve the desired target.
The Sixth Five Year Plan 1983-88 (1983, p.383) recognized that "Pakistan had
lagged behind in educational development with literacy rate of only 25% and half of the
primary school age children were out of school". The plan proposed a sharp change in
sectoral priorities by rephrasing primary and secondary education. The plan particularly
emphasized the primary education.
During Seventh Five Years Plan 1988-93 (1988, p.209) involvement of private
sector in the universalization of primary education was provided from 30% to 40%. But
schools in private sectors could not serve the general masses due to high fee.
All these efforts, however, remained unsuccessful and according to National
Education Policy, 1998-2010 (p.27) "the participation rate in primary education had not
improved inspite of targets set out in the education policies and plan of the country".
According to this policy about 5.5 million primary school age (5-9) children were out of
school.

30
The Eighth five-year Plan laying emphasis on primary education states that primary
education would be given the highest priority during the plan period. By the end of the
plan period, all boys and girls of 5-9 age group would be enrolled in primary or mosque
schools.
The Eighth five-year Plan 1993-98 (p.308) also emphasized the importance of
teacher training both pre-service and in-service for the improvement of quality of
education and stated,
One of the major reasons for low participation rate at the primary level is high drop out rate. Many children who enroll in the primary schools dropout because they do not find the school environment congenial to their basic needs. Some of them dropout due to uninteresting curricula and harsh attitude of teachers. Other leaves on account of poverty to become earning members of the family or to extend help to the family. During the Eighth Plan, the facilities in he primary schools will be improved by providing adequate shelter, furniture, portable water, latrines, teaching aids etc. Activity oriented instructional material will be developed and provided to teachers to make the learning process interesting. Quality of teachers will be improved through better pre-service and in-service training. A strong institutional campaign will be launched to persuade the parents to send their children to the schools.
The plans and policies have been formulated by the Government of Pakistan and by
our planning experts right from Pakistan Educational Conference in 1947 to the vision
2010. Even very recently the National Reconstruction Bureau has formulated a next vision.
But still the plight of primary education in Pakistan is in distress due to huge dropping out
of the students at initial level and low quality of education. Hence reconciliation with the
changing trends of the modern world still required.
2.4 THE SYSTEM OF PRIMARY EDUCATION
31
The present system of education of Pakistan is the heritage of the pre-partitioned
British India. The system of education followed in colonial India was introduced by the
British, primarily for turning out clerks and subordinates necessary for carrying on the
administration of the country under the British masters in the colonial set up. The system
of education was designed by Lord Maculae to produce “your most obedient servant”. The
cardinal principle of this system was to quote the words of Lord Maculae, “We want
Indians in color but Englishmen in taste and aptitude.” At least that was the objective at the
initial stage after replacement of Persian by English as the Court language in 1935. The
aim gradually expanded after the establishment of the Calcutta University in 1958 and
other Universities later on. The consensus of opinion has been that since the existing
system was designed by the alien rulers to serve their own imperialistic ends, it can hardly
be expected to cater for the requirements of an independent and democratic Islamic state.
Thus the existing system of education is not the result of a natural growth but was
transplanted root and branch by foreign rulers, as we have already seen to serve their own
purpose. It has outlined its utility and does not suit the genesis of Pakistan.
In Pakistan, the administration of education is a provincial responsibility. This is so
far school education as well as in the field of teacher education. The Federal Ministry of
Education exercises over all policy control with the detailed administration of the services
being devolved to the four provincial governments.
At the Federal level there is a curriculum wing whose functions include over all
development of the national curriculum for schools and teacher education institutions. At
provincial level the respective ministries also have their curriculum bureau. In short

32
primary education is a subject, placed on the concurrent list of the Federal Government for
policy formulation, coordination, and development and administration rest with the
provinces.
Primary education covers the first five grades for age group 5-9. A primary school
for a locality of 500 population is envisaged in different policies, however the target in
practical has never been achieved so far.
Supervision of primary education rests with the provinces. The administrative
models differed from province to province, however the lower echelons was same for all
the provinces. With the devolution of power at district level, now the supervisory structure
of primary education in each province is the same i.e. Executive District Officer (EDO) is
responsible to run the day to day affairs of the primary education with the assistance of his
subordinates in a defined hierarchy.
The responsibilities of evaluating and promoting of students from class I to V still
lies with the ADO. A student is certified to join 6th class in elementary or secondary if he
qualifies the final examination at the end of 5th class.
2.5 TEACHER EDUCATION
In recent decades, elementary education has been gradually increasing specially in
developing countries. It is a fact that the teacher occupies the most crucial position in the
entire spectrum of educational activities. It is also a fact that the teacher is a changing
agent of the society. We can meet the challenges of the present century if our teacher is

33
dedicated to his profession and is well equipped with modern teaching techniques. Today
the task of a common teacher has become challenging.
Education is a dynamic force and is controlled by a teacher. The teacher holds a
central position in education system. He contributes significantly in character building of
the individuals and through them in building the nation. He helps in transmitting values
held by the adult generation to next generation. He plays key role in educating the citizens.
Hence the future of the nation depends, to a very large extent upon the quality of the
teachers.
No doubt quality of education is closely related to the improvement of educational
objectives, policies programs, curricula, facilities, equipment and administrative structure
but it is only the teacher who puts life into this skeleton. In the words of Ryan, Y. (1994,
p.200)
If competent teacher can be obtained, likelihood of attaining desirable educational outcomes is substantial on the other hand, although schools may have excellent material resources in the form of equipment, buildings and textbooks, and although curricula may be approximately adopted to community requirements if the teacher is misfit or indifferent to their responsibilities, the whole programme is likely to be ineffective and largely wasted.
Keeping in view the pivotal role of teachers due attention should be paid while
recruiting them. Only those candidates be preferred who have high commitment to the
teaching profession. The quality of education is directly related to the quality of its
teachers. The Commission on National Education (1959, p.265) provides that;
The keystone of the arch of the national commission is the efficient, hard working honest teacher who is fully conscious of the fact that he is the

34
thrust of his nation’s stability progress and reputation. Because the training and upbringing of the nation’s youth have been placed in his hands. It is quite obvious that the education of a country cannot be better than its teacher. A good teacher is able to break through the poorest system and even an excellent system would get corrupted if the teacher is not conscious of his responsibilities or does not care to discharge them properly. That is why it is said, “ no system of education better than its teacher.
Qualitative improvement in education depends upon proper training of teachers.
The teacher cannot play any of the role unless properly trained. To meet the expectations
and aspiration of the nation a teacher therefore, must possess creative abilities and
professional skills to enable him/her to discharge his duties according to needs of society
and nation for that he has to undergo special sort of training and education. Since teaching
is a lifetime profession and there is a rapid explosion of knowledge it is not sufficient to
provide training to teachers once in their life span. Therefore continuous education for
teachers has become necessary. Lawton, D. (1990, p.151) has emphasized the need for
continuous education of teachers as following;
The professional teachers need opportunities for continuous education not only to update their subject expertise and rethink their methods, but also to develop as human beings and professionals in a variety of ways. Part time research into the process of teaching and learning should be a high priority for them. Only if measures such as these are taken will young people get the quality teaching that they need and deserve.According to Siddiqui, M.A. (1991, p.3) “teacher education is perceived as a
continuous process, which consist of three distinct but closely interrelated consecutive
stages (a) pre-service education (b) Induction and (c) in-service education and training”
Teacher education must cover various aspects of teacher's profession being a multi
dimensional activity. Aggarwal, J.C. (1990, pp.270-271) also looks at teacher education as
35
a continuous process. For him it is a life long process of many dimension and facts. He
described teacher education as provision of;
Knowledge, skill and ability which is relevant to the life of teacher as a teacher. This definition implies that teacher education is a multidimensional activity and encompasses various aspects of a teacher’s life and work. Its aim is not to teach the teacher how to teach, but to make an effort to enkindle his initiative, to reshape his attitude and to remodel his habits in such a way that the personality of the teacher is molded in the right form.
According to Sharon, F.R. and Rossman, G.B. (1995, p.6) a good teacher education
programme must be dynamic so that it can produce teachers who are:
Moral stewards, constructors and philosophers draw from a strong base of values, knowledge skills and professional commitment. Their value system is deeply grounded in the rights of children, their knowledge base is self constructed yet connected to the culturally accepted knowledge of the field, they understand how people grow, develop and learn their skills and are tried in experience, their professional practice is guided by philosophy of reflection, action and accountability
Regarding the teacher knowledge, his method of teaching and his feelings
Anderson, L.W. (1987, pp.83-84) is of the view that:
In order to prepare teachers for ‘affective teaching’ a teacher education programme must have goals classified into three categories: Teacher knowledge of content area; teaching skills both pedagogical and interpersonal and teacher feelings and self-awareness. The concept presented in this approach puts equal emphasis on knowledge and skills of teachers as well as teacher's awareness of student's emotional reactions and their ability to respond to these reactions.
Referring to the same aspects, Dunkin, J.M. (1987, p.672) says;
Approaches to the development of professional skills and competencies in pre-service teachers revolve around the provision of guided experience in school or school-like situations. Almost universally this involves the placement of student teachers in actual school and classroom for using periods of time and at varying stages in their preparation.
36
It is important, as well that the teacher training should not only be effective, but it
should also be compatible with the value system of the society. In this way the
effectiveness of teacher training and its relevance with social setup are both equal
important.
According to Iqbal, M.Z. (1996, p.125):
In a country like Pakistan, which owes its very existence to an ideology based on religious faith, it is even more important that the teacher education is planned and directed in accordance with the tenants of its faith. The teacher training should produce teachers who fear God, comply with Shariah, possess sound personal character and are a model personality for the student.
According to Ryan, Y. (1994, p.200) a competent teacher can enhance the
likelihood of attaining desirable educational outcomes while on the other hand, although
the schools may have excellent material resources in the form of equipment, buildings and
textbooks but incompetent and indifferent teachers can make the whole programme
ineffective and largely wasted.
Referring to teacher education, however, Eighth Five Year Plan 1983-88 (p.313)
under the teacher education states that “teacher has a pivotal role in improving the quality
and efficiency of education system for which pre-service and in-service training programs
of high quality are essential”. The quality of pre-service training for most of the teacher
training institutions is out-moded and low and there is an urgent need to update the
knowledge and skills of master trainers engaged in teachers training.
The targets set in the Eight Plan are, no doubt, quite interesting and could have
contributed a lot in improving the quality of education at the primary level provided proper

37
implementation would have carried out. A review of the performance of eight plan will,
however, reveal that the majority of targets are yet to be achieved.
The National Education Policy (1992, p.12) on teacher education says that;
1. A separate unit for organizing teacher training shall be set up by each
provincial education department and at the federal level.
2. Mobile training units may be set up for on the job training of teachers
3. Teacher training institutions will be equipped and strengthened, and their
faculty will be provided training to update their knowledge and skill.
4. A regular in-service training program will be launched for teachers at all levels.
Distance education method will be used for in-service training. Techniques and
methods of community motivation towards education will be emphasized in
training programs. Computer education will be a compulsory component of all
teacher-training programs.
5. Deficiency of science, mathematics and languages teachers shall be removed.
Also special scholarship scheme will be started for those holding secondary or
higher secondary qualification in order to attract them to teaching profession.
6. A system of incentives will be created to encourage teachers to undergo in-
service training. Special awards will be instituted for inventions and creative
work.
7. The private sector will be encouraged to set up teacher resource centers
(TRC’s) to which government schools teachers may be nominated for training.

38
8. Teacher training curricula will be updated and the need for increasing the
duration of teacher training will be assessed.
9. Teaching practice will be made compulsory and necessary part of pre-service
training programs. It will be a separate head of passing. No B.Ed degree will be
awarded to those appearing as private candidates unless the “Teaching
Practice” part is completed to the satisfaction of examiners. Similar conditions
may apply to B.Ed programs conducted through distance education.
10. A national commission for teachers will be set up for examining the problems
of teachers and for suggesting ways and means for their solution.
The Objectives of teacher education as narrated in National Education Policy 1998
(p. 29) are:
To create a matching relationship between demand and supply of teachers; to increase the effectiveness of the system by institutionalizing in-service training of teachers. Teacher trainers and education administrators: to upgrade the quality of pre-service teacher training programs by introducing parallel programs of longer duration at post secondary and post-degree levels; to make the teaching profession attractive for the young talented graduates by institutionalizing a package of incentives: to develop a viable framework for policy planning and development of teacher education programs both in-service and pre-service and to provide for management training of educational administrators at various levels.
2.6 TEACHER EDUCATION IN PAKISTAN
According to Siddiqui, M.A. (1991, p.21); "teacher training in Pakistan can be
traced back to 1904 when two teacher training institutions were established at Lahore and
Karachi and these two institutions provided non formal teacher training programs". In
1954 the institution at Karachi was made a normal school and it began to offer J.V (Junior

39
Vernacular) certificate. The institution at Lahore was made a normal school and offered
J.V certificate in 1956.
Pakistan Educational Conference 1947 (p.21) expressed concern about teacher
education and recommended revision of teacher education programs to make them
compatible with changing needs.
In 1947 when Pakistan came into being the following were the programs for
training of the teachers for different stages:
1. J.V (Junior Vernacular (8+1 for primary classes (1-5)
2. S.V.(Senior Vernacular ) 10+1 for class 1-8
3. C. T (Certificate in Teaching ) 12+1 for class 1-8 including English
4. O.T (Oriental Teacher) One year training after a certificate in oriental
language for the instruction of oriental languages.
5. B.T (Bachelor in Teaching ) 14+1 for class 6-10
Commission on National Education in 1959, made a serious effort to rationalize the
system of education. The Commission recording the fact that teacher education played an
extremely vital role in an educational system conceded, “No system of education can be
better than the teachers who serve it.” The Commission recommended the following
academic and professional standards for teachers of different standards.
Classes to Teach Qualifications for Admission Duration of Training
1-5 Matriculate 1 year
6-8 Intermediate 2 years

40
9-10 Bachelor’s degree 2 years
11-12 Master’s degree A short training course
After the 1971 crisis, the entire education system was reviewed. Curricula were
revised to match the age requirements and to fulfill the aspirations of the people of
Pakistan.
The Education Policy 1972-80 (pp.34-35) suggested that “in order to meet the
massive requirements of teachers at all stages, facilities for teacher education should be
increased by reorganizing teacher education programs and by introducing innovative
techniques.” It was also recommended that all teachers training courses be revised and
reformulated. As a first step the curriculum for the elementary and secondary stage was
revised. Allama Iqbal Open University was assigned the task of providing teacher
education by using the innovative technique of distance education.
The National Education Policy 1979 (p.44) also remarked, “that teacher was the
pivot of the entire educational system and suggested to strengthen the teacher education in
the country”. Under the policy all the primary teacher training institutions and normal
schools were upgraded to Elementary Colleges of Education for elementary teachers
The National Education Policy 1998-2010 (pp.47-54) declared some objectives of
teacher education. Some of these are:
1. To create a matching relationship between demand and supply of teachers.

41
2. To upgrade the quality of pre-service teacher-training programs by institutionalizing parallel programs of longer duration at post-secondary and post-degree levels.
3. To make teaching profession attractive for the young talented graduates by institutionalizing a package of incentives.
4. To develop a viable framework for policy, planning and development of teacher education programs both in service and pre-service.
Above objectives shows the realization that teacher education is important for
educational system and that it needs to be revised and improved. All the policies and plans
have contributed towards certain objectives, but even now teacher education in Pakistan is
far from perfect.
2.7 PRIMARY TEACHERS TRAINING (PRE-SERVICE)
Teaching is an art and like all other arts it can be learned with varying degrees of
proficiency. Some teachers are born teachers and they can be good teachers without
learning the art of teaching. Just as some singers have brilliant musical careers without
studying voice culture. On the other hand, there are individuals who are naturally so
handicapped for a teaching career that instructions in the teaching art could do as little for
them. Hence like every artist a teacher requires sufficient amount of practical training in
his/her future job.
The origin of pre-service training programme goes back to the establishment of the
normal school the latter half of the 19th century. The inadequacy of one year of training
was recognized long ago and the duration of training was extended to two years. Policy
changes took place and the duration of the training courses was reduced again to one year
throughout the country.

42
Pre-service teacher education is offered in two different kinds of institutions.
Teachers entering the primary sector are trained in the Government Elementary Colleges.
The award granted by the institutions is the Primary Teaching Certificate (PTC). In
practice there are variations in this pattern. In the province of Baluchistan for example,
there are no pre-service primary courses available. There, training is offered to untrained
teachers after some time in their teaching careers. Even then in Punjab and N.W.F.P.
examples are there that majority of untrained teachers were trained through refresher/short
courses.
Pre-service training is needed to provide the formal and informal activities and
experiences that help to qualify a person to assure the responsibilities of a member of the
educational profession or to carry out his responsibilities more effectively. The major
purpose of initial or pre-service training is to familiarize teachers with the general school
atmosphere and to develop in them some basic professional skills. In this way the teacher
education is a continuos process
Elementary Colleges are under the control of the provincial governments. Colleges
of Education operate under the control of the board of studies of the relevant university to
which they are affiliated. These boards of studies operate independently of each other.
Provincial boards of examinations exist to examine candidates externally for the PTC and
C.T Programmers

43
The PTC programme is for the teachers who are trained to teach the primary classes
(I-V). This programme is of 39 weeks duration. According to Farooq, R.A. (1993, pp,
36.37)
Pupil’s teachers of the PTC class study the following subjects.
1. Principles of education and methods of teaching 100 marks
2. Child development and counseling 100 marks
3. School organization and management 100 marks
4. Health and physical education 100 marks
5-10 Six methods of teaching courses in sub areas 100 marks
11. Short term practice of teaching 050 marks
12. Long term practice of teaching 150 marks
Total marks 1200 marks
2.8 IN-SERVICE TEACHERS TRAINING
The inadequacies of pre-service teacher training programs and the presence of a
substandard weak force with no training makes in-service training even more important. It
is self evident that changes in the content and even more so in the methods of teaching
learning can be effected only if a large number of existing teachers especially in the
primary school are adequately prepared through a systemic process of retraining. In-
service training aims at promoting the continuous professional growth of the teachers after
they have joined the profession. The need for further study is directly related to the ability
of teachers to perform teaching tasks in a variety of educational settings. The more the
nature of their role changes the more frequently the teacher must receive in service

44
training. Experienced teachers may need such training to improve their professional
knowledge, skills and attitudes in order that they can educate children more effectively.
Bolam, R. (1980, p.3) defines in-service education and training of teachers as
“those education and training activities engaged in by teachers following their initial
professional certification, and intended mainly or exclusively to improve their professional
knowledge skills, and attitudes in order that they can educate children more effectively”.
Dave, R.H. (1978, p.22) also has similar views but he calls it "the application of
the concept of lifelong learning, to in-service teacher education with a view to encourage
teachers to refine their competencies and responsibilities in a long term framework of
professional responsibility"
Sharif, M.S. (1965, p.183) also has similar perception. He says, “In-service
education refers to those activities which help teachers improve their teaching learning
competencies while on Job”. He further adds that in-service education denotes all
activities and experiences that are provided for teachers on the job to promote their
personal, academic, and professional competence in order to equip them with increasingly
better ways of discharging their professional responsibilities. (p.212)
Childress, R.J. (1982, p. 12) highlights the need of in-service education of teachers
and states that “that there is importance of in-service education for the teachers in
profession accepted in popular articles, in text books, in special publications and in
research studies." There has been explosion of knowledge which has resulted in the

45
change of methodology and to develop suitable technology for the classroom teachers due
to which in-service education of this group necessary.
Letson, T.W. (1971, pp.79-80)) in his article, “In-service Training” stated the
following:
In-service education is designed to promote the continuous development of the teacher after he enters the teaching profession by providing planned and systematic instruction within the educational setting. The need for further study is directly related to the ability of a teacher to perform his teaching tasks. The more the nature of his role changes, the more frequently the teacher must receive in-service education. An experienced teacher may need such added training because of a change in his assignment for example, a change from independent to team teaching, a move to a new location, or the introduction to the curriculum of new subject matter or techniques, such as the new Maths, or the radical change in the socio-economic and /or ethnic composition of the school population. In-service courses may also help beginning teacher in applying theory learned in college programme to actual class room situation.
Erant, M. (1988, pp.73-74) states that the national governments have been giving
increasing attention to the in-service education and training of teachers (INSET) firstly
because teachers, like other adults, need continuing education to keep abreast of changes in
modern society. Secondly there is growing concern in some countries about the quality of
teaching and career development of these who have basic education and training than
current requirements of teaching and thirdly because demographic trends have reduced the
demand of new teachers in some countries, cutting of one important source and finally
because there is a general feelings that education has failed to fulfill the hopes of the
expansionists who have created a public pressure for improved school performance.

46
The initial preparation of teacher is critically important task in teacher
development. The role of the teacher should be reflection of the community's expectations
as well as the skills and abilities of individuals needed for the profession.
Induction was identified as the weakest link in the system of teacher training all
over the world, even the most advanced countries. It can be observed from the press
release of the Department of Education and Science of Oxford University, D.S. (1992, p.
348) which said, “Induction should be a planned extension of initial teacher training. It
should help newly qualified teachers to become confident and competent as rapidly as
possible, with guidance from more experienced colleagues”
The purpose of in-service education is to increase the efficiency of teachers who
are on jobs. Singh, S.A. (1980, p.43) thinks that "teaching is a life time profession and
there is rapid explosion of knowledge, it is not enough to provide training to teachers once
for all. Facilities should be provided for retraining of teachers periodically through out
their career"
The in-service training of all working teachers was duly emphasized in the National
Education Policy 1979 (p.62). It states that “ In order to ensure continuous professional
growth all teachers would be required to undergo at least one in-service training course
during five years”
The Government efforts for the improvement of the teacher’s input at different
level of education are also seen in the latest education policy, 1998-2010. Similarly the

47
Education Sector Reforms (ESR) also speaks about the teachers quality through different
in service teachers training programmes.
2.9 NEEDS OF INSERVICE TRAINING
The success of any educational reform depends on the quality of teacher which, in
turn, depends to a large extent on the quality of the teacher training programme. It is
essential to develop national consciousness regarding necessary improvements to be
brought about in teacher education.
The change in the curriculum brings about innovation both in content of the
subjects and methods of teaching. The changes in methods of teaching include education
technology, programme learning, modular approach and discovery approach etc. This all
necessitates that a teacher should under go in service training periodically.
It is observed that teachers cannot teach effectively certain subjects unless she/he
under goes to some sort of in-service training to keep herself/himself abreast of these new
changes and to provide the knowledge.
The attitude of the teachers also changed with passage of time and experience in
teaching. They develop new interest in special fields for example working teaching to
maladjusted child, on new method teaching, techniques of evaluation etc. All such needs of
teachers can be met through in-service courses. Here the teachers get opportunities to
share their experiences with the colleagues, instructors and resource persons. In-service
training helps the teachers to grow and keep growing professionally. It must re-enforce

48
and refresh the knowledge, skills, techniques and attitudes acquired by the teachers during
their initial training.
The report of the Commission on National Education 1959 (p.271) stressed the
need of in-service training of teachers in following words;
It must be recognized that no teacher once trained can throughout his career be regarded as fully competent without periodic refresher courses. This can be accepted in all the advance countries where provisions are made for the teachers to refresh his knowledge and ideas at given intervals. It is time for us also to stop treating refresher courses a s luxury and to accept them as a necessity of education standards are to be raised and maintained. To enforce this we proposed that once facilities are made available and courses organized, increments should be with held from teachers who have not attended a refresher course at least once in five years.
The National Education Policy 1979 also requires every teacher to undergo at-least
one in-service training course during every five years of his/her service.
To meet the demand of the in-service training of the teachers, the policy further
recommended that all the provincial education extension centers and in-service training
centers in the country would be strengthened.
The implementation programme of National Education Policy (1979, p.63) also
included the following:-
a) In order to re-orientate the massive number of existing teachers in the ideology
of Pakistan and in their respective fields of specialization in-service training
course will be conducted throughout the country.
b) Strengthening of the provincial education extension center so as to enable them
to provide at least one in-service training facilities to every teacher during five

49
years. The training of teachers of classes XI-XII will also be the responsibility
of the education centers.
National Education Policy and Implementation Programme (1992, p.26)
recommended a regular in-service training programme to be launched for teachers at all
levels. For this purpose distance education method was recommended.
The latest National Education Policy (1998-2010, p.30) provides that “in-service
training for existing teachers shall be revamped and over a period of five years, all
elementary school teachers shall be provided with in-service training opportunities and
resultantly in-service training on a 3-year cycle basis shall be institutionalized”.
Most of the recommendations of teacher training involve re-deploying training
material, and the staff and so do not entail significant cost to the extent that the teacher
training materials and staff located at the government teacher training colleges can be re-
deployed and rationalized as part of the reforms.
2.10 TEACHERS TRAINING METHODS
This topic is discussed here because the study aims at evaluating the teaching
methods of Primary School teachers.
There is a wide variety of methods available to the administrative hierarchy.
Generally these can be grouped into on the side and off the site methods. Teachers
training courses of Pakistan Education Foundation,(2000) provides that;

50
One of the oldest and most widely used methods of training consists of assigning new teacher to experienced teachers. These techniques must be chosen for teaching particular skills. The competent and experienced teachers should have the ability to teach the job to some body etc. The teachers should be trained in the proper methods of instruction including use of reinforcement knowledge of results and distributed practice. These experienced teachers should be convinced that the training of new teachers in no way would threaten their job security, seniority of status.
2.11 PRIMARY SCHOOLS IN NWFP
In 2001, there were approximately 62,000 teachers and approximately 22,200
primary schools in NWFP. Primary schools in NWFP offer six classes. Grade 1 for junior
is usually called “kachi” and “packi” grade and Grade II for senior is for classes 2-6. No
school may refuse access to a child on gender grounds. Boys are attending girl’s schools, if
the school is considered better than the male school. In the opposite case, i.e. girls
attending boy’s schools is even more frequent i. e 12% of the pupils in boys schools are
actually girls but for different reasons that might show,
there is no girl’s school around or it shows the demand of parents for education for girls
too.
2.12 PRIMARY EDUCATION AT DISTRICT LEVEL(UPTO JUNE, 2001)
According to EDO’s office Haripur District, in 24 districts of NWFP, the District
Education Officers (male) and their staff were in charge of the boy’s primary schools and
the DEO (female) headed each district as in charge of the girls primary schools. A District
Education Officer was supposed to have one Dy. District Education Officer, (Dy. DEO),

51
one or two Sub Divisional District Education Officers (SDEO), three to four Assistant
District Education Officers (ADEO), several Assistant Sub Divisional Education Officers
(ASDEO), and one Learning Coordinator (LC) for approximately 30 to 80 schools or even
more in some female schools. L.C.s were supposed to reach out their schools for
supervision and guidance. Male District Education Offices were considerably better staffed
than female offices due to a more favorable location of posts and because female posts
often remained vacant for lack of suitable and interested female candidates.
2.13 PRIMARY EDUCATION AT DISTRICT LEVEL FROM JULY 2001 TODATE
In the course of power devolution, several changes were introduced. Two
subdivisions were given the district status and now there are 24 districts in NWFP. The
district structure has been totally changed. An EDO (Executive District Officer) who is in
charge of primary and secondary schools in the district now heads the education
department in respective districts. There are three District Officers (DO) posts, (DO
primary education and Literacy DO Administration and Development and DO secondary
education). This means, male and female primary schools are managed on district level by
the same DO. Each DO is supported in his/her work by three ADOs, Assistant District
Officers. The SDEO posts are replaced by DDO (Dy/ District Officer male and female),
managing the previous sub divisional offices. On sub-divisional level, 771 LCs posts are
abolished. There are now posts for ADDOs (Assistant Deputy District Officers) 220
ADDOs for all over the province i.e. one ADDO/TT and one ADDO (insp) for
approximately 100 schools.

52
2.14 TEACHER TRAINING PROGRAMMES IN NWFP
Teacher education is the most neglected area in the education sub-sector of the
country. Therefore this sub-sector needs special attention. Besides the regular steps taken
for the staff development by the Directorate of Primary Education NWFP, a number of
projects funded by foreign agencies in the form of loans/grants are also engaged in
imparting training to the teachers and educational administrators at primary level.
According to EDO, Abbottabad report, in NWFP there are different programs of
teacher training being offered in colleges/institutes/departments of education for the
training of primary school teachers, secondary school teachers and supervisors. Colleges of
Education offer two kinds of programs such as PTC (Primary Teaching Certificate), a C.T
(Certificate in teaching) for the training of elementary level teachers. There are two types
of programs being offered for the training of secondary schools teachers i.e. one year B.Ed
programme (14+1) Model and three year BA/B.Sc. + B.Ed programme (12+3) Model.
Supervisors and administrators are also being trained in the institutes of education and
research and departments of education in the universities. These institutes/departments
offer courses leading to M.Ed or M. A (Education) degree. In N.W.F.P. following teacher
programs have been functioning till 2002.
2.14.1 Short Term Courses
Training and Supervision Cell, NWFP, provided the background of short-term
courses in N.W.F.P. that during the period 1982-90 the untrained teachers who had three
years continuous service at their credit were allowed to under go short-term courses of

53
three months durating vacations in high schools. Trained teachers of high schools acted as
instructors. After completion of course they had to pass the external examination in theory
and practice of teaching for earning for PTC certificate. Certificates holders of this
programme were considered trained and at par with those who have under gone proper pre-
service training. Ratio between the number of trainees who have undergone pre-service
and short-term courses were about 1:3 respectively. In NWFP cost for pre-service training
was Rs.700/- per trainee, where as for short-term courses the cost was Rs.300/- only. The
education extension center Abbottabad trained about 2066 untrained teachers during the
year 1982-83 to 1989-90.
2.14.2 Education Extension Centre
According to a report of Education Extension center, Abbottabad, the center
established in 1964 at Abbottabad works under the direct control of Director Curriculum
Bureau. The centre arranges in-service training programmes either on their own premises
or at regional centers established for the purpose. Short-term courses of two to four week's
duration were held throughout the year depending upon the resource availability.
The aim of this training was to develop the competency of working teachers in
teaching methods and techniques as well as improving their mastery of content. The topics
covered in the courses also included lesson planning and presentation, the use of text books
and home assignments evaluation, guidance, and discipline and co curricular activities. The
education extension center mission was:
1. To help working teachers to refresh their knowledge

54
2. To develop teachers skills in order to improve class room teaching
3. To enable teachers to formulate instructional objectives for their
lessons
4. To enable teachers to prepare valid achievement test
5. To change teachers attitude towards accepting innovations and
changes in the field of education.
The policy requires that training be imparted to all teachers with in a cycle of five
years but output of these centers revealed that this could not be achieved due to financial
and staff constraints. Education extension centers have limited capacity and resources to
provide in-service training for all the teachers.
2.14.3 Govt. Colleges of In-service Education
In NWFP, there are two in-service colleges of education, one for male and other for
female teachers. They have conducted only orientation/refresher courses of three months
duration for two to three years. The number of teachers given in-service training by these
institutions is almost negligible as compared to total number of existing strength.
2.14.4 Primary Orientation Course Project
Through the distance education system of AIOU, a Project i.e. Primary Teachers
Orientation Course was launched in 1976. Through this course 83,000 in-service primary
teachers including N.W.F.P. were enrolled upto 1985. Out of these teachers 32,000
teachers could pass the course. The course was theoretical in nature. The course had a
limited impact on the quality of primary education in Pakistan. A need was felt to develop

55
and launch a course with necessary practical component so that primary education in
country could be improved.
2.14.5 New Primary Teachers Orientation Project
This Project was launched by AIOU with the collaboration of Royal Norwegian
Government with a capital cost of Rs.57.346 million which was raised to Rs.97.346
million in December, 1996 with increase in its target i.e. 51000 teachers. The main aim of
the project was to enhance the quality of working primary teachers with respect to selected
teaching competencies supported with media i.e. T.V, Radio, Video on Micro-teaching and
thus to improve their teaching skills. Through this project in-service primary teachers who
have not had any previous orientation in the new methodologies and teaching skills were
trained.
The New PTOC was unique in the sense as it was directly related to the objectives
of primary educational curriculum, which was an integrated part of the teachers training
programme at the primary level. It emphasized both the content and the methodology of
primary level programme, which deemed to be essential for the qualitative improvement of
primary education in Pakistan. According to AIOU, N-PTOC. (1991, p.3) it has following
objectives;
i. Up-dating 50,000 primary teachers to the current teaching strategies and methodology and relate them to cognitive development with special emphasis on reading, guidance and counseling.
ii. Integrating the teaching techniques with the current curriculum and textbook.
iii. Enriching the New PTOC by adding a practical component of two workshops, one in the middle of semester and one at the end.

56
iv. Enriching the New PTOC course work with media support i.e. T.V, Radio and Video on microteaching.
v. Monitoring the tutoring and supervision aspects of the course.
Through this Project the teachers were trained with special reference to:
1. The current teaching strategies and methodologies
2. Integrating the teaching techniques with the current curriculum
3. The practical component was emphasized through workshops
The cost per trainee was Rs.2276/- as indicated in different reports of the
NPTOC project. Text Material of New PTOC comprised 18 units which were
organized in the following 5 blocks.
Block No. Name of block
1. Expository block
2. Pedagogy Block
3. Humanities Block
4 4. Mathematics block
5 5. Science Block
In order to make New PTOC affective: the course was supplemented with two T.V
and five radio programs. These programs were related to different units of the text. After
every fortnight a tutorial was held. During tutorials, students asked questions from their
respective tutors. These questions were based on the difficulties faced while studying the
units. There were six tutorials altogether and attendance in four was obligatory. During
each semester, every trainee was expected to complete four assignments and at the end of

57
semester written examination was held. The trainees thus completing four assignments
successfully, pass written examination and have attended two workshops were awarded
completion certificates. Two training workshops were held one in the middle of the course,
which was of three days while the other was held at the end of the course and was of six
days. Micro teaching was one of the important components of these workshops.
2.14.6 Primary Education Programme Improvement Of Learning Environment (PEP-ILE)
According to Shah, M.H. (2001, pp.7-11) This programme was an initiative of the
Government of NWFP, Directorate of Primary Education, with technical assistance from
GTZ and NEDA and was designed to improve the quality of learning outcomes in primary
class room through the inputs in teaching learning materials and teachers training. The
programme become operational in the year, 1997-98 for a term of five years, extendable to
such time span as it may take to reach the whole of NWFP primary schools, covering all
the six grades of primary school. Starting with materials and training input in kachi grade
of five districts in 1997, it has been expanding each year to other districts and another
grade of children schools (kachi to grade-5)”.
PEP-ILE ventured to provide inputs for quality of primary education in NWFP
through improved teaching/learning materials and teacher behavior more conducive to
learning, imparted through a series of training. The task is over awing both in nature and

58
size. Addressing as many as 17,000 schools, 52,000 teachers and about 1,800.000 children
demands an unlimited source of energy and strength, which could only be sought through
phasing it over a period of four year for reaching all the districts and five years in covering
all the school grades.
A team of experts at TTMDC (teacher training and material development cell)
developed material for the programme, another organ of the primary directorate, PEP-ILE
designs, develops and disseminates the training with the active involvement of the district
level management. Each year a grade-specific batch of teachers is trained three times, and
by the end of the academic year, 1998-99, PEP-ILE, had trained as many as 17,000
teachers from 11 districts in pupil-active methodology, which is a part of an improved
learning environment.
The PEP-ILE through repeated testing and review developed an approach to in-
service training suitable for the teachers of NWFP in Pakistan. The approach was three-
pronged:
- Development of new teaching-learning material(new textbooks and works books, teacher guides)- Training of teachers in the proper use of the new material, in content matters and in general teaching skills- Support of districts in the implementation of the new approach by monthly review meeting school visits and general logistics.
The aim of the training through this programme was to help as many teachers as
possible to make their teaching more effective and attractive. The programme offered a
varied methodology, i.e. using group work, asking interesting questions, involving pupils
actively through learning games, observations, dealing with objects, telling stories,

59
introducing and concluding each topic properly assisting pupils achievements and assisting
pupils individually. Objectives of PEP-ILE training according to Semiotics Consultants
(Pvt) report (1999, p.26) were:
1. To help the teachers make the children active participants in the learning process instead of being passive recipients of knowledge as practiced in traditional methods.
2. To improve the competence level of the teachers on the subject and the active learning methodology.
3. To familiarize them with new materials, curriculum, primers, and teachers’ guide.
4. To practice what has been learnt.
2.14.7 Primary Education Project
In this Project the component of learning coordinators were included with a view to
strengthen supervision and ensuring the continuous updating of teacher knowledge. The
learning coordinators provided academic guidance to the teachers; having been entrusted
the supervision of only six to nineteen schools. The headmasters and the learning
coordinators took a great load of that education centers. They really facilitated in service
training bringing it to the very doorsteps of the teachers. But in NWFP learning
coordinators were not given any training and most of the learning coordinators did not
know what their specific duties were and how their assignments differed from the ADEOs.
Being ignorant of the task assigned to them and having been given no training they were
unable to provide any professional guidance to the teachers. Thus this revolutionary step of
in-service training programme failed to achieve any thing substantial.

60
2.14.8 Teachers Training Project (TTP)
Primary Teachers Training Project (TTP) was initially launched in the year, 1992-
93. The Project has trained 9000 teachers during the first three years of its operation.
During the remaining two years, 4230 teachers were expected to be trained. A total of
13,230 teachers (23%) could get training under TTP out of total number of 56,667 teachers
on completion of the project. Per unit cost of training was Rs.1912/-. The curriculum for
in-service teachers training was developed through this project. The objectives of this
project according to Semiotics Consultants (Pvt) report (1999, p.25) were as under: -
1. To enhance the professional competence of the teachers
2. To acquaint the teachers with the modern teaching methodology.
3. To clarify the difficult concepts of the contents of various subjects.
4. To explain the primary curriculum
5. To prepare and discuss the list of difficult concepts of the subjects taught at the primary level
6. To provide additional information on different concepts of the various subjects included in the course
7. To make better use of the teaching kit
8. To help prepare the low cost and no cost teaching materials
9. To prepare specimen of topic review in various subjects.
10. To help prepare lessons plan and make practice.
One of the main achievements of the TTP is that of the establishment of Provincial
Institute of Teacher Education (PITE) at Peshawar, which is an apex-training institute and
it has started functioning in new situation.
2.14.9 Nazira Quran Training Project

61
This project was launched in various districts of N.W.F.P. The majority of the
participants of this training project were in position to read Holy Quran before attending
the course. Cost per trainee is not available. According to Semiotics Consultants (Pvt)
report (1999, p.26) The objectives of the Project were to trained the teachers with the
following aspects:
1. To familiarize teachers with effective teaching practices, evaluation and co-
curricular activities.
2. To encourage student teacher interaction in the class room
3. To familiarize the teacher with the decorative procedure of the classrooms,
maintenance of school record and proper use of registers.
4. To help the teacher develop a good relation among community parent’s teacher
and school kids.
5. To acquaint the participants with modern teaching techniques.
2.15 RESEARCH IN IN-SERVICE TRAINING
Some studies at different levels have been carried out about various aspects of in-
service teachers training programmes in Pakistan. This also includes term paper at M. Ed
and M. Phil level at AIOU and an independent study of Private Organizations. Brief detail
of some of them is given below:
2.15.1. Satti, Z.H, (1998) conducted a study of the effectiveness of N-PTOC Programme
in District Haripur N.W.F.P. He conducted the study for Master of Education at the
University of ARID Agriculture, Rawalpindi. The main objective of his study was to find
out the effectiveness of N-PTOC programme in improving the teaching skills of primary
schools teachers. He compared the performance of the N-PTOC teachers and Non PTOC

62
teachers in the male primary schools of district Haripur. Twenty-three N-PTOC teachers
enrolled in Spring, 1997 were taken as sample. The researcher in their actual classroom
observed performance of these N-PTOC trained teachers. For the purpose of comparison
the same Nos. of Non-PTOC Teachers with equal qualification were also observed in their
classroom. Observations were made on the basis of checklist prepared by the PTOC
Project. It was observed that the PTOC trained teachers performed better teaching with the
use of the following skills.
1. Set Induction
2. Effective Questioning
3. Listening
4. Re-enforcement
5. Gestures
6. Closing of lesson
7. Re-planning
The researcher recommended that wider samples might be taken to further evaluate
the effectiveness of this in-service training programme.
2.15.2 Mehmood, K. (1999)conducted study on; “Effectiveness of In-service Imparted
Through Teacher Training Project”. He conducted this study for his M.Phil Education at
the Department of Teacher Education, AIOU Islamabad. The main objectives of his study
were to identify the inputs achievements and methodology of in-service teacher training
programme. District Kasur and Sialkot of Punjab were included in the study and in-service
training of primary school teachers in the subjects of General Science and Mathematics
provided under Asian Development Bank were taken into consideration. Achievement

63
test, attitude scale, observation schedule and opinionaire were developed to find the
difference between the performance of experimental and controlled groups students.
Consequent the difference between the effectiveness of the teaching class-I
behavior of experimental and control group was investigated. The study revealed that
there was a significant difference between the achievement of the students of experimental
groups and control groups. The performance of the experimental group was better than the
performance of the students in control group. It was further revealed that nominations for
in-service training were not made in time; the participants of the training were satisfied
with the performance of the master trainers and the facilities provided to them.
2.15.3 Khurshid, M. (1998) conducted a study on “Effectiveness of PTOC Training on
the Classroom Performance of Female School Teachers in Rawalpindi District”. She
conducted the study of her M.Phil at AIOU. The main purpose of her study was to find out
the effectiveness of N-PTOC in-service teachers training programme launched by AIOU
Islamabad under the sponsorship of Norwegian Government. Classroom performance of
female primary teachers was observed. Only those teachers were taken who had been
enrolled for N-PTOC during the cycle of 1994-95 and 1995-96. A structured Performa
was used for the observations of classroom performance of PTC teachers with PTOC
training. One observation was made before the launching of N-PTOC 1994-95 and 1995-
96 semester. The 2nd observation was made after the completion of PTOC programme.
Classroom observation of the same teachers was made. In this way the pre-test and post-
test experimental design was used. It was clearly observed that N-PTOC in-service training
programme was effective with respect to different teaching skills. It was recommended that

64
questioning technique should be given more emphasis in the future launchings of N-PTOC
programme.
It was also recommended that the achievements based teaching might be used by
the N-PTOC. It was recommended to use the teaching kit during in-service training by the
concerned institutions.
2.15.4 Bukhari, T.A. (2000) conducted a study, “Development a model for In-service
Training of Teachers in Pakistan”. He completed this thesis for his Ph.D. in Education at
the University Institute of Education and Research Rawalpindi. The main purpose of the
study was to study the experiences of in-service teacher trainers in Pakistan and to develop
a model for in-service training of teachers in future. For this purpose a questionnaire was
developed on the basis of the study of literature on the prevalent in-service teachers
training programme. This questionnaire was administered to 240 teacher trainers in
Pakistan. The data collected was discussed in the seminars held with primary in-service
teachers training experts in Pakistan. On the basis of these discussions, model INSTOP
(in-service teachers' orientation programme) was developed. This model was designed on
the basis of content, input, process and product.
The main recommendation of this study was to develop the future in-service
teachers training orientation programme on INSTOP Model with respect to objectives,
content process and evaluation.
2.15.5 Hashmi, N. (1998) conducted a M.Phil research on the “Effectiveness of N-PTOC
Programme of AIOU”. For this purpose she observed the N-PTOC female graduates

65
working in the Primary schools in Bahawalpur and its surroundings villages and found that
the N-PTOC in-service training programme was effective in achieving the teaching skills
provided in the N-PTOC training programme. She recommended an intensive and in-
depth studies in the area by taking wider sample.
2.15.6 Semiotics (Pvt.) Islamabad (1999) conducted a study on “Study of the
Effectiveness of In-service Training Programs offered to Primary School Teachers in
N.W.F.P.” The agency conducted the study of different projects on in-service teachers
training programme in N.W.F.P. Provincial Implementation Unit, Teacher Training
Project, Education Department and Asian Development Bank sponsored the study.
Teachers Training Project, like PEP-ILE, GPEP and Nazira Quran Training Projects were
included in the study. The main objectives of the study were to know the objectives,
procedures and modalities of in-service training programs and also to know effects of in-
service training. To observe the performance of teachers with in-service training a
checklist comprising 36 points was developed in line with objectives of in-service training
programs. Another instrument i.e. structured interview was developed to get the views of
trained teachers regarding the merits and demerits of the in-service training and from the
organizations responsible for in-service training programme. The research team observed
those teachers in the classrooms who had got in-service training from any organization and
compared their performance with those who did not attend any course.
The research showed that there was a positive change towards improvement of the
performance of the trained teachers. Different ongoing projects were recommended to be
re-organize and redefine by the organizations working for in-service teachers. The study

66
recommended to coordinate the activities of all these organizations so that an integrated
training approach could be useful instead of effort in piece meal. The practical aspect of
the in-service training programme was recommended to be strengthened.
2.15.7 Khan, R. (2003) conducted a study on “Effectiveness of PEP-ILE Programme in
Tehsil Swabi”. He submitted his research thesis at M.Ed. level in the Department of
Teacher Education AIOU Islamabad. The main objectives of his study were to evaluate the
implementation of the program with respect to training, content, methodology, supervision
and assessment. The study also focused on effectiveness of PEP-ILE programme in the
educational development of Tehsil Swabi. The researcher developed a questionnaire
composed of 37 items. Items from 1 to 32 were related to different skills and other
information about students, whereas items from 32 to 37 were mostly related to general
atmosphere of the school. The questionnaire was distributed to 300 teachers of different
trained, untrained, high qualified, low qualified high experience and low-experienced
teachers. The questionnaire consisted different skills of the teachers such as presentation
skill, expression skill, written skill and their level/standard before and after PEP-ILE
training with respect to teacher's performance.
The findings of the study showed some improvement in the performance of the
trained teachers. Similarly there was significance difference between qualified and low
qualified teachers. The researcher recommended extension in training programme also at
middle and secondary level.
2.15.8 Project, N-PTOC (2001) conducted a study on the “Effectiveness of New

67
Primary Teachers Orientation Programme of Allama Iqbal Open University". The study
was carried out at the completion of the said project. The main objective of the study was
to see the effectiveness of the N-PTOC programme. For this purpose an observation
schedule was developed with necessary items. For the purpose of data collection the
researchers visited various regional offices of AIOU and constituted teams of observers
who were provided training for making observations. Decision about the effectiveness of
PTOC program was made on the basis of the difference of the means.
The findings of the study showed that there was a significant difference between
the performance of N-PTOC Teachers and Non PTOC Teachers with respect to application
of different teaching skills. The study also recommended the extension of the project to
train the remaining teachers through out the country.
2.15.9 Sinha, P. (1982) conducted a study, "Evaluative study of teacher education in
Bihar" for his Ph.D. The main objective of the study was to evaluate innovative
programmes of teacher education in Bihar and to see the impact of these programmes on
the quality of output. About forty-four primary teacher education colleges were randomly
selected for study. A questionnaire consisting forty items was prepared for the study. The
researcher through his personal visits to the relevant institutions and persons collected the
data. The main finding of the study was that in-service teachers training programmes were
not carried out effectively and there was little attention paid to follow up programme. He
recommended that objective oriented monitoring of the teachers training programmes
should be emphasized

68
2.15.10 Mohn, J.R. (1992) conducted a study on "Effectiveness of Teacher Training
Programmes in India". He conducted this study for his Ph.D. The main purpose of the
study was to see the effectiveness of on going teachers training programmes. The sample
of the study included ten teachers training colleges. Data was collected through
questionnaires. The finding of the study indicated problems in the area of physical
facilities, teachers educators, admission process, duration of teachers training programmes,
teaching practices and finally the examination process. The findings of the study revealed
that the efficiency of the programmes was not upto the mark. The researcher recommended
that the in-service teachers training programmes should be continued in future by
overcoming the deficiencies in the relevant areas.

69
CHAPTER 3
RESEARCH METHODOLOGY AND PROCEDURE
This chapter deals with the discussions of method and procedure of the study. For
the purpose of collecting relevant information and educational investigations following
method and procedure was adopted.
3.1 POPULATION
The Population of the study consisted of the following;
1. All five districts of Hazara Division
2. All 3609 (2331M and 1278F) Government primary schools in Hazara Division
3. All 2208 (1435M and 773F) trained primary school teachers (male & female) without in-service training
4. All 7828 (5166M and 2662F) trained primary school
teachers (male & female) with in-service training.
5. All Heads of 3609 Primary schools in Hazara Division
3.2 SAMPLE
1. Four districts i.e. Abbottabad, Batagram, Haripur and
Mansehra from Hazara Division were randomly selected.
2. 28 schools from each district were randomly chosen with
equal number of male and female schools and equal number of rural and urban
schools. However in some places the number of school varied.

70
3. Two teachers one with in-service training and one without
in-service training were taken from each school. In this way a total of 105
schools and 210 teachers formed the sample of the study.
4. Head of each of the sampled school was taken for his general views/comments
regarding the overall performance of the selected teacher.
Table 3.1 Profile of Primary Schools Teachers of Four Districts of Hazara Division
DISTRICT AREA PIT TEACHERS NIT TEACHERSNO OF TEACHERS
MALE FEMALE MALE FEMALE
MANSEHRA URBAN 7 7 7 7 28
RURAL 7 7 7 7 28
HARIPUR URBAN 7 7 7 7 28
RURAL 7 7 8 8 30
ABBOTABAD URBAN 7 7 7 7 28
RURAL 7 7 7 7 28
BATGRAM URBAN 5 5 5 5 20
RURAL 5 5 5 5 20
Total 210

71
3.3 SAMPLE SELECTION
Following procedure was adopted in the process of sampling:
The sample consisted four districts of Hazara Division, which were selected
randomly. 28 schools were taken randomly from each district with equal numbers of male
and female schools and equal numbers of rural and urban schools. In some districts the
number of schools varied. Hence total sample consists of about 210 teachers. Two
teachers one with in-service training and one without in-service training were taken from
each school. In this way the sample consisted 105 groups/schools and 210 teachers (male
and female) from the respective districts. From these schools one head teacher was also
taken for the purpose of getting his comments about the overall performance of the primary
teacher.
The researchers with a letter of supervisor (Annex "E") approached the EDO's of
four districts of Hazara Division on different dates in the year 2002. The total number of
primary schools (Male, female, Urban and Rural) were obtained with their detail addresses.
Besides the numbers and addresses of the schools, atleast one PIT one NIT teacher was
ensured there by probing into the available record in the concerned EDO’s office. After
having sufficient information regarding primary schools and teachers, the EDO’s letters
was obtained for permission to visit the said schools and for seeking cooperation of the
concerned teachers and head teachers. The researchers selected the primary schools with
PIT and NIT teachers randomly. Some of the schools were however identified by the EDO
office, which were convenient i.e. their contact by road and availability of both type of
teachers.

72
There were some limitations for the researcher and research associates as in some
of randomly selected schools, the teachers were not available on the visit day. therefore
they decided to visit some other schools in that area. In some schools the head teachers
were not available therefore such schools were also differed as without the head teachers
comments the process was not completed. It was however ensured strictly that in each
school there must be PIT and NIT teachers with their heads.
Similarly some limitations were about the subject being taught by the teachers. The
researchers were not in a position to propose any lesson or subject to a teacher for his/her
demonstration. Hence they had to depend on the teacher choice and preferences.
In some of the cases the teachers avoided to give model lesson with their thinking
that perhaps this might be a departmental proceedings for checking their performance after
getting training. In such cases the researchers had to differ the said school.
Generally, the teachers both PIT and NIT voluntarily demonstrated lessons and
they cooperated with the researcher either due to EDO’s directives, head teacher
instructions or the researcher’s motivation. However some of the teachers challenged the
observation process as they think it was not a proper way to see the efficiency of both the
groups (PIT and NIT). In some cases the head teachers were biased in giving their
comments regarding a particular teacher. They count for the teacher’s general dealing
instead of his professional teaching. However the researchers had the limitations to depend
on the head comments
3.4 INSTRUMENTS
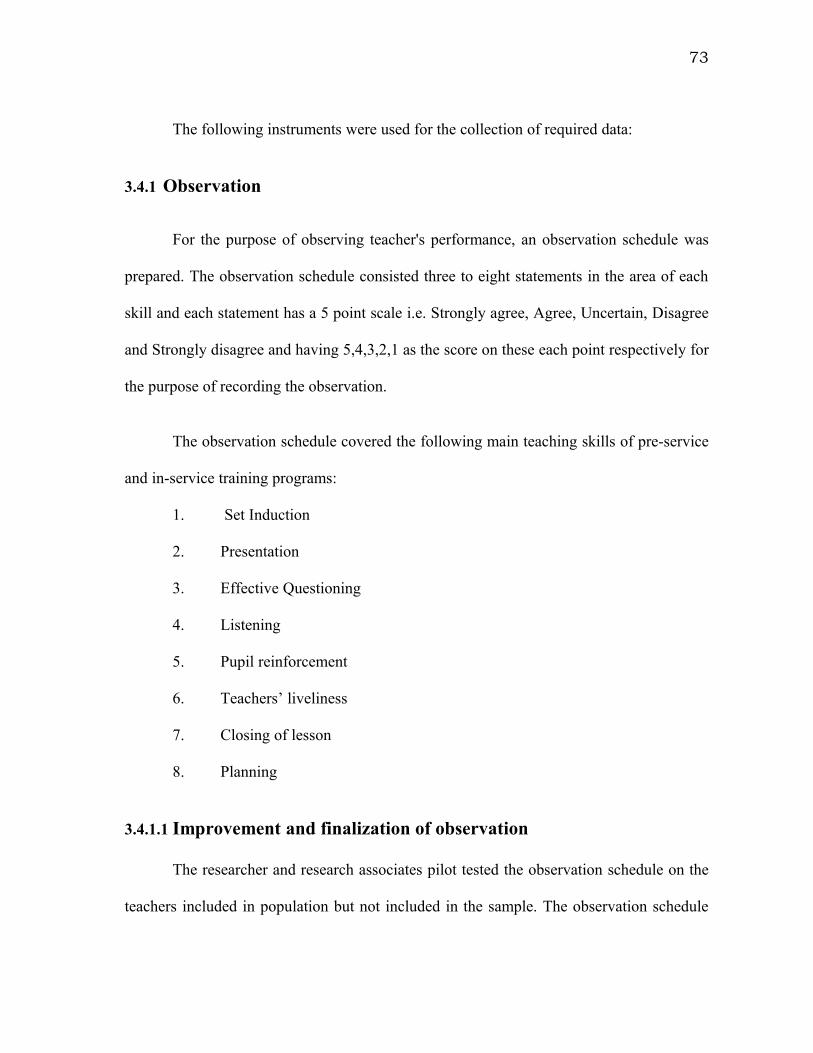
73
The following instruments were used for the collection of required data:
3.4.1 Observation
For the purpose of observing teacher's performance, an observation schedule was
prepared. The observation schedule consisted three to eight statements in the area of each
skill and each statement has a 5 point scale i.e. Strongly agree, Agree, Uncertain, Disagree
and Strongly disagree and having 5,4,3,2,1 as the score on these each point respectively for
the purpose of recording the observation.
The observation schedule covered the following main teaching skills of pre-service
and in-service training programs:
1. Set Induction
2. Presentation
3. Effective Questioning
4. Listening
5. Pupil reinforcement
6. Teachers’ liveliness
7. Closing of lesson
8. Planning
3.4.1.1 Improvement and finalization of observation
The researcher and research associates pilot tested the observation schedule on the
teachers included in population but not included in the sample. The observation schedule

74
was revised in the light of the feedback received as a result of pilot testing. In its final
form the observation schedule had eight items.
3.4.2 Questionnaire
A questionnaire was developed to get the opinions of the Head Teachers regarding
the overall performance of trained primary school teachers with and without in-service
training. The questionnaire was based on the following aspects:
1. Command on subject matter
2. Proper lesson planning before teaching lesson
3. Use of management skills in class
4. Use of A.V Aids in the class
5. Use of different teaching methods
6. Use of teaching kit
7. Partial re-capitulation of the lesson
8. Total re-capitulation of the lesson
9 Evaluation of the taught lesson
10 Assignment of home work to the students
3.4.2.1 Improvement and finalization of questionnaire
The researcher and research associates pilot tested the questionnaire on the head
teachers of primary schools included in population but not included in the sample. The

75
questionnaire was revised in the light of the feedback received as a result of pilot testing.
In its final form the questionnaire had 14 items.
3.5 PROCEDURE OF DATA COLLECTION
For the purpose of collection of required data nine research associates in four
districts were identified. Those research associates were preferred who had enough time
for data collection and were familiar with primary education and specially the primary
teachers. The observation schedule and questionnaire were discussed with them in detail in
joint meeting and after wards these tools were tried out through their effective
involvement. All aspects of both the research tools were analyzed with their input. They
were formally briefed about the administration of the research tools.
The research associate I was BA B.Ed. plus M.A. Urdu serving as SET and having
more than 15 years teaching experience. The researcher was familiar with primary
education. The researcher visited different schools both male and female in Haripur
district and collected data.
The research associate II was M.Sc. Botany, M.Ed and M.Phil student of AIOU
having about eight years teaching experience at primary level and presently serving as SET
in a Boys High School. He collected data from the urban rural, male and female schools of
Haripur.
The research associate III was M.A M.Ed having seven years teaching experience
at primary level and presently working as SET. The researcher collected data from
urban/rural and male/female schools of District Abbottabad.

76
The research associate IV was MA. M.Ed., Senior Tutor of N-PTOC Project and
Principal, GGHS, Abbottabad. The researcher was herself interested in such type of study.
She collected data from female schools of Abbottabad district.
The research associate V was M. Sc. Pakistan Study, M.Ed. and was serving as
Head master GMS (Boys). The researcher collected data from urban, rural and boys/girls
schools of Mansehra district.
Research associate VI was M.A. M.Ed. and EPM graduate serving as Assistant
District Officer, in EDOs Office, Mansehra. He collected required data from district
Mansehra.
Research associate VII was M. A, B.Ed serving as SET in GMS (girls) Mansehra.
She was involved in the data collection from Mansehra district.
Research associate VIII was M.A. M.Ed. and serving as SET at GHS (Boys)
Battagram. The researcher collected data from urban/rural areas of Battagram
Research associate IX was M.Sc. /M.Ed. and ADO in Battagram district having
more than 10 years teaching and administrative experience in primary education. He
collected data from urban/rural and boys/girls schools of Battagram.
The researcher X was M.A. Pol. Sc., M.A EPM and was serving as Lecturer in
EPM Department. The researcher has the experience of working as master trainer in

77
different in-service training programme of AIOU. The researcher visited all the districts
of Hazara Division and collected data by both the means.
The researcher and research associates visited all the randomly selected primary
schools of four districts of Hazara Division. The performance of the PIT and NIT teachers
in various subjects from Class I to Class V was observed by the researchers on the
developed instrument i.e. observation sheet. List of primary school teachers PIT and NIT
were collected from the EDO’s office of the relevant districts. Permission was also sought
from the respective EDO's office to observe the class room performance of the primary
teachers in their respective schools. Before proceeding on for observation of classroom
performance, the purpose was explained to the concerned teacher. Whatever, a
subject/class the primary teacher was to teach, the class room performance during that
period was observed. The researcher was seated at the back of the classroom and tick
marked the activity / performance of the teacher on the structured observation sheet.
The heads of the selected primary schools (i.e. from where the performance of the
PIT and NIT teachers was being observed) were also distributed a questionnaire containing
14 items. These items were about the overall performance of the concerned teachers. The
Head teachers were properly briefed to fill-in the said proforma and return on the spot.
3.6 ANALYSIS AND INTERPRETATION OF DATA
The performance of the teachers was observed according to the developed
observation schedule. The opinions of the head teachers regarding the overall performance
of their subordinate teachers were also got through the questionnaire including there in
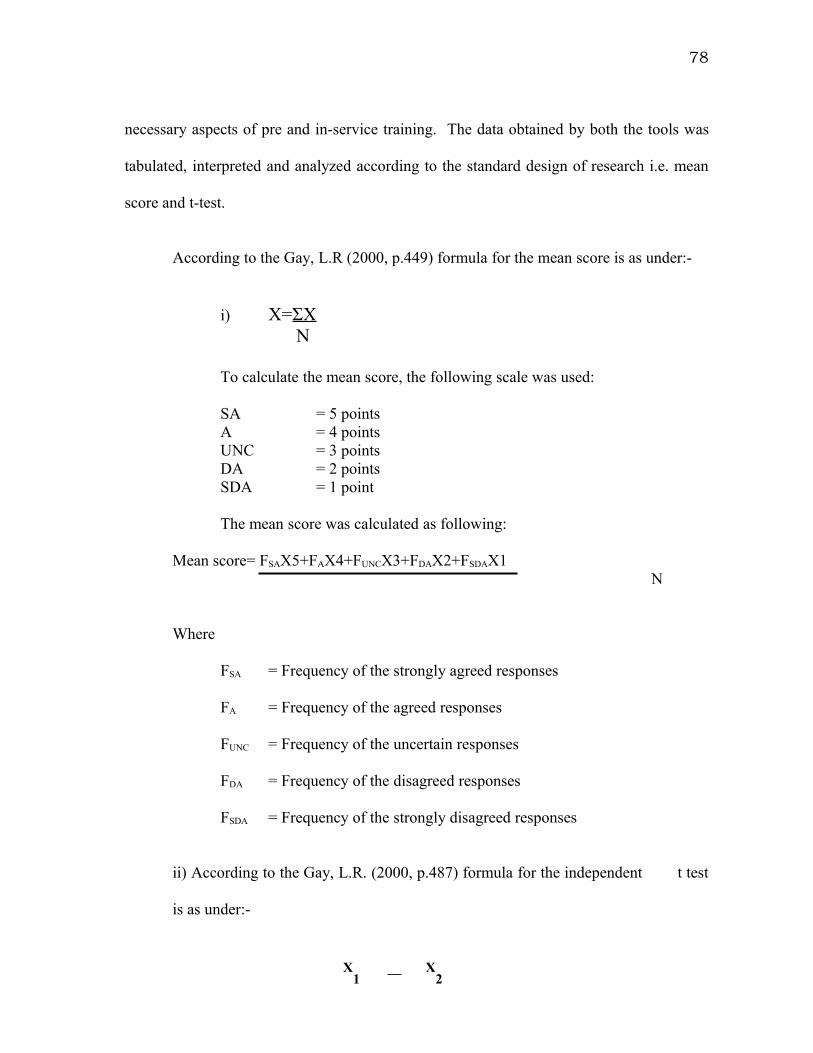
78
necessary aspects of pre and in-service training. The data obtained by both the tools was
tabulated, interpreted and analyzed according to the standard design of research i.e. mean
score and t-test.
According to the Gay, L.R (2000, p.449) formula for the mean score is as under:-
i) X=ΣX N
To calculate the mean score, the following scale was used:
SA = 5 pointsA = 4 pointsUNC = 3 pointsDA = 2 pointsSDA = 1 point
The mean score was calculated as following:
Mean score= FSAX5+FAX4+FUNCX3+FDAX2+FSDAX1N
Where
FSA = Frequency of the strongly agreed responses
FA = Frequency of the agreed responses
FUNC = Frequency of the uncertain responses
FDA = Frequency of the disagreed responses
FSDA = Frequency of the strongly disagreed responses
ii) According to the Gay, L.R. (2000, p.487) formula for the independent t test
is as under:-
X1
__
X2

t=
79
√ taking oc =0.05
The results were tabulated and analysed statistically as under:
i. Scores of group A were taken as X1 and scores of group B were taken as
X2
ii. Means of X1 and X2 were calculated.
iii. Sums and sums of squares for both were calculated then t test for
independent sample was applied.
SS1 + SS2 1 1
n1 + n2 - 2 n1 n2
80
CHAPTER 4
PRESENTATION AND ANALYSIS OF DATA
This chapter contains presentation and analysis of the data collected for the study.
The chapter is divided into three Parts.
Part-I consists of analysis of data collected through observation schedule. The data in this part has been presented in 40 tables (Table No. 4.1.1 to table No.4.5.8)
Part-II consists of analysis of data collected through the Questionnaire from the Head teachers. The data has been presented in 50 tables (Table No. 4.6.1 to 4.10.10)
Part-III shows the result of t test applied to both types of data
Part-I Analysis of data collected through observation schedule
In this section the data has been analyzed to compare the performance of PIT
teachers and NIT teachers, by gender, by region and by both gender and region
simultaneously. The observation schedule focused on eight teaching skill with three to
eight sub-items of each skill. The data collected through observation schedule has been
presented in tabular form. The tabulated data has been analyzed by calculating mean
scores and applying t test.

81
Part-II Analysis of data collected through questionnaire from Heads of primary schools.
This part contains analysis of data based on the comments of the Head teachers
regarding the overall performance of PIT teachers and NIT teachers, by gender, by region
and by both gender and region simultaneously. The questionnaire used to get the
comments of the head teachers had 14 items covering all the essential aspects of the
teaching (methodology and content). Analysis of the data of about 10 items has done in
tabular form with relevant description. The tabulated data has been analyzed by calculating
mean scores and applying t test.
Part-III Application of t test to both types of data
This part contains the results of application of t test to find out if the differences in
the groups under study were significant.
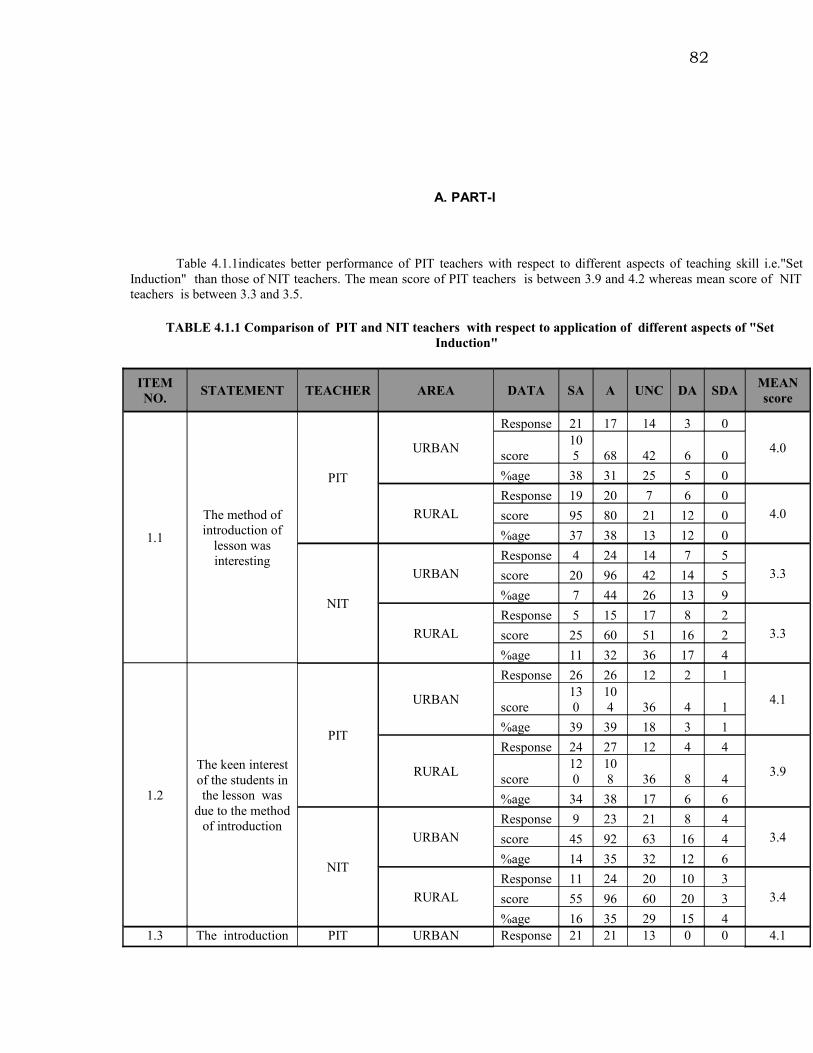
82
A. PART-I
Table 4.1.1indicates better performance of PIT teachers with respect to different aspects of teaching skill i.e."Set Induction" than those of NIT teachers. The mean score of PIT teachers is between 3.9 and 4.2 whereas mean score of NIT teachers is between 3.3 and 3.5.
TABLE 4.1.1 Comparison of PIT and NIT teachers with respect to application of different aspects of "Set Induction"
ITEM NO.
STATEMENT TEACHER AREA DATA SA A UNC DA SDAMEAN score
1.1
The method of introduction of
lesson was interesting
PIT
URBAN
Response 21 17 14 3 0
4.0score
105 68 42 6 0
%age 38 31 25 5 0
RURALResponse 19 20 7 6 0
4.0score 95 80 21 12 0
%age 37 38 13 12 0
NIT
URBANResponse 4 24 14 7 5
3.3score 20 96 42 14 5
%age 7 44 26 13 9
RURALResponse 5 15 17 8 2
3.3score 25 60 51 16 2
%age 11 32 36 17 4
1.2
The keen interest of the students in the lesson was
due to the method of introduction
PIT
URBAN
Response 26 26 12 2 1
4.1score
130
104 36 4 1
%age 39 39 18 3 1
RURAL
Response 24 27 12 4 4
3.9score
120
108 36 8 4
%age 34 38 17 6 6
NIT
URBANResponse 9 23 21 8 4
3.4score 45 92 63 16 4
%age 14 35 32 12 6
RURALResponse 11 24 20 10 3
3.4score 55 96 60 20 3
%age 16 35 29 15 41.3 The introduction PIT URBAN Response 21 21 13 0 0 4.1

83
of the lesson and the relation of
actual lesson was clear to the
students
score105 84 39 0 0
%age 38 38 24 0 0
RURAL
Response 22 21 9 1 0
4.2score
110 84 27 2 0
%age 42 40 17 2 0
NIT
URBANResponse 5 19 20 7 2
3.3score 25 76 60 14 2
%age 9 36 38 13 4
RURALResponse 5 23 17 6 1
3.5score 25 92 51 12 1
%age 10 44 33 12 2

84
Table 4.1.2 reveals better performance of PIT teachers with respect to the application of different aspects of teaching skill i.e. "Presentation". The mean score of PIT teachers is between 3.9 and 4.2 whereas mean score of NIT teachers is between 3.3 and 3.5.
Table 4.1.2 Comparison of the performance of PIT and NIT teachers with respect to different aspects of "Presentation"
ITEM NO.
STATEMENT TEACHER AREA DATA SA A UNC DA SDAMEAN score
2.1
Explanation was fully
comprehensive to the students
PIT
URBAN
Response 19 27 9 2 0
4.1score 95
108 27 4 0
%age 33 47 16 4 0
RURALResponse 19 22 8 3 0
4.1score 95 88 24 6 0
%age 37 42 15 6 0
NIT
URBANResponse 5 16 21 8 2
3.3score 25 64 63 16 2
%age 10 31 40 15 4
RURALResponse 5 17 16 11 1
3.3score 25 68 48 22 1
%age 10 34 32 22 2
2.2
The students were impressed
by the explanation.
PIT
URBAN
Response 15 30 7 3 0
4.0score 75
120 21 6 0
%age 27 55 13 5 0
RURAL
Response 20 24 6 1 0
4.2score
100 96 18 2 0
%age 39 47 12 2 0
NIT
URBANResponse 6 19 20 7 1
3.4score 30 76 60 14 1
%age 11 36 38 13 2
RURALResponse 4 20 20 4 0
3.5score 20 80 60 8 0
%age 8 42 42 8 02.3 Explanation
covered the PIT URBAN Response 17 23 13 1 0 4.0
score 85 92 39 2 0

85
important points
%age 31 43 24 2 0
RURAL
Response 23 20 8 1 0
4.3score
115 80 24 2 0
%age 44 38 15 2 0
NIT
URBANResponse 3 19 21 8 1
3.3score 15 76 63 16 1
%age 6 37 40 15 2
RURALResponse 5 19 24 1 1
3.5score 25 76 72 2 1
%age 10 38 48 2 2
ITEM NO.
STATEMENT TEACHER AREA DATA SA A UNC DA SDAMEAN SCORE
2.4
Demonstrated models, pictures
and examples were source of interest to the
students
PIT
URBAN
Response 20 22 11 2 0
4.1score
100 88 33 4 0
%age 36 40 20 4 0
RURAL
Response 20 21 9 0 0
4.2score
100 84 27 0 0
%age 40 42 18 0 0
NIT
URBANResponse 3 19 22 10 1
3.2score 15 76 66 20 1
%age 5 35 40 18 2
RURALResponse 5 21 18 5 1
3.5score 25 84 54 10 1
%age 10 42 36 10 2
2.5
Demonstrated models, pictures
and examples were up to the mental level of
the students
PIT
URBAN
Response 16 26 6 2 0
4.1score 80
104 18 4 0
%age 32 52 12 4 0
RURAL
Response 22 19 9 0 0
4.3score
110 76 27 0 0
%age 44 38 18 0 0
NIT
URBANResponse 6 17 21 8 1
3.4score 30 68 63 16 1
%age 11 32 40 15 2
RURAL
Response 3 28 15 3 1
3.6score 15
112 45 6 1
%age 6 56 30 6 2

86
Table No.4.1.3 indicates better performance of the PIT teachers in the area of "Questioning". The mean score of PIT teachers is from 3.9 to 4.3 whereas mean score of NIT teachers is 3.1 to 3.4.
Table 4.1.3 Comparison of the performance of PIT and NIT teachers with respect to different aspects of "Questioning"
ITEM NO.
STATEMENT TEACHER AREA DATA SA A UNC DA SDAMEAN SCORE
3.1Questions were asked clearly
PIT
URBAN
Response 17 25 13 1 0
4.0score 85
100 39 2 0
%age 30 45 23 2 0
RURAL
Response 20 23 7 2 0
4.2score
100 92 21 4 0
%age 38 44 13 4 0
NIT
URBANResponse 3 16 23 9 1
3.2score 15 64 69 18 1
%age 6 31 44 17 2
RURALResponse 1 16 22 8 1
3.2score 5 64 66 16 1
%age 2 33 46 17 2
3.2
Questions were generally
comprehended by the students
PIT
URBANResponse 19 22 13 1 0
4.1score 95 88 39 2 0
%age 35 40 24 2 0
RURAL
Response 20 19 11 1 0
4.1score
100 76 33 2 0
%age 39 37 22 2 0
NIT
URBANResponse 4 15 26 6 1
3.3score 20 60 78 12 1
%age 8 29 50 12 2
RURALResponse 0 21 18 8 2
3.2score 0 84 54 16 2
%age 0 43 37 16 43.3 After
questioning the students were
PIT URBAN Response 14 27 13 2 0 3.9
score 70 108
39 4 0
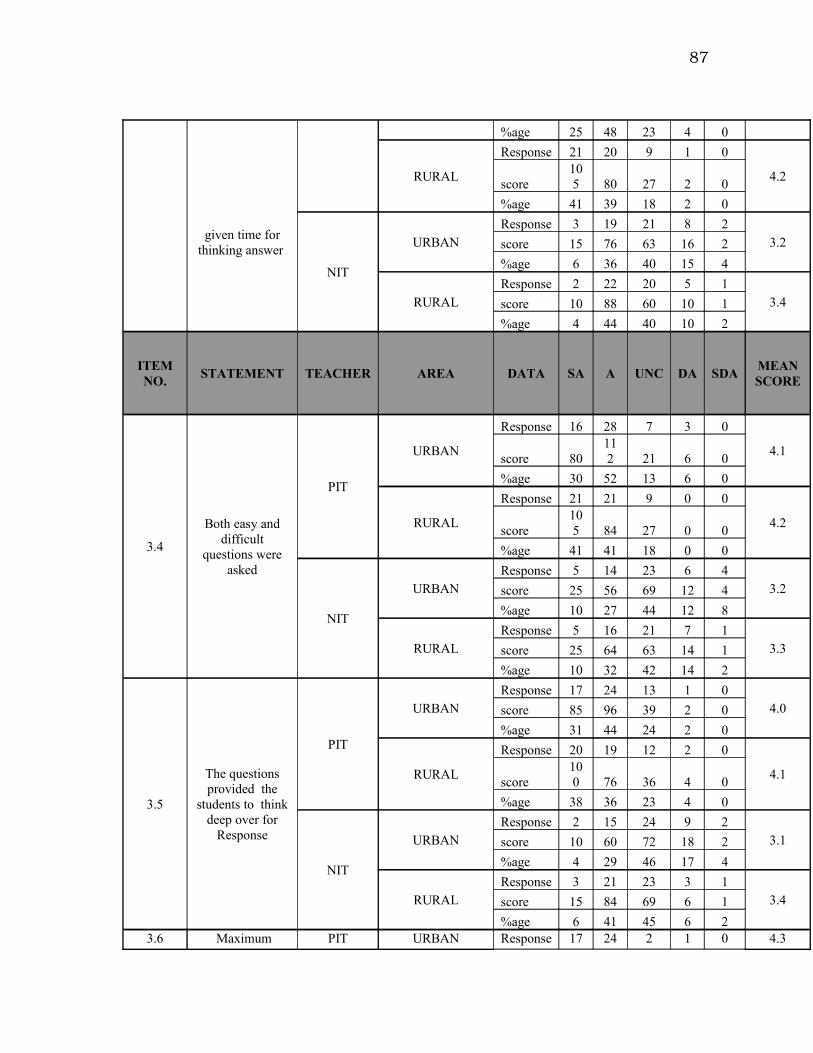
87
given time for thinking answer
%age 25 48 23 4 0
RURAL
Response 21 20 9 1 0
4.2score
105 80 27 2 0
%age 41 39 18 2 0
NIT
URBANResponse 3 19 21 8 2
3.2score 15 76 63 16 2
%age 6 36 40 15 4
RURALResponse 2 22 20 5 1
3.4score 10 88 60 10 1
%age 4 44 40 10 2
ITEM NO.
STATEMENT TEACHER AREA DATA SA A UNC DA SDAMEAN SCORE
3.4
Both easy and difficult
questions were asked
PIT
URBAN
Response 16 28 7 3 0
4.1score 80
112 21 6 0
%age 30 52 13 6 0
RURAL
Response 21 21 9 0 0
4.2score
105 84 27 0 0
%age 41 41 18 0 0
NIT
URBANResponse 5 14 23 6 4
3.2score 25 56 69 12 4
%age 10 27 44 12 8
RURALResponse 5 16 21 7 1
3.3score 25 64 63 14 1
%age 10 32 42 14 2
3.5
The questions provided the
students to think deep over for
Response
PIT
URBANResponse 17 24 13 1 0
4.0score 85 96 39 2 0
%age 31 44 24 2 0
RURAL
Response 20 19 12 2 0
4.1score
100 76 36 4 0
%age 38 36 23 4 0
NIT
URBANResponse 2 15 24 9 2
3.1score 10 60 72 18 2
%age 4 29 46 17 4
RURALResponse 3 21 23 3 1
3.4score 15 84 69 6 1
%age 6 41 45 6 23.6 Maximum PIT URBAN Response 17 24 2 1 0 4.3

88
students were asked questions in the given time
score 85 96 6 2 0
%age 39 55 5 2 0
RURALResponse 15 19 6 1 0
4.2score 75 76 18 2 0
%age 37 46 15 2 0
NIT
URBANResponse 4 14 21 2 0
3.5score 20 56 63 4 0
%age 10 34 51 5 0
RURALResponse 4 13 18 2 0
3.5score 20 52 54 4 0
%age 11 35 49 5 0
ITEM NO.
STATEMENT TEACHER AREA DATA SA A UNC DA SDAMEAN SCORE
3.7
Questions were relevant to the
under study lesson
PIT
URBAN
Response 20 26 9 1 0
4.2score
100
104 27 2 0
%age 36 46 16 2 0
RURAL
Response 21 21 9 2 0
4.2score
105 84 27 4 0
%age 40 40 17 4 0
NIT
URBANResponse 10 17 16 5 3
3.5score 50 68 48 10 3
%age 20 33 31 10 6
RURALResponse 6 18 18 6 1
3.4score 30 72 54 12 1
%age 12 37 37 12 2
3.8
Questions were asked only to
check the memory
PIT
URBAN
Response 24 12 17 2 1
4.0score
120 48 51 4 1
%age 43 21 30 4 2
RURALResponse 13 19 8 2 2
3.9score 65 76 24 4 2
%age 30 43 18 5 5
NIT
URBANResponse 5 10 20 8 3
3.1score 25 40 60 16 3
%age 11 22 43 17 7
RURALResponse 1 20 17 2 1
3.4score 5 80 51 4 1
%age 2 49 41 5 2

89
Table 4.1.4 exhibits better performance of PIT teachers with respect to different aspects of teaching skill I.e. "Listening". The mean score of PIT teachers ranges from 3.8 to 3.9 whereas mean score of NIT teachers ranges from 3.0 to 3.3.
Table 4.1.4 Comparison of the performance of PIT and NIT teachers with respect to different aspects of "Listening"
ITEM NO.
STATEMENT TEACHER AREA DATA SA A UNC DA SDAMEAN SCORE
4.1 Realized the
problems of the students on time
PIT
URBANResponse 11 20 19 6 0
3.6score 55 80 57 12 0
%age 20 36 34 11 0
RURAL
Response 7 27 16 1 2
3.7score 35
108 48 2 2
%age 13 51 30 2 4
NIT
URBANResponse 2 11 28 9 2
3.0score 10 44 84 18 2
%age 4 21 54 17 4
RURALResponse 2 15 17 14 1
3.1score 10 60 51 28 1
%age 4 31 35 29 2
4.2
The students were guided with respect to their
problems
PIT
URBAN
Response 8 27 15 4 0
3.7score 40
108 45 8 0
%age 15 50 28 7 0
RURALResponse 13 23 15 1 1
3.9score 65 92 45 2 1
%age 25 43 28 2 2
NIT
URBANResponse 2 14 24 9 2
3.1score 10 56 72 18 2
%age 4 27 47 18 4
RURALResponse 2 15 25 7 1
3.2score 10 60 75 14 1
%age 4 30 50 14 24.3 Steps were taken PIT URBAN Response 10 26 15 4 0 3.8
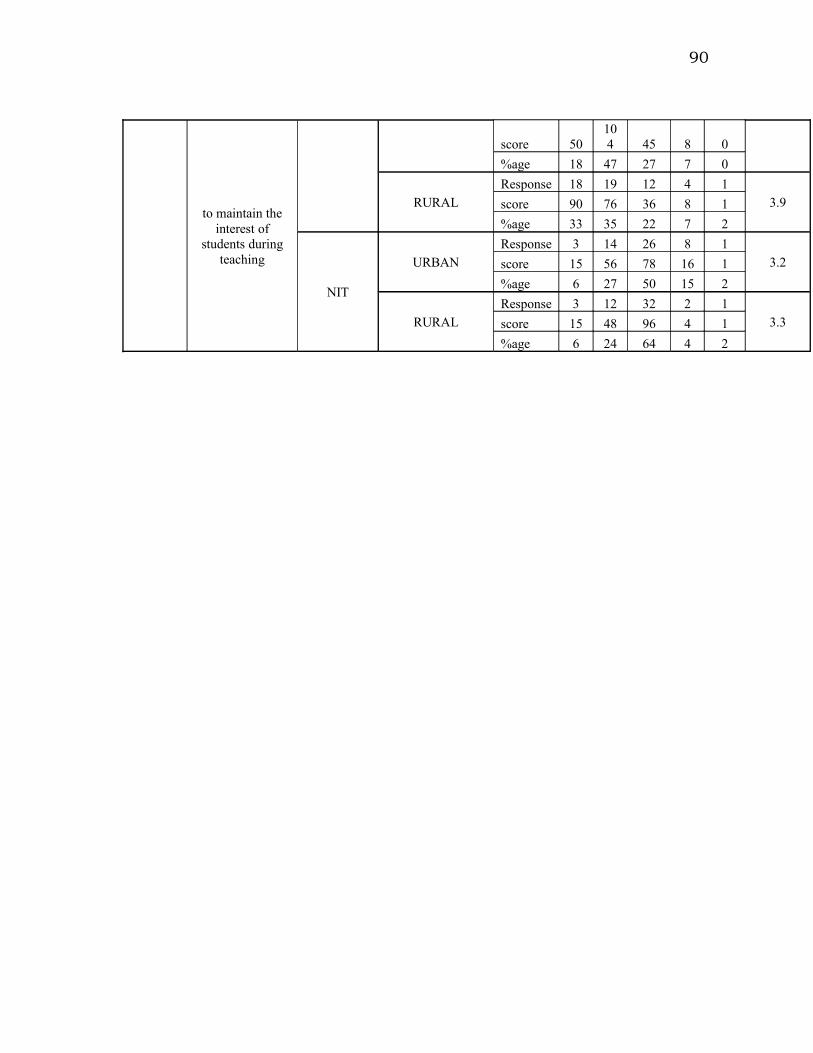
90
to maintain the interest of
students during teaching
score 50104 45 8 0
%age 18 47 27 7 0
RURALResponse 18 19 12 4 1
3.9score 90 76 36 8 1
%age 33 35 22 7 2
NIT
URBANResponse 3 14 26 8 1
3.2score 15 56 78 16 1
%age 6 27 50 15 2
RURALResponse 3 12 32 2 1
3.3score 15 48 96 4 1
%age 6 24 64 4 2

91
Table 4.1.5 indicates better performance of PIT teachers in the application of teaching skill i.e. "Motivation" and its different areas. The mean score of PIT teachers ranges between 3.7 to 4.2 whereas mean score NIT teachers ranges between 3.1 to 3.4.
Table 4.1.5 Comparison of the performance of PIT and NIT teachers with respect to different aspects of "Motivation"
ITEM NO.
STATEMENT TEACHER AREA DATA SA A UNC DA SDAMEAN SCORE
5.1
Words, phrases like "correct", “good", “very good", "fine"
and "excellent" were used during question/ answer
session.
PIT
URBAN
Response 10 22 16 6 0
3.7score 50 88 48 12 0
%age 19 41 30 11 0
RURAL
Response 16 24 12 1 1
4.0score 80 96 36 2 1
%age 30 44 22 2 2
NIT
URBAN
Response 4 9 30 5 4
3.1score 20 36 90 10 4
%age 8 17 58 10 8
RURAL
Response 3 23 17 8 1
3.4score 15 92 51 16 1
%age 6 44 33 15 2
5.2
Responses like "yes", "right"
and "good" were used on the
correct response of the students
for their encouragement
PIT
URBAN
Response 12 21 16 4 0
3.8score 60 84 48 8 0
%age 23 40 30 8 0
RURAL
Response 21 20 10 0 0
4.2score
105 80 30 0 0
%age 41 39 20 0 0
NIT
URBAN
Response 6 17 20 7 2
3.3score 30 68 60 14 2
%age 12 33 38 13 4
RURAL
Response 3 22 17 8 1
3.4score 15 88 51 16 1
%age 6 43 33 16 2

92
5.3
For the encouragement of
the students multiple gestures
like, "given smile" "yes yes" "now say" and "this is good
idea" were used
PIT
URBAN
Response 13 22 12 4 0
3.9score 65 88 36 8 0
%age 25 43 24 8 0
RURAL
Response 18 24 7 2 0
4.1score 90 96 21 4 0
%age 35 47 14 4 0
NIT
URBAN
Response 6 19 24 4 1
3.5score 30 76 72 8 1
%age 11 35 44 7 2
RURAL
Response 4 18 21 5 1
3.4score 20 72 63 10 1
%age 8 37 43 10 2
ITEM NO.
STATEMENT TEACHER AREA DATA SA A UNC DA SDAMEAN SCORE
5.4
The students were provided help for suitable
answer
PIT
URBAN
Response 10 27 11 2 2
3.8score 50
108 33 4 2
%age 19 52 21 4 4
RURALResponse 16 21 11 3 0
4.0score 80 84 33 6 0
%age 31 41 22 6 0
NIT
URBANResponse 3 15 21 12 2
3.1score 15 60 63 24 2
%age 6 28 40 23 4
RURALResponse 2 16 19 7 1
3.2score 10 64 57 14 1
%age 4 36 42 16 25.5 With the help of
simple instructions the students were
encouraged for correct response, e.g. "think over
again"
PIT
URBAN
Response 12 26 8 6 1
3.8score 60
104 24 12 1
%age 23 49 15 11 2
RURAL
Response 13 27 10 3 0
3.9score 65
108 30 6 0
%age 25 51 19 6 0NIT
URBANResponse 3 16 20 6 2
3.3score 15 64 60 12 2
%age 6 34 43 13 4RURAL Response 3 16 20 6 3 3.2
score 15 64 60 12 3

93
%age 6 33 42 13 6
5.6
Students were encouraged for correct part of
answer
PIT
URBANResponse 15 22 10 4 1
3.9score 75 88 30 8 1
%age 29 42 19 8 2
RURALResponse 16 20 15 0 0
4.0score 80 80 45 0 0
%age 31 39 29 0 0
NIT
URBANResponse 3 19 21 6 6
3.1score 15 76 63 12 6
%age 5 35 38 11 11
RURALResponse 2 19 20 5 2
3.3score 10 76 60 10 2
%age 4 40 42 10 4

94
Table 4.1.6 establishes better performance of PIT teachers in performing teaching skill i.e. "Teacher's Liveliness". The mean score of PIT teachers is from 3.8 to 4.3 whereas of NIT a teacher is from 3.0 to 3.4.
Table 4.1.6 Comparison of the performance of PIT and NIT teachers with respect to different aspects of "Teacher Liveliness"
ITEM NO.
STATEMENT TEACHER AREA DATA SA A UNC DA SDAMEAN SCORE
6.1
The teacher moved on proper time on teaching
place
PIT
URBAN
Response 20 21 11 2 0
4.1score
100 84 33 4 0
%age 37 39 20 4 0
RURALResponse 11 22 17 2 0
3.8score 55 88 51 4 0
%age 21 42 33 4 0
NIT
URBANResponse 7 12 20 8 3
3.2score 35 48 60 16 3
%age 14 24 40 16 6
RURALResponse 3 13 19 13 1
3.1score 15 52 57 26 1
%age 6 27 39 27 2
6.2
The teacher has made the
teaching method more effective
with the posture and gesture i.e.
"hands", "body", "head", "face",
PIT
URBAN
Response 21 23 8 4 0
4.1score
105 92 24 8 0
%age 38 41 14 7 0
RURALResponse 17 21 12 0 0
4.1score 85 84 36 0 0
%age 34 42 24 0 0
NIT
URBANResponse 3 24 14 6 3
3.4score 15 96 42 12 3
%age 6 48 28 12 6
RURALResponse 3 16 20 9 1
3.2score 15 64 60 18 1
%age 6 33 41 18 26.3 There was rise
and fall in the PIT URBAN Response 18 22 11 1 0 4.1
score 90 88 33 2 0

95
teacher's tone
%age 35 42 21 2 0
RURAL
Response 19 26 5 2 0
4.2score 95
104 15 4 0
%age 37 50 10 4 0
NIT
URBANResponse 7 14 21 8 1
3.4score 35 56 63 16 1
%age 14 27 41 16 2
RURALResponse 8 15 14 10 0
3.4score 40 60 42 20 0
%age 17 32 30 21 0
ITEM NO.
STATEMENT TEACHER AREA DATA SA A UNC DA SDAMEAN SCORE
6.4
The teacher adopted different teaching methods for attention and
motivation purposes e.g.
teachers students and
students' teachers group were made
PIT
URBAN
Response 12 21 10 6 0
3.8score 60 84 30 12 0
%age 24 43 20 12 0
RURAL
Response 20 17 12 1 0
4.1score
100 68 36 2 0
%age 40 34 24 2 0
NIT
URBAN
Response 2 16 18 11 2
3.1score 10 64 54 22 2
%age 4 33 37 22 4
RURAL
Response 3 13 17 9 2
3.1score 15 52 51 18 2
%age 7 30 39 20 56.5 Provision of
short interval. The students
were provided time to give attention and think over the
important points
PIT
URBAN
Response 14 22 11 3 0
3.9score 70 88 33 6 0
%age 28 44 22 6 0
RURAL
Response 23 16 7 2 0
4.3score
115 64 21 4 0
%age 48 33 15 4 0NIT
URBAN
Response 3 16 21 10 2
3.2score 15 64 63 20 2
%age 6 31 40 19 4RURAL Response 2 11 20 9 2 3.0

96
score 10 44 60 18 2
%age 5 25 45 20 5
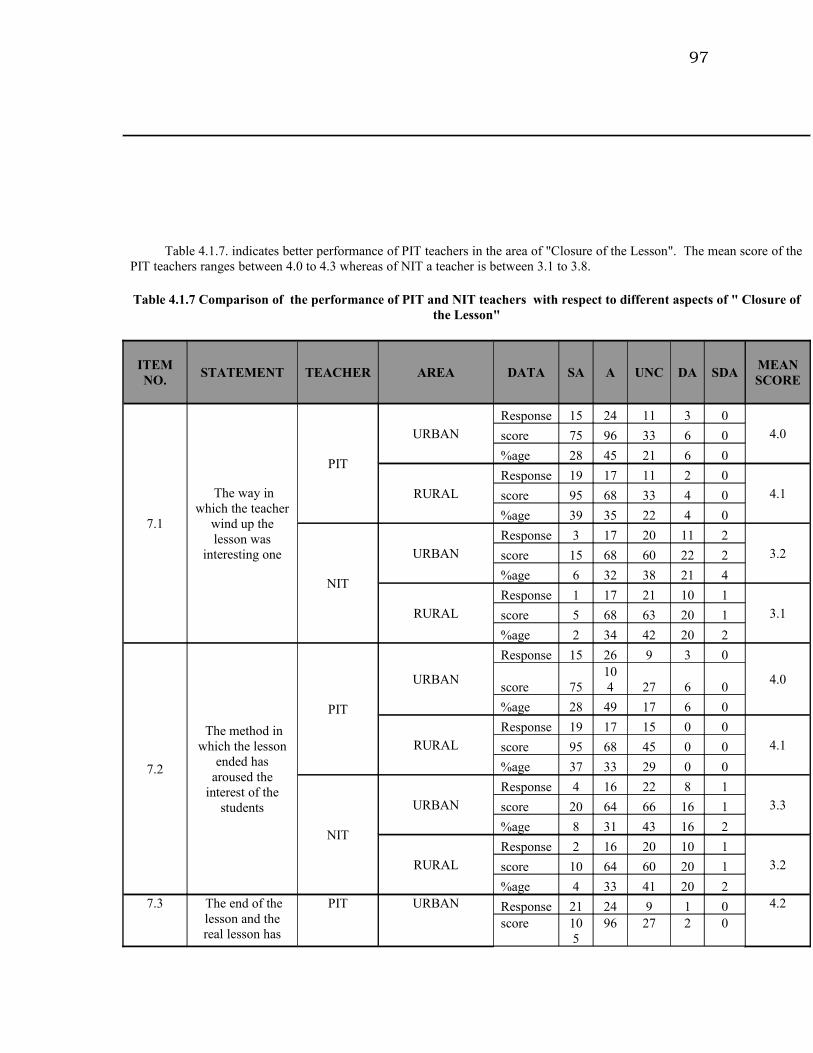
97
Table 4.1.7. indicates better performance of PIT teachers in the area of "Closure of the Lesson". The mean score of the PIT teachers ranges between 4.0 to 4.3 whereas of NIT a teacher is between 3.1 to 3.8.
Table 4.1.7 Comparison of the performance of PIT and NIT teachers with respect to different aspects of " Closure of the Lesson"
ITEM NO.
STATEMENT TEACHER AREA DATA SA A UNC DA SDAMEAN SCORE
7.1
The way in which the teacher
wind up the lesson was
interesting one
PIT
URBANResponse 15 24 11 3 0
4.0score 75 96 33 6 0
%age 28 45 21 6 0
RURALResponse 19 17 11 2 0
4.1score 95 68 33 4 0
%age 39 35 22 4 0
NIT
URBANResponse 3 17 20 11 2
3.2score 15 68 60 22 2
%age 6 32 38 21 4
RURALResponse 1 17 21 10 1
3.1score 5 68 63 20 1
%age 2 34 42 20 2
7.2
The method in which the lesson
ended has aroused the
interest of the students
PIT
URBAN
Response 15 26 9 3 0
4.0score 75
104 27 6 0
%age 28 49 17 6 0
RURALResponse 19 17 15 0 0
4.1score 95 68 45 0 0
%age 37 33 29 0 0
NIT
URBANResponse 4 16 22 8 1
3.3score 20 64 66 16 1
%age 8 31 43 16 2
RURALResponse 2 16 20 10 1
3.2score 10 64 60 20 1
%age 4 33 41 20 27.3 The end of the
lesson and the real lesson has
PIT URBAN Response 21 24 9 1 0 4.2
score 105
96 27 2 0

98
connectivity with each other
%age 38 44 16 2 0
RURALResponse 17 23 11 1 0
4.1score 85 92 33 2 0
%age 33 44 21 2 0
NIT
URBANResponse 2 19 18 9 2
3.2score 10 76 54 18 2
%age 4 38 36 18 4
RURALResponse 2 16 23 8 0
3.2score 10 64 69 16 0
%age 4 33 47 16 0
ITEM NO.
STATEMENT TEACHER AREA DATA SA A UNC DA SDAMEAN SCORE
7.4
The conclusion of the lesson was
the sum up of actual lesson and was also clear to
the students
PIT
URBAN
Response 18 27 8 1 0
4.1score 90
108 24 2 0
%age 33 50 15 2 0
RURALResponse 14 24 13 0 0
4.0score 70 96 39 0 0
%age 27 47 25 0 0
NIT
URBANResponse 2 19 17 9 2
3.2score 10 76 51 18 2
%age 4 39 35 18 4
RURALResponse 2 20 19 3 1
3.4score 10 80 57 6 1
%age 4 44 42 7 2
7.5 Revision of
lesson was done
PIT
URBAN
Response 21 21 11 1 0
4.1score
105 84 33 2 0
%age 39 39 20 2 0
RURAL
Response 24 17 8 2 0
4.2score
120 68 24 4 0
%age 47 33 16 4 0
NIT
URBANResponse 5 21 18 6 0
3.5score 25 84 54 12 0
%age 10 42 36 12 0
RURAL
Response 8 28 10 1 2
3.8score 40
112 30 2 2
%age 16 57 20 2 47.6 Home work was
given to the PIT URBAN Response 19 19 14 1 0 4.1
score 95 76 42 2 0
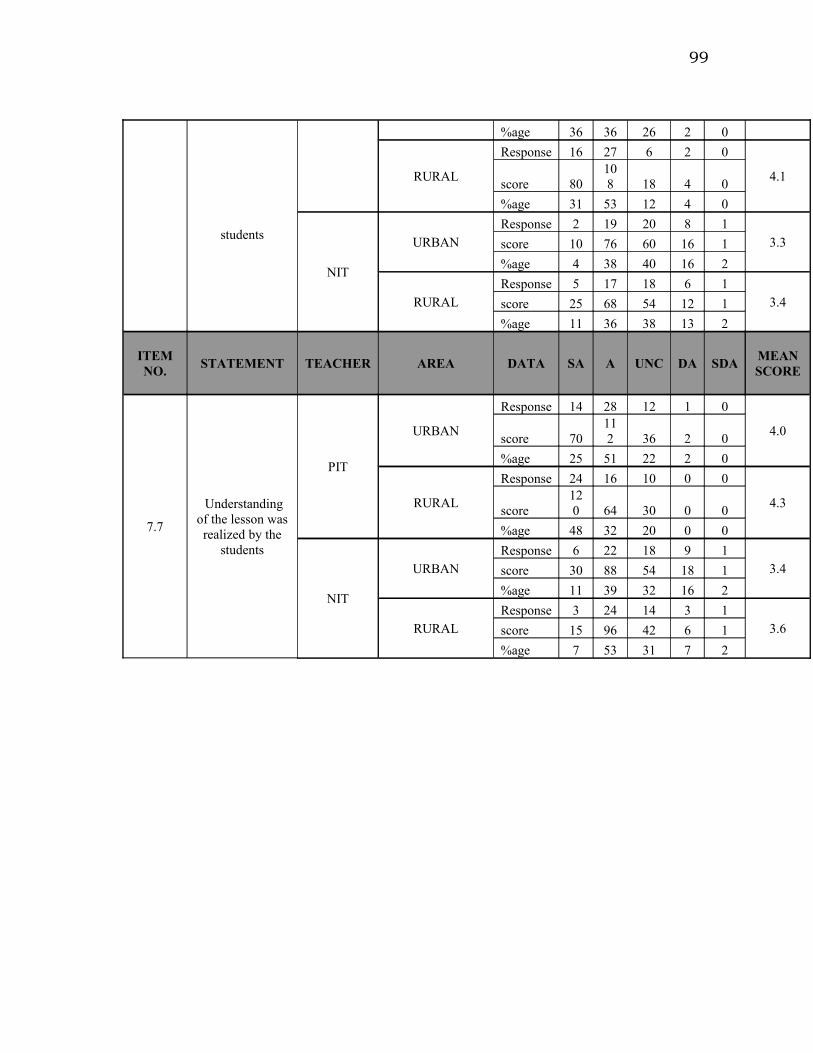
99
students
%age 36 36 26 2 0
RURAL
Response 16 27 6 2 0
4.1score 80
108 18 4 0
%age 31 53 12 4 0
NIT
URBANResponse 2 19 20 8 1
3.3score 10 76 60 16 1
%age 4 38 40 16 2
RURALResponse 5 17 18 6 1
3.4score 25 68 54 12 1
%age 11 36 38 13 2
ITEM NO.
STATEMENT TEACHER AREA DATA SA A UNC DA SDAMEAN SCORE
7.7
Understanding of the lesson was realized by the
students
PIT
URBAN
Response 14 28 12 1 0
4.0score 70
112 36 2 0
%age 25 51 22 2 0
RURAL
Response 24 16 10 0 0
4.3score
120 64 30 0 0
%age 48 32 20 0 0
NIT
URBANResponse 6 22 18 9 1
3.4score 30 88 54 18 1
%age 11 39 32 16 2
RURALResponse 3 24 14 3 1
3.6score 15 96 42 6 1
%age 7 53 31 7 2
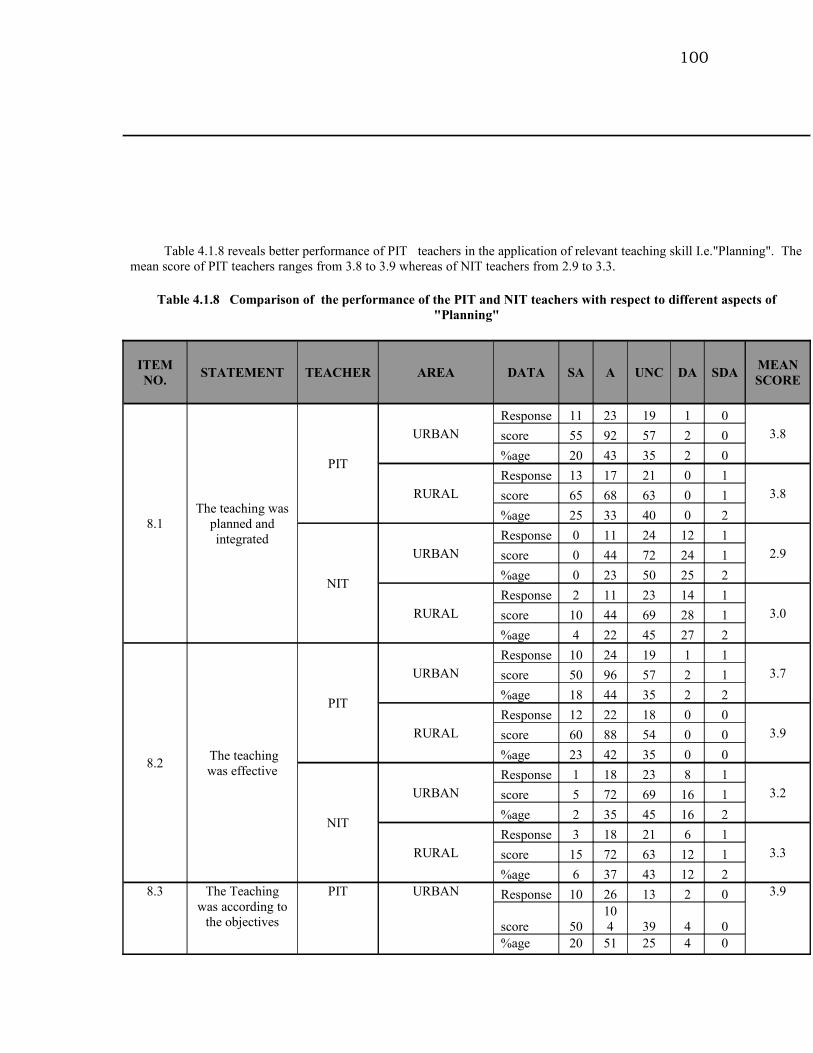
100
Table 4.1.8 reveals better performance of PIT teachers in the application of relevant teaching skill I.e."Planning". The mean score of PIT teachers ranges from 3.8 to 3.9 whereas of NIT teachers from 2.9 to 3.3.
Table 4.1.8 Comparison of the performance of the PIT and NIT teachers with respect to different aspects of "Planning"
ITEM NO.
STATEMENT TEACHER AREA DATA SA A UNC DA SDAMEAN SCORE
8.1The teaching was
planned and integrated
PIT
URBANResponse 11 23 19 1 0
3.8score 55 92 57 2 0
%age 20 43 35 2 0
RURALResponse 13 17 21 0 1
3.8score 65 68 63 0 1
%age 25 33 40 0 2
NIT
URBANResponse 0 11 24 12 1
2.9score 0 44 72 24 1
%age 0 23 50 25 2
RURALResponse 2 11 23 14 1
3.0score 10 44 69 28 1
%age 4 22 45 27 2
8.2 The teaching was effective
PIT
URBANResponse 10 24 19 1 1
3.7score 50 96 57 2 1
%age 18 44 35 2 2
RURALResponse 12 22 18 0 0
3.9score 60 88 54 0 0
%age 23 42 35 0 0
NIT
URBANResponse 1 18 23 8 1
3.2score 5 72 69 16 1
%age 2 35 45 16 2
RURALResponse 3 18 21 6 1
3.3score 15 72 63 12 1
%age 6 37 43 12 28.3 The Teaching
was according to the objectives
PIT URBAN Response 10 26 13 2 0 3.9
score 50104 39 4 0
%age 20 51 25 4 0

101
RURALResponse 16 19 15 1 1
3.9score 80 76 45 2 1
%age 31 37 29 2 2
NIT
URBANResponse 2 20 16 10 2
3.2score 10 80 48 20 2
%age 4 40 32 20 4
RURALResponse 6 10 21 8 1
3.3score 30 40 63 16 1
%age 13 22 46 17 2
ITEM NO.
STATEMENT TEACHER AREA DATA SA A UNC DA SDAMEAN SCORE
8.4
All the student's needs were
properly managed during
the teaching process
PIT
URBANResponse 13 24 14 1 0
3.9score 65 96 42 2 0
%age 25 46 27 2 0
RURALResponse 14 20 12 4 0
3.9score 70 80 36 8 0
%age 28 40 24 8 0
NIT
URBANResponse 4 15 20 11 2
3.2score 20 60 60 22 2
%age 8 29 38 21 4
RURALResponse 3 16 21 9 0
3.3score 15 64 63 18 0
%age 6 33 43 18 0

102
Table 4.1.9 depicts that the performance of PIT male teachers is better than PIT female teachers with respect to application to different aspects of teaching skill i.e."Set Induction". The mean score of PIT male teachers ranges from 4.1 to 4.3 whereas of PIT female teachers ranges from 3.9 to 4.1.
B. Table 4.1.9 Comparison of the performance of PIT male and PIT female teachers with respect to different aspects of "Set Induction"
ITEM NO.
STATEMENT TEACHER GENDER DATA SA A UNC DA SDAMEAN Score
1.1
The method of introduction of
lesson was interesting
PIT MALE
Response 24 16 8 6 0
4.1Score120 64 24 12 0
%age 44 30 15 11 0
NIT MALE
Response 6 22 14 4 4
3.4Score 30 88 42 8 4
%age 12 44 28 8 8
PIT FEMALE
Response 16 21 13 3 0
3.9Score 80 84 39 6 0
%age 30 40 25 6 0
NIT FEMALE
Response 3 17 17 11 3
3.1Score 15 68 51 22 3
%age 6 33 33 22 6
1.2
The keen interest of the students in the lesson was
due to the method of introduction
PIT MALE
Response 24 18 11 1 0
4.2Score120 72 33 2 0
%age 44 33 20 2 0
NIT MALE
Response 5 23 14 6 3
3.4Score 25 92 42 12 3
%age 10 45 27 12 6
PIT FEMALE
Response 16 27 7 1 3
4.0Score 80108 21 2 3
%age 30 50 13 2 6
NIT FEMALE
Response 5 16 21 8 2
3.3Score 25 64 63 16 2
%age 10 31 40 15 41.3 The introduction PIT MALE Response 27 15 10 1 0 4.3

103
of the lesson and the relation of
actual lesson was clear to the
students
Score135 60 30 2 0
%age 51 28 19 2 0
NIT MALE
Response 7 25 14 5 2
3.6Score 35100 42 10 2
%age 13 47 26 9 4
PIT FEMALE
Response 16 27 12 0 0
4.1Score 80108 36 0 0
%age 29 49 22 0 0
NIT FEMALE
Response 3 17 23 8 1
3.3Score 15 68 69 16 1
%age 6 33 44 15 2

104
Table 4.1.10 establishes that the performance of both the group is similar with respect to different aspect of teaching skill i.e."Presentation". The mean score of PIT male teachers is from 4.1 to 4.2 whereas mean score of PIT female teachers is from 4.1 to 4.2.
Table 4.1.10 Comparison of the performance of PIT male and PIT female teachers with respect to different aspects of "Presentation"
ITEM NO.
STATEMENT TEACHER GENDER DATA SA A UNC DA SDAMEAN Score
2.1
Explanation was fully
comprehensive to the students
PIT MALE
Response 20 23 8 3 0
4.1Score100 92 24 6 0
%age 37 43 15 6 0
NIT MALE
Response 3 17 19 10 3
3.1Score 15 68 57 20 3
%age 6 33 37 19 6
PIT FEMALE
Response 18 26 9 2 0
4.1Score 90104 27 4 0
%age 33 47 16 4 0
NIT FEMALE
Response 7 16 18 9 0
3.4Score 35 64 54 18 0
%age 14 32 36 18 0
2.2
The students were impressed
by the explanation.
PIT MALE
Response 19 27 8 0 0
4.2Score 95108 24 0 0
%age 35 50 15 0 0
NIT MALE
Response 3 21 22 5 1
3.4Score 15 84 66 10 1
%age 6 40 42 10 2
PIT FEMALE
Response 16 27 5 4 0
4.1Score 80108 15 8 0
%age 31 52 10 8 0
NIT FEMALE
Response 7 18 18 6 0
3.5Score 35 72 54 12 0
%age 14 37 37 12 02.3 Explanation PIT MALE Response 19 24 10 0 0 4.2

105
covered the important points
Score 95 96 30 0 0
%age 36 45 19 0 0
NIT MALE
Response 5 18 21 5 2
3.4Score 25 72 63 10 2
%age 10 35 41 10 4
PIT FEMALE
Response 21 19 11 2 0
4.1Score105 76 33 4 0
%age 40 36 21 4 0
NIT FEMALE
Response 3 20 24 4 0
3.4Score 15 80 72 8 0
%age 6 39 47 8 0ITEM NO.
STATEMENT TEACHER GENDER DATA SA A UNC DA SDAMEAN Score
2.4
Demonstrated models, pictures
and examples were source of interest to the
students
PIT MALE
Response 19 21 12 1 0
4.1Score 95 84 36 2 0
%age 36 40 23 2 0
NIT MALE
Response 1 25 17 7 2
3.3Score 5100 51 14 2
%age 2 48 33 13 4
PIT FEMALE
Response 21 22 8 1 0
4.2Score105 88 24 2 0
%age 40 42 15 2 0
NIT FEMALE
Response 7 15 23 8 0
3.4Score 35 60 69 16 0
%age 13 28 43 15 0
2.5
Demonstrated models, pictures
and examples were up to the mental level of
the students
PIT MALE
Response 19 25 5 1 0
4.2Score 95100 15 2 0
%age 38 50 10 2 0
NIT MALE
Response 5 25 14 6 2
3.5Score 25100 42 12 2
%age 10 48 27 12 4
PIT FEMALE
Response 19 20 10 1 0
4.1Score 95 80 30 2 0
%age 38 40 20 2 0
NIT FEMALE
Response 4 20 22 5 0
3.5Score 20 80 66 10 0
%age 8 39 43 10 0

106
Table No.4.1.11 indicates better performance of PIT female teachers with respect to the use of teaching skill i.e."Questioning". The mean score of PIT male teachers ranges from 4.1 to 4.2 whereas mean score of PIT female teachers’ ranges from 3.9 to 4.3.
Table 4.1.11 Comparison of the performance of PIT male and PIT female teachers with respect to different aspects of "Questioning"
ITEM NO.
STATEMENT TEACHER GENDER DATA SA A UNC DA SDAMEAN Score
3.1Questions were clearly asked
PIT MALE
Response 22 22 7 3 0
4.2Score110 88 21 6 0
%age 41 41 13 6 0
NIT MALE
Response 3 15 21 9 2
3.2Score 15 60 63 18 2
%age 6 30 42 18 4
PIT FEMALE
Response 15 26 13 0 0
4.0Score 75104 39 0 0
%age 28 48 24 0 0
NIT FEMALE
Response 1 17 24 8 0
3.2Score 5 68 72 16 0
%age 2 34 48 16 0
3.2
Questions were generally
comprehended by the students
PIT MALE
Response 22 17 12 1 0
4.2Score110 68 36 2 0
%age 42 33 23 2 0
NIT MALE
Response 3 19 19 6 3
3.3Score 15 76 57 12 3
%age 6 38 38 12 6
PIT FEMALE
Response 17 24 12 1 0
4.1Score 85 96 36 2 0
%age 31 44 22 2 0
NIT FEMALE
Response 1 17 25 8 0
3.2Score 5 68 75 16 0
%age 2 33 49 16 03.3 The students PIT MALE Response 19 22 11 1 0 4.1

107
were given time for thinking answer after asking the questions
Score 95 88 33 2 0
%age 36 42 21 2 0
NIT MALE
Response 3 24 17 5 2
3.4Score 15 96 51 10 2
%age 6 47 33 10 4
PIT FEMALE
Response 16 25 11 2 0
4.0Score 80100 33 4 0
%age 30 46 20 4 0
NIT FEMALE
Response 2 17 24 8 1
3.2Score 10 68 72 16 1
%age 4 33 46 15 2ITEM NO.
STATEMENT TEACHER GENDER DATA SA A UNC DA SDAMEAN Score
3.4
Both easy and difficult
questions were asked
PIT MALE
Response 20 21 9 3 0
4.1Score100 84 27 6 0
%age 38 40 17 6 0
NIT MALE
Response 5 14 20 9 3
3.2Score 25 56 60 18 3
%age 10 27 39 18 6
PIT FEMALE
Response 17 28 7 0 0
4.2Score 85112 21 0 0
%age 33 54 13 0 0
NIT FEMALE
Response 5 16 24 4 2
3.4Score 25 64 72 8 2
%age 10 31 47 8 4
3.5
The questions provided the
students to think deep over for
Response
PIT MALE
Response 17 24 12 1 0
4.1Score 85 96 36 2 0
%age 31 44 22 2 0
NIT MALE
Response 4 20 19 8 2
3.3Score 20 80 57 16 2
%age 8 38 36 15 4
PIT FEMALE
Response 20 19 13 2 0
4.1Score100 76 39 4 0
%age 37 35 24 4 0
NIT FEMALE
Response 1 16 28 4 1
3.2Score 5 64 84 8 1
%age 2 32 56 8 2

108
3.6
Maximum students were
asked questions in the given time
PIT MALE
Response 18 25 7 2 0
4.1Score 90100 21 4 0
%age 35 48 13 4 0
NIT MALE
Response 6 13 24 5 2
3.3Score 30 52 72 10 2
%age 12 26 48 10 4
PIT FEMALE
Response 21 27 3 1 0
4.3Score105
108 9 2 0
%age 40 52 6 2 0
NIT FEMALE
Response 5 16 21 5 0
3.4Score 25 64 63 10 0
%age 11 34 45 11 0ITEM NO.
STATEMENT TEACHER GENDER DATA SA A UNC DA SDAMEAN Score
3.7
Questions were relevant to the
under study lesson
PIT MALE
Response 20 21 12 1 0
4.1Score100 84 36 2 0
%age 37 39 22 2 0
NIT MALE
Response 7 14 19 8 3
3.3Score 35 56 57 16 3
%age 14 27 37 16 6
PIT FEMALE
Response 21 26 7 2 0
4.2Score105
104 21 4 0
%age 38 46 13 4 0
NIT FEMALE
Response 9 21 15 3 1
3.7Score 45 84 45 6 1
%age 18 43 31 6 23.8 Questions were
only asked to check the memory
PIT MALE
Response 18 14 10 2 2
4.0Score 90 56 30 4 2
%age 39 30 22 4 4
NIT MALE
Response 4 12 18 5 3
3.2Score 20 48 54 10 3
%age 10 29 43 12 7
PIT FEMALE
Response 19 17 15 2 1
3.9Score 95 68 45 4 1
%age 35 31 28 4 2NIT FEMALE Response 2 18 19 5 1 3.3
Score 10 72 57 10 1

109
%age 4 40 42 11 2
Table 4.1.12 implicit better performance of PIT male teachers with respect to different aspect of teaching skill i.e. "Listening". The mean score of PIT male teachers is from 3.6 to 3.9 whereas mean score of PIT female teachers is from 3.7 to 3.8. .
Table 4.1.12 Comparison of the performance of PIT male and PIT female teachers with respect to different aspects of "Listening"
ITEM NO.
STATEMENT TEACHER GENDER DATA SA A UNC DA SDAMEAN Score
4.1 Realized the
problems of the students on time
PIT MALE
Response 10 23 16 4 2
3.6Score 50 92 48 8 2
%age 18 42 29 7 4
NIT MALE
Response 3 15 21 15 1
3.1Score 15 60 63 30 1
%age 5 27 38 27 2
PIT FEMALE
Response 8 24 19 3 0
3.7Score 40 96 57 6 0
%age 15 44 35 6 0
NIT FEMALE
Response 1 11 24 8 2
3.0Score 5 44 72 16 2
%age 2 24 52 17 4
4.2
The students were guided with respect to their
problems
PIT MALE
Response 11 25 13 3 1
3.8Score 55100 39 6 1
%age 21 47 25 6 2
NIT MALE
Response 1 16 23 10 2
3.1Score 5 64 69 20 2
%age 2 31 44 19 4
PIT FEMALE
Response 10 25 17 2 0
3.8Score 50100 51 4 0
%age 19 46 31 4 0
NIT FEMALE
Response 3 13 26 6 1
3.2Score 15 52 78 12 1
%age 6 27 53 12 24.3 Steps were taken PIT MALE Response 15 22 12 4 1 3.9

110
to maintain the interest of
students during teaching
Score 75 88 36 8 1
%age 28 41 22 7 2
NIT MALE
Response 4 12 28 6 2
3.2Score 20 48 84 12 2
%age 8 23 54 12 4
PIT FEMALE
Response 13 23 15 4 1
3.8Score 65 92 45 8 1
%age 23 41 27 7 2
NIT FEMALE
Response 2 14 30 4 0
3.3Score 10 56 90 8 0
%age 4 28 60 8 0

111
Table 4.1.13 indicates better performance of PIT male teachers in application of teaching skill i.e. “Motivation". The mean score of PIT male teachers ranges between 3.9 and 4.2 whereas PIT female teachers between 3.8 to 4.0.
Table 4.1.13 Comparison of the performance of PIT male and PIT female teachers with respect to different aspects of "Motivation"
ITEM NO.
STATEMENT TEACHER GENDER DATA SA A UNC DA SDAMEAN Score
5.1
Words, phrases like "correct", “good", “very good", "fine"
and "excellent" were used during question/ answer
session.
PIT MALE
Response 15 22 14 2 1
3.9Score 75 88 42 4 1
%age 28 41 26 4 2
NIT MALE
Response 3 18 22 5 3
3.3Score 15 72 66 10 3
%age 6 35 43 10 6
PIT FEMALE
Response 11 24 14 5 0
3.8Score 55 96 42 10 0
%age 20 44 26 9 0
NIT FEMALE
Response 4 14 25 8 2
3.2Score 20 56 75 16 2
%age 8 26 47 15 4
5.2
Gestures like "yes", "right"
and "good" were used on the
correct response of the students
for their encouragement
PIT MALE
Response 17 19 14 1 0
4.0Score 85 76 42 2 0
%age 33 37 27 2 0
NIT MALE
Response 5 23 15 5 3
3.4Score 25 92 45 10 3
%age 10 45 29 10 6
PIT FEMALE
Response 16 22 12 3 0
4.0Score 80 88 36 6 0
%age 30 42 23 6 0
NIT FEMALE
Response 4 16 22 10 0
3.3Score 20 64 66 20 0
%age 8 31 42 19 05.3 For the
encouragement of the students
PIT MALE Response 21 21 9 1 0 4.2
Score 105
84 27 2 0

112
multiple gestures like, "modding" "given smile"
"yes yes" "now say" and "this is good idea" were
used
%age 40 40 17 2 0
NIT MALE
Response 3 19 26 3 1
3.4Score 15 76 78 6 1
%age 6 37 50 6 2
PIT FEMALE
Response 10 25 10 5 0
3.8Score 50100 30 10 0
%age 20 50 20 10 0
NIT FEMALE
Response 7 18 19 6 1
3.5Score 35 72 57 12 1
%age 14 35 37 12 2ITEM NO.
STATEMENT TEACHER GENDER DATA SA A UNC DA SDAMEAN Score
5.4
The students were provided
help for answering the
suitable answer
PIT MALE
Response 15 24 10 2 1
4.0Score 75 96 30 4 1
%age 29 46 19 4 2
NIT MALE
Response 3 18 17 6 3
3.3Score 15 72 51 12 3
%age 6 38 36 13 6
PIT FEMALE
Response 11 24 12 3 1
3.8Score 55 96 36 6 1
%age 22 47 24 6 2
NIT FEMALE
Response 2 13 23 13 0
3.1Score 10 52 69 26 0
%age 4 25 45 25 0
5.5
With the help of simple
instructions the students were
encouraged for correct response, e.g. "think over
again"
PIT MALE
Response 12 28 6 4 1
3.9Score 60112 18 8 1
%age 24 55 12 8 2
NIT MALE
Response 2 17 19 8 4
3.1Score 10 68 57 16 4
%age 4 34 38 16 8
PIT FEMALE
Response 13 25 12 5 0
3.8Score 65100 36 10 0
%age 24 45 22 9 0
NIT FEMALE
Response 4 15 21 4 1
3.4Score 20 60 63 8 1
%age 9 33 47 9 25.6 Students were
encouraged for PIT MALE Response 19 17 15 1 1 4.0
Score 95 68 45 2 1

113
correct part of answer
%age 36 32 28 2 2
NIT MALE
Response 1 21 20 5 2
3.3Score 5 84 60 10 2
%age 2 43 41 10 4
PIT FEMALE
Response 12 25 10 3 1
3.9Score 60100 30 6 1
%age 24 49 20 6 2
NIT FEMALE
Response 4 17 21 6 2
3.3Score 20 68 63 12 2
%age 8 34 42 12 4

114
Table No. 4.1.14 depicts better performance of PIT male teachers with respect to different aspects of teaching skill i.e. “Teacher Liveliness". The mean score score of PIT male teachers is between 4.2 to 4.3 whereas mean score of PIT female teachers is between 3.8 to 4.0.
Table 4.1.14 Comparison of the performance of PIT male and PIT female teachers with respect to different aspects of "Teacher Liveliness"
ITEM NO.
STATEMENT TEACHER GENDER DATA SA A UNC DA SDAMEAN Score
6.1
The teacher moved on proper time on teaching
place
PIT MALE
Response 21 21 9 2 0
4.2Score105 84 27 4 0
%age 40 40 17 4 0
NIT MALE
Response 4 14 20 10 3
3.1Score 20 56 60 20 3
%age 8 27 39 20 6
PIT FEMALE
Response 20 22 19 2 0
4.0Score100 88 57 4 0
%age 32 35 30 3 0
NIT FEMALE
Response 6 11 19 11 1
3.2Score 30 44 57 22 1
%age 13 23 40 23 2
6.2
The teacher has made the
teaching method more effective
with the posture and gesture i.e.
"hands", "body", "head", "face",
PIT MALE
Response 24 20 6 2 0
4.3Score120 80 18 4 0
%age 46 38 12 4 0
NIT MALE
Response 3 21 19 5 3
3.3Score 15 84 57 10 3
%age 6 41 37 10 6
PIT FEMALE
Response 14 24 14 2 0
3.9Score 70 96 42 4 0
%age 26 44 26 4 0
NIT FEMALE
Response 3 19 15 10 1
3.3Score 15 76 45 20 1
%age 6 40 31 21 26.3 There was rise PIT MALE Response 24 22 5 1 0 4.3

115
and fall in the teacher's tone
Score120 88 15 2 0
%age 46 42 10 2 0
NIT MALE
Response 8 12 19 8 1
3.4Score 40 48 57 16 1
%age 17 25 40 17 2
PIT FEMALE
Response 13 26 11 2 0
4.0Score 65104 33 4 0
%age 25 50 21 4 0
NIT FEMALE
Response 7 17 16 10 0
3.4Score 35 68 48 20 0
%age 14 34 32 20 0ITEM NO.
STATEMENT TEACHER GENDER DATA SA A UNC DA SDAMEAN Score
6.4
The teacher adopted different teaching methods for attention and
motivation purposes e.g.
teachers students and
students' teachers group were made
PIT MALE
Response 20 18 8 2 0
4.2Score100 72 24 4 0
%age 42 38 17 4 0
NIT MALE
Response 3 16 15 8 3
3.2Score 15 64 45 16 3
%age 7 36 33 18 7
PIT FEMALE
Response 12 20 14 5 0
3.8Score 60 80 42 10 0
%age 24 39 27 10 0
NIT FEMALE
Response 2 13 20 12 1
3.1Score 10 52 60 24 1
%age 4 27 42 25 2
6.5
Provision of short interval. The students
were provided time to give attention and think over the
important points
PIT MALE
Response 19 20 5 3 0
4.2Score 95 80 15 6 0
%age 40 43 11 6 0
NIT MALE
Response 1 17 18 10 2
3.1Score 5 68 54 20 2
%age 2 35 38 21 4
PIT FEMALE
Response 18 18 13 2 0
4.0Score 90 72 39 4 0
%age 35 35 25 4 0
NIT FEMALE
Response 4 10 23 9 2
3.1Score 20 40 69 18 2
%age 8 21 48 19 4

116
Table 4.1.15 indicates similar performance of both the groups in the area of "Closing of Lesson". The mean score of PIT male teachers is from 4.1 to 4.2 whereas mean score of PIT female teachers is from 3.9 to 4.2.
Table 4.1.15 Comparison of the performance of PIT male and PIT female teachers with respect to different aspects of "Closing of Lesson"
ITEM NO.
STATEMENT TEACHER GENDER DATA SA A UNC DA SDAMEAN Score
7.1
The way in which the teacher
wind up the lesson was
interesting one
PIT MALE
Response 17 23 6 3 0
4.1Score 85 92 18 6 0
%age 35 47 12 6 0
NIT MALE
Response 3 21 18 9 1
3.3Score 15 84 54 18 1
%age 6 40 35 17 2
PIT FEMALE
Response 17 18 16 2 0
3.9Score 85 72 48 4 0
%age 32 34 30 4 0
NIT FEMALE
Response 1 13 23 12 2
3.0Score 5 52 69 24 2
%age 2 25 45 24 4
7.2
The method in which the lesson
ended has aroused the
interest of the students
PIT MALE
Response 20 19 10 3 0
4.1Score100 76 30 6 0
%age 38 37 19 6 0
NIT MALE
Response 2 19 20 8 1
3.3Score 10 76 60 16 1
%age 4 38 40 16 2
PIT FEMALE
Response 14 24 14 0 0
4.0Score 70 96 42 0 0
%age 27 46 27 0 0
NIT FEMALE
Response 4 13 22 10 1
3.2Score 20 52 66 20 1
%age 8 26 44 20 27.3 The end of the
lesson and the real lesson has
PIT MALE Response 18 26 9 1 0 4.1
Score 90 104
27 2 0

117
connectivity with each other
%age 33 48 17 2 0
NIT MALE
Response 3 19 21 5 1
3.4Score 15 76 63 10 1
%age 6 39 43 10 2
PIT FEMALE
Response 20 21 11 1 0
4.1Score100 84 33 2 0
%age 38 40 21 2 0
NIT FEMALE
Response 1 16 20 12 1
3.1Score 5 64 60 24 1
%age 2 32 40 24 2ITEM NO.
STATEMENT TEACHER GENDER DATA SA A UNC DA SDAMEAN Score
7.4
The conclusion of the lesson was
the sum up of actual lesson and was also clear to
the students
PIT MALE
Response 16 25 9 1 0
4.1Score 80100 27 2 0
%age 31 49 18 2 0
NIT MALE
Response 4 17 17 8 2
3.3Score 20 68 51 16 2
%age 8 35 35 17 4
PIT FEMALE
Response 16 26 12 0 0
4.1Score 80104 36 0 0
%age 30 48 22 0 0
NIT FEMALE
Response 0 22 19 4 1
3.3Score 0 88 57 8 1
%age 0 48 41 9 2
7.5 Revision of
lesson was done
PIT MALE
Response 21 21 9 1 0
4.2Score105 84 27 2 0
%age 40 40 17 2 0
NIT MALE
Response 6 26 16 2 1
3.7Score 30104 48 4 1
%age 12 51 31 4 2
PIT FEMALE
Response 24 17 10 2 0
4.2Score120 68 30 4 0
%age 45 32 19 4 0
NIT FEMALE
Response 7 23 12 5 1
3.6Score 35 92 36 10 1
Response 17 25 8 2 0

118
7.6 Home work was
given to the students
PIT MALE
%age 15 48 25 10 2.08
4.1Score 85100 24 4 0
%age 33 48 15 4 0
NIT MALE
Response 3 20 17 7 1
3.4Score 15 80 51 14 1
%age 6 42 35 15 2
PIT FEMALE
Response 18 21 12 1 0
4.1Score 90 84 36 2 0
%age 35 40 23 2 0
NIT FEMALE
Response 4 16 21 7 1
3.3Score 20 64 63 14 1
%age 8 33 43 14 2ITEM NO.
STATEMENT TEACHER GENDER DATA SA A UNC DA SDAMEAN Score
7.7
Understanding of the lesson was realized by the
students
PIT MALE
Response 19 24 6 1 0
4.2Score 95 96 18 2 0
%age 38 48 12 2 0
NIT MALE
Response 2 21 18 6 1
3.4Score 10 84 54 12 1
%age 4 44 38 13 2
PIT FEMALE
Response 19 20 16 0 0
4.1Score 95 80 48 0 0
%age 35 36 29 0 0
NIT FEMALE
Response 7 25 14 6 1
3.6Score 35100 42 12 1
%age 13 47 26 11 2
Table No.4.1.16 reveals better performance of the male teachers with respect to different aspects of teaching skill i.e. "Planning". The mean score of PIT male teachers ranges from 3.9 to 4.0 whereas mean score of PIT female teachers’ ranges from 3.7 to 3.8.
Table 4.1.16 Comparison of the performance of PIT male and PIT female teachers with respect to different aspects of "Planning"
ITEM NO.
STATEMENT TEACHER GENDER+A1051 DATA SA A UNC DA SDAMEAN Score
8.1 The teaching was PIT MALE Response 14 22 15 1 1 3.9

119
planned and integrated
Score 70 88 45 2 1
%age 26 42 28 2 2
NIT MALE
Response 1 14 23 10 2
3.0Score 5 56 69 20 2
%age 2 28 46 20 4
PIT FEMALE
Response 10 18 25 0 0
3.7Score 50 72 75 0 0
%age 19 34 47 0 0
NIT FEMALE
Response 1 8 24 16 0
2.9Score 5 32 72 32 0
%age 2 16 49 33 0
8.2 The teaching was effective
PIT MALE
Response 15 23 14 1 1
3.9Score 75 92 42 2 1
%age 28 43 26 2 2
NIT MALE
Response 2 20 20 7 2
3.3Score 10 80 60 14 2
%age 4 39 39 14 4
PIT FEMALE
Response 7 23 23 0 0
3.7Score 35 92 69 0 0
%age 13 43 43 0 0
NIT FEMALE
Response 2 16 24 7 0
3.3Score 10 64 72 14 0
%age 4 33 49 14 0
8.3 Teaching was
according to the objectives
PIT MALE
Response 17 21 11 2 1
4.0Score 85 84 33 4 1
%age 33 40 21 4 2
NIT MALE
Response 5 14 16 9 3
3.2Score 25 56 48 18 3
%age 11 30 34 19 6
PIT FEMALE
Response 9 24 17 1 0
3.8Score 45 96 51 2 0
%age 18 47 33 2 0
NIT FEMALE
Response 3 16 21 9 0
3.3Score 15 64 63 18 0
%age 6 33 43 18 0ITEM NO.
STATEMENT TEACHER GENDER DATA SA A UNC DA SDAMEAN Score
8.4 All the students needs were
PIT MALE Response 17 22 11 2 0 4.0
Score 85 88 33 4 0

120
properly managed during
the teaching process
%age 33 42 21 4 0
NIT MALE
Response 2 17 21 8 1
3.2Score 10 68 63 16 1
%age 4 35 43 16 2
PIT FEMALE
Response 10 22 15 3 0
3.8Score 50 88 45 6 0
%age 20 44 30 6 0
NIT FEMALE
Response 5 14 20 12 1
3.2Score 25 56 60 24 1
%age 10 27 38 23 2

121
C. TABLE 4.1.17 Comparison of the performance of Urban PIT teachers and Rural PIT teachers with respect to different aspects of "Set Induction"
ITEM NO.
STATEMENT AREA TEACHER DATA SA A UNC DA SDAMEAN SCORE
1.1
The method of introduction of
lesson was interesting
URBAN
PIT
Response 21 17 14 3 0
4.0Score105 68 42 6 0
%age 38 31 25 5 0
NITResponse 4 24 14 7 5
3.3Score 20 96 42 14 5%age 7 44 26 13 9
RURAL
PITResponse 19 20 7 6 0
4.0Score 95 80 21 12 0%age 37 38 13 12 0
NITResponse 5 15 17 8 2
3.3Score 25 60 51 16 2%age 11 32 36 17 4
1.2
The keen interest of the students in the lesson was due to the method of introduction
URBAN
PIT
Response 26 26 12 2 1
4.1Score130
104 36 4 1
%age 39 39 18 3 1
NITResponse 9 23 21 8 4
3.4Score 45 92 63 16 4%age 14 35 32 12 6
RURAL
PIT
Response 24 27 12 4 4
3.9Score120
108 36 8 4
%age 34 38 17 6 6
NITResponse 11 24 20 10 3
3.4Score 55 96 60 20 3%age 16 35 29 15 4
1.3 The introduction of the lesson and the relation of actual lesson
was clear to the students
URBAN
PIT
Response 21 21 13 0 0
4.1Score105 84 39 0 0
%age 38 38 24 0 0NIT Response 5 19 20 7 2 3.3
Score 25 76 60 14 2%age 9 36 38 13 4

122
RURAL
PIT
Response 22 21 9 1 0
4.2Score110 84 27 2 0
%age 42 40 17 2 0
NITResponse 5 23 17 6 1
3.5Score 25 92 51 12 1%age 10 44 33 12 2
Table No.4.1.18 shows better performance of Rural PIT teachers with respect to different aspects of teaching skills i.e."Presentation". The mean score of urban PIT teachers ranges between 3.2 and 4.1 whereas mean score of rural PIT teachers’ ranges between 3.3 and4.3.
Table 4.1.18 Comparison of the performance of urban PIT teachers and rural PIT teachers with respect to different aspects of "Presentation"
ITEM NO.
STATEMENT AREA TEACHER DATA SA A UNC DA SDAMEAN SCORE
2.1
Explanation was fully
comprehensive to the students
URBAN
PIT
Response 19 27 9 2 0
4.1Score 95108 27 4 0
%age 33 47 16 4 0
NITResponse 5 16 21 8 2
3.3Score 25 64 63 16 2%age 10 31 40 15 4
RURAL
PITResponse 19 22 8 3 0
4.1Score 95 88 24 6 0%age 37 42 15 6 0
NITResponse 5 17 16 11 1
3.3Score 25 68 48 22 1%age 10 34 32 22 2
2.2 The students were impressed
by the explanation. URBAN
PIT
Response 15 30 7 3 0
4.0Score 75120 21 6 0
%age 27 55 13 5 0
NITResponse 6 19 20 7 1
3.4Score 30 76 60 14 1%age 11 36 38 13 2
RURAL PIT Response 20 24 6 1 0 4.2

123
Score100 96 18 2 0
%age 39 47 12 2 0
NITResponse 4 20 20 4 0
3.5Score 20 80 60 8 0%age 8 42 42 8 0
2.3
Explanation covered the important
points
URBAN
PITResponse 17 23 13 1 0
4.0Score 85 92 39 2 0%age 31 43 24 2 0
NITResponse 3 19 21 8 1
3.3Score 15 76 63 16 1%age 6 37 40 15 2
RURAL
PIT
Response 23 20 8 1 0
4.3Score115 80 24 2 0
%age 44 38 15 2 0
NITResponse 5 19 24 1 1
3.5Score 25 76 72 2 1%age 10 38 48 2 2
ITEM NO.
STATEMENT AREA TEACHER DATASA A UNC DA SDA
MEAN SCORE
2.4
Demonstrated models,
pictures and examples were
source of interest to the
students
URBAN
PIT
Response 20 22 11 2 0
4.1Score100 88 33 4 0
%age 36 40 20 4 0
NITResponse 3 19 22 10 1
3.2Score 15 76 66 20 1%age 5 35 40 18 2
RURAL
PIT
Response 20 21 9 0 0
4.2Score100 84 27 0 0
%age 40 42 18 0 0
NITResponse 5 21 18 5 1
3.5Score 25 84 54 10 1%age 10 42 36 10 2
2.5 Demonstrated models,
pictures and examples were up to the mental
URBAN
PIT
Response 16 26 6 2 0
4.1Score 80104 18 4 0
%age 32 52 12 4 0NIT Response 6 17 21 8 1 3.4

124
level of the students
Score 30 68 63 16 1%age 11 32 40 15 2
RURAL
PIT
Response 22 19 9 0 0
4.3Score110 76 27 0 0
%age 44 38 18 0 0
NIT
Response 3 28 15 3 1
3.6Score 15112 45 6 1
%age 6 56 30 6 2

125
Table No. 4.1.19 explicit that the performance of the urban PIT teachers is better with respect to teaching skill i.e "Questioning" and its different aspects. The mean score of urban PIT teachers is from 3.1 to 4.3 whereas mean score of rural PIT teachers is from 3.2 to 4.2.
Table 4.1.19 Comparison of the performance of urban PIT teachers and rural PIT teachers with respect of different aspects of "Questioning"
ITEM NO.
STATEMENT AREA TEACHER DATA SA A UNC DA SDAMEAN SCORE
3.1Questions were asked clearly
URBAN
PIT
Response 17 25 13 1 0
4.0Score 85100 39 2 0
%age 30 45 23 2 0
NITResponse 3 16 23 9 1
3.2Score 15 64 69 18 1%age 6 31 44 17 2
RURAL
PIT
Response 20 23 7 2 0
4.2Score100 92 21 4 0
%age 38 44 13 4 0
NITResponse 1 16 22 8 1
3.2Score 5 64 66 16 1%age 2 33 46 17 2
3.2
Questions were generally
comprehended by the students
URBAN
PITResponse 19 22 13 1 0
4.1Score 95 88 39 2 0%age 35 40 24 2 0
NITResponse 4 15 26 6 1
3.3Score 20 60 78 12 1%age 8 29 50 12 2
RURAL
PIT
Response 20 19 11 1 0
4.1Score100 76 33 2 0
%age 39 37 22 2 0
NITResponse 0 21 18 8 2
3.2Score 0 84 54 16 2%age 0 43 37 16 4

126
3.3
After questioning the students were given time for
thinking answer
URBAN
PIT
Response 14 27 13 2 0
3.9Score 70108 39 4 0
%age 25 48 23 4 0
NITResponse 3 19 21 8 2
3.2Score 15 76 63 16 2%age 6 36 40 15 4
RURAL
PIT
Response 21 20 9 1 0
4.2Score105 80 27 2 0
%age 41 39 18 2 0
NITResponse 2 22 20 5 1
3.4Score 10 88 60 10 1%age 4 44 40 10 2
ITEM NO.
STATEMENT AREA TEACHER DATASA A UNC DA SDA
MEAN SCORE
3.4
Both easy and difficult
questions were asked
URBAN
PIT
Response 16 28 7 3 0
4.1Score 80112 21 6 0
%age 30 52 13 6 0
NITResponse 5 14 23 6 4
3.2Score 25 56 69 12 4%age 10 27 44 12 8
RURAL
PIT
Response 21 21 9 0 0
4.2Score105 84 27 0 0
%age 41 41 18 0 0
NITResponse 5 16 21 7 1
3.3Score 25 64 63 14 1%age 10 32 42 14 2
3.5 The questions provided the students to
think deep over for response
URBAN
PITResponse 17 24 13 1 0
4.0Score 85 96 39 2 0%age 31 44 24 2 0
NITResponse 2 15 24 9 2
3.1Score 10 60 72 18 2%age 4 29 46 17 4
RURAL PIT Response 20 19 12 2 0 4.1
Score100 76 36 4 0
%age 38 36 23 4 0

127
NITResponse 3 21 23 3 1
3.4Score 15 84 69 6 1%age 6 41 45 6 2
3.6
Maximum students were
asked questions in the given time
URBAN
PITResponse 17 24 2 1 0
4.3Score 85 96 6 2 0%age 39 55 5 2 0
NITResponse 4 14 21 2 0
3.5Score 20 56 63 4 0%age 10 34 51 5 0
RURAL
PITResponse 15 19 6 1 0
4.2Score 75 76 18 2 0%age 37 46 15 2 0
NITResponse 4 13 18 2 0
3.5Score 20 52 54 4 0%age 11 35 49 5 0
ITEM NO.
STATEMENT AREA TEACHER DATASA A UNC DA SDA
MEAN SCORE
3.7
Questions were relevant to the
under study lesson
URBAN
PIT
Response 20 26 9 1 0
4.2Score100
104 27 2 0
%age 36 46 16 2 0
NITResponse 10 17 16 5 3
3.5Score 50 68 48 10 3%age 20 33 31 10 6
RURAL
PIT
Response 21 21 9 2 0
4.2Score105 84 27 4 0
%age 40 40 17 4 0
NITResponse 6 18 18 6 1
3.4Score 30 72 54 12 1%age 12 37 37 12 2
3.8 Questions were asked only
to check the memory URBAN
PIT
Response 24 12 17 2 1
4.0Score120 48 51 4 1
%age 43 21 30 4 2
NITResponse 5 10 20 8 3
3.1Score 25 40 60 16 3%age 11 22 43 17 7
RURAL PIT Response 13 19 8 2 2 3.9

128
Score 65 76 24 4 2%age 30 43 18 5 5
NITResponse 1 20 17 2 1
3.4Score 5 80 51 4 1%age 2 49 41 5 2

129
Table No.4.1.20 shows better performance of Rural PIT teachers with respect to different aspects of teaching skill i.e. "Listening". The mean score of Urban PIT teachers ranges from 3.0 to 3.8 whereas mean score of Rural PIT teacher’s ranges from 3.1 to 3.9. A5
Table 4.1.20 Comparison of the performance of urban PIT teachers and rural PIT teachers with respect to different aspects of "Listening"
ITEM NO.
STATEMENT AREA TEACHER DATA SA A UNC DA SDAMEAN SCORE
4.1
Realized the problems of the
students on time
URBAN
PITResponse 11 20 19 6 0
3.6Score 55 80 57 12 0%age 20 36 34 11 0
NITResponse 2 11 28 9 2
3.0Score 10 44 84 18 2%age 4 21 54 17 4
RURAL
PIT
Response 7 27 16 1 2
3.7Score 35108 48 2 2
%age 13 51 30 2 4
NITResponse 2 15 17 14 1
3.1Score 10 60 51 28 1%age 4 31 35 29 2
4.2
The students were guided
with respect to their problems
URBAN
PIT
Response 8 27 15 4 0
3.7Score 40108 45 8 0
%age 15 50 28 7 0
NITResponse 2 14 24 9 2
3.1Score 10 56 72 18 2%age 4 27 47 18 4
RURAL
PITResponse 13 23 15 1 1
3.9Score 65 92 45 2 1%age 25 43 28 2 2
NITResponse 2 15 25 7 1
3.2Score 10 60 75 14 1%age 4 30 50 14 2
4.3 Steps were URBAN PIT Response 10 26 15 4 0 3.8

130
taken to maintain the interest of
students during teaching
Score 50104 45 8 0
%age 18 47 27 7 0
NITResponse 3 14 26 8 1
3.2Score 15 56 78 16 1%age 6 27 50 15 2
RURAL
PITResponse 18 19 12 4 1
3.9Score 90 76 36 8 1%age 33 35 22 7 2
NITResponse 3 12 32 2 1
3.3Score 15 48 96 4 1%age 6 24 64 4 2
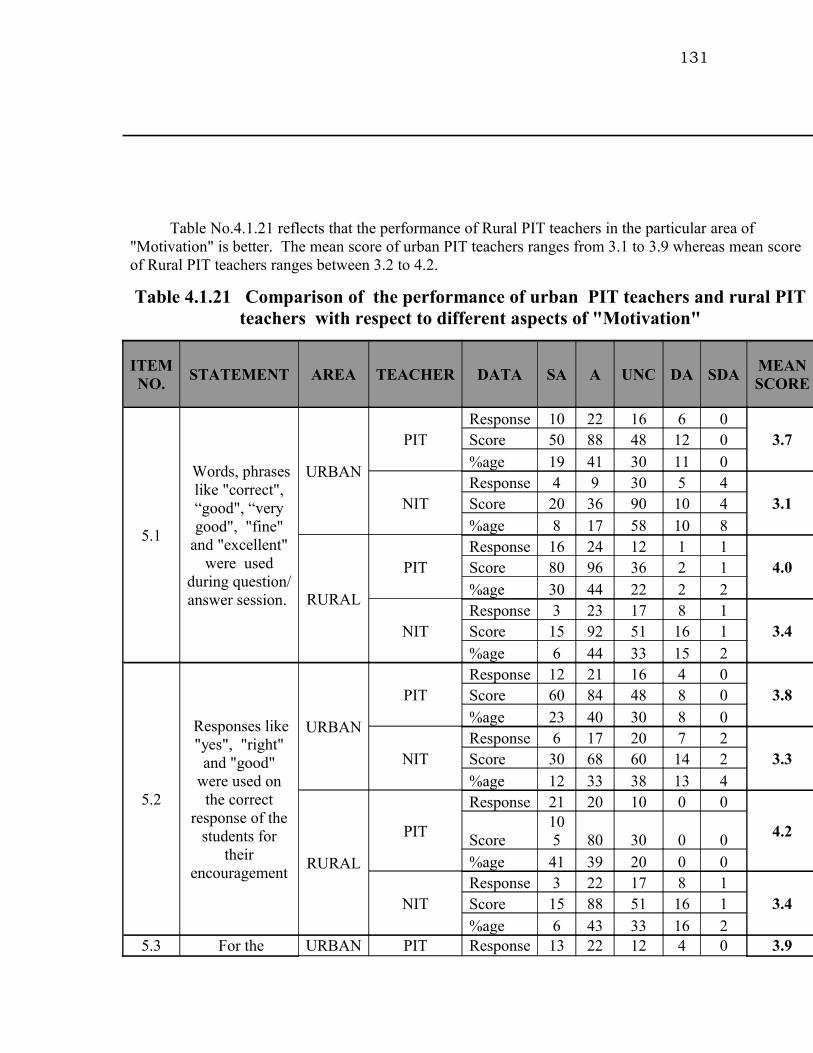
131
Table No.4.1.21 reflects that the performance of Rural PIT teachers in the particular area of "Motivation" is better. The mean score of urban PIT teachers ranges from 3.1 to 3.9 whereas mean score of Rural PIT teachers ranges between 3.2 to 4.2.
Table 4.1.21 Comparison of the performance of urban PIT teachers and rural PIT teachers with respect to different aspects of "Motivation"
ITEM NO.
STATEMENT AREA TEACHER DATA SA A UNC DA SDAMEAN SCORE
5.1
Words, phrases like "correct", “good", “very good", "fine"
and "excellent" were used
during question/ answer session.
URBAN
PITResponse 10 22 16 6 0
3.7Score 50 88 48 12 0%age 19 41 30 11 0
NITResponse 4 9 30 5 4
3.1Score 20 36 90 10 4%age 8 17 58 10 8
RURAL
PITResponse 16 24 12 1 1
4.0Score 80 96 36 2 1%age 30 44 22 2 2
NITResponse 3 23 17 8 1
3.4Score 15 92 51 16 1%age 6 44 33 15 2
5.2
Responses like "yes", "right"
and "good" were used on
the correct response of the
students for their
encouragement
URBAN
PITResponse 12 21 16 4 0
3.8Score 60 84 48 8 0%age 23 40 30 8 0
NITResponse 6 17 20 7 2
3.3Score 30 68 60 14 2%age 12 33 38 13 4
RURAL
PIT
Response 21 20 10 0 0
4.2Score105 80 30 0 0
%age 41 39 20 0 0
NITResponse 3 22 17 8 1
3.4Score 15 88 51 16 1%age 6 43 33 16 2
5.3 For the URBAN PIT Response 13 22 12 4 0 3.9

132
encouragement of the students
multiple gestures
like,"modding" "given smile"
"yes yes" "now say" and "this is
good idea" were used
Score 65 88 36 8 0%age 25 43 24 8 0
NITResponse 6 19 24 4 1
3.5Score 30 76 72 8 1%age 11 35 44 7 2
RURAL
PITResponse 18 24 7 2 0
4.1Score 90 96 21 4 0%age 35 47 14 4 0
NITResponse 4 18 21 5 1
3.4Score 20 72 63 10 1%age 8 37 43 10 2
ITEM NO.
STATEMENT AREA TEACHER DATASA A UNC DA SDA
MEAN SCORE
5.4
The students were provided
helped for suitable answer
URBAN
PIT
Response 10 27 11 2 2
3.8Score 50108 33 4 2
%age 19 52 21 4 4
NITResponse 3 15 21 12 2
3.1Score 15 60 63 24 2%age 6 28 40 23 4
RURAL
PITResponse 16 21 11 3 0
4.0Score 80 84 33 6 0%age 31 41 22 6 0
NITResponse 2 16 19 7 1
3.2Score 10 64 57 14 1%age 4 36 42 16 2
5.5 With the help of simple
instructions the students were
encouraged for correct
response, e.g. "think over
again"
URBAN
PIT
Response 12 26 8 6 1
3.8Score 60104 24 12 1
%age 23 49 15 11 2
NITResponse 3 16 20 6 2
3.3Score 15 64 60 12 2%age 6 34 43 13 4
RURAL
PIT
Response 13 27 10 3 0
3.9Score 65108 30 6 0
%age 25 51 19 6 0NIT Response 3 16 20 6 3 3.2
Score 15 64 60 12 3
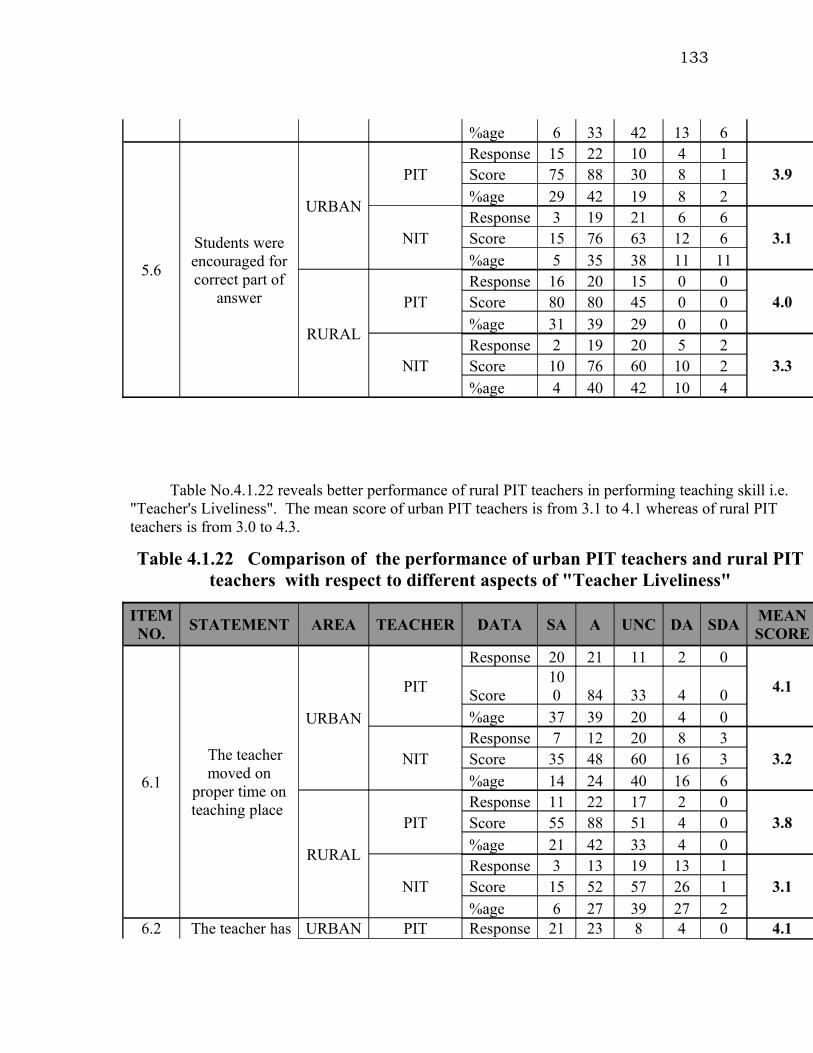
133
%age 6 33 42 13 6
5.6
Students were encouraged for correct part of
answer
URBAN
PITResponse 15 22 10 4 1
3.9Score 75 88 30 8 1%age 29 42 19 8 2
NITResponse 3 19 21 6 6
3.1Score 15 76 63 12 6%age 5 35 38 11 11
RURAL
PITResponse 16 20 15 0 0
4.0Score 80 80 45 0 0%age 31 39 29 0 0
NITResponse 2 19 20 5 2
3.3Score 10 76 60 10 2%age 4 40 42 10 4
Table No.4.1.22 reveals better performance of rural PIT teachers in performing teaching skill i.e. "Teacher's Liveliness". The mean score of urban PIT teachers is from 3.1 to 4.1 whereas of rural PIT teachers is from 3.0 to 4.3.
Table 4.1.22 Comparison of the performance of urban PIT teachers and rural PIT teachers with respect to different aspects of "Teacher Liveliness"
ITEM NO.
STATEMENT AREA TEACHER DATA SA A UNC DA SDAMEAN SCORE
6.1
The teacher moved on
proper time on teaching place
URBAN
PIT
Response 20 21 11 2 0
4.1Score100 84 33 4 0
%age 37 39 20 4 0
NITResponse 7 12 20 8 3
3.2Score 35 48 60 16 3%age 14 24 40 16 6
RURAL
PITResponse 11 22 17 2 0
3.8Score 55 88 51 4 0%age 21 42 33 4 0
NITResponse 3 13 19 13 1
3.1Score 15 52 57 26 1%age 6 27 39 27 2
6.2 The teacher has URBAN PIT Response 21 23 8 4 0 4.1

134
made the teaching
method more effective with
the posture and gesture i.e. "hands",
"body", "head", "face",
Score105 92 24 8 0
%age 38 41 14 7 0
NITResponse 3 24 14 6 3
3.4Score 15 96 42 12 3%age 6 48 28 12 6
RURAL
PITResponse 17 21 12 0 0
4.1Score 85 84 36 0 0%age 34 42 24 0 0
NITResponse 3 16 20 9 1
3.2Score 15 64 60 18 1%age 6 33 41 18 2
6.3 There was rise and fall in the teacher's tone
URBAN
PITResponse 18 22 11 1 0
4.1Score 90 88 33 2 0%age 35 42 21 2 0
NITResponse 7 14 21 8 1
3.4Score 35 56 63 16 1%age 14 27 41 16 2
RURAL
PIT
Response 19 26 5 2 0
4.2Score 95104 15 4 0
%age 37 50 10 4 0
NITResponse 8 15 14 10 0
3.4Score 40 60 42 20 0%age 17 32 30 21 0
ITEM NO.
STATEMENT AREA TEACHER DATASA A UNC DA SDA
MEAN SCORE
6.4 The teacher adopted different teaching
methods for attention and motivation
purposes e.g. teachers
students and students'
teachers group were made
URBAN
PITResponse 12 21 10 6 0
3.8Score 60 84 30 12 0%age 24 43 20 12 0
NITResponse 2 16 18 11 2
3.1Score 10 64 54 22 2%age 4 33 37 22 4
RURAL
PIT
Response 20 17 12 1 0
4.1Score100 68 36 2 0
%age 40 34 24 2 0NIT Response 3 13 17 9 2 3.1
Score 15 52 51 18 2

135
%age 7 30 39 20 5
6.5
Provision of short interval. The students
were provided time to give attention and think over the
important points
URBAN
PITResponse 14 22 11 3 0
3.9Score 70 88 33 6 0%age 28 44 22 6 0
NITResponse 3 16 21 10 2
3.2Score 15 64 63 20 2%age 6 31 40 19 4
RURAL
PIT
Response 23 16 7 2 0
4.3Score115 64 21 4 0
%age 48 33 15 4 0
NITResponse 2 11 20 9 2
3.0Score 10 44 60 18 2%age 5 25 45 20 5
Table No.4.1.23 explicit better performance of rural PIT teachers with respect to application of teaching skill i.e. "Closing of the Lesson". The mean score urban PIT teachers range from 3.2 to 4.2 whereas means score of rural PIT teachers ranges from 3.1 to 4.3.
Table 4.1.23 Comparison of the performance of urban PIT teachers and rural PIT teachers with respect to different aspects of " Closure of the Lesson"
ITEM NO.
STATEMENT AREA TEACHER DATA SA A UNC DA SDAMEAN SCORE
7.1
The way in which the
teacher wind up the lesson was interesting one
URBAN
PITResponse 15 24 11 3 0
4.0Score 75 96 33 6 0%age 28 45 21 6 0
NITResponse 3 17 20 11 2
3.2Score 15 68 60 22 2%age 6 32 38 21 4
RURAL
PITResponse 19 17 11 2 0
4.1Score 95 68 33 4 0%age 39 35 22 4 0
NITResponse 1 17 21 10 1
3.1Score 5 68 63 20 1%age 2 34 42 20 2
7.2 The method in URBAN PIT Response 15 26 9 3 0 4.0

136
which the lesson ended
has aroused the interest of the
students
Score 75104 27 6 0
%age 28 49 17 6 0
NITResponse 4 16 22 8 1
3.3Score 20 64 66 16 1%age 8 31 43 16 2
RURAL
PITResponse 19 17 15 0 0
4.1Score 95 68 45 0 0%age 37 33 29 0 0
NITResponse 2 16 20 10 1
3.2Score 10 64 60 20 1%age 4 33 41 20 2
7.3
The end of the lesson and the real lesson has connectivity
with each other
URBAN
PIT
Response 21 24 9 1 0
4.2Score105 96 27 2 0
%age 38 44 16 2 0
NITResponse 2 19 18 9 2
3.2Score 10 76 54 18 2%age 4 38 36 18 4
RURAL
PITResponse 17 23 11 1 0
4.1Score 85 92 33 2 0%age 33 44 21 2 0
NITResponse 2 16 23 8 0
3.2Score 10 64 69 16 0%age 4 33 47 16 0
ITEM NO.
STATEMENT AREA TEACHER DATASA A UNC DA SDA
MEAN SCORE
7.4 The conclusion of the lesson
was the sum up of actual lesson
and was also clear to the
students
URBAN
PIT
Response 18 27 8 1 0
4.1Score 90108 24 2 0
%age 33 50 15 2 0
NITResponse 2 19 17 9 2
3.2Score 10 76 51 18 2%age 4 39 35 18 4
RURALPIT
Response 14 24 13 0 04.0Score 70 96 39 0 0
%age 27 47 25 0 0NIT Response 2 20 19 3 1 3.4
Score 10 80 57 6 1

137
%age 4 44 42 7 2
7.5 Revision of
lesson was done
URBAN
PIT
Response 21 21 11 1 0
4.1Score105 84 33 2 0
%age 39 39 20 2 0
NITResponse 5 21 18 6 0
3.5Score 25 84 54 12 0%age 10 42 36 12 0
RURAL
PIT
Response 24 17 8 2 0
4.2Score120 68 24 4 0
%age 47 33 16 4 0
NIT
Response 8 28 10 1 2
3.8Score 40112 30 2 2
%age 16 57 20 2 4
7.6 Home work
was given to the students
URBAN
PITResponse 19 19 14 1 0
4.1Score 95 76 42 2 0%age 36 36 26 2 0
NITResponse 2 19 20 8 1
3.3Score 10 76 60 16 1%age 4 38 40 16 2
RURAL
PIT
Response 16 27 6 2 0
4.1Score 80108 18 4 0
%age 31 53 12 4 0
NITResponse 5 17 18 6 1
3.4Score 25 68 54 12 1%age 11 36 38 13 2
ITEM NO.
STATEMENT AREA TEACHER DATASA A UNC DA SDA
MEAN SCORE
7.7 Understanding of the lesson
was realized by the students URBAN
PIT
Response 14 28 12 1 0
4.0Score 70112 36 2 0
%age 25 51 22 2 0
NITResponse 6 22 18 9 1
3.4Score 30 88 54 18 1%age 11 39 32 16 2
RURAL PIT Response 24 16 10 0 0 4.3Score 12 64 30 0 0

138
0%age 48 32 20 0 0
NITResponse 3 24 14 3 1
3.6Score 15 96 42 6 1%age 7 53 31 7 2

139
Table No.1 4.1.24 inimates no difference between the perofmance of both the groups with respect to different aspects of skill i.e "Planning”. The mean score of urban PIT teachers ranges from 3.0 to 3.9 whereas of rural PIT teachers from 2.9 to 3.9.
Table 4.1.24 Comparison of the performance of the urban PIT and rural PIT teachers with respect to different aspects of "Planning"
ITEM NO.
STATEMENT AREA TEACHER DATA SA A UNC DA SDAMEAN SCORE
8.1The teaching was planned
and integrated
URBAN
PITResponse 11 23 19 1 0
3.8Score 55 92 57 2 0%age 20 43 35 2 0
NITResponse 0 11 24 12 1
2.9Score 0 44 72 24 1%age 0 23 50 25 2
RURAL
PITResponse 13 17 21 0 1
3.8Score 65 68 63 0 1%age 25 33 40 0 2
NITResponse 2 11 23 14 1
3.0Score 10 44 69 28 1%age 4 22 45 27 2
8.2 The teaching was effective
URBAN
PITResponse 10 24 19 1 1
3.7Score 50 96 57 2 1%age 18 44 35 2 2
NITResponse 1 18 23 8 1
3.2Score 5 72 69 16 1%age 2 35 45 16 2
RURAL
PITResponse 12 22 18 0 0
3.9Score 60 88 54 0 0%age 23 42 35 0 0
NITResponse 3 18 21 6 1
3.3Score 15 72 63 12 1%age 6 37 43 12 2
8.3 The Teaching was according
to the
URBAN PIT Response 10 26 13 2 0 3.9Score 50 10
439 4 0

140
objectives
%age 20 51 25 4 0
NITResponse 2 20 16 10 2
3.2Score 10 80 48 20 2%age 4 40 32 20 4
RURAL
PITResponse 16 19 15 1 1
3.9Score 80 76 45 2 1%age 31 37 29 2 2
NITResponse 6 10 21 8 1
3.3Score 30 40 63 16 1%age 13 22 46 17 2
ITEM NO.
STATEMENT AREA TEACHER DATASA A UNC DA SDA
MEAN SCORE
8.4
All the student's needs were properly
managed during the teaching
process
URBAN
PITResponse 13 24 14 1 0
3.9Score 65 96 42 2 0%age 25 46 27 2 0
NITResponse 4 15 20 11 2
3.2Score 20 60 60 22 2%age 8 29 38 21 4
RURAL
PITResponse 14 20 12 4 0
3.9Score 70 80 36 8 0%age 28 40 24 8 0
NITResponse 3 16 21 9 0
3.3Score 15 64 63 18 0%age 6 33 43 18 0
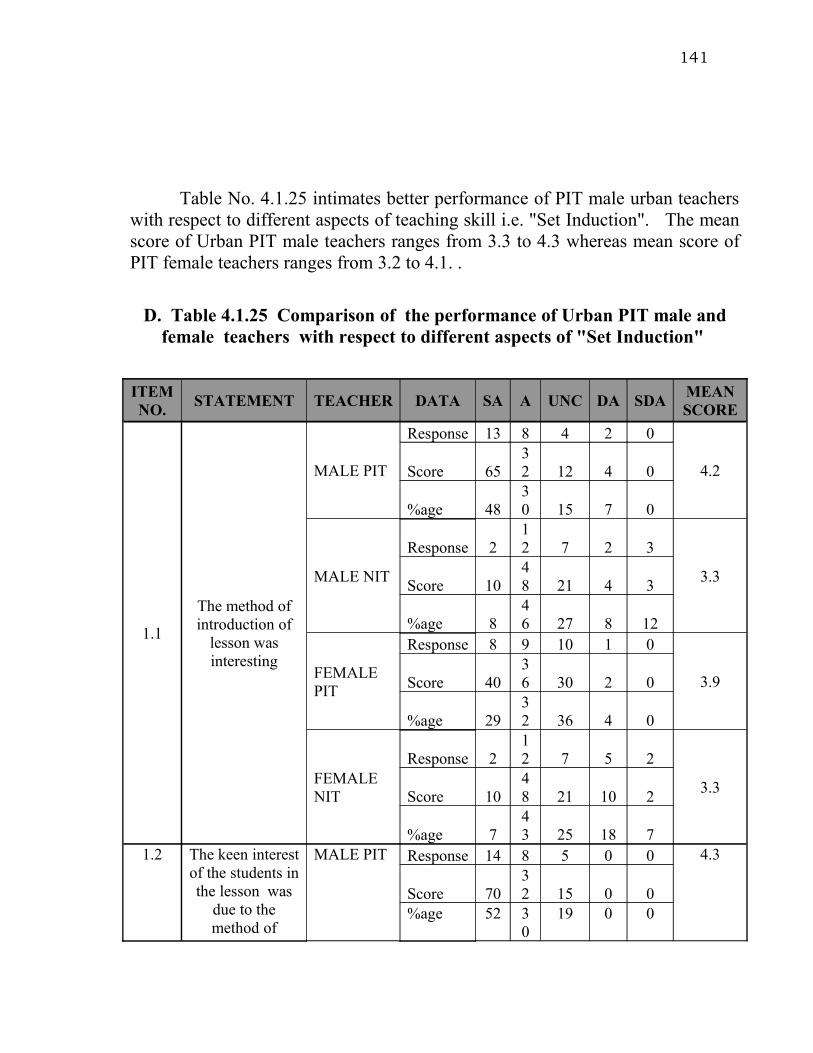
141
Table No. 4.1.25 intimates better performance of PIT male urban teachers with respect to different aspects of teaching skill i.e. "Set Induction". The mean score of Urban PIT male teachers ranges from 3.3 to 4.3 whereas mean score of PIT female teachers ranges from 3.2 to 4.1. .
D. Table 4.1.25 Comparison of the performance of Urban PIT male and female teachers with respect to different aspects of "Set Induction"
ITEM NO.
STATEMENT TEACHER DATA SA A UNC DA SDAMEAN SCORE
1.1
The method of introduction of
lesson was interesting
MALE PIT
Response 13 8 4 2 0
4.2Score 6532 12 4 0
%age 4830 15 7 0
MALE NIT
Response 212 7 2 3
3.3Score 10
48 21 4 3
%age 846 27 8 12
FEMALE PIT
Response 8 9 10 1 0
3.9Score 4036 30 2 0
%age 2932 36 4 0
FEMALE NIT
Response 212 7 5 2
3.3Score 10
48 21 10 2
%age 743 25 18 7
1.2 The keen interest of the students in the lesson was
due to the method of
MALE PIT Response 14 8 5 0 0 4.3
Score 7032 15 0 0
%age 52 30
19 0 0

142
introduction
MALE NIT
Response 212 8 2 2
3.4Score 10
48 24 4 2
%age 846 31 8 8
FEMALE PIT
Response 714 4 0 0
4.1Score 35
56 12 0 0
%age 2856 16 0 0
FEMALE NIT
Response 2 7 10 4 1
3.2Score 1028 30 8 1
%age 829 42 17 4
1.3
The introduction of the lesson and the relation of
actual lesson was clear to the
students
MALE PIT
Response 14 7 6 0 0
4.3Score 7028 18 0 0
%age 5226 22 0 0
MALE NIT
Response 210 9 4 1
3.3Score 10
40 27 8 1
%age 838 35 15 4
FEMALE PIT
Response 714 7 0 0
4.0Score 35
56 21 0 0
%age 2550 25 0 0
FEMALE NIT
Response 3 9 11 3 1
3.4Score 1536 33 6 1
%age 1133 41 11 4

143
Table No. 4.1.26 exhibits that the performance of the PIT male urban teachers in the application of teaching skill i.e. "Presentation" is better. The mean score of Urban PIT male teachers ranges from 3.2 to 4.2 whereas mean score of PIT female teachers ranges from 3.2 to 4.1
Table 4.1.26 Comparison of the performance of Urban PIT male and female teachers with respect to different aspects of "Presentation"
ITEM NO.
STATEMENT TEACHER DATA SA A UNC DA SDAMEAN SCORE
2.1
Explanation was fully
comprehensive to the students
MALE PIT
Response 913 4 1 0
4.1Score 45
52 12 2 0
%age 3348 15 4 0
MALE NIT
Response 1 9 11 3 2
3.2Score 536 33 6 2
%age 435 42 12 8
FEMALE PIT
Response 1014 5 1 0
4.1Score 50
56 15 2 0
%age 3347 17 3 0
FEMALE NIT
Response 4 7 10 5 0
3.4Score 2028 30 10 0
%age 1527 38 19 0
2.2 The students were impressed
by the explanation. MALE PIT
Response 717 3 0 0
4.1Score 35
68 9 0 0
%age 2663 11 0 0
MALE NIT Response 1 9 12 3 1 3.2

144
Score 536 36 6 1
%age 435 46 12 4
FEMALE PIT
Response 813 4 3 0
3.9Score 40
52 12 6 0
%age 2946 14 11 0
FEMALE NIT
Response 510 8 4 0
3.6Score 25
40 24 8 0
%age 1937 30 15 0
2.3Explanation covered the
important points
MALE PIT
Response 814 5 0 0
4.1Score 40
56 15 0 0
%age 3052 19 0 0
MALE NIT
Response 1 9 10 4 1
3.2Score 536 30 8 1
%age 436 40 16 4
FEMALE PIT
Response 9 9 8 1 0
4.0Score 4536 24 2 0
%age 3333 30 4 0
FEMALE NIT
Response 210 11 4 0
3.4Score 10
40 33 8 0
%age 737 41 15 0
ITEM NO.
STATEMENT TEACHER DATA SA A UNC DA SDAMEAN SCORE
2.4 Demonstrated models, pictures
and examples
MALE PITResponse 10
11 6 1 0
4.1
Score 50 4 18 2 0

145
were source of interest to the
students
4
%age 3639 21 4 0
MALE NIT
Response 012 9 4 1
3.2Score 0
48 27 8 1
%age 046 35 15 4
FEMALE PIT
Response 1011 5 1 0
4.1Score 50
44 15 2 0
%age 3741 19 4 0
FEMALE NIT
Response 3 7 13 6 0
3.2Score 1528 39 12 0
%age 1024 45 21 0
2.5
Demonstrated models, pictures
and examples were up to the mental level of
the students
MALE PIT
Response 814 1 1 0
4.2Score 40
56 3 2 0
%age 3358 4 4 0
MALE NIT
Response 410 8 3 1
3.5Score 20
40 24 6 1
%age 1538 31 12 4
FEMALE PIT
Response 812 5 1 0
4.0Score 40
48 15 2 0
%age 3146 19 4 0
FEMALE NIT
Response 2 7 13 5 0
3.2Score 1028 39 10 0
%age 726 48 19 0

146
Table No.4.1.27 shows that the mean score of Urban PIT male teachers ranges from 3.0 to 4.3, whereas mean score of PIT female teachers ranges from 3.1 to 4.3.This indicates similar performance of both the groups with respect to different aspects of teaching skill, "Questioning".
Table 4.1.27 Comparison of the performance of Urban PIT male and female teachers with respect to different aspects of "Questioning"
ITEM NO.
STATEMENT TEACHER DATA SA A UNC DA SDAMEAN SCORE
3.1Questions were clearly asked
MALE PIT
Response 1014 3 1 0
4.2Score 50
56 9 2 0
%age 3650 11 4 0
MALE NIT
Response 2 8 11 3 1
3.3Score 1032 33 6 1
%age 832 44 12 4
FEMALE PIT
Response 711 10 0 0
3.9Score 35
44 30 0 0
%age 2539 36 0 0
FEMAE NIT
Response 1 8 12 6 0
3.1Score 532 36 12 0
%age 430 44 22 0
3.2 Questions were generally
comprehended by the students MALE PIT
Response 1112 4 0 0
4.3Score 55
48 12 0 0
%age 4144 15 0 0
MALE NIT Response 3 7 11 2 1 3.4

147
Score 1528 33 4 1
%age 1329 46 8 4
FEMALE PIT
Response 810 9 1 0
3.9Score 40
40 27 2 0
%age 2936 32 4 0
FEMALE NIT
Response 1 8 15 4 0
3.2Score 532 45 8 0
%age 429 54 14 0
3.3
The students were given time
for thinking answer after asking the questions
MALE PIT
Response 713 6 1 0
4.0Score 35
52 18 2 0
%age 2648 22 4 0
MALE NIT
Response 2 9 10 3 1
3.3Score 1036 30 6 1
%age 836 40 12 4
FEMALE PIT
Response 714 7 1 0
3.9Score 35
56 21 2 0
%age 2448 24 3 0
FEMALE NIT
Response 110 11 5 1
3.2Score 5
40 33 10 1
%age 436 39 18 4
ITEM NO.
STATEMENT TEACHER DATA SA A UNC DA SDAMEAN SCORE
3.4 Both easy and difficult
questions were
MALE PITResponse 9
12 3 3 0
4.0
Score 45 4 9 6 0

148
asked
8
%age 3344 11 11 0
MALE NIT
Response 2 5 12 4 2
3.0Score 1020 36 8 2
%age 820 48 16 8
FEMALE PIT
Response 716 4 0 0
4.1Score 35
64 12 0 0
%age 2659 15 0 0
FEMALE NIT
Response 3 9 11 2 2
3.3Score 1536 33 4 2
%age 1133 41 7 7
3.5
The questions provided the
students to think deep over for
response
MALE PIT
Response 813 6 0 0
4.1Score 40
52 18 0 0
%age 3048 22 0 0
MALE NIT
Response 2 6 12 5 1
3.1Score 1024 36 10 1
%age 823 46 19 4
FEMALE PIT
Response 911 7 1 0
4.0Score 45
44 21 2 0
%age 3239 25 4 0
FEMALE NIT
Response 0 9 12 4 1
3.1Score 036 36 8 1
%age 035 46 15 4
3.6 Maximum students were
MALE PIT Response 10 14
2 1 0 4.2

149
asked questions in the given time
Score 5056 6 2 0
%age 3752 7 4 0
MALE NIT
Response 2 7 12 3 1
3.2Score 1028 36 6 1
%age 828 48 12 4
FEMALE PIT
Response 1114 1 1 0
4.3Score 55
56 3 2 0
%age 4152 4 4 0
FEMALE NIT
Response 2 7 12 4 0
3.3Score 1028 36 8 0
%age 828 48 16 0
ITEM NO.
STATEMENT TEACHER DATA SA A UNC DA SDAMEAN SCORE
3.7 Questions were relevant to the
under study lesson MALE PIT
Response 1011 5 1 0
4.1Score 50
44 15 2 0
%age 3741 19 4 0
MALE NIT
Response 3 7 9 4 2
3.2Score 1528 27 8 2
%age 1228 36 16 8
FEMALE PIT
Response 1015 4 0 0
4.2Score 50
60 12 0 0
%age 3452 14 0 0
FEMALE NIT Response 7
10 7 1 1
3.8
Score 35 40
21 2 1

150
%age 2738 27 4 4
3.8
Questions were only asked
to check the memory
MALE PIT
Response 14 6 6 1 0
4.2Score 7024 18 2 0
%age 5222 22 4 0
MALE NIT
Response 3 3 11 4 2
3.0Score 1512 33 8 2
%age 1313 48 17 9
FEMALE PIT
Response 10 6 11 1 1
3.8Score 5024 33 2 1
%age 3421 38 3 3
FEMALE NIT
Response 2 7 9 4 1
3.2Score 1028 27 8 1
%age 930 39 17 4

151
Table No. 4.1.28 indicates that the mean score of Urban PIT male teachers ranges from 3.1 to 3.7, whereas mean score of PIT female teachers ranges from 2.9 to 3.7.This indicates similar performance of both the groups in application of teaching skill, "Listening".
Table 4.1.28 Comparison of the performance of Urban PIT male and female teachers with respect to different aspects of "Listening"
ITEM NO.
STATEMENT TEACHER DATA SA A UNC DA SDAMEAN SCORE
4.1 Realized the
problems of the students on time
MALE PIT
Response 610 9 3 0
3.7Score 30
40 27 6 0
%age 2136 32 11 0
MALE NIT
Response 1 7 14 5 0
3.1Score 528 42 10 0
%age 426 52 19 0
FEMALE PIT
Response 510 10 3 0
3.6Score 25
40 30 6 0
%age 1836 36 11 0
FEMALE NIT
Response 1 4 14 4 2
2.9Score 516 42 8 2
%age 416 56 16 8
4.2 The students were guided
with respect to their problems MALE PIT
Response 414 6 2 0
3.8Score 20
56 18 4 0
%age 1554 23 8 0
MALE NIT Response 0 6 12 6 1 2.9

152
Score 024 36 12 1
%age 024 48 24 4
FEMALE PIT
Response 413 9 2 0
3.7Score 20
52 27 4 0
%age 1446 32 7 0
FEMALE NIT
Response 2 8 12 3 1
3.3Score 1032 36 6 1
%age 831 46 12 4
4.3
Steps were taken to
maintain the interest of
students during teaching
MALE PIT
Response 515 5 2 0
3.9Score 25
60 15 4 0
%age 1956 19 7 0
MALE NIT
Response 1 8 10 6 1
3.1Score 532 30 12 1
%age 431 38 23 4
FEMALE PIT
Response 511 10 2 0
3.7Score 25
44 30 4 0
%age 1839 36 7 0
FEMALE NIT
Response 2 6 16 2 0
3.3Score 1024 48 4 0
%age 823 62 8 0

153
Table No.4.1.29 indicates that the mean score of Urban PIT male teachers ranges from 3.1 to 4.2, whereas mean score of PIT female teachers ranges from 3.0 to 3.8. This indicates better performance of Urban PIT male teachers with respect to different aspects of teaching skill, "Motivation".
Table 4.1.29 Comparison of the performance of Urban PIT male and female teachers with respect to different aspects of "Motivation"
ITEM NO.
STATEMENT TEACHER DATA SA A UNC DA SDAMEAN SCORE
5.1
Words, phrases like "correct", “good", “very good", "fine"
and "excellent" were used
during question/ answer session.
MALE PIT
Response 712 7 2 0
3.9Score 35
48 21 4 0
%age 2543 25 7 0
MALE NIT
Response 2 4 16 1 2
3.1Score 1016 48 2 2
%age 816 64 4 8
FEMALE PIT
Response 310 9 4 0
3.5Score 15
40 27 8 0
%age 1238 35 15 0
FEMALE NIT
Response 2 5 14 4 2
3.0Score 1020 42 8 2
%age 719 52 15 7
5.2 Gestures like "yes", "right"
and "good" were used on the
correct responses of the students
for their encouragement
MALE PIT
Response 810 7 1 0
4.0Score 40
40 21 2 0
%age 3138 27 4 0
MALE NIT Response 4 9 9 1 2 3.5Score 20 3 27 2 2

154
6
%age 1636 36 4 8
FEMALE PIT
Response 411 9 3 0
3.6Score 20
44 27 6 0
%age 1541 33 11 0
FEMALE NIT
Response 2 8 11 6 0
3.2Score 1032 33 12 0
%age 730 41 22 0
5.3
For the encouragement of the students
multiple gestures like,"modding" "given smile"
"yes yes" "now say" and "this is good idea" were
used
MALE PIT
Response 11 9 5 1 0
4.2Score 5536 15 2 0
%age 4235 19 4 0
MALE NIT
Response 210 13 2 0
3.4Score 10
40 39 4 0
%age 737 48 7 0
FEMALE PIT
Response 213 7 3 0
3.6Score 10
52 21 6 0
%age 852 28 12 0
FEMALE NIT
Response 4 9 11 2 1
3.5Score 2036 33 4 1
%age 1533 41 7 4
ITEM NO.
STATEMENT TEACHER DATA SA A UNC DA SDAMEAN SCORE
5.4 The students were provided
help for answering the
suitable answer
MALE PITResponse 5
15 5 1 1
3.8
Score 2560 15 2 1
%age 19 5 19 4 4

155
6
MALE NIT
Response 2 8 8 4 2
3.2Score 1032 24 8 2
%age 833 33 17 8
FEMALE PIT
Response 512 6 1 1
3.8Score 25
48 18 2 1
%age 2048 24 4 4
FEMALE NIT
Response 1 7 13 8 0
3.0Score 528 39 16 0
%age 324 45 28 0
5.5
With the help of simple
instructions the students were
encouraged for correct response, e.g. "think over
again"
MALE PIT
Response 615 2 2 1
3.9Score 30
60 6 4 1
%age 2358 8 8 4
MALE NIT
Response 1 7 11 3 2
3.1Score 528 33 6 2
%age 429 46 13 8
FEMALE PIT
Response 611 6 4 0
3.7Score 30
44 18 8 0
%age 2241 22 15 0
FEMALE NIT
Response 2 9 9 3 0
3.4Score 1036 27 6 0
%age 939 39 13 0
5.6 Students were encouraged for correct part of
MALE PIT Response 10 9 7 1 1 3.9Score 50 3
621 2 1

156
answer
%age 3632 25 4 4
MALE NIT
Response 1 9 11 2 1
3.3Score 536 33 4 1
%age 438 46 8 4
FEMALE PIT
Response 513 3 3 0
3.8Score 25
52 9 6 0
%age 2154 13 13 0
FEMALE NIT
Response 210 10 4 1
3.3Score 10
40 30 8 1
%age 737 37 15 4

157
Table No.4.1.30 depicts that the mean score of Urban PIT male teachers ranges from 3.0 to 4.3, whereas mean score of PIT female teachers ranges from 3.1 to 3.9. This reveals better performance of Urban PIT male teachers with respect to different aspects of teaching skill, "Teachers liveliness".
Table 4.1.30 Comparison of the performance of Urban PIT male & female teachers with respect to different aspects of "Teacher Liveliness"
ITEM NO.
STATEMENT TEACHER DATA SA A UNC DA SDAMEAN SCORE
6.1
The teacher moved on proper time on teaching
place
MALE PIT
Response 1310 3 1 0
4.3Score 65
40 9 2 0
%age 4837 11 4 0
MALE NIT
Response 2 6 12 3 2
3.1Score 1024 36 6 2
%age 824 48 12 8
FEMALE PIT
Response 711 8 1 0
3.9Score 35
44 24 2 0
%age 2641 30 4 0
FEMALE NIT
Response 5 6 8 5 1
3.4Score 2524 24 10 1
%age 2024 32 20 4
6.2 The teacher has made the
teaching method more effective
with the posture and gesture i.e.
"hands", "body",
MALE PIT
Response 15 9 2 2 0
4.3Score 7536 6 4 0
%age 5432 7 7 0
MALE NIT Response 2 9 9 3 2 3.2Score 10 3 27 6 2
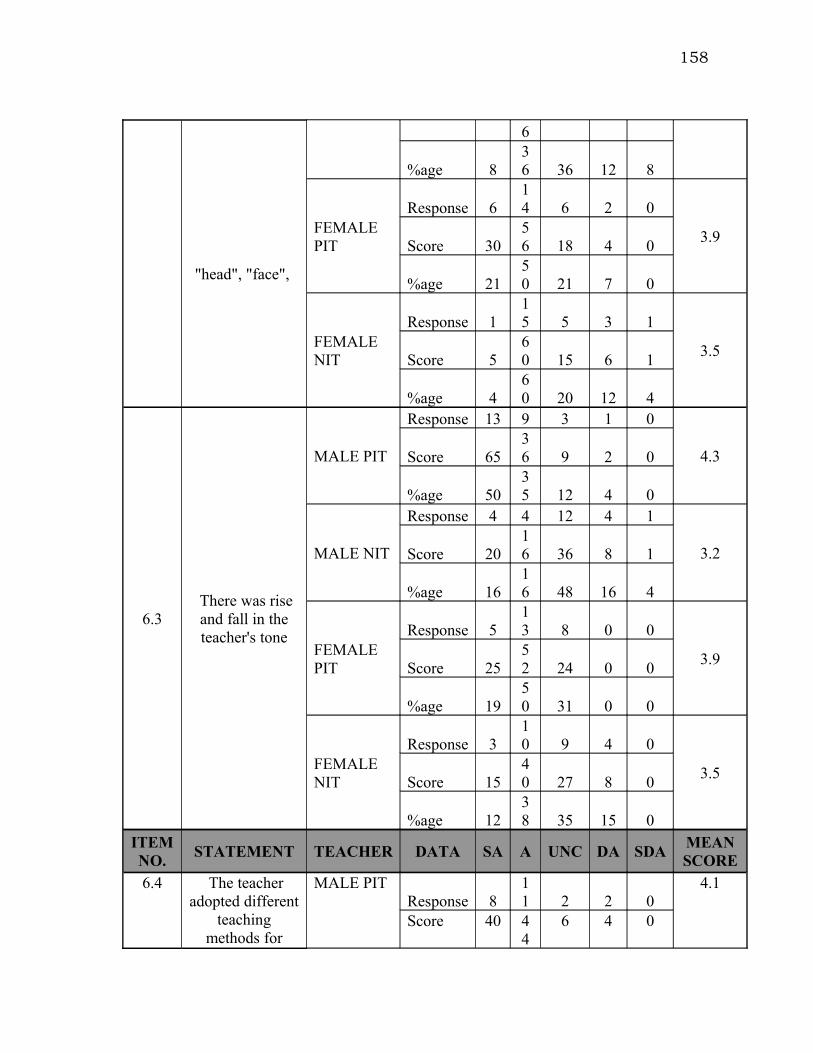
158
"head", "face",
6
%age 836 36 12 8
FEMALE PIT
Response 614 6 2 0
3.9Score 30
56 18 4 0
%age 2150 21 7 0
FEMALE NIT
Response 115 5 3 1
3.5Score 5
60 15 6 1
%age 460 20 12 4
6.3 There was rise and fall in the teacher's tone
MALE PIT
Response 13 9 3 1 0
4.3Score 6536 9 2 0
%age 5035 12 4 0
MALE NIT
Response 4 4 12 4 1
3.2Score 2016 36 8 1
%age 1616 48 16 4
FEMALE PIT
Response 513 8 0 0
3.9Score 25
52 24 0 0
%age 1950 31 0 0
FEMALE NIT
Response 310 9 4 0
3.5Score 15
40 27 8 0
%age 1238 35 15 0
ITEM NO.
STATEMENT TEACHER DATA SA A UNC DA SDAMEAN SCORE
6.4 The teacher adopted different
teaching methods for
MALE PITResponse 8
11 2 2 0
4.1
Score 40 44
6 4 0

159
attention and motivation
purposes e.g. teachers
students and students'
teachers group were made
%age 3548 9 9 0
MALE NIT
Response 1 7 7 6 1
3.0Score 528 21 12 1
%age 532 32 27 5
FEMALE PIT
Response 410 8 4 0
3.5Score 20
40 24 8 0
%age 1538 31 15 0
FEMALE NIT
Response 1 9 11 5 1
3.1Score 536 33 10 1
%age 433 41 19 4
6.5
Provision of short interval. The students
were provided time to give attention and think over the
important points
MALE PIT
Response 911 2 2 0
4.1Score 45
44 6 4 0
%age 3846 8 8 0
MALE NIT
Response 011 7 6 1
3.1Score 0
44 21 12 1
%age 044 28 24 4
FEMALE PIT
Response 511 9 1 0
3.8Score 25
44 27 2 0
%age 1942 35 4 0
FEMALE NIT
Response 3 5 14 4 1
3.2Score 1520 42 8 1
%age 1119 52 15 4

160
Table No. 4.1.31 shows that the mean score of Urban PIT male teachers ranges from 3.1 to 4.2, whereas mean score of PIT female teachers ranges from 3.0 to 4.1. This reveals better performance of Urban PIT male teachers with respect to different aspects of teaching skill, "Closure of lesson".
Table 4.1.31 Comparison of the performance of Urban PIT male and female teachers with respect to different aspects of "Closure of lesson"
ITEM NO.
STATEMENT TEACHER DATA SA A UNC DA SDAMEAN SCORE
7.1
The way in which the
teacher wind up the lesson was an interesting
one
MALE PIT
Response 615 2 2 0
4.0Score 30
60 6 4 0
%age 2460 8 8 0
MALE NIT
Response 210 8 5 0
3.4Score 10
40 24 10 0
%age 840 32 20 0
FEMALE PIT
Response 9 9 9 1 0
3.9Score 4536 27 2 0
%age 3232 32 4 0
FEMALE NIT
Response 1 7 12 6 2
3.0Score 528 36 12 2
%age 425 43 21 7
7.2 The method in which the lesson
ended has aroused the
interest of the students
MALE PIT
Response 1012 2 3 0
4.1Score 50
48 6 6 0
%age 3744 7 11 0
MALE NIT Response 1 8 11 4 0 3.3

161
Score 532 33 8 0
%age 433 46 17 0
FEMALE PIT
Response 514 7 0 0
3.9Score 25
56 21 0 0
%age 1954 27 0 0
FEMALE NIT
Response 3 8 11 4 1
3.3Score 1532 33 8 1
%age 1130 41 15 4
7.3
The end of the lesson and the real lesson has connectivity
with each other
MALE PIT
Response 1015 2 1 0
4.2Score 50
60 6 2 0
%age 3654 7 4 0
MALE NIT
Response 1 7 12 3 1
3.2Score 528 36 6 1
%age 429 50 13 4
FEMALE PIT
Response 11 9 7 0 0
4.1Score 5536 21 0 0
%age 4133 26 0 0
FEMALE NIT
Response 112 6 6 1
3.2Score 5
48 18 12 1
%age 446 23 23 4
ITEM NO.
STATEMENT TEACHER DATA SA A UNC DA SDAMEAN SCORE
7.4 The conclusion of the lesson was
the sum up of actual lesson and
MALE PITResponse 9
15 2 1 0
4.2
Score 45 60
6 2 0

162
was also clear to the students
%age 3356 7 4 0
MALE NIT
Response 2 7 8 6 1
3.1Score 1028 24 12 1
%age 829 33 25 4
FEMALE PIT
Response 912 6 0 0
4.1Score 45
48 18 0 0
%age 3344 22 0 0
FEMALE NIT
Response 012 9 3 1
3.3Score 0
48 27 6 1
%age 048 36 12 4
7.5 Revision of
lesson was done
MALE PIT
Response 1110 5 1 0
4.1Score 55
40 15 2 0
%age 4137 19 4 0
MALE NIT
Response 212 9 2 0
3.6Score 10
48 27 4 0
%age 848 36 8 0
FEMALE PIT
Response 1011 6 0 0
4.1Score 50
44 18 0 0
%age 3741 22 0 0
FEMALE NIT
Response 3 9 9 4 0
3.4Score 1536 27 8 0
%age 1236 36 16 0
7.6 Home work was MALE PIT Response 9 1 6 1 0 4.0

163
given to the students
1
Score 4544 18 2 0
%age 3341 22 4 0
MALE NIT
Response 0 8 11 5 0
3.1Score 032 33 10 0
%age 033 46 21 0
FEMALE PIT
Response 10 8 8 0 0
4.1Score 5032 24 0 0
%age 3831 31 0 0
FEMALE NIT
Response 211 9 3 1
3.4Score 10
44 27 6 1
%age 842 35 12 4
ITEM NO.
STATEMENT TEACHER DATA SA A UNC DA SDAMEAN SCORE
7.7 Understanding of the lesson was realized by the
students MALE PIT
Response 716 2 1 0
4.1Score 35
64 6 2 0
%age 2762 8 4 0
MALE NIT
Response 010 11 4 0
3.2Score 0
40 33 8 0
%age 040 44 16 0
FEMALE PIT
Response 712 10 0 0
3.9Score 35
48 30 0 0
%age 2441 34 0 0
FEMALE NIT
Response 6 12
7 5 1 3.5

164
Score 3048 21 10 1
%age 1939 23 16 3

165
Table No. 4.1.32 revels that the mean score of Urban PIT male teachers ranges from 30 to 4.0, whereas mean score of PIT female teachers ranges from 2.8 to 3.9. This reveals better performance of Urban PIT male teachers with respect to different aspects of teaching skill, "Planning".
Table 4.1.32 Comparison of the performance of PIT male and female teachers with respect to different aspects of "Planning"
ITEM NO.
STATEMENT TEACHER DATA SA A UNC DA SDAMEAN SCORE
8.1The teaching
was planned and integrated
MALE PIT
Response 512 9 1 0
3.8Score 25
48 27 2 0
%age 1944 33 4 0
MALE NIT
Response 0 8 10 5 1
3.0Score 032 30 10 1
%age 033 42 21 4
FEMALE PIT
Response 611 10 0 0
3.9Score 30
44 30 0 0
%age 2241 37 0 0
FEMALE NIT
Response 0 3 14 7 0
2.8Score 012 42 14 0
%age 013 58 29 0
8.2 The teaching was effective
MALE PIT
Response 613 7 1 0
3.9Score 30
52 21 2 0
%age 2248 26 4 0
MALE NIT Response 0 9 10 5 1 3.1

166
Score 036 30 10 1
%age 036 40 20 4
FEMALE PIT
Response 411 12 0 0
3.7Score 20
44 36 0 0
%age 1541 44 0 0
FEMALE NIT
Response 1 9 13 3 0
3.3Score 536 39 6 0
%age 435 50 12 0
8.3 Teaching was
according to the objectives
MALE PIT
Response 612 7 1 0
3.9Score 30
48 21 2 0
%age 2346 27 4 0
MALE NIT
Response 0 9 8 5 2
3.0Score 036 24 10 2
%age 038 33 21 8
FEMALE PIT
Response 414 6 1 0
3.8Score 20
56 18 2 0
%age 1656 24 4 0
FEMALE NIT
Response 211 8 5 0
3.4Score 10
44 24 10 0
%age 842 31 19 0
ITEM NO.
STATEMENT TEACHER DATA SA A UNC DA SDAMEAN SCORE
8.4 All the students needs were
properly
MALE PITResponse 7
14 5 1 0
4.0
Score 35 5 15 2 0

167
managed during the teaching
process
6
%age 2652 19 4 0
MALE NIT
Response 0 9 10 4 1
3.1Score 036 30 8 1
%age 038 42 17 4
FEMALE PIT
Response 610 9 0 0
3.9Score 30
40 27 0 0
%age 2440 36 0 0
FEMALE NIT
Response 4 6 10 7 1
3.2Score 2024 30 14 1
%age 1421 36 25 4
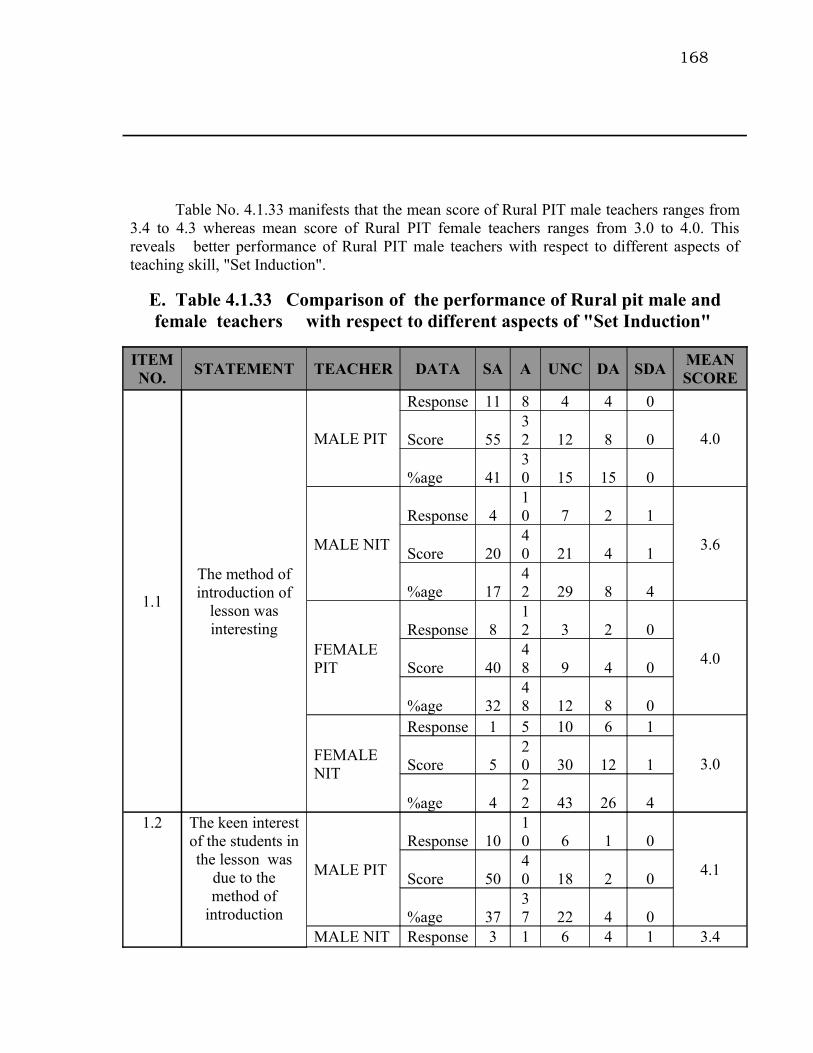
168
Table No. 4.1.33 manifests that the mean score of Rural PIT male teachers ranges from 3.4 to 4.3 whereas mean score of Rural PIT female teachers ranges from 3.0 to 4.0. This reveals better performance of Rural PIT male teachers with respect to different aspects of teaching skill, "Set Induction".
E. Table 4.1.33 Comparison of the performance of Rural pit male and female teachers with respect to different aspects of "Set Induction"
ITEM NO.
STATEMENT TEACHER DATA SA A UNC DA SDAMEAN SCORE
1.1
The method of introduction of
lesson was interesting
MALE PIT
Response 11 8 4 4 0
4.0Score 5532 12 8 0
%age 4130 15 15 0
MALE NIT
Response 410 7 2 1
3.6Score 20
40 21 4 1
%age 1742 29 8 4
FEMALE PIT
Response 812 3 2 0
4.0Score 40
48 9 4 0
%age 3248 12 8 0
FEMALE NIT
Response 1 5 10 6 1
3.0Score 520 30 12 1
%age 422 43 26 4
1.2 The keen interest of the students in the lesson was
due to the method of
introduction
MALE PIT
Response 1010 6 1 0
4.1Score 50
40 18 2 0
%age 3737 22 4 0
MALE NIT Response 3 1 6 4 1 3.4

169
1
Score 1544 18 8 1
%age 1244 24 16 4
FEMALE PIT
Response 913 3 1 3
3.8Score 45
52 9 2 3
%age 3145 10 3 10
FEMALE NIT
Response 3 9 11 4 1
3.3Score 1536 33 8 1
%age 1132 39 14 4
1.3
The introduction of the lesson and the relation of
actual lesson was clear to the
students
MALE PIT
Response 13 8 4 1 0
4.3Score 6532 12 2 0
%age 5031 15 4 0
MALE NIT
Response 515 5 1 1
3.8Score 25
60 15 2 1
%age 1956 19 4 4
FEMALE PIT
Response 913 5 0 0
4.1Score 45
52 15 0 0
%age 3348 19 0 0
FEMALE NIT
Response 0 8 12 5 0
3.1Score 032 36 10 0
%age 032 48 20 0

170
Table No.4.1.34 shows that the mean score of Rural PIT male teachers ranges from 3.1 to 4.3 whereas mean score of Rural PIT female teachers ranges from 3.5 to 4.3 which indicates equal performance of both the groups in the area of teaching skill, "Presentation".
Table 4.1.34 Comparison of the performance of Rural PIT male and Rural PIT female teachers with respect to different aspects of "Presentation"
ITEM NO.
STATEMENT TEACHER DATA SA A UNC DA SDAMEAN SCORE
2.1
Explanation was fully
comprehensive to the students
MALE PIT
Response 1110 4 2 0
4.1Score 55
40 12 4 0
%age 4137 15 7 0
MALE NIT
Response 2 8 8 7 1
3.1Score 1032 24 14 1
%age 831 31 27 4
FEMALE PIT
Response 812 4 1 0
4.1Score 40
48 12 2 0
%age 3248 16 4 0
FEMALE NIT
Response 3 9 8 4 0
3.5Score 1536 24 8 0
%age 1338 33 17 0
2.2 The students were impressed
by the explanation. MALE PIT
Response 1210 5 0 0
4.3Score 60
40 15 0 0
%age 4437 19 0 0
MALE NIT Response 2 12
10 2 0 3.5

171
Score 1048 30 4 0
%age 846 38 8 0
FEMALE PIT
Response 814 1 1 0
4.2Score 40
56 3 2 0
%age 3358 4 4 0
FEMALE NIT
Response 2 8 10 2 0
3.5Score 1032 30 4 0
%age 936 45 9 0
2.3Explanation covered the
important points
MALE PIT
Response 1110 5 0 0
4.2Score 55
40 15 0 0
%age 4238 19 0 0
MALE NIT
Response 4 9 11 1 1
3.5Score 2036 33 2 1
%age 1535 42 4 4
FEMALE PIT
Response 1210 3 1 0
4.3Score 60
40 9 2 0
%age 4638 12 4 0
FEMALE NIT
Response 110 13 0 0
3.5Score 5
40 39 0 0
%age 442 54 0 0
ITEM NO.
STATEMENT TEACHER DATA SA A UNC DA SDAMEAN SCORE
2.4 Demonstrated models, pictures
and examples
MALE PITResponse 9
10 6 0 0
4.1
Score 45 4 18 0 0

172
were source of interest to the
students
0
%age 3640 24 0 0
MALE NIT
Response 113 8 3 1
3.4Score 5
52 24 6 1
%age 450 31 12 4
FEMALE PIT
Response 1111 3 0 0
4.3Score 55
44 9 0 0
%age 4444 12 0 0
FEMALE NIT
Response 4 8 10 2 0
3.6Score 2032 30 4 0
%age 1733 42 8 0
2.5
Demonstrated models, pictures
and examples were up to the mental level of
the students
MALE PIT
Response 1111 4 0 0
4.3Score 55
44 12 0 0
%age 4242 15 0 0
MALE NIT
Response 115 6 3 1
3.5Score 5
60 18 6 1
%age 458 23 12 4
FEMALE PIT
Response 11 8 5 0 0
4.3Score 5532 15 0 0
%age 4633 21 0 0
FEMALE NIT
Response 213 9 0 0
3.7Score 10
52 27 0 0
%age 854 38 0 0

173
Table No.4.1.35 points out that the Mean score of Rural PIT male teachers ranges from 3.0 to 4.3 whereas mean score of Rural PIT female teachers is from 3.2 to 4.3. There is no difference in the performance of the two groups in the particular area of "Questioning".
Table 4.1.35 Comparison of the performance of Rural PIT Male and Rural PIT female teachers and with respect to different aspects of "Questioning"
ITEM NO.
STATEMENT TEACHER DATA SA A UNC DA SDAMEAN SCORE
3.1Questions were clearly asked
MALE PIT
Response 12 8 4 2 0
4.2Score 6032 12 4 0
%age 4631 15 8 0
MALE NIT
Response 1 7 10 6 1
3.0Score 528 30 12 1
%age 428 40 24 4
FEMALE PIT
Response 815 3 0 0
4.2Score 40
60 9 0 0
%age 3158 12 0 0
FEMALE NIT
Response 0 9 12 2 0
3.3Score 036 36 4 0
%age 039 52 9 0
3.2 Questions were generally
comprehended by the students
MALE PIT
Response 11 5 8 1 0
4.0Score 5520 24 2 0
%age 4420 32 4 0
MALE NITResponse 0
12 8 4 2
3.2
Score 0 4 24 8 2

174
8
%age 046 31 15 8
FEMALE PIT
Response 914 3 0 0
4.2Score 45
56 9 0 0
%age 3554 12 0 0
FEMALE NIT
Response 0 9 10 4 0
3.2Score 036 30 8 0
%age 039 43 17 0
3.3
The students were given time
for thinking answer after asking the questions
MALE PIT
Response 12 9 5 0 0
4.3Score 6036 15 0 0
%age 4635 19 0 0
MALE NIT
Response 115 7 2 1
3.5Score 5
60 21 4 1
%age 458 27 8 4
FEMALE PIT
Response 911 4 1 0
4.1Score 45
44 12 2 0
%age 3644 16 4 0
FEMALE NIT
Response 1 7 13 3 0
3.3Score 528 39 6 0
%age 429 54 13 0
ITEM NO.
STATEMENT TEACHER DATA SA A UNC DA SDAMEAN SCORE
3.4 Both easy and difficult
questions were asked
MALE PIT Response 11 9 6 0 0 4.2
Score 5536 18 0 0
%age 42 35
23 0 0

175
MALE NIT
Response 3 9 8 5 1
3.3Score 1536 24 10 1
%age 1235 31 19 4
FEMALE PIT
Response 1012 3 0 0
4.3Score 50
48 9 0 0
%age 4048 12 0 0
FEMALE NIT
Response 2 7 13 2 0
3.4Score 1028 39 4 0
%age 829 54 8 0
3.5
The questions provided the
students to think deep over for
response
MALE PIT
Response 911 6 1 0
4.0Score 45
44 18 2 0
%age 3341 22 4 0
MALE NIT
Response 214 7 3 1
3.5Score 10
56 21 6 1
%age 752 26 11 4
FEMALE PIT
Response 11 8 6 1 0
4.1Score 5532 18 2 0
%age 4231 23 4 0
FEMALE NIT
Response 1 7 16 0 0
3.4Score 528 48 0 0
%age 429 67 0 0
3.6 Maximum students were
asked questions in the given time
MALE PITResponse 8
11 5 1 0
4.0
Score 4044 15 2 0
%age 32 4 20 4 0
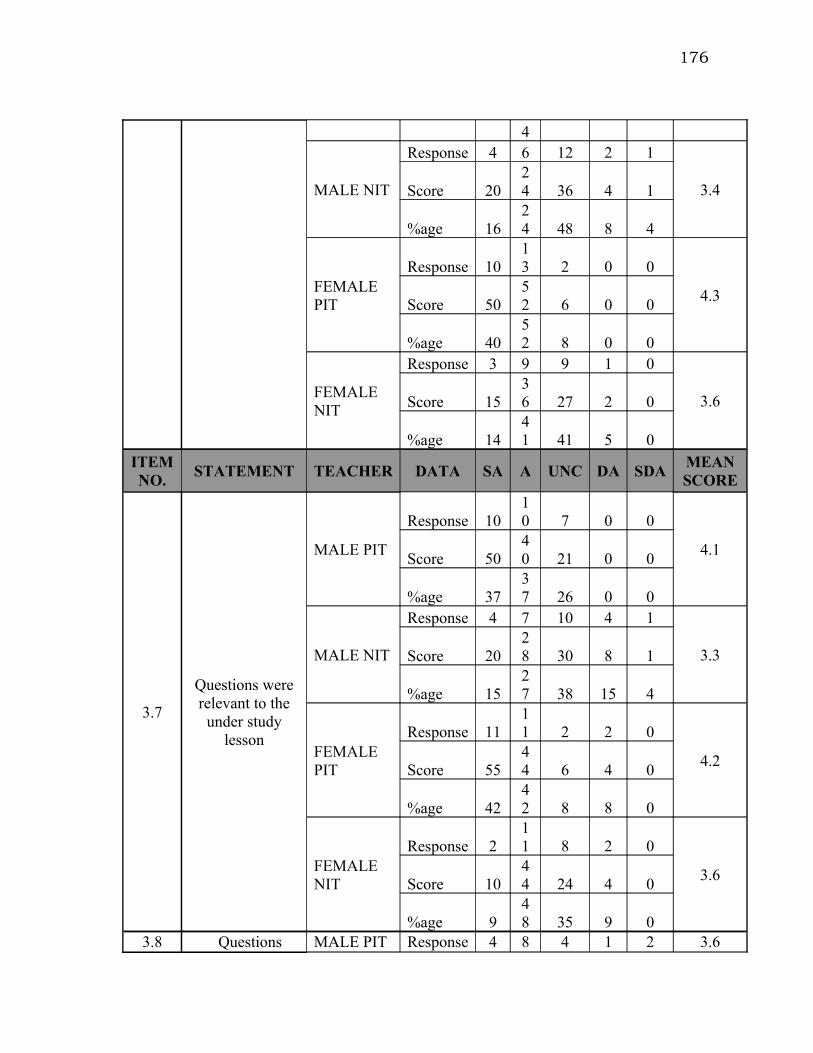
176
4
MALE NIT
Response 4 6 12 2 1
3.4Score 2024 36 4 1
%age 1624 48 8 4
FEMALE PIT
Response 1013 2 0 0
4.3Score 50
52 6 0 0
%age 4052 8 0 0
FEMALE NIT
Response 3 9 9 1 0
3.6Score 1536 27 2 0
%age 1441 41 5 0
ITEM NO.
STATEMENT TEACHER DATA SA A UNC DA SDAMEAN SCORE
3.7
Questions were relevant to the
under study lesson
MALE PIT
Response 1010 7 0 0
4.1Score 50
40 21 0 0
%age 3737 26 0 0
MALE NIT
Response 4 7 10 4 1
3.3Score 2028 30 8 1
%age 1527 38 15 4
FEMALE PIT
Response 1111 2 2 0
4.2Score 55
44 6 4 0
%age 4242 8 8 0
FEMALE NIT
Response 211 8 2 0
3.6Score 10
44 24 4 0
%age 948 35 9 0
3.8 Questions MALE PIT Response 4 8 4 1 2 3.6

177
were only asked to check the
memory
Score 2032 12 2 2
%age 2142 21 5 11
MALE NIT
Response 1 9 7 1 1
3.4Score 536 21 2 1
%age 547 37 5 5
FEMALE PIT
Response 911 4 1 0
4.1Score 45
44 12 2 0
%age 3644 16 4 0
FEMALE NIT
Response 011 10 1 0
3.5Score 0
44 30 2 0
%age 050 45 5 0

178
Table No. 4.1.36 leads that the mean score of Rural PIT male teachers ranges from 3.0 to 3. 9 whereas Rural PIT female teachers ranges from 3.3 to 4.0. This shows better performance of Rural PIT female teachers with respect to application of teaching skill "Listening".
Table 4.1.36 Comparison of the performance of Rural PIT Male and Rural PIT female teachers with respect to different aspects of "Listening"
ITEM NO.
STATEMENT TEACHER DATA SA A UNC DA SDAMEAN SCORE
4.1 Realized the
problems of the students on time
MALE PIT
Response 413 7 1 2
3.6Score 20
52 21 2 2
%age 1548 26 4 7
MALE NIT
Response 2 8 7 10 1
3.0Score 1032 21 20 1
%age 729 25 36 4
FEMALE PIT
Response 314 9 0 0
3.8Score 15
56 27 0 0
%age 1254 35 0 0
FEMALE NIT
Response 0 7 10 4 0
3.1Score 028 30 8 0
%age 033 48 19 0
4.2 The students were guided
with respect to their problems MALE PIT
Response 711 7 1 1
3.8Score 35
44 21 2 1
%age 2641 26 4 4
MALE NIT Response 1 1 11 4 1 3.2

179
0
Score 540 33 8 1
%age 437 41 15 4
FEMALE PIT
Response 612 8 0 0
3.9Score 30
48 24 0 0
%age 2346 31 0 0
FEMALE NIT
Response 1 5 14 3 0
3.2Score 520 42 6 0
%age 422 61 13 0
4.3
Steps were taken to
maintain the interest of
students during teaching
MALE PIT
Response 10 7 7 2 1
3.9Score 5028 21 4 1
%age 3726 26 7 4
MALE NIT
Response 3 4 18 0 1
3.3Score 1516 54 0 1
%age 1215 69 0 4
FEMALE PIT
Response 812 5 2 0
4.0Score 40
48 15 4 0
%age 3044 19 7 0
FEMALE NIT
Response 0 8 14 2 0
3.3Score 032 42 4 0
%age 033 58 8 0

180
Table No. 4.1.37 states that the mean score of Rural PIT male teachers ranges from 3.1 to 4.2, whereas mean score of Rural PIT female teachers ranges from 3.1 to 4.3. This indicates better performance of Rural PIT female teachers with respect to different aspects of teaching skill, "Motivation".
Table 4.1.37 Comparison of the performance of Rural PIT male and Rural PIT female teachers with respect to different aspects of "Motivation"
ITEM NO.
STATEMENT TEACHER DATA SA A UNC DA SDAMEAN SCORE
5.1
Words, phrases like "correct", “good", “very good", "fine"
and "excellent" were used
during question/ answer session.
MALE PIT
Response 810 7 0 1
3.9Score 40
40 21 0 1
%age 3138 27 0 4
MALE NIT
Response 114 6 4 1
3.4Score 5
56 18 8 1
%age 454 23 15 4
FEMALE PIT
Response 814 5 1 0
4.0Score 40
56 15 2 0
%age 2950 18 4 0
FEMALE NIT
Response 2 9 11 4 0
3.3Score 1036 33 8 0
%age 835 42 15 0
5.2 Gestures like "yes", "right"
and "good" were used on the
correct response of the students
MALE PIT
Response 9 9 7 0 0
4.1Score 4536 21 0 0
%age 3636 28 0 0
MALE NIT Response 1 1 6 4 1 3.4

181
for their encouragement
4
Score 556 18 8 1
%age 454 23 15 4
FEMALE PIT
Response 1211 3 0 0
4.3Score 60
44 9 0 0
%age 4642 12 0 0
FEMALE NIT
Response 2 8 11 4 0
3.3Score 1032 33 8 0
%age 832 44 16 0
5.3
For the encouragement of the students
multiple gestures like,"modding" "given smile"
"yes yes" "now say" and "this is good idea" were
used
MALE PIT
Response 1012 4 0 0
4.2Score 50
48 12 0 0
%age 3846 15 0 0
MALE NIT
Response 1 9 13 1 1
3.3Score 536 39 2 1
%age 436 52 4 4
FEMALE PIT
Response 812 3 2 0
4.0Score 40
48 9 4 0
%age 3248 12 8 0
FEMALE NIT
Response 3 9 8 4 0
3.5Score 1536 24 8 0
%age 1338 33 17 0
ITEM NO.
STATEMENT TEACHER DATA SA A UNC DA SDAMEAN SCORE
5.4 The students were provided
help for
MALE PIT Response 10 9 5 1 0 4.1Score 50 3
615 2 0

182
answering the suitable answer
%age 4036 20 4 0
MALE NIT
Response 110 9 2 1
3.3Score 5
40 27 4 1
%age 443 39 9 4
FEMALE PIT
Response 612 6 2 0
3.8Score 30
48 18 4 0
%age 2346 23 8 0
FEMALE NIT
Response 1 6 10 5 0
3.1Score 524 30 10 0
%age 527 45 23 0
5.5
With the help of simple
instructions the students were
encouraged for correct response, e.g. "think over
again"
MALE PIT
Response 613 4 2 0
3.9Score 30
52 12 4 0
%age 2452 16 8 0
MALE NIT
Response 110 8 5 2
3.1Score 5
40 24 10 2
%age 438 31 19 8
FEMALE PIT
Response 714 6 1 0
4.0Score 35
56 18 2 0
%age 2550 21 4 0
FEMALE NIT
Response 2 6 12 1 1
3.3Score 1024 36 2 1
%age 927 55 5 5
5.6 Students were MALE PIT Response 9 8 8 0 0 4.0

183
encouraged for correct part of
answer
Score 4532 24 0 0
%age 3632 32 0 0
FEMALE NIT
Response 012 9 3 1
3.3Score 0
48 27 6 1
%age 048 36 12 4
FEMALE PIT
Response 712 7 0 0
4.0Score 35
48 21 0 0
%age 2746 27 0 0
FEMALE NIT
Response 2 7 11 2 1
3.3Score 1028 33 4 1
%age 930 48 9 4

184
Table No. 4.1.38 shows that the mean score of Rural PIT male teachers with respect to application of teaching skill "Teacher's liveliness" ranges from 3.1 to 4.3 whereas the mean score of Rural PIT female teachers is from 3.0 to 4.3. This state similar performance of both the groups in the relevant area.
Table 4.1.38 Comparison of the performance of Rural PIT male and Rural PIT female teachers with respect to different aspects of "Teacher
Liveliness"
ITEM NO.
STATEMENT TEACHER DATA SA A UNC DA SDAMEAN SCORE
6.1
The teacher moved on proper time on teaching
place
MALE PIT
Response 811 6 1 0
4.0Score 40
44 18 2 0
%age 3142 23 4 0
MALE NIT
Response 2 8 8 7 1
3.1Score 1032 24 14 1
%age 831 31 27 4
FEMALE PIT
Response 311 11 1 0
3.6Score 15
44 33 2 0
%age 1242 42 4 0
FEMALE NIT
Response 1 5 11 6 0
3.0Score 520 33 12 0
%age 422 48 26 0
6.2 The teacher has made the
teaching method more effective
with the posture and gesture i.e.
"hands", "body",
MALE PIT
Response 911 4 0 0
4.2Score 45
44 12 0 0
%age 3846 17 0 0
MALE NIT Response 1 1 10 2 1 3.4

185
"head", "face",
2
Score 548 30 4 1
%age 446 38 8 4
FEMALE PIT
Response 810 8 0 0
4.0Score 40
40 24 0 0
%age 3138 31 0 0
FEMALE NIT
Response 2 4 10 7 0
3.0Score 1016 30 14 0
%age 917 43 30 0
6.3 There was rise and fall in the teacher's tone
MALE PIT
Response 1113 2 0 0
4.3Score 55
52 6 0 0
%age 4250 8 0 0
MALE NIT
Response 4 8 7 4 0
3.5Score 2032 21 8 0
%age 1735 30 17 0
FEMALE PIT
Response 813 3 2 0
4.0Score 40
52 9 4 0
%age 3150 12 8 0
FEMALE NIT
Response 4 7 7 6 0
3.4Score 2028 21 12 0
%age 1729 29 25 0
ITEM NO.
STATEMENT TEACHER DATA SA A UNC DA SDAMEAN SCORE
6.4 The teacher adopted different
teaching
MALE PIT Response 12 7 6 0 0 4.2Score 60 2
818 0 0

186
methods for attention and motivation
purposes e.g. teachers
students and students'
teachers group were made
%age 4828 24 0 0
MALE NIT
Response 2 9 8 2 2
3.3Score 1036 24 4 2
%age 939 35 9 9
FEMALE PIT
Response 810 6 1 0
4.0Score 40
40 18 2 0
%age 3240 24 4 0
FEMALE NIT
Response 1 4 9 7 0
3.0Score 516 27 14 0
%age 519 43 33 0
6.5
Provision of short interval. The students
were provided time to give attention and think over the
important points
MALE PIT
Response 10 9 3 1 0
4.2Score 5036 9 2 0
%age 4339 13 4 0
MALE NIT
Response 1 6 11 4 1
3.1Score 524 33 8 1
%age 426 48 17 4
FEMALE PIT
Response 13 7 4 1 0
4.3Score 6528 12 2 0
%age 5228 16 4 0
FEMALE NIT
Response 1 5 9 5 1
3.0Score 520 27 10 1
%age 524 43 24 5

187
Table No. 4.1.39 reflects that the mean score of Rural PIT male teachers ranges from 3.3 to 4.3 whereas the mean score of Rural PIT female teachers ranges from 2.9 to 4.2. This show s better performance of the Rural PIT male teachers with respect to application of teaching skill, "Closure of Lesson".
Table 4.1.39 Comparison of the performance of Rural PIT male and Rural PIT female teachers with respect to different aspects of "Closure of lesson"
ITEM NO.
STATEMENT TEACHER DATA SA A UNC DA SDAMEAN SCORE
7.1
The way in which the
teacher wind up the lesson was an interesting
one
MALE PIT
Response 11 8 4 1 0
4.2Score 5532 12 2 0
%age 4633 17 4 0
MALE NIT
Response 111 10 4 1
3.3Score 5
44 30 8 1
%age 441 37 15 4
FEMALE PIT
Response 8 9 7 1 0
4.0Score 4036 21 2 0
%age 3236 28 4 0
FEMALE NIT
Response 0 6 11 6 0
3.0Score 024 33 12 0
%age 026 48 26 0
7.2 The method in which the lesson
ended has aroused the
interest of the students
MALE PIT
Response 10 7 8 0 0
4.1Score 5028 24 0 0
%age 4028 32 0 0
MALE NITResponse 1
11 9 4 1
3.3
Score 5 4 27 8 1

188
4
%age 442 35 15 4
FEMALE PIT
Response 910 7 0 0
4.1Score 45
40 21 0 0
%age 3538 27 0 0
FEMALE NIT
Response 1 5 11 6 0
3.0Score 520 33 12 0
%age 422 48 26 0
7.3
The end of the lesson and the real lesson has connectivity
with each other
MALE PIT
Response 811 7 0 0
4.0Score 40
44 21 0 0
%age 3142 27 0 0
MALE NIT
Response 212 9 2 0
3.6Score 10
48 27 4 0
%age 848 36 8 0
FEMALE PIT
Response 912 4 1 0
4.1Score 45
48 12 2 0
%age 3546 15 4 0
FEMALE NIT
Response 0 4 14 6 0
2.9Score 016 42 12 0
%age 017 58 25 0
ITEM NO.
STATEMENT TEACHER DATA SA A UNC DA SDAMEAN SCORE
7.4 The conclusion of the lesson was
the sum up of actual lesson and
MALE PITResponse 7
10 7 0 0
4.0
Score 35 40
21 0 0

189
was also clear to the students
%age 2942 29 0 0
MALE NIT
Response 210 9 2 1
3.4Score 10
40 27 4 1
%age 842 38 8 4
FEMALE PIT
Response 714 6 0 0
4.0Score 35
56 18 0 0
%age 2652 22 0 0
FEMALE NIT
Response 010 10 1 0
3.4Score 0
40 30 2 0
%age 048 48 5 0
7.5 Revision of
lesson was done
MALE PIT
Response 1011 4 0 0
4.2Score 50
44 12 0 0
%age 4044 16 0 0
MALE NIT
Response 414 7 0 1
3.8Score 20
56 21 0 1
%age 1554 27 0 4
FEMALE PIT
Response 14 6 4 2 0
4.2Score 7024 12 4 0
%age 5423 15 8 0
FEMALE NIT
Response 414 3 1 1
3.8Score 20
56 9 2 1
%age 1761 13 4 4

190
7.6 Home work was
given to the students
MALE PIT
Response 814 2 1 0
4.2Score 40
56 6 2 0
%age 3256 8 4 0
MALE NIT
Response 312 6 2 1
3.6Score 15
48 18 4 1
%age 1350 25 8 4
FEMALE PIT
Response 813 4 1 0
4.1Score 40
52 12 2 0
%age 3150 15 4 0
FEMALE NIT
Response 2 5 12 4 0
3.2Score 1020 36 8 0
%age 922 52 17 0
ITEM NO.
STATEMENT TEACHER DATA SA A UNC DA SDAMEAN SCORE
7.7 Understanding of the lesson was realized by the
studentsMALE PIT
Response 12 8 4 0 0
4.3Score 6032 12 0 0
%age 5033 17 0 0
MALE NIT
Response 211 7 2 1
3.5Score 10
44 21 4 1
%age 948 30 9 4
FEMALE PIT
Response 12 8 6 0 0
4.2Score 6032 18 0 0
%age 4631 23 0 0
FEMALE NIT
Response 1 13
7 1 0 3.6

191
Score 552 21 2 0
%age 559 32 5 0

192
Table No. 4.1.40 indicates that the mean score of Rural PIT male teachers ranges in between 3.0 and 4.1. Whereas the mean score of Rural PIT female teachers is in between 3.1 to 3.8. This shows better performance of Rural PIT male teachers with respect to application of teaching skill, "Planning"
Table 4.1.40 Comparison of the performance of Rural PIT male and Rural PIT female teachers with respect to different aspects of "Planning" ITEM NO.
STATEMENT TEACHER DATA SA A UNC DA SDAMEAN SCORE
8.1The teaching was planned
and integrated
MALE PIT
Response 910 6 0 1
4.0Score 45
40 18 0 1
%age 3538 23 0 4
MALE NIT
Response 1 6 13 5 1
3.0Score 524 39 10 1
%age 423 50 19 4
FEMALE PIT
Response 4 7 15 0 0
3.6Score 2028 45 0 0
%age 1527 58 0 0
FEMALE NIT
Response 1 5 10 9 0
2.9Score 520 30 18 0
%age 420 40 36 0
8.2 The teaching was effective
MALE PIT
Response 910 7 0 0
4.1Score 45
40 21 0 0
%age 3538 27 0 0
MALE NIT
Response 211 10 2 1
3.4Score 10
44 30 4 1
%age 842 38 8 4
FEMALE Response 3 1 11 0 0 3.7
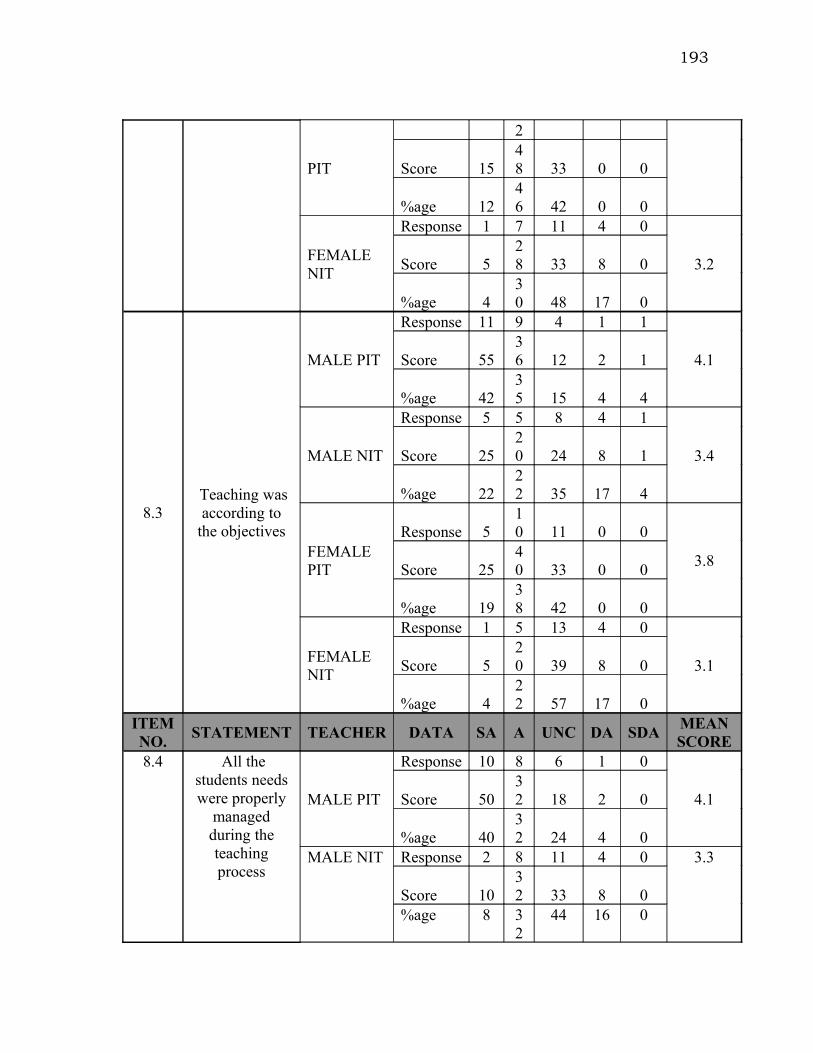
193
PIT
2
Score 1548 33 0 0
%age 1246 42 0 0
FEMALE NIT
Response 1 7 11 4 0
3.2Score 528 33 8 0
%age 430 48 17 0
8.3 Teaching was according to
the objectives
MALE PIT
Response 11 9 4 1 1
4.1Score 5536 12 2 1
%age 4235 15 4 4
MALE NIT
Response 5 5 8 4 1
3.4Score 2520 24 8 1
%age 2222 35 17 4
FEMALE PIT
Response 510 11 0 0
3.8Score 25
40 33 0 0
%age 1938 42 0 0
FEMALE NIT
Response 1 5 13 4 0
3.1Score 520 39 8 0
%age 422 57 17 0
ITEM NO.
STATEMENT TEACHER DATA SA A UNC DA SDAMEAN SCORE
8.4 All the students needs were properly
managed during the teaching process
MALE PIT
Response 10 8 6 1 0
4.1Score 5032 18 2 0
%age 4032 24 4 0
MALE NIT Response 2 8 11 4 0 3.3
Score 1032 33 8 0
%age 8 32
44 16 0

194
FEMALE PIT
Response 412 6 3 0
3.7Score 20
48 18 6 0
%age 1648 24 12 0
FEMALE NIT
Response 1 8 10 5 0
3.2Score 532 30 10 0
%age 433 42 21 0
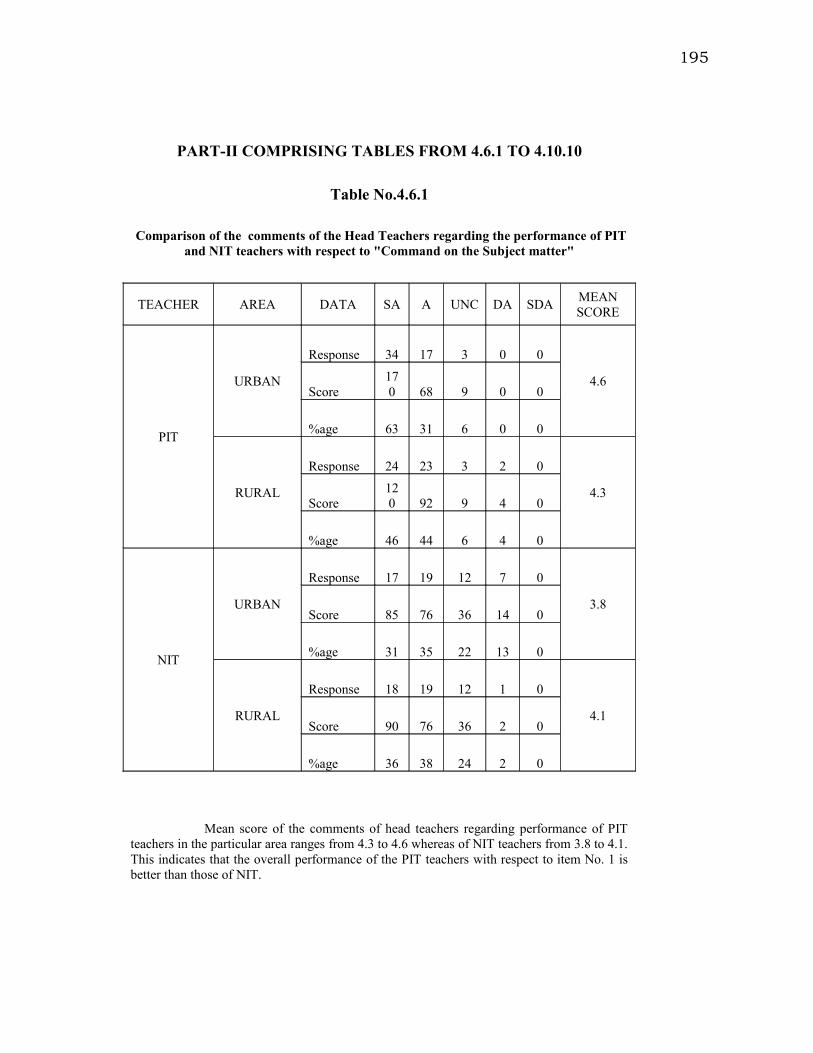
195
PART-II COMPRISING TABLES FROM 4.6.1 TO 4.10.10
Table No.4.6.1
Comparison of the comments of the Head Teachers regarding the performance of PIT and NIT teachers with respect to "Command on the Subject matter"
TEACHER AREA DATA SA A UNC DA SDAMEAN SCORE
PIT
URBAN
Response 34 17 3 0 0
4.6Score
170 68 9 0 0
%age 63 31 6 0 0
RURAL
Response 24 23 3 2 0
4.3Score
120 92 9 4 0
%age 46 44 6 4 0
NIT
URBAN
Response 17 19 12 7 0
3.8Score 85 76 36 14 0
%age 31 35 22 13 0
RURAL
Response 18 19 12 1 0
4.1Score 90 76 36 2 0
%age 36 38 24 2 0
Mean score of the comments of head teachers regarding performance of PIT teachers in the particular area ranges from 4.3 to 4.6 whereas of NIT teachers from 3.8 to 4.1. This indicates that the overall performance of the PIT teachers with respect to item No. 1 is better than those of NIT.

196
Table No.4.6.2
Comparison of the comments of the Head Teachers regarding the performance of PIT and NIT teachers with respect to "Proper Lesson
Planning before teaching lesson"
TEACHER AREA DATA SA A UNC DA SDAMEAN SCORE
PIT
URBAN
Response 29 18 7 0 0
4.4Score
145 72 21 0 0
%age 54 33 13 0 0
RURAL
Response 17 24 4 5 1
4.0Score 85 96 12 10 1
%age 33 47 8 10 2
NIT
URBAN
Response 25 18 8 3 1
4.1Score
125 72 24 6 1
%age 45 33 15 5 2
RURAL
Response 7 23 17 1 0
3.8Score 35 92 51 2 0
%age 15 48 35 2 0
Mean score of the responses of the Head teachers regarding overall performance of PIT teachers with respect to "Proper Lesson Planning" ranges from 4.0 to 4.4 whereas of NIT teachers from 3.8 to 4.1.This reveals that the performance of the PIT teachers is better than that of NIT teachers.
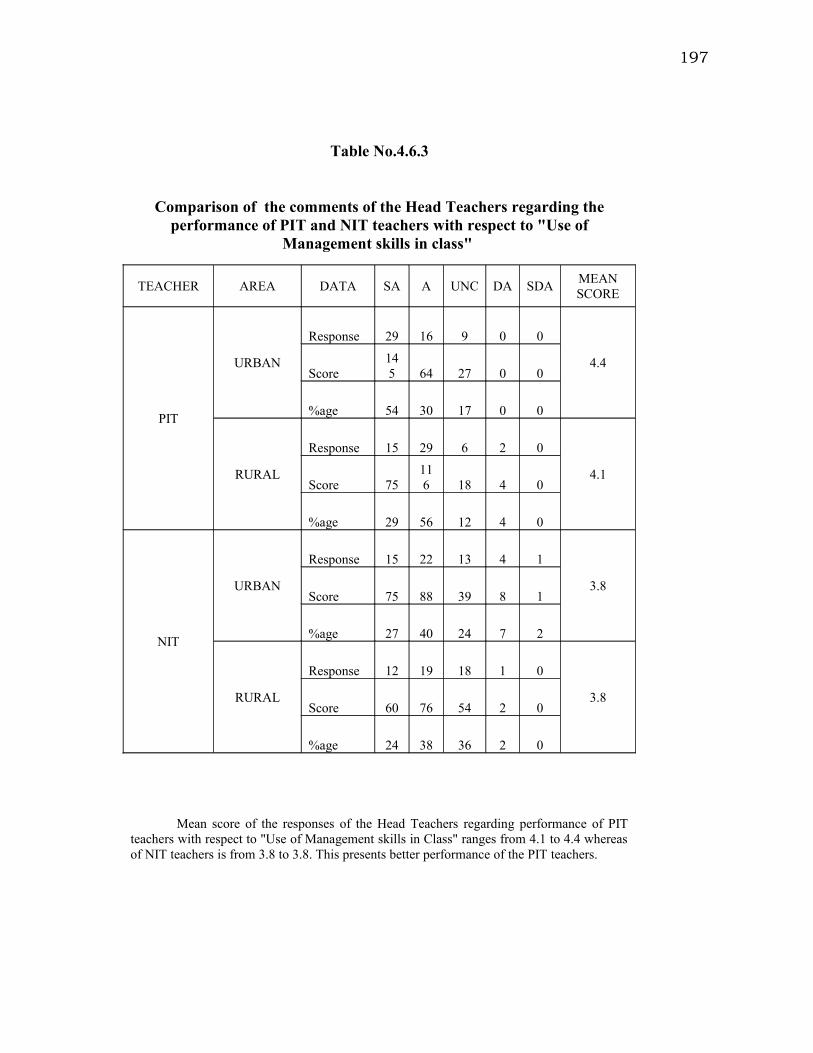
197
Table No.4.6.3
Comparison of the comments of the Head Teachers regarding the performance of PIT and NIT teachers with respect to "Use of
Management skills in class"
TEACHER AREA DATA SA A UNC DA SDAMEAN SCORE
PIT
URBAN
Response 29 16 9 0 0
4.4Score
145 64 27 0 0
%age 54 30 17 0 0
RURAL
Response 15 29 6 2 0
4.1Score 75
116 18 4 0
%age 29 56 12 4 0
NIT
URBAN
Response 15 22 13 4 1
3.8Score 75 88 39 8 1
%age 27 40 24 7 2
RURAL
Response 12 19 18 1 0
3.8Score 60 76 54 2 0
%age 24 38 36 2 0
Mean score of the responses of the Head Teachers regarding performance of PIT teachers with respect to "Use of Management skills in Class" ranges from 4.1 to 4.4 whereas of NIT teachers is from 3.8 to 3.8. This presents better performance of the PIT teachers.

198
Table No.4.6.4
Comparison of the comments of the Head Teachers regarding the performance of PIT and NIT teachers with respect to "Use of A.V Aids
in the class"
TEACHER AREA DATA SA A UNC DA SDAMEAN SCORE
PIT
URBAN
Response 26 19 9 1 0
4.3Score
130 76 27 2 0
%age 47 35 16 2 0
RURAL
Response 20 18 10 2 2
4.0Score
100 72 30 4 2
%age 38 35 19 4 4
NIT
URBAN
Response 24 16 7 7 1
4.0Score
120 64 21 14 1
%age 44 29 13 13 2
RURAL
Response 14 21 13 2 0
3.9Score 70 84 39 4 0
%age 28 42 26 4 0
Mean score of the comments of the Head teachers regarding overall performance of PIT teachers with respect to "Use of A.V. Aids in the Class" is from 4.0 to 4.3 whereas of NIT is from 3.9 to 4.0. This reflects better performance of the PIT teachers.

199
Table No.4.6.5
Comparison of the comments of the Head Teachers regarding the performance of PIT and NIT teachers with respect to "Use of different
teaching methods"
TEACHER AREA DATA SA A UNC DA SDAMEAN SCORE
PIT
URBAN
Response 31 17 6 1 0
4.4Score
155 68 18 2 0
%age 56 31 11 2 0
RURAL
Response 26 13 9 2 1
4.2Score
130 52 27 4 1
%age 51 25 18 4 2
NIT
URBAN
Response 20 18 8 6 2
3.9Score
100 72 24 12 2
%age 37 33 15 11 4
RURAL
Response 12 24 11 4 0
3.9Score 60 96 33 8 0
%age 24 47 22 8 0
Mean score of the comments of the head teachers regarding performance of the PIT teachers with respect to "Use of different teaching methods" is between 4.2 and 4.4 whereas of NIT is between 3.9 and 3.9. This indicates better A210performance of the PIT teachers.

200
Table No.4.6.6
Comparison of the comments of the Head Teachers regarding the performance of PIT and NIT teachers with respect to "Use of Teaching
kit"
TEACHER AREA DATA SA A UNC DA SDAMEAN SCORE
PIT
URBAN
Response 27 15 6 7 0
4.1Score
135 60 18 14 0
%age 49 27 11 13 0
RURAL
Response 24 14 8 5 2
4.0Score
120 56 24 10 2
%age 45 26 15 9 4
NIT
URBAN
Response 16 21 9 5 3
3.8Score 80 84 27 10 3
%age 30 39 17 9 6
RURAL
Response 17 17 11 6 1
3.8Score 85 68 33 12 1
%age 33 33 21 12 2
Mean score of the responses of the head teachers regarding overall performance of the PIT teachers with respect to " Use of Teaching Kit" ranges from 4.0 to 4.1 whereas of NIT is 3.8. This reveals better performance of the PIT teachers.

201
Table No.4.6.7
Comparison of the comments of the Head Teachers regarding the performance of PIT and NIT teachers with respect to "Partial re-
capitulation of Lesson"
TEACHER AREA DATA SA A UNC DA SDAMEAN SCORE
PIT
URBAN
Response 35 14 3 1 0
4.6Score
175 56 9 2 0
%age 66 26 6 2 0
RURAL
Response 26 19 4 2 1
4.3Score
130 76 12 4 1
%age 50 37 8 4 2
NIT
URBAN
Response 21 22 6 3 2
4.1Score
105 88 18 6 2
%age 39 41 11 6 4
RURAL
Response 20 19 10 3 0
4.1Score
100 76 30 6 0
%age 38 37 19 6 0
Mean score of the responses of the Head teachers regarding performance of the PIT teachers in particular area is from 4.3 to 4.6 whereas of NIT is 4.1. This indicates better performance of the PIT teachers in the relevant field.

202
Table No.4.6.8
Comparison of the comments of the Head Teachers regarding the performance of PIT and NIT teachers with respect to "Total re-
capitulation of the lesson"
TEACHER AREA DATA SA A UNC DA SDAMEAN SCORE
PIT
URBAN
Response 34 17 1 2 0
4.5Score
170 68 3 4 0
%age 63 31 2 4 0
RURAL
Response 31 15 5 1 0
4.5Score
155 60 15 2 0
%age 60 29 10 2 0
NIT
URBAN
Response 20 21 7 5 1
4.0Score
100 84 21 10 1
%age 37 39 13 9 2
RURAL
Response 19 20 9 4 0
4.0Score 95 80 27 8 0
%age 37 38 17 8 0
Mean score of the responses of Head teachers regarding performance of PIT teachers in the particular area is 4.5 whereas of NIT is 4.0. This depicts better performance of the PIT teachers in the particular area.

203
Table No.4.6.9
Comparison of the comments of the Head Teachers regarding the performance of PIT and NIT teachers with respect to "Evaluation of the
Taught Lesson"
TEACHER AREA DATA SA A UNC DA SDAMEAN SCORE
PIT
URBAN
Response 34 16 2 1 0
4.6Score
170 64 6 2 0
%age 64 30 4 2 0
RURAL
Response 35 12 2 2 0
4.6Score
175 48 6 4 0
%age 69 24 4 4 0
NIT
URBAN
Response 23 19 6 5 0
4.1Score
115 76 18 10 0
%age 43 36 11 9 0
RURAL
Response 22 20 3 3 0
4.3Score
110 80 9 6 0
%age 46 42 6 6 0
Mean score of the responses of the Head Teachers regarding PIT teacher in the particular area is 4.6 whereas of NIT teachers is from 4.1 to 4.3. This reveals better performance of the PIT teachers in particular area.
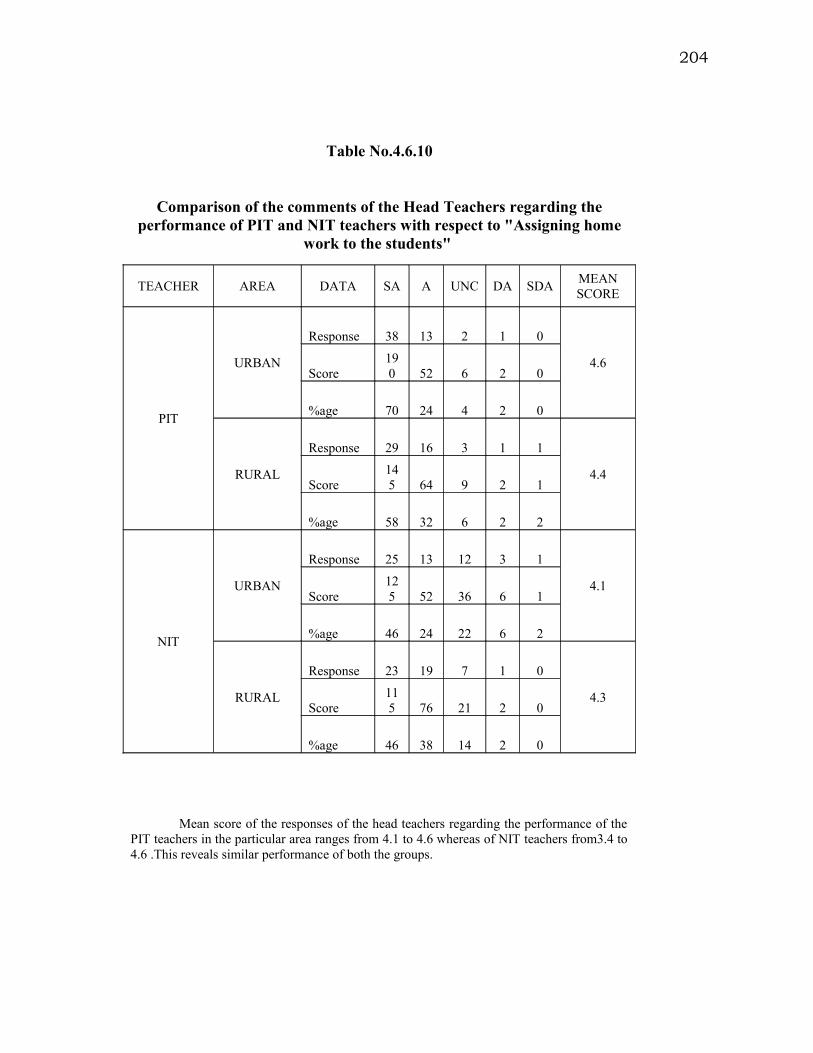
204
Table No.4.6.10
Comparison of the comments of the Head Teachers regarding the performance of PIT and NIT teachers with respect to "Assigning home
work to the students"
TEACHER AREA DATA SA A UNC DA SDAMEAN SCORE
PIT
URBAN
Response 38 13 2 1 0
4.6Score
190 52 6 2 0
%age 70 24 4 2 0
RURAL
Response 29 16 3 1 1
4.4Score
145 64 9 2 1
%age 58 32 6 2 2
NIT
URBAN
Response 25 13 12 3 1
4.1Score
125 52 36 6 1
%age 46 24 22 6 2
RURAL
Response 23 19 7 1 0
4.3Score
115 76 21 2 0
%age 46 38 14 2 0
Mean score of the responses of the head teachers regarding the performance of the PIT teachers in the particular area ranges from 4.1 to 4.6 whereas of NIT teachers from3.4 to 4.6 .This reveals similar performance of both the groups.

205
Table No.4.7.1
Comparison of the comments of the Head Teachers regarding the performance of PIT male and female teachers with respect to
"Command on the subject"
TEACHER GENDER DATA SA A UNC DA SDAMEAN SCORE
PIT
MALE
Response 32 16 4 1 0
4.5Score
160 64 12 2 0
%age 60 30 8 2 0
MALE
Response 23 15 12 4 0
4.1Score
115 60 36 8 0
%age 43 28 22 7 0
PIT
FEMALE
Response 26 24 2 1 0
4.4Score
130 96 6 2 0
%age 49 45 4 2 0
FEMALE
Response 12 23 12 4 0
3.8Score 60 92 36 8 0
%age 24 45 24 8 0
Mean score of the comments of the Head teachers regarding performance of PIT male teachers ranges from 4.1 to 4.5 whereas of PIT female teachers from 3.8 to 4.4. This presents better performance of the PIT male teachers than those of PIT female teachers in the particular area.

206
Table No.4.7.2
Comparison of the comments of the Head Teachers regarding the performance of PIT male and female teachers with respect to different
aspects of "Proper lesson planning before teaching lesson"
TEACHER GENDER DATA SA A UNC DA SDAMEAN SCORE
PIT
MALE
Response 23 20 5 3 1
4.2Score
115 80 15 6 1
%age 44 38 10 6 2
MALE
Response 15 18 14 4 1
3.8Score 75 72 42 8 1
%age 29 35 27 8 2
PIT
FEMALE
Response 23 22 6 2 0
4.2Score
115 88 18 4 0
%age 43 42 11 4 0
FEMALE
Response 17 23 11 0 0
4.1Score 85 92 33 0 0
%age 33 45 22 0 0
Mean score of the head teachers regarding performance of the PIT male teacher in particular area ranges from 3.8 to 4.2 whereas the performance of PIT female teachers ranges from 4.1 to 4.2. This indicates that the performance of both the groups is similar.

207
Table No.4.7.3
Comparison of the comments of the Head Teachers regarding the performance of PIT male and female teachers with respect to "Use of
management skills in the class"
TEACHER GENDER DATA SA A UNC DA SDAMEAN SCORE
PIT
MALE
Response 20 21 10 2 0
4.1Score
100 84 30 4 0
%age 38 40 19 4 0
MALE
Response 12 21 16 4 1
3.7Score 60 84 48 8 1
%age 22 39 30 7 2
PIT
FEMALE
Response 24 24 5 0 0
4.4Score
120 96 15 0 0
%age 45 45 9 0 0
FEMALE
Response 15 20 15 1 0
4.0Score 75 80 45 2 0
%age 29 39 29 2 0
Mean score of the responses of head teachers regarding performance of the PIT male teachers in the particular area ranges from 3.7 to 4.1 whereas as of PIT female teachers from 4.0 to 4.4. This shows better performance of the PIT female teachers.
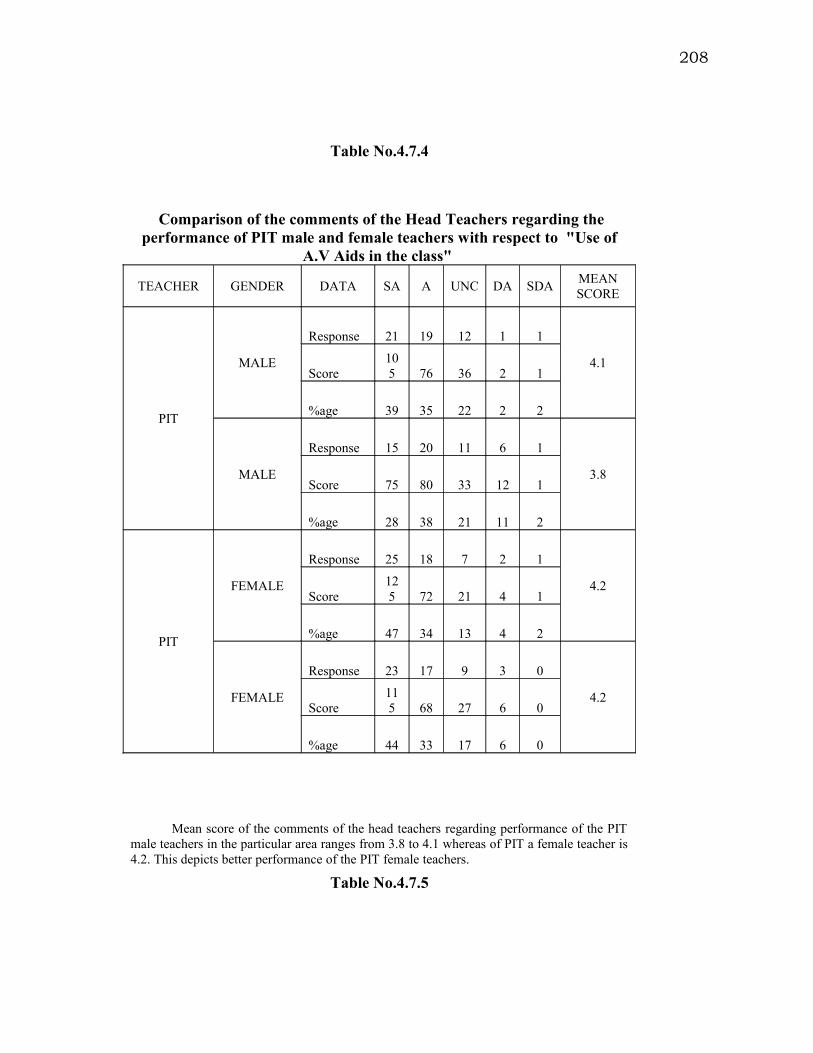
208
Table No.4.7.4
Comparison of the comments of the Head Teachers regarding the performance of PIT male and female teachers with respect to "Use of
A.V Aids in the class"
TEACHER GENDER DATA SA A UNC DA SDAMEAN SCORE
PIT
MALE
Response 21 19 12 1 1
4.1Score
105 76 36 2 1
%age 39 35 22 2 2
MALE
Response 15 20 11 6 1
3.8Score 75 80 33 12 1
%age 28 38 21 11 2
PIT
FEMALE
Response 25 18 7 2 1
4.2Score
125 72 21 4 1
%age 47 34 13 4 2
FEMALE
Response 23 17 9 3 0
4.2Score
115 68 27 6 0
%age 44 33 17 6 0
Mean score of the comments of the head teachers regarding performance of the PIT male teachers in the particular area ranges from 3.8 to 4.1 whereas of PIT a female teacher is 4.2. This depicts better performance of the PIT female teachers.
Table No.4.7.5

209
Comparison of the comments of the Head Teachers regarding the performance of PIT male and female teachers with respect to "Use of
different teaching methods"
TEACHER GENDER DATA SA A UNC DA SDAMEAN SCORE
PIT
MALE
Response 26 16 8 3 1
4.2Score
130 64 24 6 1
%age 48 30 15 6 2
MALE
Response 16 15 13 7 2
3.7Score 80 60 39 14 2
%age 30 28 25 13 4
PIT
FEMALE
Response 31 14 7 0 0
4.5Score
155 56 21 0 0
%age 60 27 13 0 0
FEMALE
Response 16 27 6 3 0
4.1Score 80
108 18 6 0
%age 31 52 12 6 0
Mean score of the responses of head teachers regarding performance of PIT male teachers in the particular area is from 3.7 to 4.2 whereas of PIT female teachers is 4.1 to 4.5. This reveals better performance of the PIT female teachers.

210
Table No.4.7.6
Comparison of the comments of the Head Teachers regarding the performance of PIT male and female teachers with respect to "Use of
Teaching Kit"
TEACHER GENDER DATA SA A UNC DA SDAMEAN SCORE
PIT
MALE
Response 27 9 9 7 2
4.0Score
135 36 27 14 2
%age 50 17 17 13 4
MALE
Response 18 18 9 7 3
3.7Score 90 72 27 14 3
%age 33 33 16 13 5
PIT
FEMALE
Response 24 20 5 5 0
4.2Score
120 80 15 10 0
%age 44 37 9 9 0
FEMALE
Response 15 20 11 4 1
3.9Score 75 80 33 8 1
%age 29 39 22 8 2
Mean score of the responses of the head teachers regarding overall performance of the PIT male teachers in the particular area ranges from 3.7 to 4.0 whereas of PIT female teachers from 3.9 to 4.2. This indicates better performance of PIT female teachers.

211
Table No.4.7.7
Comparison of the comments of the Head Teachers regarding the performance of PIT male and female teachers with respect to "Partial
re-capitulation of lesson"
TEACHER GENDER DATA SA A UNC DA SDAMEAN SCORE
PIT
MALE
Response 28 16 5 3 1
4.3Score
140 64 15 6 1
%age 53 30 9 6 2
MALE
Response 23 17 8 4 2
4.0Score
115 68 24 8 2
%age 43 31 15 7 4
PIT
FEMALE
Response 33 17 2 0 0
4.6Score
165 68 6 0 0
%age 63 33 4 0 0
FEMALE
Response 18 24 8 2 0
4.1Score 90 96 24 4 0
%age 35 46 15 4 0
Mean score of the responses of the head teachers regarding PIT male teachers with respect to application of relevant teaching skill ranges from 4.0 to 4.3 whereas of PIT female teachers from 4.1 to 4.6. This shows better performance of the PIT female teachers.

212
Table No.4.7.8
Comparison of the comments of the Head Teachers regarding the performance of PIT male and female teachers with respect to "Total re-
capitulation of the Lesson"
TEACHER GENDER DATA SA A UNC DA SDAMEAN SCORE
PIT
MALE
Response 31 17 2 3 0
4.4Score
155 68 6 6 0
%age 58 32 4 6 0
MALE
Response 18 16 11 7 1
3.8Score 90 64 33 14 1
%age 34 30 21 13 2
PIT
FEMALE
Response 34 15 4 0 0
4.6Score
170 60 12 0 0
%age 64 28 8 0 0
FEMALE
Response 21 25 5 2 0
4.2Score
105
100 15 4 0
%age 40 47 9 4 0
Mean score of the responses of the head teachers regarding performance of PIT male teachers in the particular area is between 3.8 and 4.1 whereas of PIT male teachers is between 4.2 to 4.6. This reveals better performance of the PIT female teachers.

213
Table No.4.7.9
Comparison of the comments of the Head Teachers regarding the performance of PIT male and female teachers with respect to
"Evaluation of the taught lesson"
TEACHER GENDER DATA SA A UNC DA SDAMEAN SCORE
PIT
MALE
Response 33 14 3 3 0
4.5Score
165 56 9 6 0
%age 62 26 6 6 0
MALE
Response 20 17 6 8 0
4.0Score
100 68 18 16 0
%age 39 33 12 16 0
PIT
FEMALE
Response 36 14 1 0 0
4.7Score
180 56 3 0 0
%age 71 27 2 0 0
FEMALE
Response 25 22 3 0 0
4.4Score
125 88 9 0 0
%age 50 44 6 0 0
Mean score of the responses of the head teachers regarding performance of PIT male teachers in the particular area ranges from 4.0 to 4.5 whereas of PIT female teachers from 4.4 to 4.7. This indicates better performance of the PIT female teachers.

214
Table No.4.7.10
Comparison of the comments of the Head Teachers regarding the performance of PIT male and female teachers with respect to
"Assigning home work to the students"
TEACHER GENDER DATA SA A UNC DA SDAMEAN SCORE
PIT
MALE
Response 35 13 3 1 1
4.5Score
175 52 0 2 1
%age 66 25 6 2 2
MALE
Response 25 14 10 3 1
4.1Score
125 56 30 6 1
%age 47 26 19 6 2
PIT
FEMALE
Response 32 16 2 1 0
4.5Score
160 64 6 2 0
%age 63 31 4 2 0
FEMALE
Response 23 18 9 1 0
4.2Score
115 72 27 2 0
%age 45 35 18 2 0
Mean score of the responses of the head teachers regarding overall performance of the PIT male teachers in the relevant area ranges from 4.1 to 4.5 and that of PIT female teachers from 4.2 to 4.5. There seems to be no difference in the performance of both the genders in this area.

215
Table No.4.8.1
Comparison of the comments of the Head Teachers regarding the performance of Urban and Rural PIT teachers with respect to
"Command on the Subject matter"
AREA TEACHER DATA SA A UNC DA SDAMEAN SCORE
URBAN
PIT
Response 34 17 3 0 0
4.6Score
170 68 9 0 0
%age 63 31 6 0 0
NIT
Response 17 19 12 7 0
3.8Score 85 76 36 14 0
%age 31 35 22 13 0
RURAL
PIT
Response 24 23 3 2 0
4.3Score
120 92 9 4 0
%age 46 44 6 4 0
NIT
Response 18 19 12 1 0
4.1Score 90 76 36 2 0
%age 36 38 24 2 0
Mean score of the comments of head teachers regarding performance of urban PIT teachers with respect to "Command on the subject" is 4.6 and of Rural PIT teachers is 4.3. This indicates that the performance of urban PIT teacher is better than rural PIT teachers

216
Table No.4.8.2
Comparison of the comments of the Head Teachers regarding the performance of Urban and Rural PIT teachers with respect to "Proper
Lesson Planning before teaching lesson"
AREA TEACHER DATA SA A UNC DA SDAMEAN SCORE
URBAN
PIT
Response 29 18 7 0 0
4.4Score
145 72 21 0 0
%age 54 33 13 0 0
NIT
Response 25 18 8 3 1
4.1Score
125 72 24 6 1
%age 45 33 15 5 2
RURAL
PIT
Response 17 24 4 5 1
4.0Score 85 96 12 10 1
%age 33 47 8 10 2
NIT
Response 7 23 17 1 0
3.8Score 35 92 51 2 0
%age 15 48 35 2 0
Mean score of the comments of head teachers regarding performance of urban PIT teachers is 4.4 whereas of rural PIT teachers is 4.0. This indicates that the performance of urban PIT teacher is better than rural PIT teachers in the skill, "Lesson Planning".

217
Table No.4.8.3
Comparison of the comments of the Head Teachers regarding the performance of Urban and Rural PIT teachers with respect to "Use of
Management skills in class"
AREA TEACHER DATA SA A UNC DA SDAMEAN SCORE
URBAN
PIT
Response 29 16 9 0 0
4.4Score
145 64 27 0 0
%age 54 30 17 0 0
NIT
Response 15 22 13 4 1
3.8Score 75 88 39 8 1
%age 27 40 24 7 2
RURAL
PIT
Response 15 29 6 2 0
4.1Score 75
116 18 4 0
%age 29 56 12 4 0
NIT
Response 12 19 18 1 0
3.8Score 60 76 54 2 0
%age 24 38 36 2 0
Mean score of the comments of head teachers regarding performance of Urban PIT teachers is 4.4 whereas of rural PIT teachers is 4.1. This indicates that the performance of PIT urban teacher is better than PIT rural teachers in the particular area of "Use of Management skills in the class".

218
Table No.4.8.4
Comparison of the comments of the Head Teachers regarding the performance of Urban and rural PIT teachers with respect to "Use of
A.V Aids in the class"
AREA TEACHER DATA SA A UNC DA SDAMEAN SCORE
URBAN
PIT
Response 26 19 9 1 0
4.3Score
130 76 27 2 0
%age 47 35 16 2 0
NIT
Response 24 16 7 7 1
4.0Score
120 64 21 14 1
%age 44 29 13 13 2
RURAL
PIT
Response 20 18 10 2 2
4.0Score
100 72 30 4 2
%age 38 35 19 4 4
NIT
Response 14 21 13 2 0
3.9Score 70 84 39 4 0
%age 28 42 26 4 0
Mean score of the comments of head teachers regarding performance of PIT Urban teachers with respect to "Use of A.V Aids in the class" is 4.3 whereas of PIT a rural teacher is 4.0. This indicates that the performance of PIT urban teacher is better than PIT rural teachers in the particular area

219
Table No.4.8.5
Comparison of the comments of the Head Teachers regarding the performance of PIT Urban and Rural teachers with respect to "Use of
different teaching methods"
AREA TEACHER DATA SA A UNC DA SDAMEAN SCORE
URBAN
PIT
Response 31 17 6 1 0
4.4Score
155 68 18 2 0
%age 56 31 11 2 0
NIT
Response 20 18 8 6 2
3.9Score
100 72 24 12 2
%age 37 33 15 11 4
RURAL
PIT
Response 26 13 9 2 1
4.2Score
130 52 27 4 1
%age 51 25 18 4 2
NIT
Response 12 24 11 4 0
3.9Score 60 96 33 8 0
%age 24 47 22 8 0
Mean score of the comments of head teachers regarding performance of PIT Urban teachers with respect to "Use of different Teaching Methods" is 4.4 whereas of PIT rural teachers are 4.2. This indicates that the performance of PIT urban teacher is better than PIT rural teachers.

220
Table No.4.8.6
Comparison of the comments of the Head Teachers regarding the performance of urban and rural PIT teachers with respect to "Use of
Teaching kit"
AREA TEACHER DATA SA A UNC DA SDAMEAN SCORE
URBAN
PIT
Response 27 15 6 7 0
4.1Score
135 60 18 14 0
%age 49 27 11 13 0
NIT
Response 16 21 9 5 3
3.8Score 80 84 27 10 3
%age 30 39 17 9 6
RURAL
PIT
Response 24 14 8 5 2
4.0Score
120 56 24 10 2
%age 45 26 15 9 4
NIT
Response 17 17 11 6 1
3.8Score 85 68 33 12 1
%age 33 33 21 12 2
Mean score of the comments of head teachers regarding performance of PIT Urban teachers with respect to "Use of Teaching Kit" is 4.1 whereas of PIT a rural teacher is 4.0. This indicates that the performance of PIT urban teacher is better than PIT rural teachers.
Table No.4.8.7

221
Comparison of the comments of the Head Teachers regarding the performance of urban and rural PIT teachers with respect to "Partial
re-capitulation of Lesson"
AREA TEACHER DATA SA A UNC DA SDAMEAN SCORE
URBAN
PIT
Response 35 14 3 1 0
4.6Score
175 56 9 2 0
%age 66 26 6 2 0
NIT
Response 21 22 6 3 2
4.1Score
105 88 18 6 2
%age 39 41 11 6 4
RURAL
PIT
Response 26 19 4 2 1
4.3Score
130 76 12 4 1
%age 50 37 8 4 2
NIT
Response 20 19 10 3 0
4.1Score
100 76 30 6 0
%age 38 37 19 6 0
Mean score of the comments of head teachers regarding performance of PIT Urban teachers with respect to "Partial re-capitulation of the lesson" is 4.6 whereas of PIT a rural teacher is 4.3. This indicates that the performance of PIT urban teacher is better than PIT rural teachers.

222
Table No.4.8.8
Comparison of the comments of the Head Teachers regarding the performance of urban and rural PIT teachers with respect to "Total re-
capitulation of the lesson"
AREA TEACHER DATA SA A UNC DA SDAMEAN SCORE
URBAN
PIT
Response 34 17 1 2 0
4.5Score
170 68 3 4 0
%age 63 31 2 4 0
NIT
Response 20 21 7 5 1
4.0Score
100 84 21 10 1
%age 37 39 13 9 2
RURAL
PIT
Response 31 15 5 1 0
4.5Score
155 60 15 2 0
%age 60 29 10 2 0
NIT
Response 19 20 9 4 0
4.0Score 95 80 27 8 0
%age 37 38 17 8 0
Mean score of the comments of head teachers regarding performance of PIT Urban teachers with respect to "Total re-capitulation of the lesson" is 4.5 whereas of PIT rural teachers i+A314s 4.5. This indicates that no difference in the performance of PIT urban teacher and PIT rural teachers.

223
Table No.4.8.9
Comparison of the comments of the Head Teachers regarding the performance of urban and rural PIT teachers with respect to
"Evaluation of the Taught Lesson"
AREA TEACHER DATA SA A UNC DA SDAMEAN SCORE
URBAN
PIT
Response 34 16 2 1 0
4.6Score
170 64 6 2 0
%age 64 30 4 2 0
NIT
Response 23 19 6 5 0
4.1Score
115 76 18 10 0
%age 43 36 11 9 0
RURAL
PIT
Response 35 12 2 2 0
4.6Score
175 48 6 4 0
%age 69 24 4 4 0
NIT
Response 22 20 3 3 0
4.3Score
110 80 9 6 0
%age 46 42 6 6 0
Mean score of the comments of head teachers regarding performance of PIT Urban teachers with respect to "Evaluation of the Taught Lesson” is 4.6 whereas of PIT a rural teacher is 4.6. This indicates that the performance of both the group is same.

224
Table No.4.8.10
Comparison of the comments of the Head Teachers regarding the performance of urban and rural PIT teachers with respect to
"Assigning home work to the students"
AREA TEACHER DATA SA A UNC DA SDAMEAN SCORE
URBAN
PIT
Response 38 13 2 1 0
4.6Score
190 52 6 2 0
%age 70 24 4 2 0
NIT
Response 25 13 12 3 1
4.1Score
125 52 36 6 1
%age 46 24 22 6 2
RURAL
PIT
Response 29 16 3 1 1
4.4Score
145 64 9 2 1
%age 58 32 6 2 2
NIT
Response 23 19 7 1 0
4.3Score
115 76 21 2 0
%age 46 38 14 2 0
Mean score of the comments of head teachers regarding the performance A324of PIT Urban teachers with respect to "Assigning Home work to the students” is 4.6 whereas of PIT a rural teacher is 4.4. This indicates that the performance of PIT urban teacher is better than PIT rural teachers.

225
Table No.4.9.1
Comparison of the comments of the Head Teachers regarding the performance of PIT Urban Male and Female teachers with respect to
"Command on the subject"
HEADS DATA SA A UNC DA SDAMEAN SCORE
MALE PIT
Response 21 4 2 0 0
4.7Score 105
16 6 0 0
%age 7815 7 0 0
MALE NIT
Response 11 8 6 3 0
4.0Score 55
32 18 6 0
%age 3929 21 11 0
FEMALE PIT
Response 1313 1 0 0
4.4Score 65
52 3 0 0
%age 4848 4 0 0
FEMALE NIT
Response 611 6 4 0
3.7Score 30
44 18 8 0
%age 2241 22 15 0
Mean score of the comments of the Head teachers regarding the performance of PIT urban male teachers is 4.7 whereas of PIT urban female teachers is 4.4. This indicates better performance of the PIT male teachers.

226
Table No.4.9.2
Comparison of the comments of the Head Teachers regarding the performance of PIT urban male and female teachers with respect to
"Proper lesson planning before teaching lesson"
HEADS DATA SA A UNC DA SDAMEAN SCORE
MALE PIT
Response 16 8 3 0 0
4.5Score 80
32 9 0 0
%age 5930 11 0 0
FEMALE NIT
Response 11 7 6 3 1
3.9Score 55
28 18 6 1
%age 3925 21 11 4
FEMALE PIT
Response 1310 4 0 0
4.3Score 65
40 12 0 0
%age 4837 15 0 0
FEMALE NIT
Response 1411 2 0 0
4.4Score 70
44 6 0 0
%age 5241 7 0 0
Mean score of the head teachers regarding the performance of the PIT urban male teachers in particular area is 4.5 whereas the performance of PIT urban female teachers is 4.4. This reveals better performance of PIT male teachers.

227
Table No.4.9.3
Comparison of the comments of the Head Teachers regarding the performance of PIT urban male and female teachers with respect to
"Use of management skills in the class"
HEADS DATA SA A UNC DA SDAMEAN SCORE
MALE PIT
Response 15 5 7 0 0
4.3Score 75
20 21 0 0
%age 5619 26 0 0
MALE NIT
Response 510 8 4 1
3.5Score 25
40 24 8 1
%age 1836 29 14 4
FEMALE PIT
Response 1411 2 0 0
4.4Score 70
44 6 0 0
%age 5241 7 0 0
FEMALE NIT
Response 1012 5 0 0
4.2Score 50
48 15 0 0
%age 3744 19 0 0
Mean score of the comments of head teachers regarding the performance of the PIT urban male teachers in the particular area is 4.3 whereas as of PIT female teachers is 4.4. This indicates better performance of the PIT female teachers.

228
Table No.4.9.4
Comparison of the comments of the Head Teachers regarding the performance of PIT Urban male and female teachers with respect to
"Use of A.V. Aids in the class"
HEADS DATA SA A UNC DA SDAMEAN SCORE
MALE PIT
Response 1110 6 1 0
4.1Score 55
40 18 2 0
%age 3936 21 4 0
MALE NIT
Response 8 8 5 6 1
3.6Score 40
32 15 12 1
%age 2929 18 21 4
FEMALE PIT
Response 15 9 3 0 0
4.4Score 75
36 9 0 0
%age 5633 11 0 0
FEMALE NIT
Response 16 8 2 1 0
4.4Score 80
32 6 2 0
%age 5930 7 4 0
Mean score of the comments of the head teachers regarding the performance of the PIT urban male teachers in the particular area is 4.1 whereas of PIT urban female teachers is 4.4. This shows better performance of the PIT female teachers.
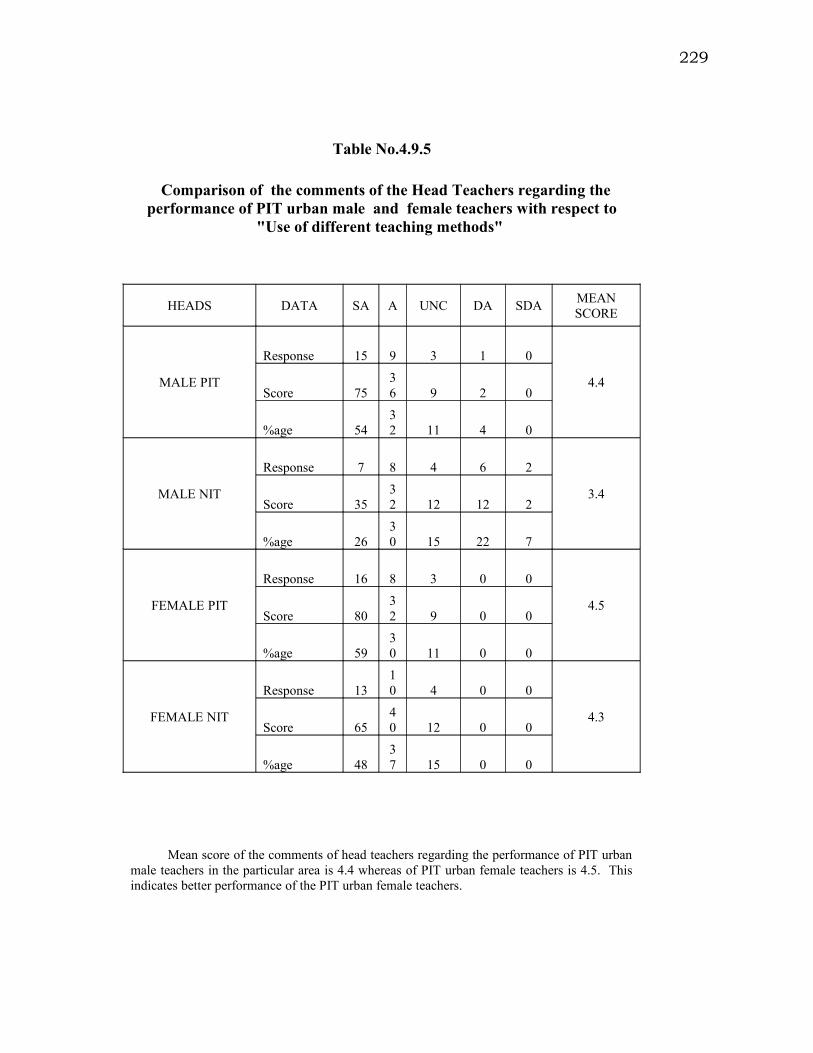
229
Table No.4.9.5
Comparison of the comments of the Head Teachers regarding the performance of PIT urban male and female teachers with respect to
"Use of different teaching methods"
HEADS DATA SA A UNC DA SDAMEAN SCORE
MALE PIT
Response 15 9 3 1 0
4.4Score 75
36 9 2 0
%age 5432 11 4 0
MALE NIT
Response 7 8 4 6 2
3.4Score 35
32 12 12 2
%age 2630 15 22 7
FEMALE PIT
Response 16 8 3 0 0
4.5Score 80
32 9 0 0
%age 5930 11 0 0
FEMALE NIT
Response 1310 4 0 0
4.3Score 65
40 12 0 0
%age 4837 15 0 0
Mean score of the comments of head teachers regarding the performance of PIT urban male teachers in the particular area is 4.4 whereas of PIT urban female teachers is 4.5. This indicates better performance of the PIT urban female teachers.

230
Table No.4.9.6
Comparison of the comments of the Head Teachers regarding the performance of PIT urban male and female teachers with respect to
"Use of Teaching Kit"
HEADS DATA SA A UNC DA SDAMEAN SCORE
MALE PIT
Response 14 5 3 5 0
4.0Score 70
20 9 10 0
%age 5219 11 19 0
MALE NIT
Response 511 4 5 3
3.4Score 25
44 12 10 3
%age 1839 14 18 11
FEMALE PIT
Response 1310 3 2 0
4.2Score 65
40 9 4 0
%age 4636 11 7 0
FEMALE NIT
Response 1110 5 0 0
4.2Score 55
40 15 0 0
%age 4238 19 0 0
Mean score of the responses of the head teachers regarding the overall performance of the PIT urban male teachers in the particular area is 4.0 whereas of PIT urban female teachers is 4.2. This shows better performance of the PIT urban female teachers.

231
Table No.4.9.7
Comparison of the comments of the Head Teachers regarding the performance of PIT urban male and female teachers with respect to
"partial re-capitulation of the lesson"
HEADS DATA SA A UNC DA SDAMEAN SCORE
MALE PIT
Response 16 7 3 1 0
4.4Score 80
28 9 2 0
%age 5926 11 4 0
MALE NIT
Response 810 4 3 2
3.7Score 40
40 12 6 2
%age 3037 15 11 7
FEMALE PIT
Response 19 7 0 0 0
4.7Score 95
28 0 0 0
%age 7327 0 0 0
FEMALE NIT
Response 1312 2 0 0
4.4Score 65
48 6 0 0
%age 4844 7 0 0
Mean score of the responses of the head teachers regarding the PIT urban male teachers with respect to application of relevant teaching skill is 4.4 whereas of PIT urban female teachers is 4.7. This indicates the better performance of the female teachers.

232
Table No.4.9.8
Comparison of the comments of the Head Teachers regarding the performance of PIT urban male and female teachers with respect to
"Total re-capitulation of the lesson"
HEADS DATA SA A UNC DA SDAMEAN SCORE
MALE PIT
Response 17 8 0 2 0
4.5Score 85
32 0 4 0
%age 6330 0 7 0
MALE NIT
Response 7 8 6 5 1
3.6Score 35
32 18 10 1
%age 2630 22 19 4
FEMALE PIT
Response 17 9 1 0 0
4.6Score 85
36 3 0 0
%age 6333 4 0 0
FEMALE NIT
Response 1313 1 0 0
4.4Score 65
52 3 0 0
%age 4848 4 0 0
Mean score of the responses of the head teachers regarding the performance of PIT male teachers in the particular area is 4.5 whereas of PIT Urban female teachers is 4.6. This presents shows better performance of the PIT urban female teachers.

233
Table No.4.9.9
Comparison of the comments of the Head Teachers regarding the performance of PIT urban male and female teachers with respect to
"Final evaluation of the lesson"
HEADS DATA SA A UNC DA SDAMEAN SCORE
MALE PIT
Response 15 9 2 1 0
4.4Score 75
36 6 2 0
%age 5633 7 4 0
MALE NIT
Response 8 8 5 5 0
3.7Score 40
32 15 10 0
%age 3131 19 19 0
FEMALE PIT
Response 19 7 0 0 0
4.7Score 95
28 0 0 0
%age 7327 0 0 0
FEMALE NIT
Response 1511 1 0 0
4.5Score 75
44 3 0 0
%age 5641 4 0 0
Mean score of the responses of the head teachers regarding the performance of PIT urban male teachers in the particular area is 4.4 whereas of PIT urban female teachers is 4.7. This indicates better performance of the PIT urban female teachers.
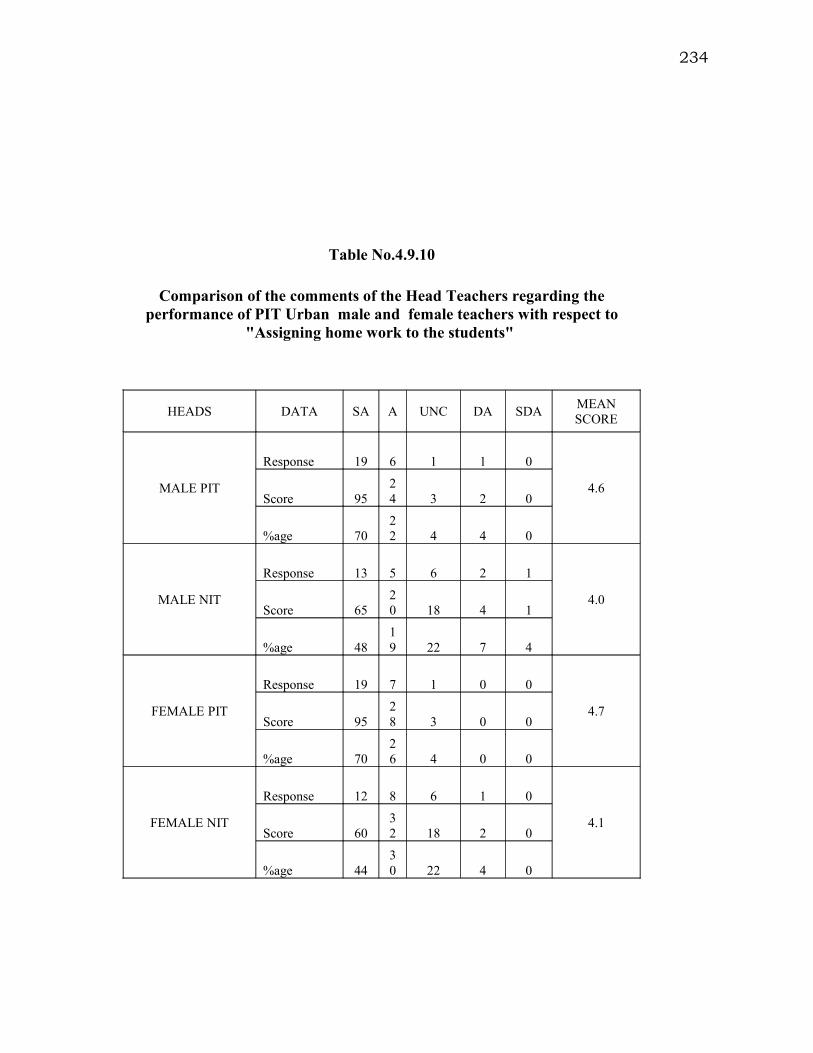
234
Table No.4.9.10
Comparison of the comments of the Head Teachers regarding the performance of PIT Urban male and female teachers with respect to
"Assigning home work to the students"
HEADS DATA SA A UNC DA SDAMEAN SCORE
MALE PIT
Response 19 6 1 1 0
4.6Score 95
24 3 2 0
%age 7022 4 4 0
MALE NIT
Response 13 5 6 2 1
4.0Score 65
20 18 4 1
%age 4819 22 7 4
FEMALE PIT
Response 19 7 1 0 0
4.7Score 95
28 3 0 0
%age 7026 4 0 0
FEMALE NIT
Response 12 8 6 1 0
4.1Score 60
32 18 2 0
%age 4430 22 4 0

235
Mean score of the responses of the head teachers regarding the overall performance of the PIT Urban male teachers in relevant field is 4.6 and that of PIT urban female teachers is 4.7. This reflects better performance of PIT female teachers in this particular field.

236
Table No.4.10.1
Comparison of the comments of the Head Teachers regarding the performance of PIT Rural male and female teachers with respect to
"Command on the subject"
HEADS DATA SA A UNC DA SDAMEAN SCORE
MALE PIT
Response 1112 2 1 0
4.3Score 55
48 6 2 0
%age 4246 8 4 0
MALE NIT
Response 12 7 6 1 0
4.2Score 60
28 18 2 0
%age 4627 23 4 0
FEMALE PIT
Response+B195 1311 1 1 0
4.4Score 65
44 3 2 0
%age 5042 4 4 0
FEMALE NIT
Response 612 6 0 0
4.0Score 30
48 18 0 0
%age 2550 25 0 0
Mean score of the comments of the Head teachers regarding the performance of PIT male Rural teachers in the relevant area is 4.3 whereas of PIT a rural female teacher is 4.4. This indicates better performance of the PIT rural male.

237
Table No.4.10.2
Comparison of the comments of the Head Teachers regarding the performance of PIT rural male and female teachers with respect to
"Proper lesson planning before teaching lesson"
HEADS DATA SA A UNC DA SDAMEAN SCORE
MALE PIT
Response 712 2 3 1
3.8Score 35
48 6 6 1
%age 2848 8 12 4
MALE LNIT
Response 411 8 1 0
3.8Score 20
44 24 2 0
%age 1746 33 4 0
FEMALE PIT
Response 1012 2 2 0
4.2Score 50
48 6 4 0
%age 3846 8 8 0
FEMALE NIT
Response 312 9 0 0
3.8Score 15
48 27 0 0
%age 1350 38 0 0
Mean score of the comments of head teachers regarding the performance of the PIT rural male teacher in particular area is 3.8 whereas the performance of PIT rural female teachers is 4.2. This indicates better performance of female group.

238
Table No.4.10.3
Comparison of the comments of the Head Teachers regarding the performance of PIT Rural male and female teachers with respect
to "Use of manag; skills in the class"
HEADS DATA SA A UNC DA SDAMEAN SCORE
MALE PIT
Response 516 3 2 0
3.9Score 25
64 9 4 0
%age 1962 12 8 0
MALE NIT
Response 711 8 0 0
4.0Score 35
44 24 0 0
%age 2742 31 0 0
FEMALE PIT
Response 1013 3 0 0
4.3Score 50
52 9 0 0
%age 3850 12 0 0
FEMALE NIT
Response 5 8 10 1 0
3.7Score 25
32 30 2 0
%age 2133 42 4 0
Mean score of the comments of the head teachers regarding the performance of the PIT rural male teachers in the particular area is 4.0 whereas as of PIT rural female teachers is 4.3. This depicts better performance of the PIT female teachers.

239
Table No.4.10.4
Comparison of the comments of the Head Teachers regarding the performance of PIT rural male and female teachers with respect to "Use
of A.V. Aids in the class"
HEADS DATA SA A UNC DA SDAMEAN SCORE
MALE PIT
Response 10 9 6 0 1
4.0Score 50
36 18 0 1
%age 3835 23 0 4
MALE NIT
Response 712 6 0 0
4.0Score 35
48 18 0 0
%age 2848 24 0 0
FEMALE PIT
Response 10 9 4 2 1
4.0Score 50
36 12 4 1
%age 3835 15 8 4
FEMALE NIT
Response 7 9 7 2 0
3.8Score 35
36 21 4 0
%age 2836 28 8 0

240
Mean score of the comments of the head teachers regarding the performance of the PIT male teachers in the particular area is 4.0 whereas of PIT female teachers is 4.0 The performance of both the groups is similar.

241
Table No.4.10.5
Comparison of the comments of the Head Teachers regarding the performance of PIT Rural male and female teachers with respect to "Use
of different teaching methods"
HEADS DATA SA A UNC DA SDAMEAN SCORE
MALE PIT
Response 11 7 5 2 1
4.0Score 55
28 15 4 1
%age 4227 19 8 4
MALE NIT
Response 9 7 9 1 0
3.9Score 45
28 27 2 0
%age 3527 35 4 0
FEMALE PIT
Response 15 6 4 0 0
4.4Score 75
24 12 0 0
%age 6024 16 0 0
FEMALE NIT
Response 317 2 3 0
3.8Score 15
68 6 6 0
%age 1268 8 12 0
Mean score of the comments of head teachers regarding the performance of PIT male teachers in the particular area is 4.0 whereas of female teachers is 4.4. This shows better performance of the PIT female teachers.
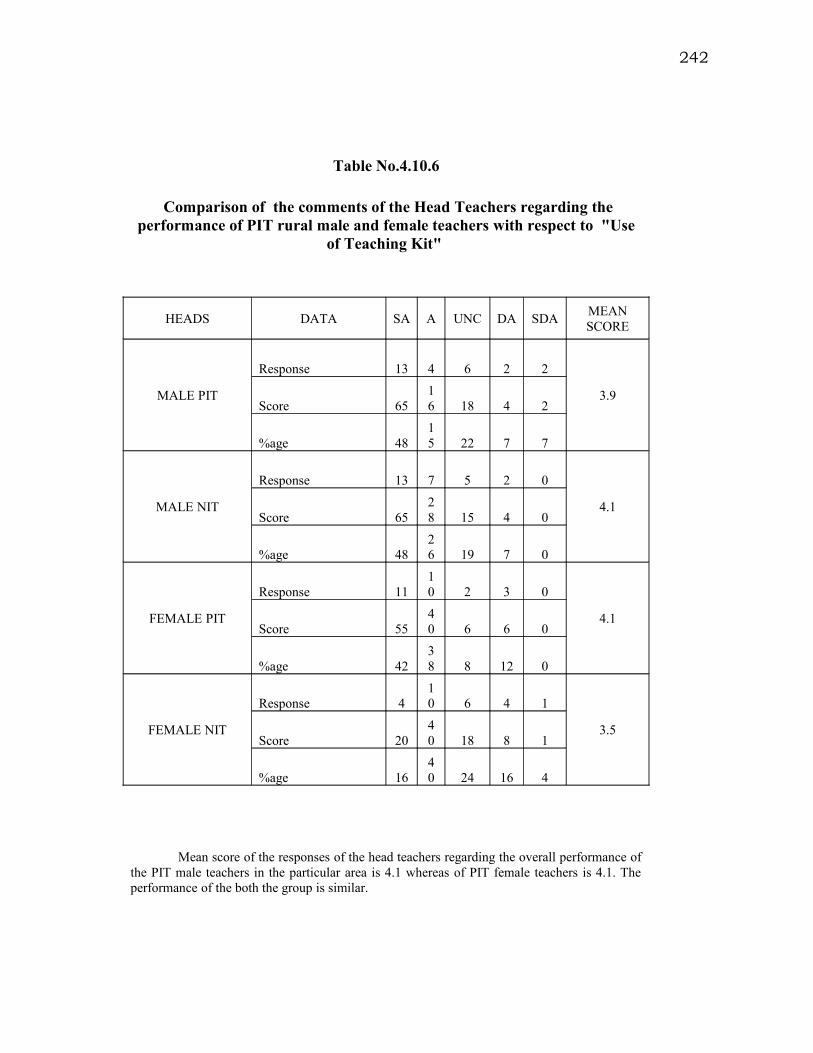
242
Table No.4.10.6
Comparison of the comments of the Head Teachers regarding the performance of PIT rural male and female teachers with respect to "Use
of Teaching Kit"
HEADS DATA SA A UNC DA SDAMEAN SCORE
MALE PIT
Response 13 4 6 2 2
3.9Score 65
16 18 4 2
%age 4815 22 7 7
MALE NIT
Response 13 7 5 2 0
4.1Score 65
28 15 4 0
%age 4826 19 7 0
FEMALE PIT
Response 1110 2 3 0
4.1Score 55
40 6 6 0
%age 4238 8 12 0
FEMALE NIT
Response 410 6 4 1
3.5Score 20
40 18 8 1
%age 1640 24 16 4
Mean score of the responses of the head teachers regarding the overall performance of the PIT male teachers in the particular area is 4.1 whereas of PIT female teachers is 4.1. The performance of the both the group is similar.

243
Table No.4.10.7
Comparison of the comments of the Head Teachers regarding the performance of PIT rural male and female teachers with respect to
"Partial re-capitulation of the lesson"
HEADS DATA SA A UNC DA SDAMEAN SCORE
MALE PIT
Response 12 9 2 2 1
4.1Score 60
36 6 4 1
%age 4635 8 8 4
MALE LNIT
Response 15 7 4 1 0
4.3Score 75
28 12 2 0
%age 5626 15 4 0
FEMALE PIT
Response 1410 2 0 0
4.5Score 70
40 6 0 0
%age 5438 8 0 0
FEMALE NIT
Response 512 6 2 0
3.8Score 25
48 18 4 0
%age 2048 24 8 0
Mean score of the responses of the head teachers regarding the PIT rural male teachers with respect to application of relevant teaching skill is 4.3 whereas of PIT female teachers is 4.5 . This shows better performance of the female teachers.

244
Table No.4.10.8
Comparison of the comments of the Head Teachers regarding the performance of PIT rural male and female teachers with respect to "Total
re-capitulation of the lesson"
HEADS DATA SA A UNC DA SDAMEAN SCORE
MALE PIT
Response 14 9 2 1 0
4.4Score 70
36 6 2 0
%age 5435 8 4 0
MALE NIT
Response 11 8 5 2 0
4.1Score 55
32 15 4 0
%age 4231 19 8 0
FEMALE PIT
Response 17 6 3 0 0
4.5Score 85
24 9 0 0
%age 6523 12 0 0
FEMALE NIT
Response 812 4 2 0
4.0Score 40
48 12 4 0
%age 3146 15 8 0
Mean score of the responses of the head teachers regarding the performance of PIT rural male teachers in the particular area is 4.4 whereas of PIT female teachers is 4.5. This indicates better performance of the PIT female teachers.

245
Table No.4.10.9
Comparison of the comments of the Head Teachers regarding the performance of PIT rural male and female teachers with respect to “Final evaluation of the lesson"
HEADS DATA SA A UNC DA SDAMEAN SCORE
MALE PIT
Response 18 5 1 2 0
4.5Score 90
20 3 4 0
%age 6919 4 8 0
MALE NIT
Response 12 9 1 3 0
4.2Score 60
36 3 6 0
%age 4836 4 12 0
FEMALE PIT
Response 17 7 1 0 0
4.6Score 85
28 3 0 0
%age 6828 4 0 0
FEMALE NIT
Response 1011 2 0 0
4.3Score 50
44 6 0 0
%age 4348 9 0 0
Mean score of the responses of the head teachers regarding the performance of PIT rural male teachers in the particular area is 4.5 whereas of PIT rural female teachers is 4.6. This shows better performance of the PIT rural female teachers.

246
Table No.4.10.10
Comparison of the comments of the Head Teachers regarding the PIT rural male and female teachers with respect to "Assigning home work to the students"
HEADS DATA SA A UNC DA SDAMEAN SCORE
MALE PIT
Response 16 7 2 0 1
4.4Score 80
28 6 0 1
%age 6227 8 0 4
MALE NIT
Response 12 9 4 1 0
4.2Score 60
36 12 2 0
%age 4635 15 4 0
FEMALE PIT
Response 13 9 1 1 0
4.4Score 65
36 3 2 0
%age 5438 4 4 0
FEMALE NIT
Response 1110 3 0 0
4.3Score 55
40 9 0 0
%age 4642 13 0 0
Mean score of the Responses of the head teachers regarding the overall performance of the PIT rural male teachers in specific field is 4.4 and that of female PIT rural teachers is 4.4. Both the groups have similar performance in the relevant field.

247
PART-III (TABLE NO.4.3.91 TO 4.3.100) ANALYSIS OF DATA OF PART-I AND PART-II
Table No. 4.11.1
Analysis of data on the basis of t test of PIT and NIT Teachers in application of eight selected teaching skills at 0.05 levels.
Degree of Freedom Table Value Calculated Value208 1.97 4.35
Application of t test yielded the value of 4.35, which is higher than table value at
0.05 level. It means that there is significant difference in the performance of PIT teachers
and NIT teachers in the application of different selected teaching skills. Hence the null
hypothesis is not accepted.
Table No. 4.11.2
Analysis of data on the basis of t test of PIT male teachers and PIT female Teachers in application of eight selected teaching skills at 0.05
level.Degree of Freedom Table Value Calculated Value
103 1.98 0.711
Table value of t is 1.98 at 0.05 level. Calculated value is 0.711. This is less than the
table value, which means that there is no significant difference between the performance of
PIT male teachers and PIT female teachers. So null hypothesis is accepted.
Table No. 4.11.3

248
Analysis of data on the basis of t test of PIT Urban teachers and PIT Rural teachers in application of eight selected teaching skills at 0.05 level.
Degree of Freedom Table Value Calculated Value103 1.98 3.537
Table value of t is 1.98 at 0.05 level. Calculated value is 3.537, which is more than
the table value. It means that there is significant difference between the performance of
PIT Urban teachers and PIT rural teachers. Hence Null hypothesis is not accepted.
Table No. 4.11.4
Analysis of data on the basis of t test of PIT urban male and PIT urban
female teachers in application of eight selected teaching skills at 0.05
level.
Degree of Freedom Table Value Calculated Value50 2.00 0.798
Table value of t is 2.00 at 0.05 level. Calculated value is 0.798, which is less than
table value. It means that there is no difference between the performance of PIT urban
male teachers and PIT urban female teachers. Hence null hypothesis is accepted.
Table No. 4.11.5
Analysis of data on the basis of t test of PIT Rural male teachers and PIT rural female teachers in application of eight selected teaching skills at
0.05 level.Degree of Freedom Table Value Calculated Value
50 2.00 1.25

249
Table value of t is 2.00 at 0.05 level. Calculated value is 1.25. It is less than table
value, which means that there is no significant difference between the performance of PIT
rural male and PIT rural female teachers. Hence null hypothesis is accepted.
Table No. 4.11.6
Analysis of data on the basis of t test of PIT teachers and NIT teachers in view of their head’s opinions in application of different
skills/teaching skills at 0.05 level.
Degree of Freedom Table Value Calculated Value208 1.97 1.886
Table value of t is 1.97 at 0.05 level. Calculated value of t test of the head teachers'
views is 1.886. It is less than the table value. It means that there is no significant difference
between the performance of the PIT and NIT teachers in view of their head teachers. So
null hypothesis is accepted.
Table No. 4.11.7
Analysis of data on the basis of t test of PIT male teachers and PIT female teachers in view of their head’s opinions in application of different
skills/teaching skills at 0.05 level.
Degree of Freedom Table Value Calculated Value103 1.98 4.16
Table value of t is 1.98 at 0.05 level. Calculated value of t test of the head teachers'
views is 4.16. It is more than the table value. It means that there is significant difference

250
between the performance of PIT male and PIT female teachers. So null hypothesis is not
accepted.
Table No. 4.11.8
Analysis of data on the basis of t test of PIT urban teachers and PIT rural teachers in view of their head’s opinions in application of different
skills/teaching skills at 0.05 level.
Degree of Freedom Table Value Calculated Value103 1.98 0.886
Table value of t is 1.98 at 0.05 level. Calculated value of t test of the head teachers'
views is 0.886. It is less than the table value. It means that there is no significant difference
between the performance of PIT Urban and PIT Rural teachers according to their head
views. So hypothesis is accepted.
Table No. 4.11.9
Analysis of data on the basis of t test of PIT Urban male teachers and PIT Urban female teachers in view of their head’s opinions in application
of different skills/teaching skills at 0.05 level.
Degree of Freedom Table Value Calculated Value50 2.00 0.480
Table value of t is 2.00 at 0.05 level. Calculated value of t test of the head teachers'
views is 0.480. It is less than the table value. It means that there is no significant difference
between the performance of the PIT Urban male and PIT urban female teachers according
to their head views. So null hypothesis is accepted.

251
Table No. 4.11.10
Analysis of data on the basis of t test of PIT Rural male teachers and PIT Rural female teachers in view of their head’s opinions in application of
different skills/teaching skills at 0.05 level.
Degree of Freedom Table Value Calculated Value50 2.00 0.64
Table value of t is 2.00 at 0.05 level. Calculated value of t test of the head teachers’
views is 0.64. It is less than the table value. It means that there is no significant difference
between the performance of the PIT rural male and PIT rural female teachers according to
their head views. So null hypothesis is accepted.
K. Discussion on the findings of the researcher’s observations and head opinions as tabulated.
The observation schedule having different eight teaching skills was administered in
four districts of Hazara Division by different researchers. (Appendix C) The observation
schedule and head’s opinions have been tabulated in the tables from 4.1.1 to 4.3.100. In
these tables the data has been interpreted and analyzed by mean score and t –test. The
findings there to are given in summarized form as under:-
1. The mean score of the performance of PIT teachers with respect to eight
selected teaching skills is on higher side. There is significant difference in the
performance of both the groups as per t. test.
2. There is significant difference in the performance of PIT urban teachers and
PIT rural teachers as per meanscore and t test.

252
3. The performance of PIT male and PIT female teachers, Urban male and female
teachers, rural male and female teachers is different as per meanscore but there
is no significant difference in their performance as per t- test. It revealed similar
performance of PIT teachers of all groups.
4. There is significant difference in the performance of PIT male and PIT female
teachers in view of their head teacher’s opinions.
5. There is no significant difference in the performance of PIT and NIT teachers,
PIT urban and rural teachers, Urban male and female teachers and Rural male
and female teachers although the performance of these groups is different as per
mean score.
253
CHAPTER 5
5. SUMMARY, FINDINGS, CONCLUSIONS AND RECOMMENDATIONS
5.1 SUMMARY
The study was design to find out difference in the performance of the PIT and NIT
teachers in Hazara Division and to develop a strategy for future. The study was based on
the actual class room performance of PIT and NIT teachers. The class room performance
of PIT teachers and NIT teachers was observed according to structured observation
schedule. Various teaching skills were included in this list. Each item had three to eight
sub items. Selection was made of those primary trained teaches who had received in-
service training during the period 1995-2002 named as PIT. A second group was taken of
those trained teachers who had no in-service training at their credit named as NIT.
For this purpose those training programs were included in the study which had at
least, two weeks duration. The opinions of the head teachers of the respective primary
schools were also obtained on the overall performance of both the groups.
The data so obtained was organized, tabulated, and analyzed by mean score and t
test in a numbers of tables in order to find out the significant difference between the
performances of two groups. The findings and the conclusions of the tabulated data
indicated that there is significant difference between the performance of PIT and NIT
teachers.

254
5.2 FINDINGS
Following were the findings of the study:
5.2.1 Comparison of the performance of PIT and NIT teachers (male and female) in their class rooms in view of data collected and tabulated through observation schedule.
1. Mean score of PIT teachers ranged between 3.9 and 4.2 whereas
mean score of NIT teachers ranged between 3.3 and 3.5. This indicated that
performance of PIT teachers in respect of different aspects of teaching skill,
“Set Induction” and “Presentation” was better than those of NIT teachers.
Null hypothesis is therefore not accepted. (Table 4.1.1, 4.2.2)
2. Mean score of PIT teachers with respect to “Questioning”
and its different aspects was from 3.9 to 4.3 whereas mean score of NIT
teachers was 3.1 to 3.4. This revealed better performance of the PIT
teachers. The null hypothesis is not accepted (Table 4.1.3)
3. Mean score of PIT teachers ranged from 3.8 to 3.9 whereas
mean score of NIT teachers ranged from 3.0 to 3.3. This indicated better
performance of PIT teachers with respect to different aspects of teaching
skill, “Listening". The null hypothesis is not accepted (Table 4.1.4)
4. Mean score of PIT teachers with respect to "Motivation"
ranged between 3.7 and 4.2 whereas mean score of NIT teachers ranged

255
between 3.1 to 3.4. This revealed better performance of PIT teachers in the
particular area. The null hypothesis is not accepted (Table 4.1.5)
5. Mean score of PIT teachers with respect to application of
teaching skill, “Teachers Liveliness" was from 3.8 to 4.3 whereas of NIT a
teacher was from 3.0 to 3.4. This indicated better performance of PIT
teachers in the particular area. The null hypothesis is not accepted. (Table
4.1.6)
6. Mean score of the PIT teachers with respect to teaching
skill, "Closing of the Lesson" was from 4.0 to 4.3 whereas of NIT teachers
was from 3.1 to 3.8. This showed better performance of the PIT teachers.
The null hypothesis is not accepted. (Table 4.1.7)
7. Mean score of PIT male teachers ranged from 3.8 to 3.9
whereas mean score of NIT teachers ranged from 2.9 to 3.3. This reflected
better performance of the PIT teachers with respect to application of
teaching skill, “planning”. The null hypothesis is not accepted.
(Table 4.1.8)
5.2.2 Comparison of the comments of Head Teachers regarding the performance of PIT and NIT teachers (male and female) in view of data collected and tabulated through questionnaire.
8. Mean score of the comments of head teachers
regarding the performance of PIT teachers with respect to “Command on the
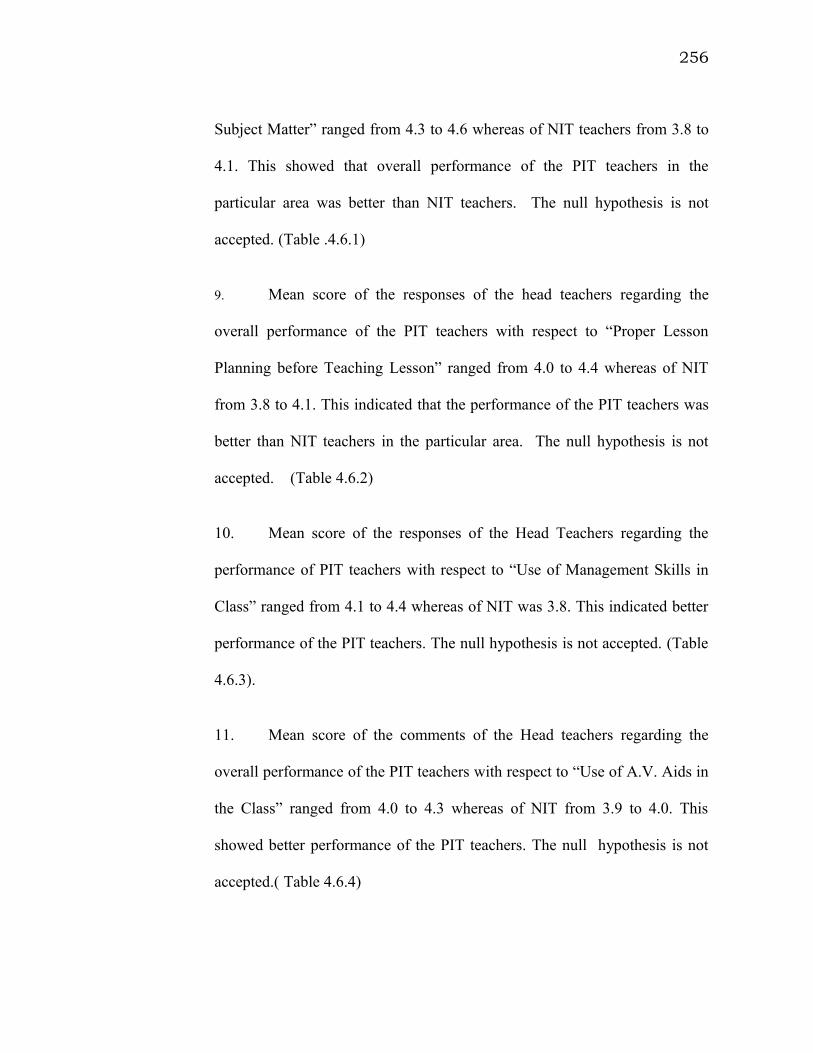
256
Subject Matter” ranged from 4.3 to 4.6 whereas of NIT teachers from 3.8 to
4.1. This showed that overall performance of the PIT teachers in the
particular area was better than NIT teachers. The null hypothesis is not
accepted. (Table .4.6.1)
9. Mean score of the responses of the head teachers regarding the
overall performance of the PIT teachers with respect to “Proper Lesson
Planning before Teaching Lesson” ranged from 4.0 to 4.4 whereas of NIT
from 3.8 to 4.1. This indicated that the performance of the PIT teachers was
better than NIT teachers in the particular area. The null hypothesis is not
accepted. (Table 4.6.2)
10. Mean score of the responses of the Head Teachers regarding the
performance of PIT teachers with respect to “Use of Management Skills in
Class” ranged from 4.1 to 4.4 whereas of NIT was 3.8. This indicated better
performance of the PIT teachers. The null hypothesis is not accepted. (Table
4.6.3).
11. Mean score of the comments of the Head teachers regarding the
overall performance of the PIT teachers with respect to “Use of A.V. Aids in
the Class” ranged from 4.0 to 4.3 whereas of NIT from 3.9 to 4.0. This
showed better performance of the PIT teachers. The null hypothesis is not
accepted.( Table 4.6.4)
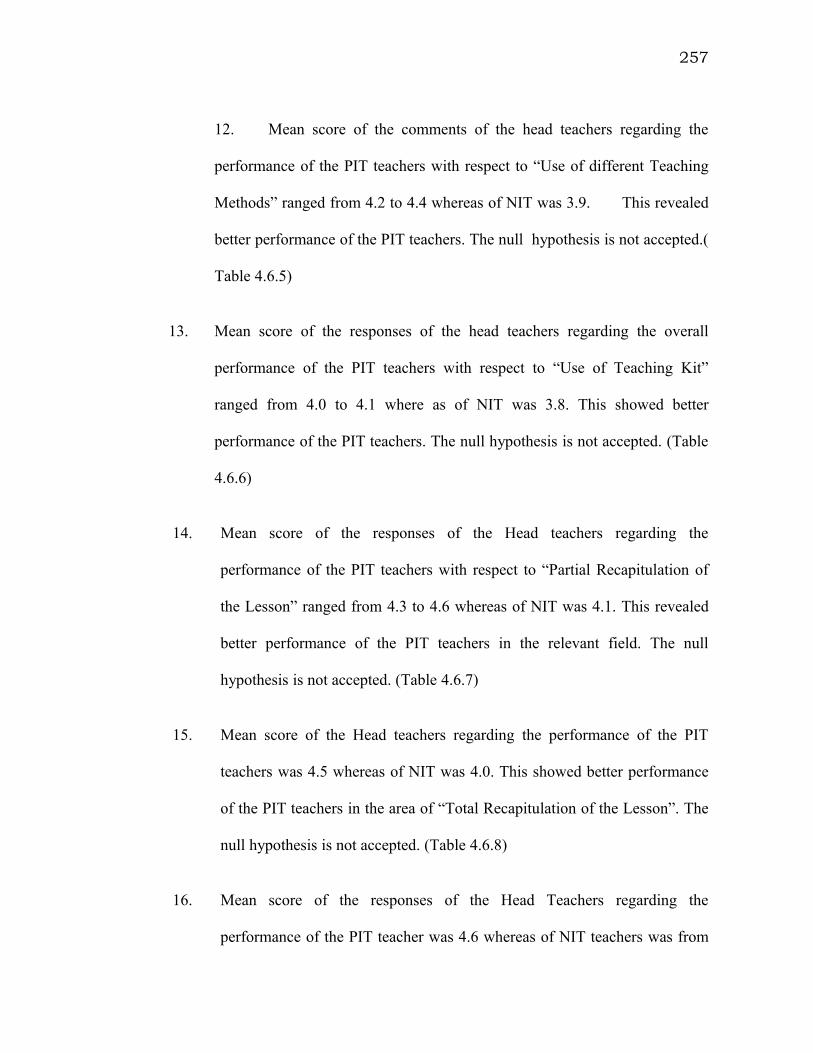
257
12. Mean score of the comments of the head teachers regarding the
performance of the PIT teachers with respect to “Use of different Teaching
Methods” ranged from 4.2 to 4.4 whereas of NIT was 3.9. This revealed
better performance of the PIT teachers. The null hypothesis is not accepted.(
Table 4.6.5)
13. Mean score of the responses of the head teachers regarding the overall
performance of the PIT teachers with respect to “Use of Teaching Kit”
ranged from 4.0 to 4.1 where as of NIT was 3.8. This showed better
performance of the PIT teachers. The null hypothesis is not accepted. (Table
4.6.6)
14. Mean score of the responses of the Head teachers regarding the
performance of the PIT teachers with respect to “Partial Recapitulation of
the Lesson” ranged from 4.3 to 4.6 whereas of NIT was 4.1. This revealed
better performance of the PIT teachers in the relevant field. The null
hypothesis is not accepted. (Table 4.6.7)
15. Mean score of the Head teachers regarding the performance of the PIT
teachers was 4.5 whereas of NIT was 4.0. This showed better performance
of the PIT teachers in the area of “Total Recapitulation of the Lesson”. The
null hypothesis is not accepted. (Table 4.6.8)
16. Mean score of the responses of the Head Teachers regarding the
performance of the PIT teacher was 4.6 whereas of NIT teachers was from

258
4.1 to 4.3. This showed better performance of the PIT teachers with respect
to “Evaluation of the taught Lesson”. The null hypothesis is not accepted.
(Table 4.6.9)
17 Mean score of the responses of the head teachers regarding the performance
of the PIT teachers with respect to ‘Assigning homework to the students”
ranged from 4.4 to 4.6 whereas NIT teachers from 4.1 to 4.3. This showed
better performance of the PIT teachers. The null hypothesis is not accepted.
(Table 4.6.10)
5.2.3 Comparison of the performance of PIT male teachers and PIT female teachers in their classrooms in view of data collected and tabulated through observation schedule.
18. Mean score of the PIT male teachers with respect to “Set Induction” ranged
between 4.1 and 4.3 whereas mean score of PIT female teachers ranged
between 3.9 and 4.1. This showed that the performance of the PIT male
teachers in respect of different aspects of “Set Induction” was better than
PIT female teachers. The null hypothesis is not accepted. (Table 4.2.1)
19. Mean score of the PIT male teachers with respect to different aspects of
“Presentation” ranged from 4.1 to 4.2 whereas mean score of PIT female
teachers ranged from 4.1 to 4.2. Hence the performance of both the genders
with respect to this particular area was same. Null hypothesis is therefore
accepted (Table 4.2.2)

259
20. Mean score of PIT male teachers with respect to skill, “Questioning” was
between 4.1 and 4.2 whereas mean score of PIT female teachers was
between 3.9 and 4.3. This indicated better performance of PIT female
teachers. The null hypothesis is not accepted. (Table 4.2.3)
21. Mean score of PIT male teachers was 3.6 to 3.9 whereas mean score of PIT
female teachers was 3.7 to 3.8. This revealed that the performance of the
PIT male teachers with respect to “Listening” was better than PIT female
teachers Hence Null hypothesis is not accepted (Table 4.2.4)
22. Mean score of PIT male teachers ranged between 3.9 and 4.2 whereas PIT
female teachers from 3.8 to 4.0. This revealed better performance of male
PIT teachers with respect to different aspects of “Motivation”. Hence Null
hypothesis is not accepted (Table 4.2.5)
23. Mean score of PIT male teachers ranged from 4.2 to 4.3 whereas mean
score of PIT female teachers ranged from 3.8 to 4.0. This indicated better
performance of the PIT male teacher with respect to different aspects of
“Teacher Liveliness”. Hence Null hypothesis is not accepted (Table 4.2.6)
24. Mean score of PIT male teachers with respect to “Closure of

260
Lesson” was from 4.1 to 4.2 whereas mean score of PIT female teachers
was from 3.9 to 4.2. This showed similar performance of both the groups.
Hence Null hypothesis is accepted (Table 4.2.7).
25. Mean score of the performance of PIT male teachers with respect to
teaching skill “ Planning” ranged from 3.9 to 4.0 whereas mean score of
PIT female teachers ranged from 3.7 to 3.8. This showed better performance
of the PIT male teachers. Hence Null hypothesis is not accepted (Table
4.2.8)
5.2.4 Comparison of the comments of Head Teachers regarding the performance of PIT Male and PIT female teachers in view of data collected and tabulated through questionnaire.
26. Mean score of the comments of the Head teachers regarding the performance of
PIT male teachers with respect to “Command on the Subject” ranged from
4.1 to 4.5 whereas of PIT female teachers from 3.8 to 4.4. This indicated
better performance of the PIT male teachers. (Table 4.7.1)
27. Mean score of the comments of the head teachers regarding the
performance of the PIT male teachers with respect to “Proper Lesson
Planning before teaching Lesson” ranged from 3.8 to 4.2 whereas the
performance of PIT female teachers ranged from 4.1 to 4.2. This showed
similar performance of both the two genders. Hence Null hypothesis is
accepted. (Table 4.7.2)

261
28. Mean score of the comments of head teachers regarding the performance of
the PIT male teachers with respect to “Use of Management Skills in the
Class” ranged from 3.7 to 4.1 where as of PIT female teachers from 4.0 to
4.4. This revealed better performance of the PIT female teachers. Hence
Null hypothesis is not accepted. (Table 4.7.3)
29. Mean score of the comments of the head teachers regarding the
performance of the PIT male teachers with respect to “Use of A. V. Aids in
the Class” ranged from 3.8 to 4.1 whereas of PIT female teachers was 4.2.
This indicated better performance of the PIT female teachers. Hence Null
hypothesis is not accepted. (Table 4.7.4)
30. Mean score of the head teachers regarding the performance of PIT male
teachers with respect to “Use of different Teaching Methods” ranged from
3.7 to 4.2 whereas of PIT female teachers from 4.1 to 4.5. This revealed
better performance of the PIT female teachers. Hence Null hypothesis is not
accepted. (Table 4.7.5)
31. Mean score of the responses of the head teachers regarding the overall
Performance of the PIT male teachers with respect to “Use of Teaching Kit”
ranged from 3.7 to 4.0 whereas of PIT female teachers from 3.9 to 4.2. This
showed better performance of the PIT male teachers. Hence Null
hypothesis is not accepted. (Table 4.7.6)
32. Mean score of the responses of the head teachers regarding the performance
of PIT male teachers with respect to “Partial recapitulation of lesson”
ranged from 4.0 to 4.3 whereas of PIT female teachers from 4.1 to 4.6. This

262
showed better performance of the PIT female teachers. Hence Null
hypothesis is not accepted (Table 4.7.7)
33. Mean score of the responses of the head teachers regarding the performance
of PIT male teachers with respect to “Total re-capitulation of Lesson”
ranged from 3.8 to 4.1 whereas of PIT female teachers from 4.2 to 4.6. This
indicated better performance of the PIT female teachers. Hence Null
hypothesis is not accepted. (Table 4.7.8)
34. Mean score of the responses of the head teachers regarding the performance
of PIT male teachers with respect to “Evaluation of the taught Lesson”
ranged from 4.0 to 4.5 whereas of PIT female teachers from 4.4 to 4.7. This
showed better performance of the PIT female teachers. Hence Null
hypothesis is not accepted. (Table 4.7.9)
35. Mean score of the responses of the head teachers regarding the overall
performance of the PIT male teachers with respect to “Assigning of home
work to the students” ranged from 4.1 to 4.5 and that of female PIT teachers
from 4.2 to 4.5. There seemed to be no difference in the performance of
both the genders in this area. Hence Null hypothesis is accepted. (Table
4.7.10)
5.2.5 Comparison of the performance of PIT urban teachers and PIT rural
teachers in their classrooms in view of data collected and tabulated through
observation schedule.

263
36. Mean score of PIT urban teachers ranged between 3.3 and 4.1 whereas
mean score of PIT rural teachers with in-service training ranged between
3.3 and 4.2. This indicated that the performance of the PIT rural teachers
with respect to different aspects of “Set Induction” was better than those of
PIT urban teachers. Hence Null hypothesis is not accepted. (Table 4.3.1)
37. Mean score of PIT urban teachers ranged between 3.2 and 4.1 whereas
mean score of PIT rural teachers ranged between 3.3 and 4.3. This indicated
that the performance of PIT rural teachers with respect to different aspects
of teaching skill, “Presentation” was better. Hence Null hypothesis is not
accepted (Table 4.3.2)
38. Mean score of PIT urban teachers ranged between 3.1 and 4.3 whereas
mean score of PIT rural teachers ranged between 3.2 and 4.2. This indicated
that the performance of PIT urban teachers with respect to different aspects
of teaching skill, “Questioning” was better. Hence Null hypothesis is not
accepted (Table 4.3.3)
39. Mean score of PIT urban teachers ranged between 3.0 and 3.8 whereas
mean score of PIT rural teachers ranged between 3.1 and 3.9. This revealed
better performance of PIT rural teachers with respect to different aspects of
teaching skill, “Listening”. Hence Null hypothesis is not accepted (Table
4.3.4)
40. Mean score of PIT urban teachers ranged from 3.1 to 3. 9 whereas
mean score of PIT rural teachers ranged from 3.2 to 4.2. This indicated that
the performance of PIT rural teachers with respect to skill, “Motivation”

264
was better than PIT urban. Hence Null hypothesis is not accepted (Table
4.3.5)
41. Mean score of PIT urban teachers with respect to teaching skill, “Teacher’s
Liveliness” ranged from 3.1 to 4.1 whereas of PIT a rural teacher was from
3.0 to 4.3. This indicated better performance of PIT rural teachers. Hence
Null hypothesis is not accepted (Table 4.3.6)
42. Mean score of the PIT urban teachers with respect to different aspects of
teaching skill, “Closing of Lesson” ranged from 3.2 to 4.2 whereas mean
score of PIT rural teachers ranged from 3.1 to 4.3. This indicated better
performance of PIT rural teachers. Hence Null hypothesis is not accepted
(Table 4.3.7)
43. Mean score of teaching skill, “Planning” of PIT urban teachers ranged from
3.0 to 3.9 whereas of PIT rural teachers ranged from 2.9 to 3.9. The
performance of both the groups was same in this particular area. Hence Null
hypothesis is accepted. (Table 4.3.8)
5.2.6 Comparison of the comments of Head Teachers regarding the performance of PIT Urban teachers and PIT Rural teachers in view of data collected and tabulated through questionnaire.
44. Mean score of the responses of the head teachers regarding the overall
performance of the PIT urban male teachers with respect to “Command on
the subject” was 4.6 and that of PIT rural teachers was 4.3. This indicated
that the performance of PIT urban teachers according to their head’s
opinion was better. Hence Null hypothesis is not accepted. (Table 4.8.1)

265
45. Mean score of the responses of the head teachers regarding the overall
performance of the PIT urban male teachers with respect to “Lesson
Planning” was 4.4 and that of PIT rural teachers was 4.0. This indicated that
the performance of PIT urban teachers according to their head’s opinion
was better. Hence Null hypothesis is not accepted. (Table 4.8.2)
46. Mean score of the comments of head teachers regarding the performance of PIT
urban teachers was 4.4 whereas of PIT rural teacher was 4.1. This indicated
that the performance of the PIT urban teacher was better than PIT rural
teachers in the area of “Use of management skills in the class”. Hence Null
hypothesis is not accepted. (Table 4.8.3)
47. Mean score of the comments of head teachers regarding the performance of PIT
urban teachers with respect to “Use of A.V. Aids in the class” was 4.3
whereas of PIT rural teacher was 4.0. This indicated that the performance
of the PIT urban teacher was better than PIT rural teachers in the particular
area. Hence Null hypothesis is not accepted. ( Table 4.8.4)
48. Mean score of the comments of head teachers regarding the performance of PIT
urban teachers with respect to “Use of different teaching methods” was 4.4
whereas of PIT rural teacher was 4.2. This indicated that the performance
of the PIT urban teacher was better in the particular area. Hence Null
hypothesis is not accepted. (Table 4.8.5)
49. Mean score of the comments of head teachers regarding the performance of PIT
urban teachers with respect to “Use of teaching Kit” was 4.1 whereas of PIT
rural teacher was 4.0. This revealed that the performance of the PIT urban

266
teacher was better in the particular area. Hence Null hypothesis is not
accepted. ( Table 4.8.6)
50. Mean score of the comments of the head teachers regarding the performance of
PIT urban teachers with respect to “Partial re-capitulation of the lesson”
was 4.6 whereas of PIT rural teacher was 4.3. This indicated that the
performance of PIT urban teacher was better than PIT rural teachers. Hence
Null hypothesis is not accepted. (Table 4.8.7)
51. Mean score of the comments of head teachers regarding the performance of PIT
urban teachers with respect to “Total re-capitulation of the lesson” was 4.5
whereas of PIT rural teacher was 4.5. This indicated similar performance of
both the groups. Hence Null hypothesis is accepted. (Table 4.8.8).
52. Mean score of the comments of head teachers regarding the performance of the
PIT urban teachers with respect to “Evaluation of the Taught Lesson “was
4.6 whereas of PIT rural teacher was 4.6. This indicated similar opinion
about both the groups. Hence Null hypothesis is accepted. ( Table 4.8.9)
53. Mean score of the comments of the head teachers regarding the performance of
PIT urban teachers with respect to “Assigning Home work to the students”
was 4.6 whereas of PIT rural teacher was 4.4. This indicated that the
performance of the PIT urban teacher was better than PIT rural teachers.
Hence Null hypothesis is not accepted. (Table 4.8.10)

267
Comparison of the performance of PIT Urban male teachers and PIT urban female teachers in their classrooms in view of data collected and tabulated through observation schedule.
54. Mean score of Urban PIT male teachers ranged from 3.3 to 4.3 whereas
mean score of PIT female teachers ranged from 3.2 to 4.1. This revealed
better performance of PIT male teachers with respect to different aspects of
teaching skill, "Set Induction". The null hypothesis is not accepted (Table
No.4.4.1)
55. Mean score of Urban PIT male teachers ranged from 3.2 to 4.2, where as
mean score of PIT female teachers ranged from 3.2 to 4.1 which indicated
better performance of the PIT male teachers in the teaching skill,
"Presentation". The null hypothesis is not accepted. (Table No.4.42)
56. Mean score of Urban PIT male teachers ranged from 3.0 to 4.3, where as
mean score of PIT female teachers ranged from 3.1 to 4.3. This indicated
similar performance of both the groups with respect to different aspects of
teaching skill, "Questioning". The null hypothesis is not accepted. (Table
No.4.4.3)
57. Mean score of Urban PIT male teachers ranged from 3.1 to 3.7, where as
mean score of PIT female teachers ranged from 2.9 to 3.7. This indicated
similar performance of both the groups in application of teaching skill,
“Listening”. The null hypothesis is accepted. (Table No.4.4.4)
268
58. Mean score of Urban PIT male teachers ranged from 3.1 to 4.2, where as
mean score of PIT female teachers ranged from 3.0 to 3.8. This indicated
better performance of Urban PIT male teachers with respect to different
aspects of teaching skill, "Motivation". The null hypothesis is not accepted.
(Table No.4.4.5)
59. Mean score of Urban PIT male teachers ranged from 3.0 to 4.3, where as
mean score of PIT female teachers ranged from 3.1 to 3.9. This revealed
better performance of Urban PIT male teachers with respect to different
aspects of teaching skill, "Teachers liveliness". The null hypothesis is not
accepted. (Table No.4.4.6)
60. Mean score of Urban PIT male teachers was from 3.1 to 4.2, where as mean
score of PIT female teachers was from 3.0 to 4.1. This revealed better
performance of Urban PIT male teachers with respect to different aspects of
teaching skill, "Closure of lesson". The null hypothesis is not accepted.
(Table No.4.4.7)
61. Mean score of Urban PIT male teachers ranged from 3.0 to 4.0, where as
mean score of PIT female teachers ranged from 2.8 to 3.9. This revealed
better performance of Urban PIT male teachers with respect to different
aspects of teaching skill, "Planning". The null hypothesis is not accepted.
(Table No.4.4.8)
5.2.7 Comparison of the comments of Head Teachers regarding the performance of PIT Urban male teachers and PIT urban female teachers in view of data collected and tabulated through a questionnaire.

269
62. Mean score of the comments of the Head teachers regarding the
performance of PIT urban male teachers ranged from 4.0 to 4.7 whereas of
PIT urban female teachers was from 3.7 to 4.4. This showed better
performance of the PIT male teachers in the area of “command on the
subject”. The null hypothesis is not accepted. (Table No.4.91)
63. Mean score of the comments of the head teachers regarding the
performance of the PIT urban male teachers in particular area of “Lesson
planning before teaching lesson” was from 3.9 to 4.5 whereas the
performance of PIT urban female teachers was from 4.3 to 4.4. This
indicated better performance of male teachers. The null hypothesis is not
accepted. (Table No.4.9.2)
64. Mean score of the comments of head teachers regarding the performance of the
PIT urban male teachers in the area of “Use of management skills in the
class” was between 3.5 and 4.3 where as of PIT a female teacher was
between 4.2 and 4.4. This reflected better performance of the PIT female
teachers. The null hypothesis is not accepted. (Table No.4.9.3)
65. Mean score of the comments of the head teachers regarding the
performance of the PIT urban male teachers in the area of “Use of A. V aids” ranged from
3.6 to 4.1 whereas of PIT urban female teachers was 4.4. This revealed better performance
of the PIT female teachers. The null hypothesis is not accepted. (Table No.4.9.4)

270
66. Mean score of the comments of head teachers regarding the performance of
PIT urban male teachers in the particular area, “ Use of different teaching
methods” was from 3.4 to 4.4 whereas of PIT urban female teachers was
from 4.3 to 4.5. This revealed better performance of the PIT urban female
teachers. The null hypothesis is not accepted. (Table No.4.9.5)
67. Mean score of the responses of the head teachers regarding the overall
performance of the PIT urban male teachers in the particular area of
"Use of teaching kit” ranged from 3.4 to 4.0 whereas of PIT an urban
female teacher was 4.2. This revealed better performance of the PIT urban
female teachers. The null hypothesis is not accepted. (Table No.4.9.6)
68. Mean score of the responses of the head teachers regarding the PIT urban
male teachers with respect to application of relevant teaching skill i.e.
"Partial re-capitulation of lesson” ranged from 3.7 to 4.4 whereas of PIT
urban female teachers from 4.4 to 4.7. This showed better performance of
the female teachers. The null hypothesis is not accepted. (Table No.4.9.7)
69. Mean score of the responses of the head teachers regarding the performance
of PIT male teachers in the area i.e. “Total re-capitulation of the lesson”
was between 3.6 and 4.5 whereas of PIT Urban female teachers was
between 4.4 and 4.6. This indicated better performance of the PIT urban
female teachers. The null hypothesis is not accepted. (Table No.4.9.8)
70. Mean score of the responses of the head teachers regarding the performance
of PIT urban male teachers in the particular area i.e. Evaluation of the

271
taught lesson” ranged from 3.7 to 4.4 whereas of PIT urban female teachers
from 4.5 to 4.7. This revealed better performance of the PIT urban female
teachers. The null hypothesis is not accepted. (Table No.4.9.9)
71. Mean score of the responses of the head teachers regarding the overall
performance of the PIT Urban male teachers in the skill, “Assigning home
work to the students” ranged from 4.0 to 4.6 and that of PIT urban female
teachers from 4.1 to 4.7. The performance of PIT urban female teachers was
better than PIT urban male teachers. (Table No.4.9.10)
5.2.9 Comparison of the performance of PIT rural male teachers and PIT rural female teachers in their classrooms in view of data collected and tabulated through observation schedule.
72. Mean score of Rural PIT male teachers was from 3.4 to 4.3 whereas
meanscore of Rural PIT female teachers was from 3.0 to 4.0. This reflected
better performance of Rural PIT male teachers with respect to different
aspects of teaching skill, "Set Induction". The null hypothesis is not
accepted. (Table No.4.5.1)
73. Mean score of Rural PIT male teachers ranged from 3.1 to 4.3 whereas
mean score of Rural PIT female teachers ranged from 3.5 to 4.3 which
revealed performance of both the groups in the application of teaching
skill, “Presentation”. The null hypothesis is accepted. (Table No.4.5.2)
74. Mean score of Rural PIT male teachers was between 3.0 and 4.3 whereas
mean score of Rural PIT female teachers was between 3.2 and 4.3. There

272
was no difference in the performance of both the groups in the particular
area of “Questioning”. The null hypothesis is accepted. (Table No.4.5.3)
75. Mean score of Rural PIT male teachers was from 3.0 to 3. 9 whereas of
Rural PIT female teachers was from 3.3 to 4.0. This showed better
performance of Rural PIT female teachers with respect to application of
teaching skill "Listening". The null hypothesis is not accepted. (Table
No.4.5.4)
76. Mean score of Rural PIT male teachers ranged from 3.1 to 4.2, where as
mean score of Rural PIT female teachers ranged from 3.1 to 4.3. This
indicated better performance of Rural PIT female teachers with respect to
different aspects of teaching skill, "Motivation". The null hypothesis is not
accepted. (Table No.4.5.5)
77. Mean score of Rural PIT male teachers with respect to application of
teaching skill "Teacher's liveliness" was from 3.1 to 4.3 whereas the
meanscore of Rural PIT female teachers was from 3.0 to 4.3. This revealed
similar performance of both the groups. The null hypothesis is accepted.
(Table No.4.5.6
78. Mean score of Rural PIT male teachers ranged from 3.3 to 4.3 whereas the
meanscore of Rural PIT female teachers ranged from 2.9 to 4.2. This
reflected better performance of the Rural PIT male teachers in the particular
area of “Closure of lesson”. The null hypothesis is not accepted. (Table
No.4.5.7)

273
79. Mean score of Rural PIT male teacher was between 3.0 and 4.1. where as
the mean score of Rural PIT female teachers was between 3.1 and 3.8. This
revealed better performance of Rural PIT male teachers with respect to
application teaching skill “planning". The null hypothesis is not accepted.
(Table No.4.5.8)
5.2.10 Comparison of the comments of Head Teachers regarding the performance of PIT Rural male teachers and PIT Rural female teachers in view of data collected and tabulated through a questionnaire
80. Mean score of the comments of the Head teachers regarding the performance of PIT male Rural teachers was between 4.2 and 4.3 whereas of PIT rural female teachers between 4.0 and 4.4. This revealed better performance of the PIT rural male teachers in the particular area of “Command on the subject”. The null hypothesis is not accepted. (Table No. 4.10.1)
81. Mean score of the comments of the head teachers regarding the
performance of the PIT rural male teacher in particular area was 3.8
whereas the performance of PIT rural female teachers ranged from 3.8 to
4.2. This indicated better performance of female group in the particular
area of “Lesson Planning”. The null hypothesis is not accepted (Table
No.4.10.2)
82. Mean score of the comments of head teachers regarding the performance of
the PIT rural male teachers in the particular area i.e.
“Use of management skills in the class” was between 3.9 to 4.0 where as of
PIT rural female teachers from 3.7 to 4.3. This reflected better performance
of the PIT female teachers. The null hypothesis is not accepted. (Table No.
4.10.3)

274
83. Mean score of the comments of the head teachers regarding the
performance of the PIT male teachers in the particular area i.e. “ Use of A.
V aids” was 4.0 whereas of PIT female teachers was from 3.8 to 4.0. This
revealed no difference between the performances of both the groups. The
null hypothesis is accepted. (Table No. 4.10.4)
84. Mean score of the head teachers regarding the performance of PIT male
teachers in the particular area i.e. "Use of different teaching methods” was
between 3.9 and 4.0 whereas of female teachers from 3.8 to 4.4. This
indicated better performance of the PIT female teachers. The null
hypothesis is not accepted. (Table No.4.10.5)
85. Mean score of the responses of the head teachers regarding the overall
performance of the PIT male teachers in the particular area i.e. “ Use of
teaching kit” ranged from 3.9 to 4.1 whereas of PIT female teachers from
3.5 to 4.1. The performance of the both the group was similar. The null
hypothesis is accepted. (Table No.4.10.6 )
86. Mean score of the responses of the head teachers regarding the PIT rural
male teachers with respect to application of teaching skill i.e.
“Partial re-capitulation of the lesson” ranged from 4.1 to 4.3 whereas of
PIT female teachers from 3.8 to 4.5. This showed better performance of the
PIT rural female teachers. The null hypothesis is not accepted. (Table
No.4.10.7)
87. Mean score of the responses of the head teachers regarding the performance
of PIT rural male teachers in the area of, “Total re-capitulation of the

275
lesson” ranged from 4.1 to 4.4 whereas of PIT female teachers from 4.0 to
4.5. This reflected better performance of the PIT rural female teachers. The
null hypothesis is not accepted. (Table No.4.10.8)
88. Mean score of the responses of the head teachers regarding the performance
of PIT rural male teachers in the particular area i.e. “Evaluation of the
lesson” ranged from 4.2 to 4.5 whereas of PIT rural female teachers from
4.3 to 4.6. This indicated better performance of the PIT rural female
teachers. The null hypothesis is not accepted. (Table No. 4.10.9)
89. Mean score of the responses of the head teachers regarding the overall
performance of the PIT rural male teachers in the skill, “Assigning home
work to the students” ranged from 4.2 to 4.4 and that of female PIT rural
teachers from 4.3 to 4.4. Hence there seems to be no in the performance of
both the genders. The null hypothesis is not accepted. (Table No. 4.10.10)
5.2.10 Findings of the Comparison of the Teachers of all the groups as tabulated in table No. 4.1.1 to 4.5.8 and 4.6.1 to 4.10.10 by applying t test.
90. There is significant difference between the performance of PIT and NIT
teachers while applying eight selected teaching skills. The null hypothesis is
not accepted. (Table No.4.11.1)
91. There is no significant difference between the performance of PIT and NIT
teachers in view of their head comments while applying different
skills/teaching skills. The null hypothesis is accepted. (Table No.4.11.6)

276
92. There is no significant difference between the performance of PIT male and
PIT female teachers while applying eight selected teaching skills. The null
hypothesis is accepted ( Table No.4.11.2)
93. There is significant difference between the performance of PIT male and PIT
female teachers in view of their head comments while applying different
skills/teaching skills. The null hypotheses is not accepted. ( Table
No.4.11.7)
94. There is significant difference between the performance of PIT Urban and PIT
Rural teachers while applying eight selected teaching skills. The null
hypothesis is therefore not accepted. (Table No.4.11.3)
95. There is no significant difference between the performance of PIT urban
teachers and PIT rural teachers in view of their head comments while
applying different skills/teaching skills. The null hypothesis is accepted.
( Table No.4.11.8)
96. There is no significant difference between the performance of PIT urban male
and PIT urban female teachers while applying eight selected teaching skills.
The null hypothesis is accepted. (Table No.4.11.4 )
97. There is no significant difference between the performance of PIT Urban male
and PIT urban female teachers in view of their head comments while
applying different skills/teaching skills. The null hypothesis is accepted.
( Table No.4.11.9)

277
98. There is no significant difference between the performance of PIT rural male
and PIT rural female teachers while applying eight selected teaching skills.
The null hypothesis is accepted. ( Table No.4.11.5 )
99. There is no significant difference between the performance of PIT rural male
and PIT rural female teachers in view of their head comments while
applying different skills/teaching skills. The null hypothesis is accepted.
(Table No.4.11.10)
5.3 CONCLUSIONS
The following conclusions have been drawn on the basis of the findings of the
study.
Conclusions on the basis of 11 tables bearing serial No.4.1.1 to 4.11.10
1. Mean score of the performance of the PIT teachers in teaching skills,
“Set Induction”, “Presentation”, “Questioning”, “Listening”, “Motivation”,
“Teachers Liveliness”, “Closing of the Lesson” and “Planning” was higher
than NIT teachers. There was also a significant difference in the
performance of both the groups according to t test. This indicated that the
PIT teachers taught their assigned subjects according to the method they
learnt during their in-service training. (Findings Nos. 4.1.1 to 1.8, 4.11.1 )
2. Mean score of the performance of PIT teachers according to their
head’s views in the area of, “Command on the subject”, “Proper lesson
planning”, “Use of management skills in the class”, “Use of A.V Aids in the
class”, “Use of different teaching methods”, “Use of Teaching Kit”, “Partial

278
recapitulation of the lesson”, “Total re-capitulation of the lesson”,
“Evaluation of the taught lesson” and “Assigning home work to the
students” was higher than NIT teachers but t test revealed that this
difference was not significant. (Findings No.4.6.1 to 4.6.10, 4.11.2)
3. Mean score of the performance of the PIT male teachers in
comparison with PIT female teaches with respect to application of teaching
skills, “Set Induction”, “Listening”, “Motivation”, “Teachers Liveliness”
and “Planning” was on higher side but the application of t test revealed
that this different was not significant (Findings No. 4.2.1, 4.2.4 to 4.2.6,
4.2.8, 4.11.3 )
4. Mean score of the performance of the PIT male teachers and PIT
female teachers with respect to application of teaching skill, “Presentation”
and “Closing of the Lesson” reflected no difference. The performance of
both the genders in the application of these two teaching skills was same.
(Findings No. 4.2.2, 4.2.7)
5. Mean score of the performance of the PIT female teachers with
respect to teaching skill, “Questioning” was higher than male PIT male
teachers. (Findings No. 4.2.3)
6. Mean score of the performance of PIT male teachers in view of the
comments of their head teachers indicated that the performance of the PIT
male teachers with respect to "Command on the subject”, was higher than
PIT female teachers. (Findings No.4.7.1)
279
7. Mean score of the performance of the PIT female teachers with
respect to “Use of management skills in the class”, “Use of A.V aids”, “Use
of different teaching methods”, “Use of teaching kit”, “Partial re-
capitulation of the lesson”, “Total re-capitulation of the Lesson”,
“Evaluation of the taught lesson” and “Assigning home work to the
students” was higher than PIT male teachers. The application of t test
revealed that this difference was significant. (Findings No. 4.7.3 to 4.7.9,
4.11.4)
8. Mean score of the performance of both PIT male and female
teachers in view of their head teachers with respect to, “Lesson Planning “
and “Assigning home work to the students ”, was same. According to the
heads opinion, both the groups assigned homework to the students.
(Findings No 4.7.2, 4.7.10)
9. Mean score of the performance of the PIT rural teachers with respect
to performance of skill, “Set Induction”, "Presentation”, “Listening”,
“Motivation “, “Teacher liveliness” and “Closing of Lesson” was higher
than PIT urban teachers. The application of t test also indicated significant
difference in the performance of both the groups.(Findings No 4.3.1, 4.3.2,
4.3.4 to 4.3.7, 4.11.5)
10. Mean score of the performance of PIT urban teachers with respect to
application of teaching skill, “Questioning” was higher than PIT rural
teachers.(Findings No. 4.3.3)
11. The mean score of the performance of PIT urban teachers and PIT
rural teachers with respect to skill, “Planning” was same. (Findings No.
4.3.8)
12. Mean score of the performance of the PIT urban teachers in view of
their head teacher in the area of, “Command on the subject”, “Lesson

280
Planning”, “Use of management skills in the class”, “Use of A. V. Aids in
the class”, “Use of different teaching methods”, “Use of teaching kit”,
“Partial re-capitulation of the lesson” and “Assigning home work to the
students” was higher in comparison with PIT rural teachers. The
application of t test revealed no significant difference in the performance of
both the groups. (Findings No.5.7.1 to 5.7.7, 5.7.10, 4..11.6)
13. Mean score of the comments of the head teachers regarding the
performance of the PIT rural teachers and PIT urban teachers with respect
to “Total re-capitulation of the lesson” and “Evaluation of the taught
lesson” was same. It revealed that both the groups taught the lesson by
using the teaching skill in similar way. (Findings No. 5.7.8, 5.7.9)
14. Mean score of the performance of PIT Urban male teachers with
respect to application of teaching skills; “Set induction”, “Presentation”,
“Motivation”, “teachers Liveliness”, “Closing of lesson”, and “Planning”
was higher than PIT female teachers. The application of t test revealed that
this difference was not significant (Findings No. 4.4.1, 4.4.2, 4.4.5 to 4.4.7,
4.4.8, 4.11.7)
15. Mean score of the performance of PIT Urban male teachers and PIT
Urban female teachers with respect to application of teaching skill,
“Questioning” & “Listening” was same. ( Findings No. 4.4.3, 4.4.4)
16. Mean score of the performance of PIT Urban male teachers in view
of their heads opinions with respect to “Command on the subject” and
“Lesson planning” was better than PIT urban female teachers.(Findings
No.4.9.1, 4.9.2)

281
17. Mean score of the performance of PIT Urban female teachers in
view of their heads opinion with respect to application of skills, “Use of
management skills in class”, “Use of A.V Aids”, “Use of different teaching
methods”, “Use of teaching kit”, “Partial re-capitulation of the lesson”,
“Total re-capitulation of the lesson”, “Evaluation of the taught lesson” and
“Assigning home work to the students” was higher than PIT urban male
teachers. The application of t test indicated that this difference was not
significant. (Findings No. 4.9.3 to 4.9.10, 4.11.8)
18. Mean score of the performance of PIT rural male teachers with
respect to application of teaching skills; “ Set Induction”, “Closure of
lesson” and “Planning” was higher than PIT rural female teachers.
(Findings No. 4.5.1, 4.5.7, 4.5.8)
19. Mean score of the performance of PIT rural female teachers with
respect to application of teaching skills, “Listening” and “Motivation” was
higher than PIT rural male teachers. (Findings No.4.5.4, 4.5.5)
20. Mean score of the performance of PIT rural male and female
teachers with respect to application of teaching skills; “Presentation”,
“Questioning” and “ Teacher’s Liveliness” was the same ( Findings No.
4.5.2, 4.5.3, 4.5.6)
21. There was no significant difference in the performance of PIT rural
male and PIT rural female as per t –test ( Findings No 4.11.9 )
22. Mean score of the performance of PIT rural male teachers in view of
their head teacher’s opinion with respect to application of teaching skill,

282
“Command on the subject” was higher than PIT rural female teachers.
( Findings No.4.10.1)
23. Mean score of the performance of PIT rural female teachers in view
of comments of their head teachers with respect to application of teaching
skill “Proper lesson planning”, “Use of management skills in class”, “Use of
different teaching methods”, “Partial re-capitulation of the lesson”, “Total
re-capitulation of the lesson”, “Evaluation of the taught lesson” was higher
than PIT rural male teachers. The application of t test however revealed that
this difference was not significant ( Findings No. 4.10.2, 4.10.3, 4.10.5,
4.10.7 to 4.10.9, 4.11.10)
24. Mean score of the performance of PIT rural male teachers and PIT
rural female teachers in view of their head teacher opinion with respect to
application of teaching skill “Use of A.V Aids”, “Use of teaching kit” and
“Assigning home work to the students” was same. (Findings No. 4.10.4,
4.10.6, 4.10.10)
5.4 RECOMMENDATIONS
Keeping in view the findings and conclusions of the study, following
recommendations are given.
1. Findings of the study indicate positive result of in-service teacher
training programs especially in teaching methodology. It is, therefore,
recommended that in future, in-service teacher training programmes may be
based on selected teaching methodologies.

283
2. It has been observed that the results of the in-service teacher training
programmes are positive. Hence it is recommended that in-service teacher
training programmes may be continued in future. However, these programs
may be need- based.
3. In the research study eight teaching skills were selected and the
findings of the study have shown positive results in the development of
these skills. It is recommended that the future in-service trainers may select
more teaching skills for in-service teacher training programme.
4. It has been observed that the development of PIT rural teachers has
been more effective in the areas of, “Set Induction”, “Presentation”
“Listening”, “Motivation”, ‘Teacher Liveliness” and “Closing of Lesson”
during in-service training. This shows seriousness of the trainees from the
rural areas. It is, therefore recommended that special arrangements may be
made to ensure the commitment of the trainees during in-service training
programs. Some practical measures need to be developed to identify the
committed trainees and non-serious trainees need to be screened out within
the first few days of the training. This will also economize in-service
teacher training programme.
5. It has been observed that the trainees have improved with respect to
the following teaching skills during their in-service teacher training:
1. Set Induction 5. Teachers’ liveliness
2. Presentation 6. Motivation
3. Questioning 7. Closing of lesson
4. Listening 8. Planning
It is, therefore, recommended that future in-service training courses be re-
designed for the development of these teaching skills. It is also
recommended that the future researchers may investigate the factors leading

284
to effective development of these teaching skills so that the future in-service
programmes may be designed on the basis of these factors.
6. To see further effectiveness of the in-service teachers training programmes,
there is a need to see their impact on the students’ achievements. For this
purpose an independent study in this field is required. This will further help
in planning and organizing future in-service training programmes.
7. There may be a separate training package for head-teachers to run
administrative, academic and students’ affairs of the primary schools. This
may be decided at district level with the involvement of District Officer.
For this purpose some manuals may also be developed which may comprise
the guidelines in the above areas.
STRATEGY FOR FUTURE
1. In future only committed teachers may be nominated for in-service
teacher training programme. This will be helpful in getting positive
results of the in-service programmes.
2. The in-service training programmes may be arranged for a
handsome period. Preferably the duration of such in-service
programmes may be at least 15 days. The training programme may
be launched in the summer and winter vacations in different areas of
the country.
3. There is a need of continuous testing of the performance of the
trainees during in-service teachers training programme so that the
trainees may get proper training and resources are utilized
effectively.

285
4. After the completion of the training cycle, the performance of the
trainees may be monitored continuously by the trained supervisors.
This will help in getting positive results of their training.
5. The Government may provide funds for future training programmes
continuously with the provision of some incentives in shape of
increments, award or other monetary benefits in recognition of those
who improve their teaching with respect to different teaching skills.
6. The future in-service training programmes may be further
decentralized. A separate training cell under the supervision of a
District Education Officer may be constituted for the purpose. The
cell may be assigned the task of teacher training with a mechanism
to work regularly for the expansion of the in-service teacher training
programmes.
7. The system for the nomination of the primary teachers for in-service
training programme may be improved by involving their head
teachers and respective District Education Officers.
8. Different in-service teacher training programmmes may be
integrated in order to utilize the resources efficiently and to achieve
the objectives in a better way. For this purpose, different donor
agencies and Federal or Provincial Government, may coordinate
their efforts to initiate such in-service training programmes.

286
BIBLIOGRAPHY
Aggarwal, J. C. (1990). Development and Planning of Model Education, Vikas Publishing, Delhi.
AIOU, (1991). PC-I New PTOC Project, (unpublished ) Islamabad
Ali S. A & H. S (1979). Crisis in Muslim Education, King Abdul Aziz University, Jeddah.
Anderson, L. W.(1987). Affective Teacher Education- the International Encyclopedia of Teacher Education, Pergamon Press Inc. USA.
Bolam, R.(1980). In-service Education and Training of Teacher and Education, Final Report of CERI Projects on INSET (OECD), Paris.
Bukhari, T.A. (2002). Development of a Model for in-service training of teachers in Pakistan, University Institute of Education Research, Rawalpindi.
Childress, R. J. (1982). In-service Education of Teachers, Encyclopedia of Educational Research, Fourth Edition, Boston University, 1982
Dave, R.H.(1978). Life long education and the training of teachers - developing a curriculum for teacher education on the basis of the principals of life long education, UNESCO, Institute for education, Oxford.
Department of Education and Science Oxford University,(1992) Press Release, U.K.
Dunkin, J. M.(1987). The International Encyclopedia of Teaching and Teacher Education, University of Sydney, Australia Pergamon Press, Oxford.
Erant, M. (1988). In-service Teacher Education, The International Encyclopedia of Teaching and Teacher Education in Michael J. Dunkin (Ed). the University of Sydney.
Farooq, R. A. (1993). Education System in Pakistan, Issues and Problems, Asia Society for Promotion of Innovative and Reforms in Pakistan, Islamabad.
Fazalur Rehman, (1947). All Pakistan Educational Conference, Karachi.
Gay, L.R. (2000). Educational Research Competencies for Analysis and Application, 5th
Ed. Islamabad: National Book Foundation.
Goraha, M. A. (1981). Aims, Goals and objectives of Education (Basic Concepts of Educational Planning), vol-1 AIOU.

287
Government of Pakistan, Ministry of Education, (1972). Education Policy, 1972, Islamabad.
Government of Pakistan, Ministry of Education, (1979). National Education Policy, 1979, Islamabad.
Government of Pakistan, Ministry of Education, (1979). National Education Policy and Implementation Programme, Islamabad.
Government of Pakistan, Ministry of Education, (1989). National Education Conference, Islamabad.
Government of Pakistan, Ministry of Education, (1992). National Education Policy, Islamabad.
Government of Pakistan, Ministry of Education, (1998). National Education Policy, 1998-2010, Islamabad.
Government of Pakistan, Ministry of Education. (1959). Commission on National Education, Karachi.
Government of Pakistan, Ministry of Finance, (2000). Economic Survey of Pakistan 2001-2002, Islamabad.
Government of Pakistan, Ministry of Interior (Education Division) (1951). Proceedings of the All Pakistan Educational Conference, 1947,Karachi.
Government of Pakistan, Planning Commission, (1983). The Sixth Five Year Plan, 1983-88, Islamabad.
Government of Pakistan, Planning Commission, (1988). Seventh Five Year Plan 1988-93, Islamabad.
Government of Pakistan, Planning Commission, (1993). Eighth Five Year Plan 1993-98, Islamabad.
Gupta, S.M.(1997). Teacher Education in the Changing Scenario, A. P .H Publishing Corporation, New Delhi.
Guruge, A.W.P (1981) Economics Consideration in Educational Planning, AIOU, Islamabad.
Hashmi N. (1998 ).Effectiveness of N-PTOC Programme of AIOU, Islamabad.
Iqbal M. Z.(1996). Teacher Training in the Islamic Perspective, Institute of Policy Studies and International Institute of Islamic Thought, Islamabad.

288
Jaffer, N.(1990). Problems of Education in Pakistan, Royal Book Company, Karachi.
Khan,R.(2003)."Effectiveness of PEP-ILE, Programme in Tehsil Swabi", Islamabad.
Khurshid, M. (1998). Effectiveness of New PTOC Training on the class room performance of female school teachers in Rawalpindi Division, AIOU. Islamabad
Lawton, D. (1986). School curriculum planning, Hodder and stoughton, London.
Letson, T. W. (1971). Encyclopedia of Education, Deighton, Lee C., Vol.9, Macmillan Co and the Free Press, Crowell-Callier Educational Corporation.
Haq, Mehboobul. (1970). Annual Planning in Pakistan, Journal of Development Planning No.2, Islamabad.
Mehmood, K. (1999). Effectiveness of in-service training imparted through Teachers Training Project, AIOU, Islamabad.
Mohn, J.R, (1992). Effectiveness of Teacher Training Programmes, Ph.D Edu, ANMOL Publication, New Delhi.
Pakistan Education Foundation.(2000). Un-published document, Islamabad.
Project, N-PTOC AIOU.(2001). Efeciveness of N-PTOC of AIOU, Islamabad.
Rohidekar S.R. (1997). Reorganization of Teacher Education, A.P.H. Publishing Corporation New Delhi.
Ryan. Y, (1994). Quality in Postgraduate Education, Kogan Page, London.
Satti, Z. H. (1998). A study of the effectiveness of N-PTOC in District Haripur, N.W.F.P, University of ARID, Rawalpindi.
Semiotics (Pvt.)Limited.(1999). Study of the Effectiveness of In-service Training Programs offered to Primary School Teachers in N.W.F.P, Islamabad.
Shah, M H. (2001). Impact of PEP-ILE Inputs on Children’s, Peshawar.
Sharif, H.M. (1965). A proposed programme of in-service education for teaching with special reference to improving the teaching language Arts in the Primary Schools of Pakistan, Graduate School of Indiana University.
Sharon F.R and Gretchen B. R. (1995). Dynamic Teachers—Leaders of Change, Corwin Press Inc. California.
289
Siddiqui M. A.(1991). In-Service of Proximal Development for Learning and Teaching, Ashish Publication House, New Delhi.
Siddiqui, S A. (1982). Foreword to Economics and Financing of Education, AIOU.
Islamabad.
Singh S.A.(1980). Critical Study of the Programmes of the Pre-service and In-service Education of Teachers of Higher Education in India, Ph.D Edu.MSU, Baroda.
Sinha, P.(1982). An Evaluative Study of Teacher Education in Bihar Ph.D Edu, Pat, New Delhi.
Zaki, W.M. (1969). Educational Development in Pakistan, West Pakistan Publishers Co. LTD., Islamabad.

290
Appendix “A”
LIST OF SCHOOLS OF DISTRICT ABBOTTABAD
WHERE THE CLASS TEACHING WAS OBSERVED
IN ONE OR MORE GROUPS
1. Govt. Boys Primary School (boys) Banda Qazi Abbottabad (two groups)
2. Govt. Boys Primary School (Boys) Jhangi, Abbotttabad (three groups)
3. Govt. Boys Primary School (Boys) Lamba Banda, Abbottabad (two groups)
4. Govt. Boys Primary School No.4 Abbottabad (two groups)
5. Govt. Boys Primry School Zafar Mara Abbottabad
5. Govt. Boys Primary School Kunj Qadeem, Abbottabad
6. Govt. Boys Primary School Zafar Maidan, Abbottabad
7. Govt. Boys Primary School upper Kunj, Abbottabad
8. Govt. Boys Primary School, Sheikhul Bandi, Abbottabad
9. Govt. Girls Primary School Jamia, Abbottabad
10. Govt. Girls Primary School Kunj, Abbottabad (two groups)
11. Govt. Girls Primary School City, Abbottabad
12. Govt. Girls Primary School Sir Syed Colony, Mandian
13. Govt. Girls Primary School No.1 Nawashehr Abbottabad (three groups)
14. Govt. Girls Primary School No. 2 Nawashehr Abbottabad
15. Govt. Girls Primary School No. 3 Nawashehr Abbottabad (two groups)
16. Govt. Girls Primary School Mera Muzaffar, Abbottabad
17. Govt. Girls Primary School No.4 Nawashehr Abbottabad (two groups)

291
LIST OF SCHOOLS OF DISTRICT HARIPUR
WHERE THE CLASS TEACHING WAS OBSERVED
IN ONE OR MORE GROUPS
1. Govt. Boys Primary School, Pandak, Haripur (two groups)
2. Govt. Boys Model primary School Haripur (two groups)
3. Govt. Boys School No.3, Haripur (two groups)
4. Govt. Boys Primary School Mang, Haripur
5. Govt. Boys Primary School Galham, Haripur (two groups)
7. Govt. Boys Primary School No.1 Haripur
8. Govt. Primary School Sarya, Haripur (four groups)
9. Govt. Girls Primary School No.2 Haripur (two groups)
10. Govt. Girls Primary School Darwesh Haripur (three groups)
11. Govt. Girls Primary School No. 1 Haripur
12. Govt. Girls Primary School Pandak, Haripur (two groups)
13. Govt. Girls Primary School Pind Munim,Haripur
14. Govt. Girls Primary School Pind Kamal Khan (three groups)
15. Govt. Boys Primary School Galham, Haripur
16. Govt. Girls Primary School, Mang, Haripur (two groups)

292
LIST OF SCHOOLS OF DISTRICT MANSEHRA
WHERE THE CLASS TEACHING WAS OBSERVED
IN ONE OR MORE GROUPS
1. Govt. Boys Primary School Kalgan, Mansehra
2. Govt. Boys Primary School Labarkot, Mansehra (two groups)
3. Govt. Boys Primary School Dara, Mansehra
4. Govt. Boys Primary School No. 1 Mansehra
5. Govt. Boys primary School Jabri Mansehra (two groups)
6. Govt. Boys Primary School Hassanpur, Mansehra
7. Govt. Boys Primary School Malikpur, Mansehra
8. Govt. Boys Primary School, Sherpur, Mansehra
9. Govt. Boys Primary School, Kotka, Mansehra
10. Govt. Boys Primary School, Gandhian, Mansehra (two groups)
11. Govt. Boys Primary School Trangri Pain, Mansehra
12. Govt. Girls Primary School No.1 Mansehra City
13. Govt. Girls Primary School No.2 Mufti Abad, Mansehra.
14. Govt. Girls Primary Jabri, Mansehra (two groups)
15. Govt. Girls Primary School Dab No.2 Mansehra
16. Govt. Girls Primary School Dab No.1 Mansehra (two groups)
17. Govt. Girls Primary School Naugazi Mansehra (three groups)
18. Govt. Girls Primary School Labour kot Manashra (two groups)
20. Govt. Girls Primary School College Doraha, Mansehra

293
LIST OF SCHOOLS OF DISTRICT BATTAGRAM
WHERE THE CLASS TEACHING WAS OBSERVED
IN ONE OR MORE GROUPS
1. Govt. Boys Primary School Garoli Bazar, Battagram
2. Govt. Boys Primary School Rasool Khan Colony, Battagram
3. Govt. Boys Primary School, Colony, Battagram
4. Govt. Boys Primary School, Battagram
5. Govt. Boys Primary School Batarkol Battagram
6. Govt. Boys Primary School Kakar Chang, Battagram
7. Govt. Boys primary School Kandoli Chapar gram Battagram
8. Govt. Boys Primary School Phagora Battagram
9. Govt. Boys Primary School Sultan abad Battagram
10. Govt. Boys Primary School Arghshora, Battagram
11. Govt. Girls Primary School Chapargram, Battagram
12. Govt. Girls Primary School Battagram
13. Govt. Girls Primary School Phagora, Battagram
14. Govt. Girls Primary School Kamargali, Battagram
15. Govt. Girls Primary School Madan Pain, Battagram
16. Govt. Girls Primary School Kakarchang, Battagram
17. Govt. Girls Primary School Jaupao Battagram
18. Govt. Girls Primary School Arghshori, Battagram
19. Govt. Girls Primary School Sandasur Qasim Khan Battagram
20. Govt. Girls Primary School Kas Mohammad tahir, Battagram

294

295

296

297
Appendix “D”
RESEARCH ASSOCIATE PROFILE
1. Mr. Imtiaz Ali, SET, Government Boys High School Mang, Haripur
2. Mr. Shahid Mehmood Raja, SET Government Boys Middle School, Galam pind
Haripur
3. Mr. Nadeem Sultan Qazi, SET Govt. Boys High School No.2, Abbottabad
4. Mrs. Razia Sultana, Principle, Government Ghirls High School No.1 Abbottabad
5. Mr. Anwar khurshid, Assistant District Officers ( Schools) Mansehra
6. Abdul Latif,SET & Head master Government Boys Middle School Labour Kot
Mansehra.
7. Mrs. Alia Khurshid, SET Govt Girls School No.1 Mansehra
8. Mr. Noor Habib, SET Government Boys High School Battagram
9. Mr. Fida Muhammad Khan, Assistant District Officer, Battagram
10. S. Manzoor Hussain Shah, Lecturer, AIOU

298
Appendix “E”
ARID & AGRICULTURE UNIVERSITY, RAWALPINDI
Dated 2.6.2003
Subject:- CLASS-ROOM PERFORMANCE OF PTC TEACHERS
A research study ‘Comparative study of the trained primary teachers with &
without in-service primary teachers & to develop a strategy for future’ has been planned by
S.Manzoor Hussain Shah a student of M.Phil programme of Allama Iqbal Open
University.
The researcher has to observe the performance of some of PTC teachers
with & without in-service of your district. For this purpose the researcher has to visit
various schools of your district.
It will be appreciated if the researcher is allowed to observe the class-room
teaching of above mentioned teachers for his research purpose.
Thanking you in anticipation
Yours sincerely,
Sd/
Dr. R.A.Farooq
Thesis Adviser,
ARID Agriculture, Rawalpindi
The Executive District Officer,
Haripur, Abbottabad, Mansehra, Battagram Districts

299