Embed Size (px)
Citation preview

Comparative study of Electoral Systems and their Features
Intern with Lok Satta Hy
Petr Návrat, - Foundation for Democratic Reforms derabad, 2003

2
Table of Contents Index of Tables................................................................................................................3 Introduction......................................................................................................................4 1. Electoral Systems Across the World ........................................................................5
1.1 Electoral System and Its Properties ..................................................................5 1.2 The Importance of ES .......................................................................................6 1.3 Plurality-Majority Systems (PM) ........................................................................6
1.3.1 First Past The Post (FPTP) ........................................................................7 1.3.2 Block Vote (BV)..........................................................................................8 1.3.3 Party Block Vote (PB) ................................................................................8 1.3.4 Alternative Vote..........................................................................................8 1.3.5 Two Round Systems (TRS) .......................................................................9
1.4 Semi –Proportional Systems ...........................................................................10 1.4.1 The Single Non-Transferable Vote (SNTV)..............................................10 1.4.2 Parallel Systems ......................................................................................11
1.5 Proportional Representation Systems.............................................................12 1.5.1 List PR .....................................................................................................16 1.5.2 Mixed Member Proportional .....................................................................18 1.5.3 Single Transferable Vote (STV) ...............................................................19
1.6 Westminster vs. Proportional Model................................................................19 2. Electoral Engineering .............................................................................................24
2.1 Mathematic Formulas......................................................................................24 2.1.1 Method of Largest Remainders................................................................25 2.1.2 Method of Highest Averages....................................................................27
2.2 Comparison of Mathematic formulas and the impact of District Magnitude.....29 3. Case Studies of Countries with MMP .....................................................................31
3.1 German Electoral System ...............................................................................31 3.1.1 Historical Development ............................................................................31 3.1.2 System description...................................................................................32 3.1.3 Electoral Threshold and Party System.....................................................33 3.1.4 Constituencies and their delimitation........................................................34 3.1.5 Electoral Bodies .......................................................................................34
3.2 Hungary...........................................................................................................35 3.2.1 System Description ..................................................................................35 3.2.2 Constituencies and nomination of candidates..........................................36
3.3 Electoral reform in Mexico...............................................................................37 3.3.1 System Description ..................................................................................37 3.3.2 Electoral Threshold ..................................................................................38 3.3.3 Constituencies and their delimitation........................................................38 3.3.4 Electoral Bodies .......................................................................................38
3.4 The Electoral Reform in New Zealand.............................................................38 3.4.1 Ten Years of Electoral Reform.................................................................38 3.4.2 System Description ..................................................................................39 3.4.3 Electoral Threshold ..................................................................................40 3.4.4 Reform results..........................................................................................40
Appendix A. Measures of Disproportionality.................................................................41 Bibliography:..................................................................................................................43

3
INDEX OF TABLES
Electoral systems’ overview.............................................................................................5 Table 1.1 Features of Westminster formula.....................................................................7 Table 1.2 Features of Block Vote formula .......................................................................8 Table 1.3 Features of Party Block Vote System ..............................................................8 Table 1.4 Features of Alternative Vote System ...............................................................9 Table 1.5 the Features of Two-Rounds System ..............................................................9 Table 1.6 Features of the System of Single Non-Transferable Vote..............................10 Table 1.7 Examples of Parallel Systems (as in 1997) ...................................................11 Table 1.8 Features of Parallel System...........................................................................11 Table 1.9 Examples of Lijphart’s Effective Threshold, (source: Lijphart, 1994) .............13 Table 1.10 Difference in seat distribution between one-tier and two-tier system...........14 Table 1.11 Features of PR list .......................................................................................17 Table 1.12 MMP Systems (as in 1997)..........................................................................18 Table 1.14 Features of the System of Single Transferable Vote ...................................19 Table 1.15 The effects of electoral formulas on disproportionality and party systems...20 Table 2.5 Effective threshold according to district magnitude........................................29 Table 2.6 The disproportionality of mathematic formulas ..............................................29 Table 3.1 Parties represented in Bundestag in 1949, 1957,1980 and 2002 ..................33 Table 3.2 Election Results from New Zealand, October 1996 .......................................40 Table 3.3 Election results from the last FPTP election in New Zealand in 1993............40

4
INTRODUCTION
This study should give the reader clear picture of the types of electoral systems in general, with a detailed insight into the mixed member proportional systems. However, as it was written for the needs of the Indian Foundation for Democratic Reforms Lok Satta its content and structure, in the second and especially in the third part, is design to meet the needs of this organization. In the first part of my study, I tried to give a true picture of each of the electoral system and depict their advantages and disadvantages. I also mention the geographic area, in which is each system used, to show a certain geographical correlation of electoral systems. The watchful reader will notice certain disparity between the comments on Majoritarian formula and the PR formulas. It is not only because the PR formulas are more complex, but also because my goal is to explain PR systems to the Indian PR untouched readers. After the description of each of nine electoral systems, I tried to compare them using abstract measures like the average disproportionality, number of effective parties and the frequency of manufactured majority. The second part is devoted to electoral engineering and I decided to show how a change of mathematic formula or district magnitude could influence the seat distribution. I consider these observations for the most important part of this comparison. I hope, they will help Lok Satta in designing the new Indian electoral law. The case studies of the last part reflect countries that employ the Mixed Member Proportional system. This was not chosen accidentally. As Lok Satta considers the MMP as the most suitable system for Indian conditions, I tried to bring an insight of how this formula works under different circumstances. Each of the four countries is in a different situation. Germany implemented MMP more than 50 years ago, Hungary is a post communist country, Mexico combines its MMP with a presidential type of government and finally New Zealand can be a good example of a thorough electoral reform. Last, but not least I would like to thank the Lok Satta kind librarian Nisar Fathima, for having the patience with me and for her help in searching for study materials. I would also like to thank Karthik Bharadwaj, who corrected the first two parts of my study. I am very grateful to the whole Lok Satta team, for making my stay in their office an enjoyable one.
Petr Návrat, 2003

5
1. ELECTORAL SYSTEMS ACROSS THE WORLD
1.1 ELECTORAL SYSTEM AND ITS PROPERTIES
With the growth of communities and the professionalization of governance, it became almost impossible to maintain the model of direct democracy. Except for very small communities, we understand democracy as a representative democracy, which does not automatically exclude the possibility to apply some tools of direct democracy especially for important national decisions. In representative democracy the members of the society vote their representatives, who make everyday decisions, but also crucial legislative changes with an impact on the future of the whole nation. Each representative democracy needs an Electoral system, which determines the procedure of electing peoples representatives. Electoral system can be defined as set of methods for translating the citizen’s votes into representatives’ seats1. Generally, political science categorizes electoral systems according to four variables, which have major impact on the final distribution of cast votes2. The electoral formula represents the essence of each electoral system. This is the reason why many authors limit their description of electoral system only on the electoral formula, which then becomes a synonym for a broader term of electoral system. The most common way to categorize electoral systems is to look at them according to how much proportional they are - how they translate the number of votes cast to the number of gained seats. For this study I adopted the model of electoral systems used by A. Reynolds and B. Reilly3, which presents three broad families accommodating together nine main electoral systems.
Electoral systems’ overview
Secondly, the district magnitude – the number of representatives to be elected in one constituency - is the key variable for proportionality of the PR system. Later in my study I will
1 Lijphart, A.; Electoral System and Party System: A study of Twenty-Seven Democracies, 1945-1990, Oxford University Press, New York, 1994 2 For this time we will exclude from other properties which influence the final result; the ballot structure, apparentement, district boundaries, registration of candidates etc. 3However in their terminology they use the term electoral system instead of electoral formula ; Reynolds, A., Reilly, B., Electoral system Design, International Institute for Democracy and Electoral Assistance, Stockholm, 1997

6
show, how the districts with less elected representatives favour the larger parties leaving smaller parties underrepresented. The two other variables distinguish particularly the national electoral systems among each other within one of the nine main electoral formulas. The electoral threshold is the minimum level of support a party needs in order to gain representation. This legal limitation is set either on national, regional or district level. The most common is the limitation in the way of minimum percentage of gained votes (i.e. Netherlands 0.67% on national level, Germany 5% on federal level Landesliste etc.), other way is to set the legal threshold nominally; for instance the political subject must gain a certain number of representatives in single-member constituencies. (Germany 3 members, see chapter 4.1.3). The most problematic way is to set the threshold as a minimum number of gained votes by one party. The last of my four variables assembly size - the total number of seats in legislature - is “generally neglected”4. And together with Lijphart I can not miss out, “that if electoral systems are defined as methods of translating votes into seats, the total number of seats available for this translation appears to be an integral and legitimate part of the system of translation”5. It is definitely difficult to achieve proportionality if five parties compete for around two dozens seats in the European Parliament as it is the case in many European mid-size countries
1.2 THE IMPORTANCE OF ES
Electoral system is the fundamental element of every representative democracy. Despite its crucial importance in the system of constitutional institutions, it was in many cases subject of accidental choice. Electoral system shapes the rules of the game among political parties and individuals and can affect who is elected and which party gains the power. It also influences both the party system and the internal structure and cohesion of parties. I will discuses these properties using case studies in the second part devoted to the tools of electoral engineering. It has been discovered that electoral systems determine the broader political culture, the way in which political parties and their representatives behave. It may encourage parties for further cooperation and forging of alliances or it can also tend to deepen the animosity among separate social groups within the society. The decision of the right electoral system for the country has an impact on the turnout at the election, and it is not only in the case of disillusioned voters, whose vote will be wasted due to disproportionality, but also in the case of too complicated electoral system which is unclear for an average voter.
1.3 PLURALITY-MAJORITY SYSTEMS (PM)
The almost universal distinguishing feature for the first broad family of electoral systems is the necessity of majority of votes for representation. There is usually one candidate from each party competing for one seat. The winner is the candidate with the most votes, and he usually does not have to gain the absolute majority. The wining party bases its support on the biggest minority among the voters. As PM systems are inherently unfavourable for small minority parties, there is no need for legal threshold. The only exception is the threshold for first round in the two-round system as applied in France.
4 Lijphart, 1994, p. 12 5 Lijphart, 1994, p. 12

7
1.3.1 First Past The Post (FPTP) First past the post system is also, called the Westminster model as it originates in the political culture of United Kingdom. Thanks to the magnitude of the former British Empire it is now the most spread system in the world with almost two billion people casting their votes for assemblies in 68 countries. Besides the established democracies of United States, Canada and India (which makes more then half of the total population in FPTP), it is used in dozen Caribbean nations; many island states in the Pacific and mostly former British colonies in Asia (Pakistan, Bangladesh, Nepal, Malaysia) and 18 countries in Africa. The basic principle of FPTP is that the winner is the candidate with the plurality - relative majority - of all valid votes. Connecting this with the second important feature, single-member district, FPTP is the least proportional formula leaving usually more than 50% of cast votes unrepresented. On the other hand it is praised for its ability to form a one-party majority government, which does not have to seek for support and built coalition. While this is the standard in the western democracies, in many of the developing countries with diverse societies and multi party system (for instance in India) the wining party without parliamentarian majority has to look for coalition partners. In general, FPTP leads to disproportional representation, majority of wasted votes and elimination of minorities and women candidates. I am quoting the most discussed characteristics of Westminster model in the overview table below. Table 1.1 Features of Westminster formula
Advantages Disadvantages
• Simplicity • Disproportional
• Geographic accountability of representatives
• Excludes minority parties from representation
• Stable one party governments • Usually creates two-parties system, which may be not very much transparent
• No need for coalition bargaining with minority parties
• Difficult for new parties to enter the parliament
• Coherent parliamentary opposition • Less women in Parliament
• Can encourage parties to encompass diverse array of candidates according to regional variety of the country
• Usually less space for candidates from minority groups, which are spread across the country
• Excludes minor extremist parties from parliamentary representation
• Leaving a large number of “wasted votes” - not distributed to the candidates, can tend to disillusion and anti-system action from long - time outsiders
• Voters choose between candidates rather than parties
• Insensitive to swings in public opinion, decline of votes for ruling party does not change the situation as far as the party gains plurality of votes
• Scope for popular independent candidates
• Susceptible to boundary manipulation

8
Effective Threshold approx. 35%
1.3.2 Block Vote (BV) Block Vote can be described as the FPTP system in multimember districts. Every voter has as many votes as there are seats to be filled in his district. They are usually free to vote for party candidates regardless of their party affiliation. The candidates with the most votes are elected. The larger the district magnitude is, the more proportional the results could be. But the opposite outcome would appear; if voters cast all their votes only for candidates of their favourite party. This electoral formula is contemporary used in Philippines, Laos, Kuwait, Palestinian Authority and some small island states. (The Indian election parliamentary elections of 1952 and 1957 can be also characterized as bloc vote, as there were two member constituencies. ) Table 1.2 Features of Block Vote formula
1.3.3 Party Block Vote (PB) Party Block Vote is a majority-plurality electoral system, under which voters have in most cases only one vote and the party wining most votes takes all the seats in the district and it’s entire list of candidates is elected. The Party Block Vote is used to secure representation of ethnical minorities. In Lebanon, for example, each party list must be comprised of a mix of candidates from different ethnic group. This system is used in six countries: Senegal, Djibouti, Tunisia, Singapore, Ecuador, and Lebanon. Table 1.3 Features of Party Block Vote System
Advantages Disadvantages
• Encourages parties to form ethically diverse lists of candidates
• Super-disproportional results
• Ensures balance in ethical representation
• Voters can not vote for individuals
• Simplicity • • Encourages strong parties with mixed
candidates •
• Effective Threshold • approx. 35%
1.3.4 Alternative Vote At present, alternative vote is used only in two countries, Australia and the Nauru Island, probably due to its complicated procedure. Voters rank the candidates usually for single-member districts, they mark “1” their most favourites candidate and then “2” second favourite etc., expressing their preferences to as many candidates as there are on the ballot (that is why it is also called “preferential voting”). It is pure majoritarian formula, as the absolute majority of preferences is needed to gain the seat. Candidate with absolute majority of votes is immediately
Advantages Disadvantages
• Voters can choose individual candidates
• If electors cast their votes predominantly for one party it tends to more disproportional representation than FPTP
• Strengthening the coherent parties with organizational abilities
•
9
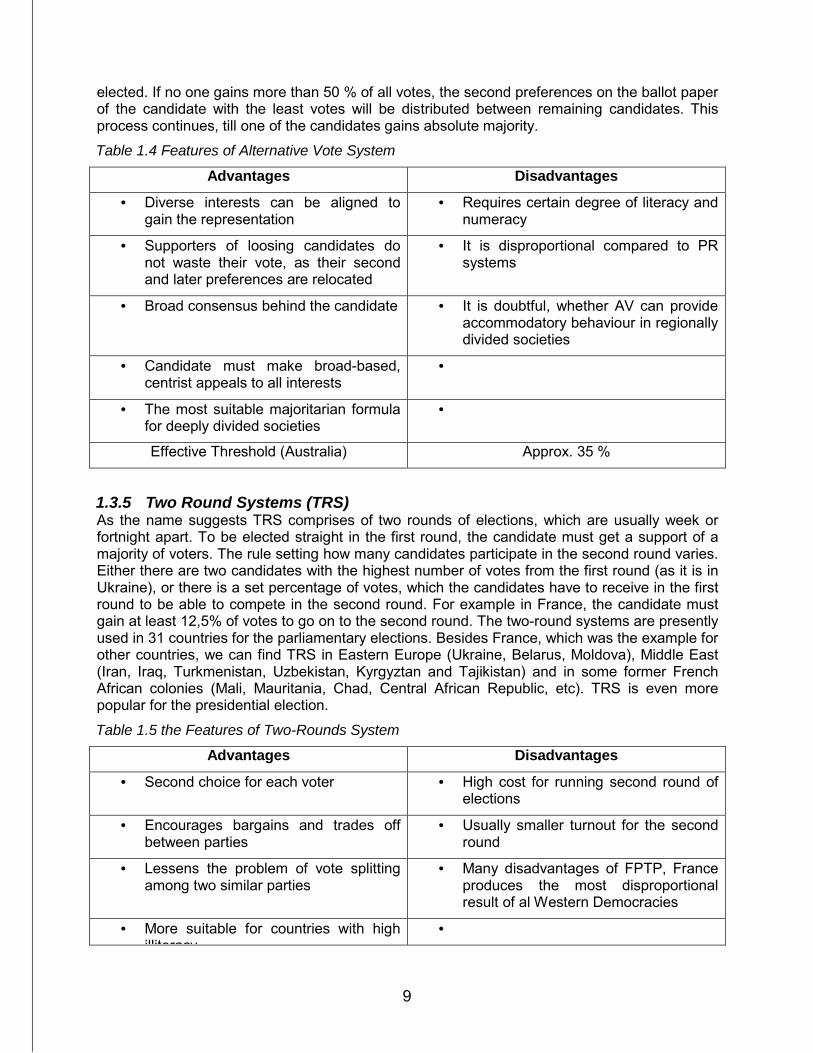
elected. If no one gains more than 50 % of all votes, the second preferences on the ballot paper of the candidate with the least votes will be distributed between remaining candidates. This process continues, till one of the candidates gains absolute majority. Table 1.4 Features of Alternative Vote System
Advantages Disadvantages
• Diverse interests can be aligned to gain the representation
• Requires certain degree of literacy and numeracy
• Supporters of loosing candidates do not waste their vote, as their second and later preferences are relocated
• It is disproportional compared to PR systems
• Broad consensus behind the candidate • It is doubtful, whether AV can provide accommodatory behaviour in regionally divided societies
• Candidate must make broad-based, centrist appeals to all interests
•
• The most suitable majoritarian formula for deeply divided societies
•
Effective Threshold (Australia) Approx. 35 %
1.3.5 Two Round Systems (TRS) As the name suggests TRS comprises of two rounds of elections, which are usually week or fortnight apart. To be elected straight in the first round, the candidate must get a support of a majority of voters. The rule setting how many candidates participate in the second round varies. Either there are two candidates with the highest number of votes from the first round (as it is in Ukraine), or there is a set percentage of votes, which the candidates have to receive in the first round to be able to compete in the second round. For example in France, the candidate must gain at least 12,5% of votes to go on to the second round. The two-round systems are presently used in 31 countries for the parliamentary elections. Besides France, which was the example for other countries, we can find TRS in Eastern Europe (Ukraine, Belarus, Moldova), Middle East (Iran, Iraq, Turkmenistan, Uzbekistan, Kyrgyztan and Tajikistan) and in some former French African colonies (Mali, Mauritania, Chad, Central African Republic, etc). TRS is even more popular for the presidential election. Table 1.5 the Features of Two-Rounds System
Advantages Disadvantages
• Second choice for each voter • High cost for running second round of elections
• Encourages bargains and trades off between parties
• Usually smaller turnout for the second round
• Lessens the problem of vote splitting among two similar parties
• Many disadvantages of FPTP, France produces the most disproportional result of al Western Democracies
• More suitable for countries with high illiteracy
•
10
illiteracy
Effective Threshold (France) Approx. 35 %
1.4 SEMI –PROPORTIONAL SYSTEMS
The family of semi-proportional formulas is the family of orphan system, which come under neither Westminster model nor Proportional Representation. This family contains two further groups: Parallel System and The Single Non-Transferable Vote (SNTV).
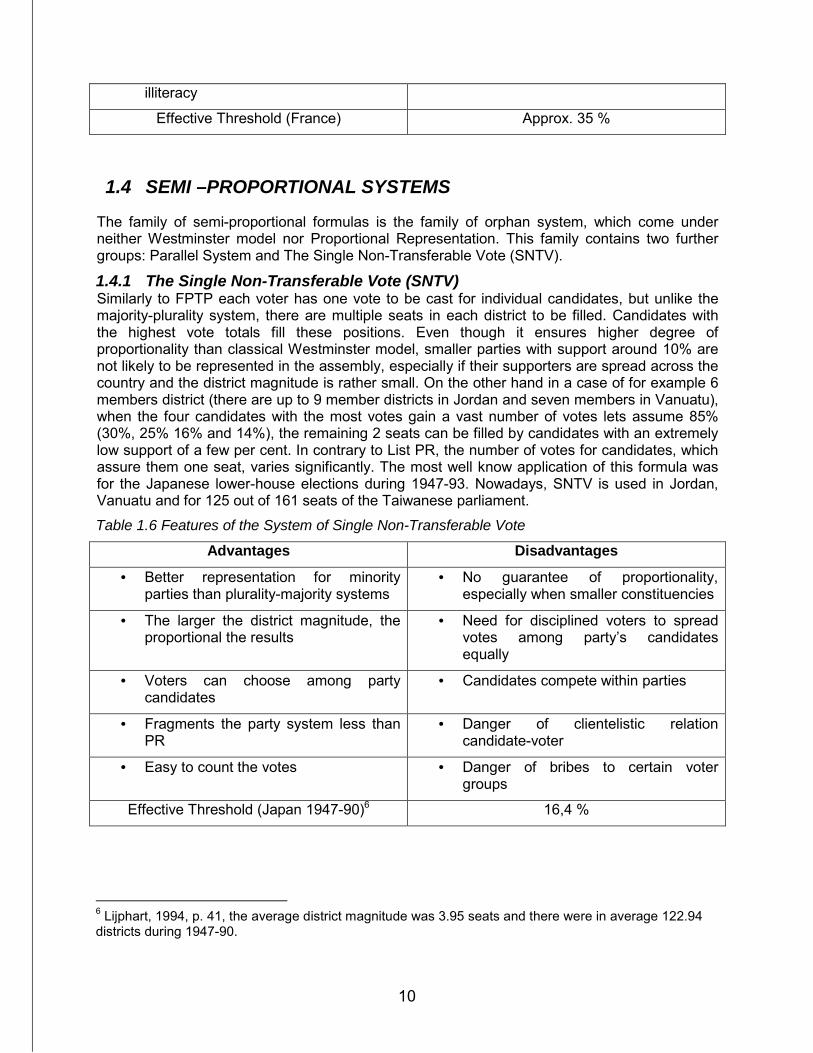
1.4.1 The Single Non-Transferable Vote (SNTV) Similarly to FPTP each voter has one vote to be cast for individual candidates, but unlike the majority-plurality system, there are multiple seats in each district to be filled. Candidates with the highest vote totals fill these positions. Even though it ensures higher degree of proportionality than classical Westminster model, smaller parties with support around 10% are not likely to be represented in the assembly, especially if their supporters are spread across the country and the district magnitude is rather small. On the other hand in a case of for example 6 members district (there are up to 9 member districts in Jordan and seven members in Vanuatu), when the four candidates with the most votes gain a vast number of votes lets assume 85% (30%, 25% 16% and 14%), the remaining 2 seats can be filled by candidates with an extremely low support of a few per cent. In contrary to List PR, the number of votes for candidates, which assure them one seat, varies significantly. The most well know application of this formula was for the Japanese lower-house elections during 1947-93. Nowadays, SNTV is used in Jordan, Vanuatu and for 125 out of 161 seats of the Taiwanese parliament. Table 1.6 Features of the System of Single Non-Transferable Vote
Advantages Disadvantages
• Better representation for minority parties than plurality-majority systems
• No guarantee of proportionality, especially when smaller constituencies
• The larger the district magnitude, the proportional the results
• Need for disciplined voters to spread votes among party’s candidates equally
• Voters can choose among party candidates
• Candidates compete within parties
• Fragments the party system less than PR
• Danger of clientelistic relation candidate-voter
• Easy to count the votes • Danger of bribes to certain voter groups
Effective Threshold (Japan 1947-90)6 16,4 %
6 Lijphart, 1994, p. 41, the average district magnitude was 3.95 seats and there were in average 122.94 districts during 1947-90.

11
1.4.2 Parallel Systems Under the Parallel formula part of the parliamentary seats are elected using PR method and other part is filled by using one of the plurality-majority formulas. As we can see from the sample of countries using this method in the table below, the percentage of seats elected by each of the formulas varies from Tunisia electing 12% under PR and 88% under Party Block to Somalia with the other extreme electing 88% seats by PR and remaining 8% by FPTP. Only Russia and tiny Andorra chose 50/50 balance of both formulas. As they combine the benefits of PR systems with attractive single-member representation, parallel formulas almost mushroomed during the 90’ becoming essential component of the electoral systems of Russia, Japan, Lithuania, Georgia, Azerbaijan, Armenia, Croatia and Albania raising the total number o countries using this method to 20 in 1997. Voters have usually two ballots, one for individual candidate to be elected under the P-M formula (11 countries use FPTP, 4 TRS, 3 Party Block and remaining two use Bloc Vote respectively SNTV) and the other to vote for parties under the List PR electoral formula. However, unlike Mixed Member Proportional formula the PR List does not compensate for any disproportionality within majoritarian districts. Table 1.7 Examples of Parallel Systems (as in 1997)7
Country PR seats P-M Seats Seats Total P-M System Armenia 40 (21%) 150 (79%) 190 FPTP
Azerbaijan 25 (20%) 100 (21%) 125 TRS
Ecuador 12 (16%) 65 (84%) 77 Party Block
Japan 200 (40%) 300 (60%) 500 FPTP
Niger 75 (90%) 8 (10%) 83 FPTP
Russia 225 (50%) 225 (50%) 550 FPTP
Somalia 113 (92%) 10(8%) 123 FPTP
Tunisia 19 (12%) 144 (88%) 163 Party Block
Table 1.8 Features of Parallel System
Advantages Disadvantages
• Combines the benefits of PR while maintaining the relation voter-representative.
• Disproportional in comparison with List PR.
• Enough PR seats ensure representation for small parties.
• Danger of creating two classes of MPs.
• Less fragmentation of party system than in PR.
• Complexity of the system can be confusing for some voters.
Effective Threshold
7 Source: Reynolds, A., Reilly, B., Electoral system Design, International Institute for Democracy and Electoral Assistance, Stockholm, 1997 p. 55

12
1.5 PROPORTIONAL REPRESENTATION SYSTEMS
The proportional representation (PR) formulas are traditionally presented as a contrast to plurality-majority formulas. Rational underpinning of all of PR systems is to consciously translate parties’ shares of their national votes into a corresponding proportion of parliamentary seats. Seats are usually allocated within regionally based multi-member districts, but in a number of countries the distribution of parliamentary seats is effectively determined by the overall national vote. Proportional representation systems are very vulnerable to electoral engineering, the degree of their proportionality depends vitally on three factors: district magnitude, electoral threshold and mathematic formula for seats allocation. District Magnitude The district magnitude varies from two seats to as many as the number of representatives in the assembly in the case of the whole country being one district (as it is for example in the Netherlands). Douglas W. Rae came in his 1967 study – according to Lijphart, “the first systematic comparative analysis of the effects of electoral systems on disproportionality and multipartism8” - with the disclosure of the extreme strong influence of district magnitude.9 The larger the district is, in the sense of how many seats are being elected in the constituency, the more proportional the election result will be. As I demonstrate in chapter 3.2 on examples of various district magnitudes for the Czech Republic, district magnitude of less than six seats connected to certain mathematic formula (modified D’Hondt, Imperiali) can on the national level manufacture more disproportional results than PM formulas. On the other hand, countries, where the whole territory is one district (Israel, Netherlands) offer extremely proportional representation, enabling tiny parties to enter the parliament. The other handicap of large district is that, with larger district magnitudes its geographical territory grows as well and the linkage between the elected members and their constituency weakens. If we look at the fifty-two out of seventy PR systems of 27 established democracies during 1945-1990 examined by Lijphart, only seventeen of them had average district magnitude of less than 10 seats (two of them having average magnitude les than 5).10 This shows that the mature democracies have avoided disproportionality. When comparing electoral systems we use average district magnitude because in many countries the electoral district follows administrative boundaries, which causes significant disparity between the constituency magnitudes within the country. The Threshold The other feature limiting the proportionality of PR - the electoral threshold - eliminates the allocation of votes for parties who did not reach certain number of votes. All electoral systems have some minimum level of support a party needs to gain representation. We distinguish between the legal threshold, which is set by the particular electoral laws, and so called effective threshold, which is a variable resulting from other important features of the electoral system especially the district magnitude, the number of political parties and assembly size. The legal threshold is a non-obligatory tool of electoral laws, which should eliminate the presence of small parties in the assembly. This is frequently justified by the danger of party pluralism and preventing extremist parties from entering the parliament. The range of legal threshold starts from the percentage needed to gain at least one seat (0.67 % in Netherlands) to as high as 10 % in Seychelles. Other methods of determining of legal threshold is directly in the number of seats a party must gain in single-member district, (German MMP system alternatively three 8 Lijphart 1996, p. 11 9 Rae, Douglas W., The Political Consequences of Electoral Laws, Yell University Press, New Haven, 1967 10 Lijphart 1996, p. 48
13
Teff= 50%/(M+1)+50%/2M
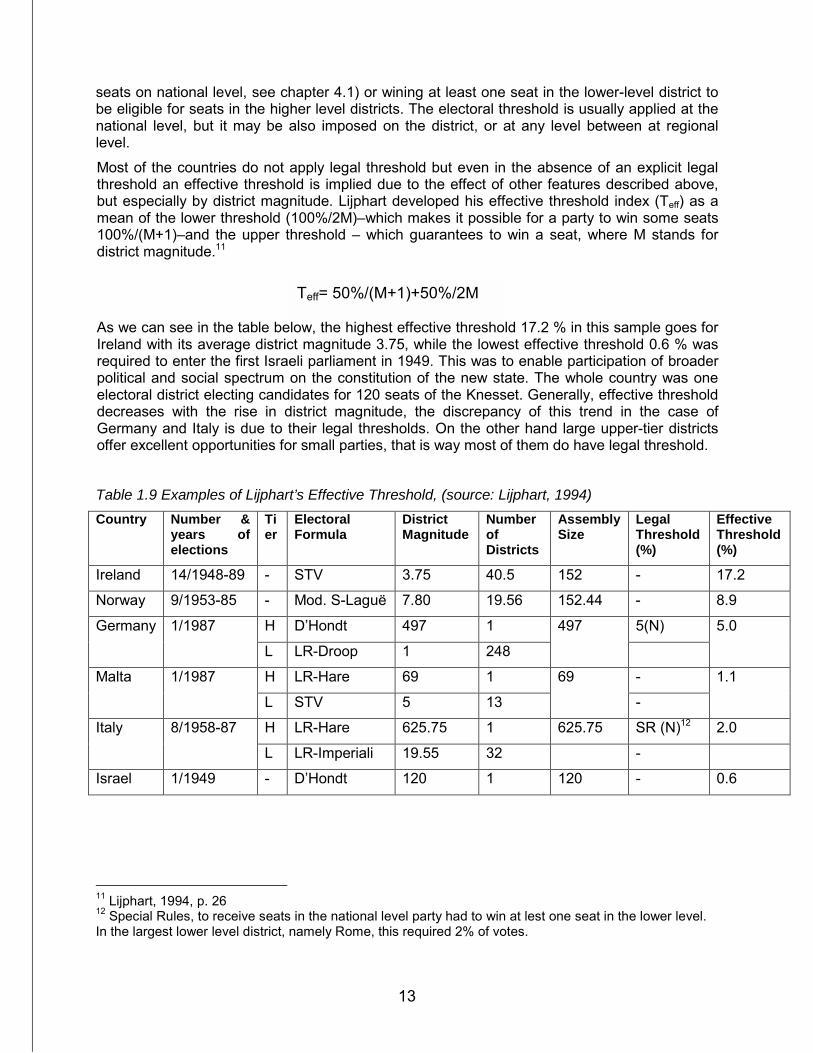
seats on national level, see chapter 4.1) or wining at least one seat in the lower-level district to be eligible for seats in the higher level districts. The electoral threshold is usually applied at the national level, but it may be also imposed on the district, or at any level between at regional level. Most of the countries do not apply legal threshold but even in the absence of an explicit legal threshold an effective threshold is implied due to the effect of other features described above, but especially by district magnitude. Lijphart developed his effective threshold index (Teff) as a mean of the lower threshold (100%/2M)–which makes it possible for a party to win some seats 100%/(M+1)–and the upper threshold – which guarantees to win a seat, where M stands for district magnitude.11
As we can see in the table below, the highest effective threshold 17.2 % in this sample goes for Ireland with its average district magnitude 3.75, while the lowest effective threshold 0.6 % was required to enter the first Israeli parliament in 1949. This was to enable participation of broader political and social spectrum on the constitution of the new state. The whole country was one electoral district electing candidates for 120 seats of the Knesset. Generally, effective threshold decreases with the rise in district magnitude, the discrepancy of this trend in the case of Germany and Italy is due to their legal thresholds. On the other hand large upper-tier districts offer excellent opportunities for small parties, that is way most of them do have legal threshold. Table 1.9 Examples of Lijphart’s Effective Threshold, (source: Lijphart, 1994) Country Number &
years of elections
Tier
Electoral Formula
District Magnitude
Number of Districts
Assembly Size
Legal Threshold (%)
Effective Threshold (%)
Ireland 14/1948-89 - STV 3.75 40.5 152 - 17.2
Norway 9/1953-85 - Mod. S-Laguë 7.80 19.56 152.44 - 8.9
H D’Hondt 497 1 5(N) Germany 1/1987
L LR-Droop 1 248
497
5.0
H LR-Hare 69 1 - Malta 1/1987
L STV 5 13
69
-
1.1
H LR-Hare 625.75 1 625.75 SR (N)12 2.0 Italy 8/1958-87
L LR-Imperiali 19.55 32 -
Israel 1/1949 - D’Hondt 120 1 120 - 0.6
11 Lijphart, 1994, p. 26 12 Special Rules, to receive seats in the national level party had to win at lest one seat in the lower level. In the largest lower level district, namely Rome, this required 2% of votes.

14
Mathematic Formula The Mathematic formula used for allocation of seats according to counted votes has an important effect on PR electoral outcomes. There are two mathematic formulas either of “highest averages” or of “largest remainders”. I would kindly refer the reader to chapter 2.1 for a thorough description of mathematic formulas. Number of Tiers One of the ways how of sorting systems of proportional representation is according to the number of tiers they use for votes allocation. In the countries using one tier allocation it can be applied on the national level (Netherlands, Israel) or regional level (Finland, Switzerland). Two-tier allocation combines lower-level districts with higher-level districts using usually both national and regional lists (South Africa) or single member districts and national list (Germany, New Zealand). Three-tiers are found in Greece and Belgium. But it is necessary to stress that the number of tiers does not mean more votes for a single voter (as it is in mixed member proportional formula). The allocation of votes in the highest tier can proceed in three ways. The first approach is to use the remainders of unallocated seats from lower districts in the higher tier reallocation on the basis of the collected remainders from each district. The benefit of this method used for example in the Czech Republic, is that the number of seats allocated on the higher level is not predetermined by the law and can even vary depending on contemporary party fractionalisation and the quota used. Table 1.10 uses the 1998 elections results of the lower chamber of the Czech parliament. The first row shows the number of votes per seat and the seats’ allocation, calculated only in one-tier, while the second row shows the official results as calculated in the two-tier system. As we can see the reallocation of seats remainders in the second tier helps to slightly increase proportionality as measured by both the least-squares index and the largest deviation index. Table 1.10 Difference in seat distribution between one-tier and two-tier system13
ČSSD ODS KSČM KDU-ČSL US LSq index LD indexOne tier 25,715 (75) 26,342 (63) 26,342 (25) 28,301 (19) 28,533 (18) 4.91 5.2 Two tiers (1998 results) 26,063 (74) 26,342 (63) 27,440 (24) 26,886 (20) 27,031 (19) 4.66 4.7 The second way of seat allocation requires a pre-set number of corrective seats, which are allocated within the higher tier. The result of seats allocation according to districts is compared to the allocation on the national level. In Sweden for example, 39 out of 349 seats are allocated on the national level to balance the disproportions created on the district level. Whenever party wins fewer seats in the district, than it would win on the national level, it gains one of the 39 corrective seats. This corrective higher tier is used in two other Scandinavian countries Denmark and Norway, similar procedure applies during election in South Africa, Austria and Belgium. Third option, as employed in Poland, elects the members on higher level independently on the members from lower level. Beside 391 legislators elected in 52 districts, Poland has also national constituency with 69 seats, which are distributed on the basis of national totals of each party. According to Blais and Massicotte, whose categorization I adopted in this paragraph; “multiple tiers normally reduce distortions, provided there is no threshold that prevents smaller parties from getting national seats.” However, ”if such thresholds exist, a higher tier can serve to
13 ČSSD- Social Democrats, ODS- People Democratic Party (conservatives), KSČM –Communist Party, KDU-ČSL- Christian Democrats, US –Freedom Union (liberals)

15
give a bonus to large parties.” 14 Lijphart sees one more advantage of two-tier districting. “…It is an attractive way of combining the advantage of close representative-voter contact in low-magnitude districts with greater proportionality of high-magnitude districts.”15 List Types The PR List systems vary also according to the type of list used, we distinguish between closed, open and free lists. The most common is the closed list, which does not give the voter any possibility to express his preferences. Voters choose only between party lists, which have fix order of candidates pre-determined by the party. This type of ballot papers is very suitable for countries with high illiteracy and has proved this during the first democratic elections of South Africa in 1994. Ballots used during these elections contained only party name, symbol and the photography of party leader. Closed lists give opportunity to women candidates or minorities, who would be otherwise hardly elected. The disadvantage of closed lists is that voters cannot choose among particular representatives of their district and in the case of South Africa do not even know their names. The open list is used in the most of European PR systems. It gives electors choice of marking their favourite candidate and in this way they can change the order on the party list. However, this opportunity is used rather sporadically due to the anonymity in large districts and the tradition of voting according to the party profiles. It is rather difficult to achieve a high percentage of voters of one party to use their few preferential votes for the same candidate, so that it would change the original list order. Except Finland, where it is compulsory and the order of candidates depends on the number of preferential votes their obtained, open list does not generally influences the election result. Another departure from the rule is the case of party list with not acceptable candidates for the majority of traditional voters in particular district. This was the case of 2002 elections in the Czech Republic, where in some districts traditional supporters of Christian Democrats “out-circled” the Liberals to lower, not elected positions on the joint list candidature (Christian Democrats and Liberals forged pre-election coalition - apparentement), which had a crucial impact on the representation of Liberals in the assembly. The free list system enables voter to elect candidates across the part lines. In Switzerland and Luxembourg electors have as many votes as there are seats to be filled and can distribute them to candidates within or across party lists. The capacity to vote for more than one candidate across one party list is called panachage, while casting more then one vote for one single candidate is known as cumulation. Some authors argue that this kind of ballots causes more fractionalized elective party system than would be found under other elections. Lijphart uses the terms: ordinal ballot, for system that gives the voter more than one vote for each party, and categorical ballot, where the voter can vote only for the candidatures of one party. However, his ordinal ballot includes all systems (not only proportional), which give the elector chance to vote for more than one party, no mater if this happens within one round of elections (French two round system) or under two different formulas (German two votes). In his comparative study of seventy electoral systems Lijphart found out, that there is no significant link between ballot structure and disproportionality or any of the party system variables, but it affects the frequency of manufactured majorities. Systems with categorical ballots were in average producing more often manufactured majorities then systems using ordinal ballots. 16
14 Blais A., Massicotte L., Electoral System in LeDuc L., Niemi R.G., Norris P., Comparing Democracies, Sage Publications, New Delhi 1996 15 Lijphart 1994, p. 145 16 Lijphart 1994, p.125

16
Apparentement In the countries where high effective threshold disables small parties to enter the assembly, parties with similar programs form apparentement- cartel- that should enable them to combine votes to pass the effective threshold and gain representation. They remain as separate entities but their votes are counted together, thus increasing their chance of crossing the threshold. However some electoral system assign these groupings higher thresholds according to how many entities they accommodate. The possibility of apparentement makes it practicable for smaller parties to counteract to some extant the disadvantages of their small size, which can be expected to reduce the disproportionality. This is also proved in Lijphart’s study of seventy electoral systems. In all groups of electoral systems the apparentement systems have consistently less disproportionality than the systems without apparentement. Malapportionment Michael Gallagher includes malapportionment – uneven distribution of voters among electoral districts - among the components that may influence disproportionality. However this is more the problem of single member districts under majoritarian formulas, which accommodate regionally different number of voters. In proportional representation this is usually easily avoided by applying different district magnitudes according to the district population, so that the number of voters per one legislator is the same across the whole country. Gallagher observes overrepresentation of rural areas in some countries as a result of fast urbanization and rigid re-districting. 17 I the context of malapportionment I should mention the phenomenon of Gerrymandering. In contrast to malapportionment gerrymandering is deliberate manipulation of constituency boundaries so as to advantage a particular interest. For this reason, one can cut in half an area inhabited by social minority into two (or more) constituencies, making it more difficult for their candidates to reach the effective threshold. Gerrymandering is so more possible in single member districts (P-M systems) and becomes more difficult with the increase of district magnitude.
1.5.1 List PR
List PR system was developed in continental Europe in the turn of the 20th century in countries, which societies were more plural, than the relatively homogenous British society. This plurality was predominantly present in four separate conflicts; ethnical, religious, city-village, and social classes. The Westminster model – the winner takes it all - was for such divided societies unsuitable, as it did not provide representation for anyone else except the winner. Furthermore in the case of plurality formula, the ruling party represented only the biggest minority, leaving the majority of society out of the game. Plurality societies were facing the problem how to guarantee the representation of minorities within the democratic principle of majority deciding. How to ensure the interest of minorities through the majority government? The first countries, to implement the PR List system were exactly the ethnically heterogeneous countries: Denmark since 1855, Switzerland since 1891, Belgium since 1899, Moravia since 1905 and in Finland since 1906. However, there was one more increasing power demanding simultaneously the implementation of proportional electoral system during the end of the 19th century. As the franchise was extending to more classes of the society, the labour as the supporter of newly established social democratic parties were calling not only for universal franchise, but also for the chance of
17 Gallagher, M. , Proportionality, Disproportionality and Electoral Systems, Electoral Studies, 10 (1991),

17
electoral system. The majoritarian system was in favour of the traditional parties of elites18 leaving no space for social democrats to enter the stage. Paradoxically in 1904, having established the universal franchise for male citizens of Sweden the leading Social Democrats focused on the implementation of majority formula in single member constituencies. At this point, the elite parties started to fear of losing their majority support. In the end, the boom of proportional representation in continental Europe was the consequence of the social democratic struggle for universal franchise and the defensive counter claim for proportional representation from the parties of elites.19 Nowadays PR List is the second most favourite formula represented in 66 countries mainly in Europe, Latin America and southern Africa. It is although applied in more than half (20) of 36 established democracies (as defined in Lijphart 1996). Table 1.11 Features of PR list
Advantages Disadvantages
• Facilitates more representative legislature than PM
• Disadvantages of coalition governments – slower procedures
• Small minority parties get access to parliament
• Danger of extreme party pluralism (more than 7 parties in parliament)
• Very few wasted votes • Platform for extremist parties
• Fulfils the principal of minority inclusion
• Coalitions of parties with different policies or supporters
• Encourages parties to present socially divers lists of candidates
• Difficult to throw a reasonably sized party out of power, due to its coalition potential
• Ensures higher representation for ethnical minorities
• Lack of link between voter and his mp due to large districts (important in rurally based states)
• Higher Representation of women • National closed PR list leaves to much space for party senior leadership
• Restricts the growth of “regional fiefdoms”
• As voters cast their votes for parties rather than individuals PR is not suitable for countries with embryonic party structure
• It was discussed that PR systems in established democracies create more efficient governments
• Unfamiliar system for countries with English or French colonial history
• Visible power sharing between parties and interest groups
18 Elite’s parties, historically first type of political parties predominant till the half of the 19th century. In the system of limited franchise, it was only the aristocracy and a narrow group of privileged, who competed in the parliament. 19 Klíma, M.; Volby a politické strany v moderních demokraciích, Radix, Prague, 1998

18
1.5.2 Mixed Member Proportional Significant number of authors includes Mixed Member Proportional system (as applied in Germany) into one group with Parallel system, attributing it the characteristic of correction.20 In my opinion there is a good reason why to place MMP among pure PR formulas. Although one proportion of the parliament is elected under PR formula while the remaining part is elected in single member districts under PM method, which would be similar to the Parallel systems. The votes cast for the PR list candidates are of greater importance, as the list PR seats compensate for any disproportionality in the majoritarian part. For example, if one party wins 10% of national votes but no district seats, than they would be awarded enough seats from the PR list to bring their representation up to approximately 10% of the parliament. I listed all seven countries, which contemporarily use MMP in table 1.12. Except Hungary, all of them use first past the post formula for the elections in single member districts. What the proportion of parliamentary seats elected under particular formulas concerns, six countries fluctuate around the 50/50 balance applied by Germany and Venezuela. While Italians vote only one fourth of their legislatives using the PR list. At this point I would like to avoid describing greater details and country specifics. May the reader wait for the part 3 devoted to case studies of countries using mixed member proportional formula. Table 1.12 MMP Systems (as in 1997)21
Country PR seats P-M Seats Seats Total P-M System Bolivia 62 (48%) 68 (52%) 130 FPTP
Germany 328(50%) 328 (50%) 656 FPTP
Hungary 210 (54%) 176 (46%) 386 TRS
Italy 155 (25%) 475 (75%) 630 FPTP
Mexico 200 (40%) 300 (60%) 500 FPTP
New Zealand 55 (42%) 65 (58%) 120 FPTP
Venezuela 102 (50%) 102 (50%) 204 FPTP
Besides all the above cited advantages and disadvantages of proportional representation, MMP is usually assigned these characteristics: Table 1.13 Features of Mixed Member Proportional System
Advantages Disadvantages
• Ensures both proportionality and geographic representation
• Similarly to parallel systems it can create two classes of MPs
• Voter have two votes, for the party and their local candidate
• Can cause strategic voting’s anomalies – campaign for potential coalition party candidate in the single-member districts
20 for instance, Klíma 1998, or Blais A., Massicotte 1996, include German system among separate group of Mixed systems together with Japanese or Russian parallel system, while Lijphart (1996) and Reynolds and Reilly (1997) include MMP among pure PR systems. 21 Source: Reynolds A., Reilly, B., Electoral system Design, International Institute for Democracy and Electoral Assistance, Stockholm, 1997 p. 74

19
LSq=√[1/2∑(vi-si)2]
1.5.3 Single Transferable Vote (STV) The Single Transferable Vote formulas have long been advocated by political scientists as one of the most attractive electoral systems22. However presently, people elect national assemblies under STV only in Ireland and Malta. Besides that, STV is used for elections to several local assemblies in Australia and in Northern Irish local election. As all those are formal British territories, STV is sometimes referred to as British proportional representation system. In reality it holds some benefits of Westminster model: personalization and geographical representation. STV is the product of 19th century liberalism, it places voters free choice of candidates before the interest of political parties. It aimed to such type of democracy, in which the citizen can participate on elections in the most efficient and free form. Voters range candidates according to their preferences from one ongoing in multi member districts. This marking is optional; voters are not required to mark all candidates, if they wish they can mark only one. In the first round of counting all the first preferences are counted up. The quota is calculated by a simple formula q=(votes/seats +1)+123. Candidates who exceed this quota are directly elected. The second preferences of the candidate with the least number of votes are reallocated to remaining candidates. At the same time, surplus votes of already elected candidates (those votes above the quota) are redistributed according to the second preferences on the ballot. For fairness, all second preferences of elected candidates are redistributed, but of course at the fractional percentage of the surplus votes (Ireland uses weighted sample). Table 1.14 Features of the System of Single Transferable Vote
Advantages Disadvantages
• Most sophisticated formula - allows choice between parties and candidates within parties.
• Demands high degree of literacy and numeracy.
• Proportional. • Complex counting
• Small districts ensure voter candidate link.
• Preferential voting unfamiliar for many societies.
• Voters can influence the composition of post-election coalition.
• Inter-party competition of candidates – possibility of party fragmentation.
1.6 WESTMINSTER VS. PROPORTIONAL MODEL
In this chapter, I would like to point out the major differences between classic Westminster model and proportional models. For this reason, I will abstract of all possible variations of proportional formula and reduce it to the list PR. The main tool for my comparison should be data from the table 1.15. It is take again from Lijphart’s comparative study of electoral systems in twenty-seven democracies. The first characteristic we will compare is the disproportionality. Lijphart measures disproportionality by the least-squares index (LSq), where (vi) stands for vote percentages and (si) for seat percentages. The vote-seat share difference of each party is squared and then added; this total is divided by 2; and finally the square root of this value is taken:
22 Reynolds, A., Reilly, B 1997, p.83 23 One can see here Droop quota.

20
The table shows what we anticipated; the percentage of disproportionality decreases in the direction from plurality systems (13.56 %), through other majoritarian systems (as the French TRS) to proportional representation, where the values vary according to used formula. The most frequent D’Hondt formula used in 32 out of 69 examined systems has the highest disproportionality (5.22 %) among PR systems, but is still more then twice less disproportional than is the average of plurality formulas. Even less disproportional are the PR systems using LR-Droop formula (4.15%) and the most proportional (least disproportional) is the LR-Hare formula (1.88%). Table 1.15 The effects of electoral formulas on disproportionality and party systems24
Secondly, Lijphart calculated the effective number of elective parties (NV) and the effective number of parliamentary parties (NS)25. Disproportionality does not automatically lead to fewer elective parties. The D’Hondt formula created in average 4.35 elective parties compared to more than twice more proportional LR-Hare with 3.62 parties. The half-party difference between plurality and other majoritarian systems is explained by Lijphart by the absence of strategic voting in the TRS, which enables voting for smaller parties in the first round. The third column shows much clearer pattern of effective number of parliamentary parties assigning 2.04 party to the plurality system, which traditionally manufactures two-party system (there can be more parties in the assembly, but only two political parties change in the government). The value of 2.04 does also not necessarily mean that there are two parties. For instance the Indian system had usually been one of a dominant party and several smaller parties, which adds up to an effective number of approximately two parties. This prevalence of the two-party system in countries with plurality systems is reflected also in
the last two characteristics. In both the frequency of parliamentary majorities and the frequency of manufactured majorities26 the plurality systems are responsible for the highest values creating parliamentary majority in 93 % of elections of which more than two thirds are manufactured majorities (for example British parliamentary election have produced 92.3 per cent majorities, all of which have bee manufactured). In this regard political scientists speak about the psychological and mechanical effect. While mechanical effect is the immediate effect of translation of votes into seats in particular elections. The psychological effect describes the behaviour of voters as well as politicians, political activists and financial backers, who - not 24 Results for 69 electoral systems as examined in Lijphart 94, p 96, it is necessary to remind the reader that Lijphart uses different categories of ES than my nine broad families. 25 These indexes are modified Rae indexes of party system fractionalization (Fv) and party fractionalization in parliament (Fs), based on both the number of parties and their relative sizes: Fv=1 - ∑vi
2 ; Fs=1 - ∑si2 . Effective number of elected (parliamentary) parties equals: NV=1/∑vi and NS=1/ ∑si
2. 26 Election system “manufactures” majority if one party earns majority of seats without wining the majority of votes.
Electoral Formula
(# of examined systems )
Disproportionality, average
percentage (%)
Effective # of elective
parties
Effective # of parliamentary
parties
Frequency of parliamentary
majorities
Frequency of manufactured
majorities
Plurality (7) 13.56 3.09 2.04 0.93 0.71
Other Majoritarian (5) 10.88 3.58 2.77 0.52 0.52
D’Hondt (32) 5.22 4.35 3.70 0.18 0.14
LR-Droop (13) 4.15 3.80 3.29 0.24 0.14
LR-Hare (12) 1.88 3.62 3.46 0.23 0.04

21
wanting to waste their votes and scarce resources - vote for larger parties, despite their sympathies for other subjects. Now, considering the psychological effect the value of manufactured majorities under plurality formulas would consequently rise towards the value of parliamentary majorities. The other majoritarian formulas make all of its majorities to be manufactured. Among the PR formulas the probability of one party parliamentary majority is about 1:4, but the more vital indicator is the frequency of manufactured majorities, which sank to 0.14 for both D’Hondt and LR-Droop and 0.04 for LR-Hare. This shows how difficult it is to manufacture a majority once we use PR systems, and that it also depends on the chosen mathematic formula. Majoritarian models, which create two-party system, over again excel in government accountability, as only one party is responsible for government performance. One-party government does not have to compromise on its policy with other parties. Moreover, its majority in the assembly ensures fast legislative procedure.
This does not mean that one-party cabinets in majoritarian system would be more responsive to citizens’ interests than coalition governments in multi-party systems. In contrary, coalition governments are usually closer to the centre voter and thus closer to the interests of an average citizen. The myth of higher efficiency of single-party governments in majoritarian systems was also wiped out. Lijphart’s comparative study of 36 democracies shows no significant correlation between electoral system and economic output.27 And if we look at the development of five major European economies (Germany, France, United Kingdom, Italy and the Netherlands)
27 Lijphart, A., Patterns of Democracy. Government forms and Performance in Thirty-Six Countries. New Haven and London, Yale University Press 1999

22
during 1945-95 (see the graph above) we see few important and to some extant surprising conclusions:28
a) The United Kingdom, using majoritarian system and indicating the highest governmental stability, fell during 40 years form the first position to the last one.
b) The very opposite case is Germany, with its mixed member proportional formula, which worked out its way from the last place to the top.
c) The Netherlands with almost ideal proportionality and multi-party coalition governments ended up in the middle of the scale in front of Britain.
d) Even more surprising conclusion comes from the position of Italy with its 58th government since 1945 (compared to Great Britain’s 15 government during the same period) but reaching the same level of economic development as the UK.
e) And even France with two rounds system, which usually produces coalition government, stood before its traditional rival.
The final conclusion should be that electoral system does not influence the economic output. There is a wide variety of economic factors independent from the political sphere, which have an impact on GDP. In this sense are even my arguments, presuming a correlation between electoral system and growth of GDP per capita, irrelevant. What the lack of representation of minority parties concerns, majoritarian system can make provisions for minority representation (the Maori districts in New Zealand, reserved seats for the scheduled casts and tribes in India). But PR has the great additional advantage of enabling any minority, not just those favoured by law, to be represented. PR thus avoids any invidious choices in favour of certain groups and, as a consequence, against other minorities. And Lijphart’s comparison proves, that PR systems give more scope for women legislators, than plurality-majority formulas. Although PR can often cause a proliferation of parliamentary parties in new democracies” (as we can see on the example of the Polish elections from 1990 when 27 parties got their representative in the Sejm), “majoritarian laws also allow a large number of parties to enter parliament when parties are weakly entrenched and geographically distinct, which is the case of nowadays India. Furthermore, majoritarian systems do little to help consolidate new party systems, because lack of widespread party identification encourages the election of independent candidates who can blur the balance of party strength in parliament and destabilize the legislative process. Finally, majoritarian systems give a distinct advantage to those parties that do have established and support bases, and these are in many cases the heirs of authoritarian rulers.” 29 Westminster model created political stability in England, but caused grave crises in Northern Ireland and Nigeria. In the conditions of deeply divide society, as it was the case in Northern Ireland (Catholics against Protestant) or in Nigeria (tribal animosity), this type of electoral system leads to the supremacy of larger social group over the relative minority. This can result in escalation of tension and an open conflict, as it happened in both countries. Between 1920 and 1971 the pro British Protestants as the social majority always won in the elections and formed one party government. No wonder, that this period ended up in what was close to a civil war in the early 70’. The Peace Agreement on Northern Ireland thus adopted the more
28 Klima 2001, p. 93 29 Birch, S. Ukraine; The Perils of Majoritarinism in a New Democracy, in Reynolds, A., Reilly, B., Electoral system Design, International Institute for Democracy and Electoral Assistance, Stockholm, 1997

23
proportional formula of Single Transferable Vote. Each country needs require different instruments and different approaches. There is nothing like the best or the universal electoral system. What can perfectly work in one country can be a total disaster for other. It depends on country’s tradition, maturity of democracy, literacy of voters and many other conditions.

24
2. ELECTORAL ENGINEERING
The Italian political scientist Giovanni Sartori considers the electoral system as the most manipulative instrument of politics. And Lijphart’s regression analyses shows, that two thirds of the variance of disproportionality among his seventy electoral systems is explained by their five dimensions, in another words by the systems alone.30 If we consider the electoral proportionality as the priority of each electoral system, then Lijphart’s conclusion means, that every electoral engineer has enough instruments to make his electoral system proportional. Lijphart proved also, that among the systems variables it is the effective threshold, which influences the degree of proportionality the most. The effective threshold becomes the most important explanatory variable explaining 61 per cent of disproportionality variance among Lijphart’s set of electoral systems.31 This finding also supports the fact, that electoral formula is by far the strongest instrument for electoral system designers. Because all majoritarian formulas automatically impose an effective threshold of 35 per cent, switching to semi- or proportional systems would automatically increas the proportionality and enable small minority parties to enter the assemblies. But I do not want to repeat the advantages and disadvantages of all nine major electoral formulas as I have done so in great detail in the first chapter. This chapter should give the reader an insight into the workshop of electoral engineers. I will try to use more practical examples to prove how major variables of electoral systems influence the proportionality of seats distribution.
2.1 MATHEMATIC FORMULAS
For this chapter I use data from 1999 elections to Lok Sabha in 12 districts of Andhra Pradesh conducted under the current FPTP system. I did not include votes for independent candidates, who nevertheless usually did not get more than 1 % of votes in the constituency (except 2 cases, one candidate gained 2.98% in Warangal and another got 2.98% in Adilabad). And I also excluded parties with less than 1 % of votes across the 12 constituencies. As the data are real it is necessary to stress out that my calculations do not show possible election result under the PR formulas unless we would take no account of these consequential facts:
1. The psychological effect matters. Voters, parties, financial supporters of parties behave differently under PR systems. It is obvious that voters would cast their votes even for smaller parties, because under PR they have a much higher chance of getting representation. It is obvious that small, minute parties will get higher support, which will enable them to pass the effective threshold, and bigger parties will get smaller support. Besides that we can anticipate new parties to emerge, seeing their chance in the change of electoral system.
2. In our case, I joined results from 12 single-member districts to one district with 12 seats to be elected. In the last union elections, the regional party TDP made an agreement of not competing against the national BJP. In districts where BJP presented its nominee, TDP did not deploy its candidates. Logically I should consider TDP and BJP as one party for PR election. I avoided this, as it would make the election results too
30 Lijphart 1994, p.140 31 Lijphart 1994, p.110
25
majoritarian and I would not be able to demonstrate the influence of mathematic formulas on the translation of votes to seats for parties of different size. Moreover, it corresponds better to the usual party system of counties with proportional representation.
3. Parties, who deployed their candidate only in some of our 12 districts, would have to present their candidate in the whole 12 members district. And they would tend to form list of candidates in all districts, as the possibility of seats revenues is much higher.
But on the other hand I want to advocate the usage of the data from FPTP election results. Voters’ preferences may change, but the number of voters remains the same. As the PR districts in India are considered to be formed in the same way as I did in this comparison32, if we anticipate the same turnout during PR elections as during last plurality elections, effective threshold -the percentage needed to succeed, visible from my tables - will be the same. Also the calculated quotas in the method of largest remainders should not change. This gives us (and political leaders) an idea how many votes will political subjects need to gain representation in the PR elections. Another reason, why I use the Indian results, is to make my tables easier, more attractive and “real” for Indian readers. This would not have been accomplished if I had used other possibilities, nor if I had used data from other countries with PR system, neither if I had used model date of parties of blues and reds. Simply, as there are no data from PR election in India available and as I intended to work with Indian data, I had no other choice, than to take the advantage of FPTP election results.
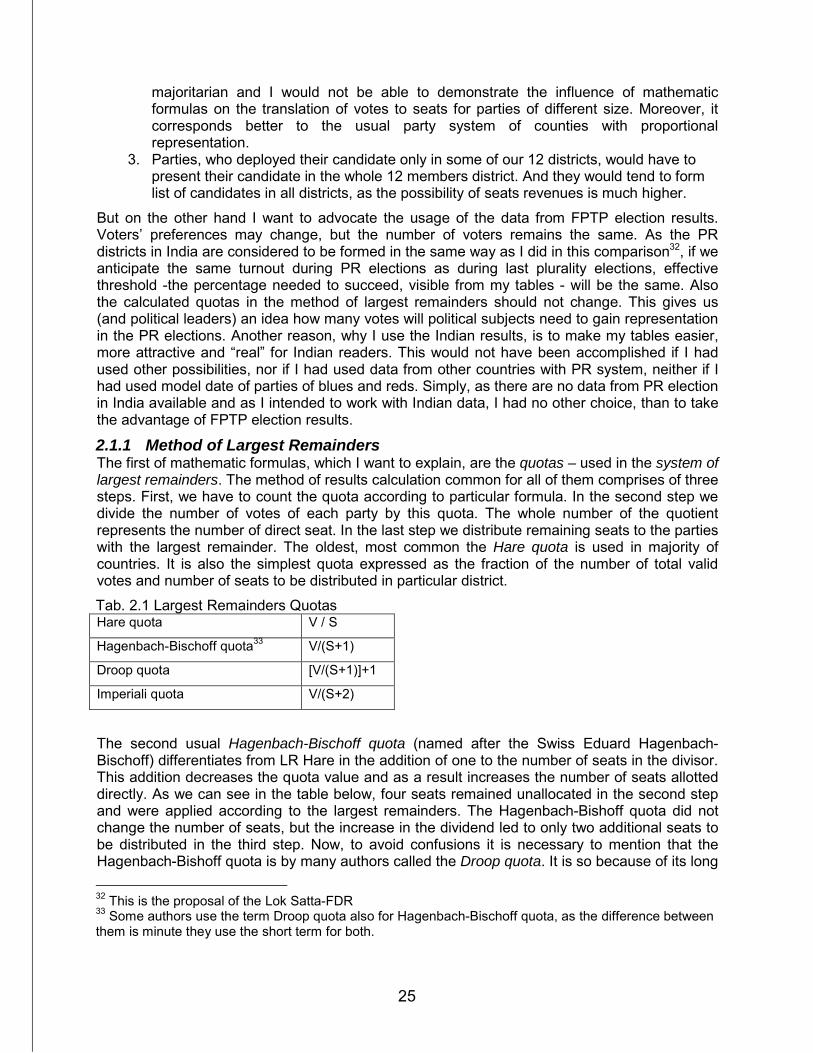
2.1.1 Method of Largest Remainders The first of mathematic formulas, which I want to explain, are the quotas – used in the system of largest remainders. The method of results calculation common for all of them comprises of three steps. First, we have to count the quota according to particular formula. In the second step we divide the number of votes of each party by this quota. The whole number of the quotient represents the number of direct seat. In the last step we distribute remaining seats to the parties with the largest remainder. The oldest, most common the Hare quota is used in majority of countries. It is also the simplest quota expressed as the fraction of the number of total valid votes and number of seats to be distributed in particular district. Tab. 2.1 Largest Remainders Quotas Hare quota V / S
Hagenbach-Bischoff quota33 V/(S+1)
Droop quota [V/(S+1)]+1
Imperiali quota V/(S+2)
The second usual Hagenbach-Bischoff quota (named after the Swiss Eduard Hagenbach-Bischoff) differentiates from LR Hare in the addition of one to the number of seats in the divisor. This addition decreases the quota value and as a result increases the number of seats allotted directly. As we can see in the table below, four seats remained unallocated in the second step and were applied according to the largest remainders. The Hagenbach-Bishoff quota did not change the number of seats, but the increase in the dividend led to only two additional seats to be distributed in the third step. Now, to avoid confusions it is necessary to mention that the Hagenbach-Bishoff quota is by many authors called the Droop quota. It is so because of its long 32 This is the proposal of the Lok Satta-FDR 33 Some authors use the term Droop quota also for Hagenbach-Bischoff quota, as the difference between them is minute they use the short term for both.

26
name and little difference to the latter one. As we see in the table 2.1, the value of Droop quota is increased by one compared to Hagenbach-Bischoff, which has no significant impact, except in constituencies with extremely small electorate. Therefore I did not recalculate the election results in table 2.2 for Droop quota. The rare Imperiali quota was used only in Italy till 1993. It is the most disproportional one, because it is constructed as if there were two additional seats in the constituency. Its smaller value increases the quotients of larger parties faster than those of the small parties. In contrast to the fist two formulas Imperiali formula did not allocate any seat to AIMIM but allotted an extra seat to the Congress Party. Tab. 2.2 Seats’ allocation under the method of largest remainders
LR Hare quota V/S = 951,961
INC 4,577,078
TDP 3,611,384
BJP 1,692,651
AIMIM 448,165
CPM 346,430
CPI 284,347
Dividend 4.8081 3.7936 1.7781 0.4708 0.3639 0.2987 Direct seats 4 3 1 0 0 0 Remainder 0.8081 0.7936 0.7781 0.4708 0.3639 0.2987 Remaining seats 1 1 1 1 0 0 Percentage of votes 40.07% 31.61% 14.82% 3.92% 3.03% 2.49% Percentage of seats 41.67% 33.33% 16.67% 8.33% 0.00% 0.00% Dis/advantage 1.60% 1.72% 1.85% 4.41% -3.03% -2.49% Number of seats 5 4 2 1 0 0 Hagenbach-Bischoff V/(S+1) = 878,733
INC 4,577,078
TDP 3,611,384
BJP 1,692,651
AIMIM 448,165
CPM 346,430
CPI 284,347
Dividend 5.2087 4.1098 1.9262 0.5100 0.3942 0.3236 Direct seats 5 4 1 0 0 0 Remainder 0.2087 0.1098 0.9262 0.5100 0.3942 0.3236 Remaining seats 0 0 1 1 0 0 Percentage of votes 40.07% 31.61% 14.82% 3.92% 3.03% 2.49% Percentage of seats 41.67% 33.33% 16.67% 8.33% 0.00% 0.00% Dis/advantage 1.60% 1.72% 1.85% 4.41% -3.03% -2.49% Number of seats 5 4 2 1 0 0 Imperiali V/(S+2) = 815,966
INC 4,577,078
TDP 3,611,384
BJP 1,692,651
AIMIM 448,165
CPM 346,430
CPI 284,347
Dividend 5.6094 4.4259 2.0744 0.5492 0.4246 0.3485 Direct seats 5 4 2 0 0 0 Remainder 0.6094 0.4259 0.0744 0.5492 0.4246 0.3485 Remaining seats 1 0 0 0 0 0 Percentage of votes 40.07% 31.61% 14.82% 3.92% 3.03% 2.49% Percentage of seats 50.00% 33.33% 16.67% 0.00% 0.00% 0.00% Dis/advantage 9.93% 1.72% 1.85% -3.92% -3.03% -2.49% Number of seats 6 4 2 0 0 0
27
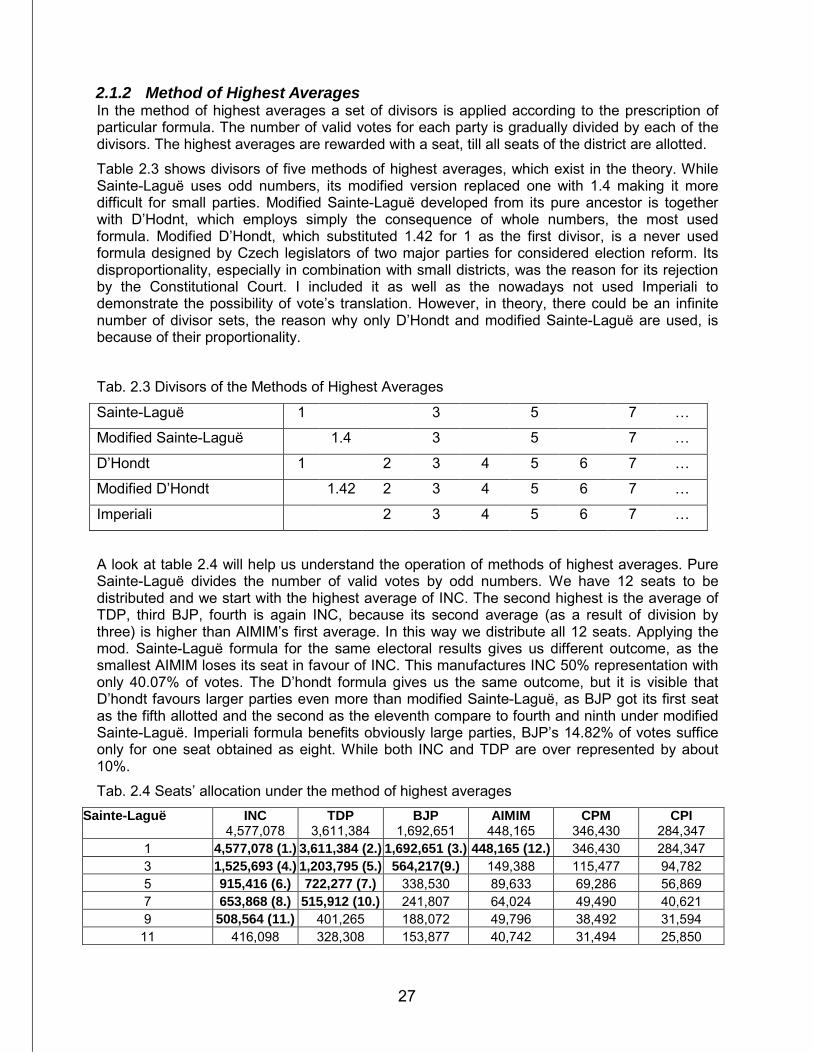
2.1.2 Method of Highest Averages In the method of highest averages a set of divisors is applied according to the prescription of particular formula. The number of valid votes for each party is gradually divided by each of the divisors. The highest averages are rewarded with a seat, till all seats of the district are allotted. Table 2.3 shows divisors of five methods of highest averages, which exist in the theory. While Sainte-Laguë uses odd numbers, its modified version replaced one with 1.4 making it more difficult for small parties. Modified Sainte-Laguë developed from its pure ancestor is together with D’Hodnt, which employs simply the consequence of whole numbers, the most used formula. Modified D’Hondt, which substituted 1.42 for 1 as the first divisor, is a never used formula designed by Czech legislators of two major parties for considered election reform. Its disproportionality, especially in combination with small districts, was the reason for its rejection by the Constitutional Court. I included it as well as the nowadays not used Imperiali to demonstrate the possibility of vote’s translation. However, in theory, there could be an infinite number of divisor sets, the reason why only D’Hondt and modified Sainte-Laguë are used, is because of their proportionality. Tab. 2.3 Divisors of the Methods of Highest Averages
Sainte-Laguë 1 3 5 7 …
Modified Sainte-Laguë 1.4 3 5 7 …
D’Hondt 1 2 3 4 5 6 7 …
Modified D’Hondt 1.42 2 3 4 5 6 7 …
Imperiali 2 3 4 5 6 7 …
A look at table 2.4 will help us understand the operation of methods of highest averages. Pure Sainte-Laguë divides the number of valid votes by odd numbers. We have 12 seats to be distributed and we start with the highest average of INC. The second highest is the average of TDP, third BJP, fourth is again INC, because its second average (as a result of division by three) is higher than AIMIM’s first average. In this way we distribute all 12 seats. Applying the mod. Sainte-Laguë formula for the same electoral results gives us different outcome, as the smallest AIMIM loses its seat in favour of INC. This manufactures INC 50% representation with only 40.07% of votes. The D’hondt formula gives us the same outcome, but it is visible that D’hondt favours larger parties even more than modified Sainte-Laguë, as BJP got its first seat as the fifth allotted and the second as the eleventh compare to fourth and ninth under modified Sainte-Laguë. Imperiali formula benefits obviously large parties, BJP’s 14.82% of votes suffice only for one seat obtained as eight. While both INC and TDP are over represented by about 10%. Tab. 2.4 Seats’ allocation under the method of highest averages
Sainte-Laguë
INC 4,577,078
TDP 3,611,384
BJP 1,692,651
AIMIM 448,165
CPM 346,430
CPI 284,347
1 4,577,078 (1.) 3,611,384 (2.) 1,692,651 (3.) 448,165 (12.) 346,430 284,347 3 1,525,693 (4.) 1,203,795 (5.) 564,217(9.) 149,388 115,477 94,782 5 915,416 (6.) 722,277 (7.) 338,530 89,633 69,286 56,869 7 653,868 (8.) 515,912 (10.) 241,807 64,024 49,490 40,621 9 508,564 (11.) 401,265 188,072 49,796 38,492 31,594 11 416,098 328,308 153,877 40,742 31,494 25,850

28
Percentage of votes 40.07% 31.61% 14.82% 3.92% 3.03% 2.49% Percentage of seats 41.67% 33.33% 16.67% 8.33% 0.00% 0.00% Dis/advantage 1.60% 1.72% 1.85% 4.41% -3.03% -2.49% Total seats 5 4 2 1 0 0 mod. Sainte- Laguë
INC 4,577,078
TDP 3,611,384
BJP 1,692,651
AIMIM 448,165
CPM 346,430
CPI 284,347
1.4 3,269,341 (1.) 2,579,560 (2.) 1,209,036 (4.) 320,118 247,450 203,105 3 1,525,693 (3.) 1,203,795 (5.) 564,217 (9.) 149,388 115,477 94,782 5 915,416 (6.) 722,277 (7.) 338,530 89,633 69,286 56,869 7 653,868 (8.) 515,912 (11.) 241,807 64,024 49,490 40,621 9 508,564 (10.) 401,265 188,072 49,796 38,492 31,594 11 416,098 (12.) 328,308 153,877 40,742 31,494 25,850 13 352,083 277,799 130,204 34,474 26,648 21,873
Percentage of votes 40.07% 31.61% 14.82% 3.92% 2.65% 3.41% Percentage of seats 50.00% 33.33% 16.67% 0.00% 0.00% 0.00% dis/advantage 9.93% 1.72% 1.85% -3.92% -2.65% -3.41% Total seats 6 4 2 0 0 0
D'Hondt INC
4,577,078 TDP
3,611,384 BJP
1,692,651 AIMIM
448,165 CPM
346,430 CPI
284,347 1 4,577,078 (1.) 3,611,384 (2.) 1,692,651 (5.) 448,165 346,430 284,347 2 2,288,539 (3.) 1,805,692 (4.) 846,326 (11.) 224,083 173,215 142,174 3 1,525,693 (6.) 1,203,795 (7.) 564,217 149,388 115,477 94,782 4 1,144,270 (8.) 902,846 (10.) 423,163 112,041 86,608 71,087 5 915,416 (9.) 722,277 338,530 89,633 69,286 56,869 6 762,846 (12.) 601,897 282,109 74,694 57,738 47,391 7 653,868 515,912 241,807 64,024 49,490 40,621
Percentage of votes 40.07% 31.61% 14.82% 3.92% 2.65% 3.41% Percentage of seats 50.00% 33.33% 16.67% 0.00% 0.00% 0.00% Dis/advantage 9.93% 1.72% 1.85% -3.92% -2.65% -3.41% Total seats 6 4 2 0 0 0 Imperiali
INC 4,577,078
TDP 3,611,384
BJP 1,692,651
AIMIM 448,165
CPM 346,430
CPI 284,347
2 2,288,539 (1.) 1,805,692 (2.) 846,326 (8.) 224,083 173,215 142,174 3 1,525,693 (3.) 1,203,795 (4.) 564,217 149,388 115,477 94,782 4 1,144,270 (5.) 902,846 (7.) 423,163 112,041 86,608 71,087 5 915,416 (6.) 722,277 (10.) 338,530 89,633 69,286 56,869 6 762,846 (9.) 601,897 (12.) 282,109 74,694 57,738 47,391 7 653,868 (11.) 515,912 241,807 64,024 49,490 40,621 8 572,135 451,423 211,581 56,021 43,304 35,543
Percentage of votes 40.07% 31.61% 14.82% 3.92% 2.65% 3.41% Percentage of seats 50.00% 41.67% 8.33% 0.00% 0.00% 0.00% Dis/advantage 9.93% 10.06% -6.49% -3.92% -2.65% -3.41% Total seats 6 5 1 0 0 0

29
2.2 COMPARISON OF MATHEMATIC FORMULAS AND THE IMPACT OF DISTRICT MAGNITUDE
Let me stress once more, that district magnitude is a crucial feature of PR systems. It is directly responsible for the value of effective threshold, which explains 60% of the variability of disproportionality among electoral systems. 34 Teff=50%/(M+1)+50%/2M Table 2.5 lists the values of effective threshold for the Czech electoral system with different average district magnitude. With the increase in district magnitude the effective threshold decreases. An ideal – most proportional – is the case of one country being one district. In such a case even the most disproportional mathematic formulas translate votes into proportional representation. Table 2.5 Effective threshold according to district magnitude35
District Magnitude (number of districts)
Effective Threshold
200.0 (1) 0.3%
25.0 (8) 2.9%
14.3 (14) 5.0%
5.7 (35) 11.8%
Table 2.6 was put together from the 1998 election results of the Czech Assembly recounted according to 7 mathematic formulas. This table gives us a comprehensive set of combinations of mathematic formulas used in electoral systems with different district magnitudes. Disproportionality is here measured by the fraction of votes per seat of the smallest party compared to the party with the most votes – largest deviation index (LD). The negative value indicates that the number of smallest party votes per seat was smaller than the largest party’s. Larger districts do not let the less proportional methods to exercise their disproportionality. Table 2.6 The disproportionality of mathematic formulas36
Number of districts (District magnitude)
1 (200)
8 (25)
14 (14,3)
35 (5.7) Average
Hare quota 2.00% -3.00% 8.00% 62.00% 17.25% Saint-Laguë 2.00% -3.00% 11.00% 69.00% 19.75% Hagenbach-Bischoff quota 4.00% 11.00% 12.00% 73.00% 25.00% mod. Saint-Laguë 2.00% -3.00% 21.00% 143.00% 40.75% Imperiali quota 2.00% 19.00% 22.00% 149.00% 48.00% D'Hondt 2.00% 19.00% 24.00% 193.00% 59.50% Imperiali 4.00% 56.00% 295.00% 2723.00% 769.50% Even the most disproportional mathematic formulas as imperiali, lose their disproportionality once we apply it on district with large magnitude as in the first case where the whole country is one district. When we move to the columns on the right and the district magnitude decreases, 34 As proved above. 35 Data are counted for the electoral system of the Czech Republic, Klima 2001, p. 129 36 For the 1999 Assembly election of the Czech Republic, data from Klima 2001, p. 136
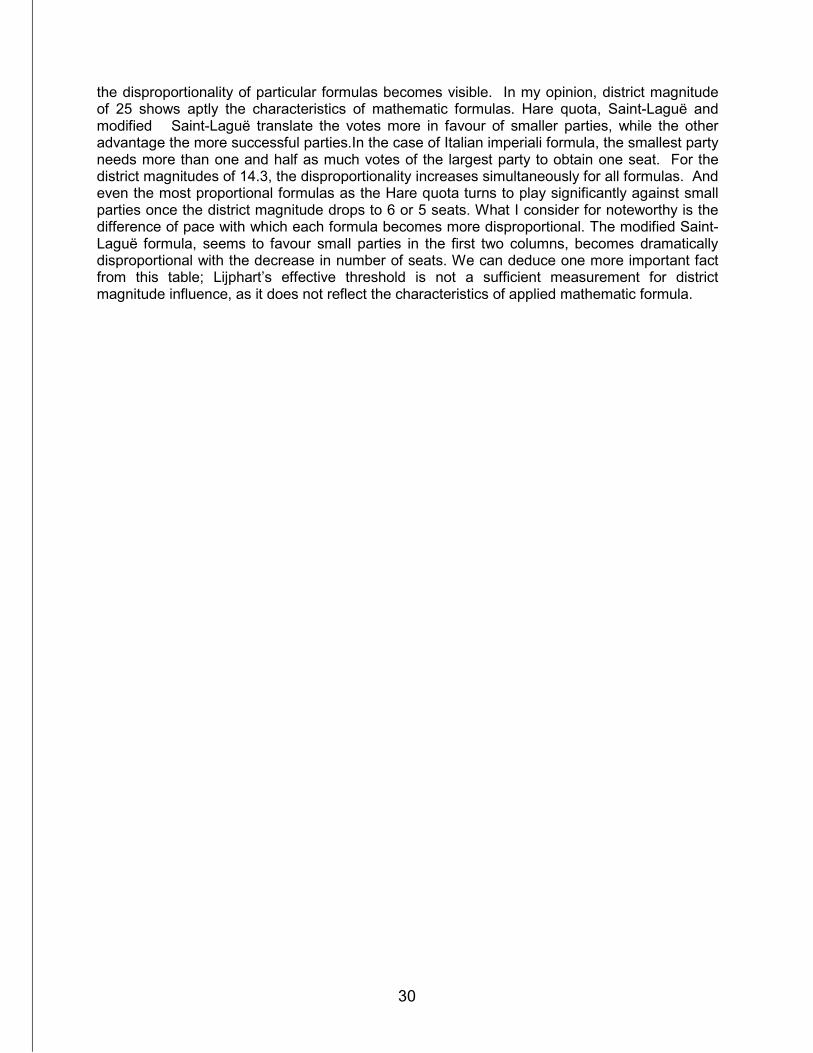
30
the disproportionality of particular formulas becomes visible. In my opinion, district magnitude of 25 shows aptly the characteristics of mathematic formulas. Hare quota, Saint-Laguë and modified Saint-Laguë translate the votes more in favour of smaller parties, while the other advantage the more successful parties.In the case of Italian imperiali formula, the smallest party needs more than one and half as much votes of the largest party to obtain one seat. For the district magnitudes of 14.3, the disproportionality increases simultaneously for all formulas. And even the most proportional formulas as the Hare quota turns to play significantly against small parties once the district magnitude drops to 6 or 5 seats. What I consider for noteworthy is the difference of pace with which each formula becomes more disproportional. The modified Saint-Laguë formula, seems to favour small parties in the first two columns, becomes dramatically disproportional with the decrease in number of seats. We can deduce one more important fact from this table; Lijphart’s effective threshold is not a sufficient measurement for district magnitude influence, as it does not reflect the characteristics of applied mathematic formula.

31
3. CASE STUDIES OF COUNTRIES WITH MMP
3.1 GERMAN ELECTORAL SYSTEM
3.1.1 Historical Development The German electoral system is an archetype of mixed member proportional system. Before I will start with the description of the present German system, let me mention little bit of the historical development of electoral system in German. Till the year 1918 the German Empire used the two round systems. The winner had to gain absolute majority in either of two rounds. This majoritarian system was creating disproportional results that just sharpened the social conflict. After 1919, the Weimar Republic37 introduced pure proportional representation system, which did not employ any electoral threshold. Despite the fact, the number of parliamentary parties did not increase in comparison with the previous period, but vise versa. The fact, that some authors blame the electoral system for allowing Hitler to gain the power, is very simplified and incorrect. The relatively large fragmentation and instability of executive power was a result of many factors. Among these factors we can find the lack of democratic tradition, regional fragmentation (Germany arose from unification of small states), sharp religious, social and regional conflicts – including the conflict between federalism and centralism, economic crisis and many others. That is why it is not adequate to blame proportional representation for helping the NSDAP to the power, when it got only few percent in the first three elections of 1924-1928. It is the reality, that during the last free elections the majority of votes were cast for to the two extreme parties: NSDAP and the communists. Klima argues, that the discontent of the vast majority of society would ventilate in connection of any other party. Moreover, there was a danger that part of the society could digress to non-parliamentarian tools to promote their interests. If the majoritarian system had been imposed during increased political tensions after 1930, the NSDAP would have gained vast victory in the single-member constituencies across the country.38 After the end of the Second World War, Germany was dividend into four occupation zones. In the zones occupied by the western allies, proportional representation was used in the American and French zone, while in the British zone a combine formula of two systems was established. On the local level electors voted for representatives from single-member constituencies according to the British FPTP system. But simultaneously each voter in the British zone had a second vote, which was allocated to the parties under the proportional formula. Final distribution of seats in the parliament was determined by the second vote. This, for its time unique, electoral system became the electoral system of the Federal Republic of Germany and was approved by the parliamentary council in 1949 as part of the Basic Law. Similarly to the Basic Law (the German Constitution) it was originally considered to be provisional. But has remained essentially unchanged since then. The significant changes of the Federal Electoral Law (Bundeswahlgesetz - BWG) can be reflected in these points:
• 1956 enabled the possibility of postal ballot
• 1957 the change in threshold calculation, instead of 5 % in the federal state or city state, or victory in one constituency, the 5% threshold applies on the whole territory or party has to gain at least 3 direct mandates anywhere in Germany
37 The term Weimar Republic is used for the period 1919-1933 after the town of Weimar, where the newly elected legislator met to approve the new democratic constitution. 38 Klíma, M., 1998, p. 234

32
• 1965,1980 redrawing of district boundaries according to population
• 1969 the age for the eligible to stand for election was decreased from 25 to 21 years
• 1970 the age for eligibility to vote was lessen to 18 years
• 1972 the age for the eligible to stand for election was set lower to 18 years
• 1985 The mathematic formula was changed to Hare quota
• 1985 franchise granted to Germans living abroad
3.1.2 System description The German Bundestag has, after the amendment from May 2002, 598 members elected for the period of 4 years. Half of them 299 are elected from single-member constituencies under the FPTP formula, while the other half is elected from the party lists in 16 federal states (Bundesländer) under proportional representation. Every voter has two votes, first (left part of the ballot) for electing a member for the single-member constituency and second for electing party list of candidates form the federal state (Landliste) in the PR system. The party state list is closed, voters can choose only parties - they cannot express their preferences within the party list. The candidates contesting in each constituency are nominated in a secret ballot at the local party conference, which is anchored in the Federal Electoral Law (section 22). The candidate with the plurality of votes in the single-member constituency is elected –direct mandate. In the event of a tie, the district returning officer shall decide the election by drawing lots. The second vote (Zweitstimme) goes for the party candidates on the state list. The total number of seats to be distributed by Proportional Representation (598) is reduced by the number of candidates winning a constituency, nominated by a party, that did not pass the threshold, or without being nominated by a party, or are nominated by a party, without a regional list running in this state. . Remaining seats are distributed on the federal level according to the Hare/Niemayer formula: number of second votes for one part multiplied by the number of seats distributed, divided by the total number of second votes of parties who reached the threshold. As it is basically the modified Hare formula of largest remainders, each party receives one seat for each whole number resulting from this calculation. The remaining seats are then allocated in the descending order of parties’ largest remainders. In a case of one party obtaining an absolute majority of votes, but because of the formula paradox not absolute majority of seats from this state, the Federal Electoral Law makes provision for a calculation modification. In such a borderline case this party would receive an extra seat, which would be otherwise distributed according to the highest averages. If a local committee of a party declares its state list not to be connected with the other regional lists of this party before voting, this state list is considered for the distribution as an own party (but only for the Hare/Niemayer calculation, not for the restrictive clause). The remaining seats are allocated (also by the help of Hare/Niemayer) to the party state lists. The number of seats won by a party in the constituencies is deducted from the number of seats won through party lists in the state. It is possible to be nominated on both levels, the constituency and party list in the federal state. If such a candidate succeeds in the direct mandate, he/she should be disregarded in the land list. On the other hand, if more seats fall to

33
the party list than there are candidates nominated in it, these seats shall remain vacant. A party shall retain seats it has gained in the state constituencies even if the number exceeds the number of party’s seats allocated according to the PR formula on the state level. In such an event, the total number of seats in Bundestag increases by excessive (overhanging) seats (Überhangsmandate). There is no compensation within the party or with other parties.
3.1.3 Electoral Threshold and Party System To keep mini parties out of the parliament the Federal Electoral Law defines an electoral threshold in two conditions (Article 6, Section 6). First, the party has to gain at least five percent of second votes from the whole Federal Republic, or it has to win at least three direct mandates in any of the constituencies. So formulated threshold does not apply to parties representing a national minority (for example the Southern Schleswig Electors’ Association – Fries minority, the party of the Danish minority in Schleswig-Holstein, or the Sorbs in the Free State of Saxony). Many argue that the five percent threshold is the main reason for the sharp reduction in the number of parties represented in the Bundestag over last 50 years.
Table 3.1 Parties represented in Bundestag in 1949, 1957,1980 and 200239
August 1949 September 1957
October 1980 September 2002
(%) Seats (%) Seats (%) Seats (%) Seats SPD 29.2 131 39.7 217 42.9 218 38.5 251 CDU 25.2 115 31.8 169 34.2 174 29.5 190 FDP 11.9 52 7.7 41 10.6 53 7.4 47 CSU 5.8 24 10.5 53 10.3 52 9.0 58 The Greens - - - - 1.5 0 8.6 55 KPD 5.7 15 - - - - - - BP 4.2 17 - - - - - - DP 4.0 17 3.440 17 - - - - Z 3.1 10 - - - - - - WAV 2.9 12 - - - - - - DRP/DKP 1.8 5 1.0 0 - - - - NG 1.0 1 - - - - - - SSW 0.3 1 - - - - - - Independent 3.8 2 - - - - - - We can see in table 3.1 that the number of parties in the German Bundestag dropped from 13 in 1949 to 5 in 1957. The German Party (DP) gained its representation thanks to its 6 victories in constituencies. Then, for more than 20 years between 1961 till 1983 only four parties were 39 Source: I N Press: Election Special, Germany Goes To the Polls on 27 September 1998, ST 4 – 1998, Inter Nationes, Bonn; Party initials: SPD = social Democratic Party, CDU = Christian Democratic Union, FDP = Free Democratic Party, CSU = Christian Social Union (in Bavaria), KPD = Communist Party of Germany, BP = Bavarian Party, DP = German Party, Z = Centre, WAV = union for Economic Recovery, DRP/DKP = German Reich Party/German Conservative Party, NG = Emergency Group, SSW = Southern Schleswig Electoral Association, GB/BHE = Ball-German Block of Expellees and Persons Deprived of Their Rights, GVP = All-German People’s Party, GDP = All-German Party, DFU = German Peace Union, NPD = Nation Democratic Party of Germany, PDS = Party of Democratic Socialism/Left List. 40 DP passed the threshold by wining 6 seats in single-member constituencies.

34
represented in the assembly. As CSU is a sister party of CDU in Bavaria and they are in a permanent alliance, Germany was experiencing a two and half party system. The “half” party FDP was the essential member of all coalition governments from 1961 till 1998 (except the period of grand coalition CDU/CSU + SPD in 1966-1969). For 34 years FDP despite its support fluctuation from 12.8 % in 1961 to only 5.9 in 1969 remained in the government with either CDU/CSU or SPD. The Free Democrats were called the party of second choice, as their gained votes from voters, who cast their first vote for candidate from one of the two major parties, but used their second (more important vote) to support the “half” party essential for coalition building. However, the above table shows as well, that the German model is not only reducing the number of parliamentary parties, but can also admit new political subjects into the assembly. This was the case of the Greens, who were able to attract votes from people across the country concerned with the environment and sustainable development. They competed for the first time in the 1980 election obtaining only 1.5 %, which did not bring them any representation. Over the next two and half year they were successful in campaigning so that they crossed the threshold by 0.6 % and entered the Bundestag in 1983.
3.1.4 Constituencies and their delimitation As the Federal Electoral Law says, the state boundaries have to be respected while delimiting the 299 single-member constituencies. The population of a constituency should not deviate from the average population of the constituencies by more than 15% in either direction. Where the deviation is greater than 25%, the boundaries have to redrawn. This redrawing should respect the boundaries of communes, districts and urban districts where possible. There is a Constituency Commission appointed by the president. It consists of the President of the Federal Statistical Office, a judge from the Federal Administrative court and five other members. They have to report changes in the population figures, and suggest, which changes in the division of electoral area are necessary (details in Article 3, BWG).
3.1.5 Electoral Bodies The Federal Ministry of Interior appoints the Federal Returning Officer and his Deputy. The Federal Returning officer appoints the other eight members of Federal Electoral Committee. On the lower levels, there is the state Electoral Committee for each state and district Electoral Committee for each constituency, the Electoral Board for each polling district, and at least one Electoral Board for each constituency to establish the results of the postal ballot on the same day as the election. The State Returning Officers, District Returning Officers and Electoral Officers and their Deputies are appointed by the State Government or the agency designed by it. The Electoral Committees on the lower level compose of the Returning Officer as chairman and six qualified voters appointed by him as assessors. The Electoral Boards compose of the Electoral Officer as chairman, his Deputy and three to seven other qualified voters appointed by the Electoral officer as assessors. Both Electoral Committees and Boards meet, confer and make their decision in public sessions. The decisions shall be taken by majority vote, in a case of a tie; the Chairman has the casting vote. The assessors of the Electoral Committee and the members of the electoral Board perform their duties in an honorary capacity. Anyone eligible to vote shall be bound to accept this honorary post if it is offered to him. The honorary post may be refused only on substantial grounds. The Federal President determines the Election Day, which should be according to the BWG Sunday or a statutory public holiday.

35
3.2 HUNGARY
Hungary was the first country in Central Europe to have democratic elections after the break down of communism. While their neighbours were still fighting with the old regimes, Hungarian parliament enacted the new Electoral Law (Act no XXXIV of 1989 on The Election of Members of Parliament).
3.2.1 System Description There are 386 legislators sitting in the Hungarian Parliament (Orszaggyules). They can become members of parliament through three ways:
• Hundred and seventy-six legislators are elected from single member constituencies by the two-round system.
• The next group of 152 legislators is elected in 20 multi-member districts through the PR lists.
• Finally, 58 legislators come from the “national list” of candidates.
For its combination of two methods of mixed systems; superposition (as in the parallel system of for example Japan) and correction (as it is used in the classical MMP in Germany) the Hungarian model is sometimes referred to as “supermixed system”. Each voter has two votes, one for the candidate from single member constituency and one for the regional list. A turnout of at least 50% of electors is required fro both, the first round of elections of individual candidates and the elections of regional lists. A candidate from single-member constituency needs 50 % of votes total to win in the first round. If no candidate exceeds the 50% level, or if the turnout in the constituency is less than 50 % of the eligible voters, the second round has to be organized and all candidates who have done so may stand for the election. Only candidates who obtained at least 15 % of votes in the first round can continue in the second. But there has to be at least

36
three candidates in the second round. So if there are no three candidates with at least 15 % votes from the first round, the first three candidates, who have obtained the greatest number of votes, proceed. The winner in the second round has to gain the relative majority of votes, while the turnout has to be at least 25 %. Votes for each of the 20 regional lists are allocated on the regional level employing the Hagenbach-Bischoff formula and two-third rule. The two-thirds rule says, that the party regional list remainder has to be at least 0.67 (2/3) to fill the remaining seat (see chapter 3.1.1 for more details on the Method of Largest Remainders). If after the calculation, there still remains a seat, it shall be added to those obtainable on the national list. If a party regional list gets remaining mandate as specified above, the difference between the numbers of votes required for a mandate and actually received shall be deducted from the national aggregate of surplus votes obtained by the party. The electoral threshold is set to 5 % of the national aggregate of votes cast for the regional lists. Parties presenting a common or combined list do not receive a mandate, if they fail to receive at least 5% per party, or in the case of more than three parties, the total of at least 15% of all votes. The electoral law enables party to present common candidates with different parties in different constituencies or regional districts. In such a case, the votes must be aggregated separately for common candidates, or common or combined lists, when aggregating surplus votes and defining the limit percentage. These parties have to inform the electoral board 8 days before elections of the proportion in which their surplus votes on the common list or the combined ones are to be taken into account in the national aggregation of votes. On the basis of a national aggregate of votes less than required for mandates in single-member and regional constituencies the parties obtain an additional 58 compensatory mandates from the national list. It is an indirect list of a compensatory nature and its seats are allotted in the proportion of surplus votes. Voters cannot directly cast for the national list. Surplus votes are those:
• Which were cast, in an individual constituency during the first valid poll, for party candidates who did not obtain a mandate during either poll,
• Or, which were cast for lists, in a regional district during a valid poll, in a number smaller than required for a mandate, or which exceeded the number of votes required for mandate.
Votes cast for parties, who did not pass the electoral threshold are not considered to be surplus votes. If the number of announced candidates is smaller than the number of mandates on the list, the remaining mandates shall remain vacant. The electoral law also enables one person to be put forward as a candidate concurrently in one individual constituency, one territorial list and on the national list. If a candidate has obtained a mandate in the individual constituency, his name shall be stricken from the territorial or the national list. If he has obtained a mandate on the territorial list, his name shall be stricken from the national list.
3.2.2 Constituencies and nomination of candidates There are 176 single-member constituencies for elections under FPTP across the country. The law schedule determines the number of single-member constituencies in each county and in the capital. The country is divided into 20 regional districts for the second vote distributed under the system of proportional representation. These districts correspond to the territory of 19 counties and the capital. Their magnitude varies significantly – from 4 to 33 seats. The average number

37
of seats per district is than 7.6. This relatively small district magnitude causing high effective threshold is counterbalanced by the transfer of votes without seats to national list. Each voter has to be informed of his inclusion in the register of voters by an announcement no later than on the 58th day prior to Election Day. For the nomination of candidates the proposal coupon sent along with the announcement is vital. Candidates elected under FPTP can be proposed only by voters having domicile in their constituency. Each candidate (individual or party) needs at least 750 proposal coupons. Each elector can propose only one candidate. To put up a regional list in a district a party has to nominate individual candidates in either one fourth or at least two constituencies of the particular district. Parties registering candidates in at least seven regional constituencies are entitled to put up a national list. If parties nominate jointly individual candidates, they may also jointly present their regional or national list.
3.3 ELECTORAL REFORM IN MEXICO
Mexican Union underwent a substantive political and electoral reform in 1996. This process of electoral reforms started a decade before in 1987. These systematic changes resulted in the most democratic elections in Mexico’s history in 2000. Mexico’s long-time ruling part, the PRI (Partido Revolucionario Institucional) – in power for more than 70 years- was for the fist time voted out of the office. Within several weeks, a huge percentage of citizens changed their minds about the existence of democracy in Mexico as a consequence of Vincent Fox’s electoral victory. The three pillars of Mexico’s new electoral system are:
1. an autonomous and impartial election commission, 2. the judicialization of election conflict resolution 3. and comprehensive oversight of elections by political parties and independent
observers. As my study deals mainly with electoral systems in their narrower definition, as a method of translating parties’ votes into parties’ seats, I do not want to describe the howbeit highly interesting process of systemic political reforms in Mexico. For this reason I enclose to this study papers concerning the reformation process.
3.3.1 System Description The Union Congress has two chambers. The lower chamber is constituted by 500 deputies elected every three years. Three hundred of them are elected from single-member constituencies under the FPTP formula. The federal Lower Chamber members are elected for a three-year term and may not be reelected for the following term. The rest of 200 assembly members are elected under the list proportional representation in five multi-member districts. All districts have the same magnitude of forty members. A political party can proceed to the registration of its regional list of candidates in these districts, only if it registered candidates in at least 200 out of 300 single-member constituencies. The regional lists are similarly to the German example closed, which does not give the voters any possibility to change the order of candidates on the list. The electoral law allows a party to register up to sixty candidates in both single-member constituencies as individuals and on regional lists in multi member districts. A single party can gain maximum of 300 seats. This electoral law provision has to be respected while allotting seats under the PR formula. So fare looks the Mexican electoral system like a typical parallel system with 60% percent of legislators elected under FPTP and 40 % elected in

38
multi-member districts under PR. Nevertheless, the election law sets the maximum percentage of over-representation. No party can gain more than 8 percent extra seats share compared to its vote share under both formulas. No postal voting is allowed; the voter has to be present on the Mexican territory during the elections.
3.3.2 Electoral Threshold According to the current law, a party must gain at least 2 percent of total votes to have representation under the proportional formula.
3.3.3 Constituencies and their delimitation The 300 seats elected under the plurality formula are distributed among 32 federal states according to the percentage of their population. For this purpose, the results of every ten years conducted censuses have to be considered. However, according to the constitutional provision, no entity is allowed to have fewer than two deputies elected from single-member constituencies. The number of constituencies thus varies significantly between the states. The four smallest states have only the minimum of two constituencies, while the largest Mexico City elects candidates under FPTP in 36 constituencies.
3.3.4 Electoral Bodies Electoral reforms would not be possible with a complete reform of the Federal Electoral Institute (FEI), the organ in charge of administering and controlling the electoral process. The FEI went into operation in October 1990, as a result of the constitutional reforms of 1989 and the new Federal Code of Institutions and Electoral Procedures. The importance of the citizen advisors within the EFI was increased, conferring upon them the majority of votes. The powers of the management organs at state and district level were extended. The FEI has also increased powers in naming of candidates and setting limits for campaign expenses. The 1996 reform reinforced the autonomy of the Federal Electoral Institute by its separation form the Executive power and reserved the vote within the management organs only to the citizen advisors. The FEI must now carry out a broad set of tasks from permanent updating and correcting of the registers and voters lists, through matter related to funding and access to media, to calculation of electoral results. General council
3.4 THE ELECTORAL REFORM IN NEW ZEALAND
The voting reform in New Zealand was done after a thorough research, followed by debates and public consultations. As the reform process in New Zealand was not undertaken lightly, all political scientists agree, that it is a good example for other countries.
3.4.1 Ten Years of Electoral Reform New Zealand decision for dramatic change in its voting system was a big surprise for many, who did not closely follow political development in this remote country. For 138 years, New Zealand had a pure Westminster system, which was said to be “more British, than Britain”. It was a combination of majoritarian formula with centralized government.41 For a long time, this
41 Lijphart, in his “Democracies” (1984) considered New Zealand’s system to be the example par excellence of Westminster system and a direct opposite to the consensual democracy with proportional representation in another example country - Belgium.

39
system was producing Westminster parliament with single party governments and a stabile party system. The public debate was initiated after the parliamentary election of 1978 and 1981. In both elections, the Labour Party won the majority of votes trough out the country, but the National Party won more seats in parliament and thus formed the government. Furthermore, the third largest party in New Zealand gained respectable 16 % of votes, respectively over 20% of votes in the latter elections, but was represented only by one and after the 1981 election two members of parliament. When finally in 1984 the Labour Party gained the office, the government established a Royal Commission on the Electoral System to consider proportional representation or preferential voting of all or specific number of legislators. The Royal Commission was conducting a research for two years, till it released a report testing FPTP and other voting systems. This report quoted ten criteria, with an unequal weight, which an ideal electoral system should meet. These were:
• Fairness between political parties, • Effective representation of minority and special interest groups, • Effective Maori representation (Maori is the indigenous community in New Zealand) • Political integration, • Effective representation of constituents, • Effective voters’ participation • Effective government • Effective parties • Effective parliament • And legitimacy However, the Commission stressed out that there is no ideal system that can meet all criteria at one time. The Royal commission surprisingly rejected the “British” proportional System of Single Transferable Vote and proposed that New Zealand should adopt the Mixed Member Proportional System very similar to that one used in Germany. The main reasons for this decision were, as stated in the Report, that the results of MMP election were “likely to be more proportional” than those under STV. The Commission also recommended organizing a referendum on the adoption of MMP. Despite the fact that a selected committee of New Zealand’s Parliament disagreed, thanks to the political pressure first plebiscite was held in 1992. The first not binding but indicative referendum showed an overwhelming support for both, the change of voting system and the MMP. The second, binding referendum was organized in 14 months. To ensure balance, impartiality and neutrality, the minister of justice appointed an independent Electoral Referendum Panel, which was active prior to both referendums. Headed by Chief Ombudsman and having substantial budget its task was to inform voters about advantages and disadvantages of the different options in each of the referendums. In the second plebiscite, voters were to decide between FPTP and MMP in the form suggested by the Royal Commission. The Mixed Member proportional system won 53.9 % of the referendum votes.
3.4.2 System Description The lower chamber of parliament - the House of Representatives – has after the reform 120 members. Sixty-five legislators are elected from single-member constituencies under the old FPTP system. The remaining fifty-five seats are to be allotted from a national party lists by proportional representation. Each voter has than similarly to Germany two split votes (but in a different order), first to vote for the national party list of candidates and second to elect individual candidate from his/her constituency. From these two votes, the first one is more important, because it decides the proportional comparison of the lower chamber. These votes are allocated to party lists under the pure Saint-Leaguë Formula. Candidates can be nominated

40
in both types of election. If he/she does not succeed in a single member constituency, he/she can be elected from the party list.
3.4.3 Electoral Threshold Also similarly to the German system, the new electoral law employs legal threshold for parties to enter the parliament in two ways. A party has to gain at least 5% of the total of national votes cast for all national list or at least one direct seat from a single-member constituency.
3.4.4 Reform results The first elections conducted under the MMP formula were in 1996. Thanks to the previous public discussion about the outcome of proportional system, it left no one surprised that six parties got their representatives in the lower chamber. While in the previous FPTP elections only two major parties gained significant number of seats in the parliament leaving parties with less than 30 percent of votes unrepresented. (as table 3.3 shows the 1993 election results for comparison). Table 3.2 Election Results from New Zealand, October 1996
Single-Member Constituencies Party List Seats Seats
Seats Total
Party Votes (%) Number %
Votes (%) Number % Number %
NZ National Party 33.90 30 46.15 33.82 14 25.45 44 36.67 Labour Party 31.08 26 40.00 28.19 11 20.00 37 30.83 New Zealand First 13.49 6 9.23 13.36 11 20.00 17 14.17 Alliance 11.25 1 1.54 10.10 12 21.82 13 10.83 ATC 3.75 1 1.54 6.10 7 12.73 8 6.67 Christion Coalition 1.55 - - 4.33 - - - - Legalize Cannabise 0.17 - - 1.66 - - - - United New Zealand 2.07 1 1.54 0.88 - - - - Others 2.74 - - 1.56 - - - - Total 100.00 65 100.00 100.00 55 100.00 120 100.00 Table 3.2 demonstrates also, how seats from national party lists compensate losses of smaller parties in single-member districts. For example the Labour Party winning 28.19 % of votes trough the national list gets the same number of 11 seats as New Zealand First, who obtained 13.36 % of votes under PR. The Alliance with 10.10 % of vote share, but only one mandate from single-member constituencies, was allotted even 12 seats. If we compare the last column of seat shares with the column of party list’s votes shares we discover, that the final seat allocation corresponds to the proportional representation. Table 3.3 Election results from the last FPTP election in New Zealand in 199342
Party Votes (%) Seats NZ National Party 33.90 50 Labour Party 31.08 45 New Zealand First 13.49 2 Alliance 11.25 2 Others 3.75 0 Total 100.00 89
42 Source: Electoral Commission, New Zealand, www.elections.org/elections

41
APPENDIX A. MEASURES OF DISPROPORTIONALITY
Disproportionality of electoral system in my study means the deviation of parties seat shares from their vote shares. While this seams to be very simple, there is a number of ways how disproportionality of electoral system can be measured. This short introduction to the measurements of disproportionality is an abstract from Lijphart’s explanation on why he uses least-squares index for his comparison of electoral systems. 43 While some authors prefer the simplest measure of largest deviation (LD), which is basically the percentage of overrepresentation of the largest party, other developed more sensitive and accurate measures. All of them begin by noting the difference between percentages of the votes and percentages of the seats received, but they disagree on how these seat and vote share deviations should be aggregated. The oldest measure developed by Douglas W. Rae uses the average of deviations, that is, it sums the absolute differences between the vote percentages (vi) and seat percentages (si) and than divides by the number of parties (n):
I = 1/n ∑ |vi – si|. The disadvantage of Rae index is its sensitiveness to large number of small parties. As the example B shows, many small parties higher the “n” value without significant |vi – si| remainder. This tends to understatement of disproportionality. The sensitiveness of five measures of disproportionality
The Loosemore-Hanby44 index (D) avoids Rae’s problem and has also become very popular measure of disproportionality. The absolute value of all vote-share differences are added, as for the Rae index, but than divided by two, instead of Rae’s division by number of parties:
D = 1/2 ∑ |vi – si|.
43 Lijphart 1994, p. 58 44 As its name suggests, this index was proposed by John Loosemore and Victor J. Hanby in “The theoretical Limits of Maximum Distortion: Some Analytic Expressions for Electoral Systems” British Journal of Political Science, 1 (1971).
Example Number of parties
Votes (%) Seats (%) Difference (%)
A 1 1
55 45
60 40
5 5
I (Rae index) = 5.00 D (Loosemore-Hanby index) = 5.00 LSq (least-squares index) = 5.00 LD (largest-deviation index) = 5.00 b (regression coefficient) = 2.00
B 1 1 10
50 40 1
55 45 0
5 5 1
I (Rae index) = 1.67 D (Loosemore-Hanby index) = 10.00 LSq (least-squares index) = 5.48 LD (largest-deviation index) = 5.00 b (regression coefficient) = 1.13
C 5 5
15 5
16 4
1 1
I (Rae index) = 1.00 D (Loosemore-Hanby index) = 5.00 LSq (least-squares index) = 2.24 LD (largest-deviation index) = 1.00 b (regression coefficient) = 1.20

42
If we now have a look at the A and B examples, we should be satisfied with the direction of change. In comparison to Rae’s index Loosemore-Hanby’s rightly increased, as the disproportionality in example B is apparently higher. But on the other hand, its value seems to be exaggerated. By replacing Rae’s number of parties “n” for constant of “2” it tends to exaggerate the disproportionality of party systems with many parties. For instance it allocates the same value to the highly proportional case in example C as to the less proportional A. Michael Gallagher proposed excellent solution in the form of the least-squares index (LSq). It steers a middle course between the Rae and Loosemore-Hanby indicies. Its key feature is that it registers a few large deviations much more strongly than a lot of small ones. The vote-seat share differences for each partuy are squared and then added; this total is divided by two; and finally the square root of this value is taken:
LSq=√[1/2∑(vi-si)2] This index gives us the same values as Rae’s and Loosemore-Hanby index for the example of two parties as in A, but for the other cases B and C are its values more realistic and sober.

43
BIBLIOGRAPHY:
Lijphart, A., Electoral System and Party System: A study of Twenty-Seven Democracies, 1945-1990, Oxford University Press, New York, 1994
Lijphart, A., Democracies; Patterns of Majoritarian and Consensus Government in Twenty-One Countries, Yale University Press, New Haven and London, 1984
Reynolds, A.; Reilly, B., Electoral system Design, International Institute for Democracy and Electoral Assistance, Stockholm, 1997
LeDuc, L.; Niemi, R.G.; Norris, P.; Comparing Democracies, Sage Publications, New Delhi, 1996
Klíma, M.; Volby a politické strany v moderních demokraciích, Radix, Prague, 1998 Klíma, M.; Kvalita demokracie v České Republice a volební inženyrství, Radix, Prague, 2001 I N Press: Election Special, Germany Goes To the Polls on 27 September 1998, ST 4 – 1998,
Inter Nationes, Bonn Katz, S. Richard, Electoral Reform in Italy, Modifying a Pure PR System, Center for Voting
and Democracy, http://www.fairvote.org/reports/1993/katz.html Pecháček, Š.; Kolář, P., Volební systémy ve vybraných zemích, Parlamentní institut, Praha,
2000 Pecháček, Š., Vliv zmĕn volebního systému na system politických stran, Parlamentní institut,
Praha, 1999 Santolaya, P.; Iniquez, D., Electoral Reform in Mexico, www.aceproject.org, 1999 Electoral Law of Hungary; Act no. XXXIV of 1989 on the Election of Members of Parlaiment,
source: National Electoral Committee; www.election.hu Federal Electoral Law (Bundeswahlgesetz), with the last amendment from 7th May 2002
(BGBI. I S. 1529)