Embed Size (px)
Citation preview
lable at ScienceDirect
Energy 109 (2016) 294e309
Contents lists avai
Energy
journal homepage: www.elsevier .com/locate/energy
Comparative studies on control systems for a two-blade variable-speed wind turbine with a speed exclusion zone
Jian Yang a, Dongran Song a, b, Mi Dong a, *, Sifan Chen b, Libing Zou b, Josep M. Guerrero c
a School of Information Science and Engineering, Central South University, Changsha, PR Chinab China Ming Yang Wind Power Group Co., Ltd., Zhongshan, PR Chinac Department of Energy Technology, Aalborg University, Denmark
a r t i c l e i n f o
Article history:Received 2 November 2015Received in revised form17 March 2016Accepted 24 April 2016
Keywords:Two-blade variable speed wind turbineControl systemSpeed exclusion zoneTower resonancePower captureTower loads
* Corresponding author.E-mail address: [email protected] (M. Dong).
http://dx.doi.org/10.1016/j.energy.2016.04.1060360-5442/© 2016 Elsevier Ltd. All rights reserved.
a b s t r a c t
To avoid the coincidence between the tower nature frequency and rotational excitation frequency, a SEZ(speed exclusion zone) must be built for a two-blade wind turbine with a full rated converter. Accordingto the literature, two methods of SEZ-crossing could be adopted. However, none of them have beenstudied in industrial applications, and their performance remains unclear. Moreover, strategies on powerregulation operation are not covered. To fully investigate them, this paper develops two control systemsfor a two-blade WT (wind turbines) with a SEZ. Because control systems play vital roles in determiningthe performance of the WT, this paper focuses on comparative studies on their operation strategies andperformance. In these strategies, optimal designs are introduced to improve existing SEZ algorithms.Moreover, to perform power regulation outside the SEZ, two operation modes are divided in the pro-posed down power regulation solutions. The developed control systems’ performance is confirmed bysimulations and field tests. Two control systems present similar capabilities of power production andSEZ-bridging. Nevertheless, at the cost of significantly increased tower loads, one captures 1% moreenergy than the other. Overall consideration must be made for the control system selection for a WT witha SEZ.
© 2016 Elsevier Ltd. All rights reserved.
1. Introduction
A wind turbine system is a system that converts mechanicalenergy obtained from wind into electrical energy through agenerator. It can be categorized by types of generators used, powercontrol methods, constant- or variable-speed operations, andmethods of interconnection with the grid [1]. To ensure high per-formance while minimizing costs, new solutions are developedconstantly for WT (wind turbines) (). Fundamental changes havebeen addressed, such as continuously variable transmissions [2,3]and new sensing technologies [4,5]. Meanwhile, advanced controlalgorithms have been widely studied, such as soft computingtechniques [6,7] and sustainable control [8]. Despite the develop-ment of good concepts in recent years, engineering and sciencechallenges still exist.
Modern high power WTs are typically designed in a variable-speed type, capturing wind energy and reducing the mechanic
loads effectively. However, a wide speed operation region allowsthe resonance between rotor rotary frequency and natural fre-quencies of other structural components. To tackle underlyingproblems, some methodologies are applied during the designphase, including natural characteristic calculations and potentialresonance analyses [9]. Considerations include not only the certaingap reserved among the natural frequencies of the blades, towerand driver train but also the avoidance of coincidences amongnatural frequencies and external resonance force [10]. It is rec-ommended that the eigen-frequency of the rotor blade be outsidea 12% range of the rotational frequency of the WT and the lowestmode frequency of the tower be kept outside ranges defined as±10% of the rotor frequency and ±10% of the blade passing fre-quency [11]. In practical applications, the tower resonance isdangerous because it results in the vibration of the whole WT set.For a three-blade WT, it is possible to move the natural frequencyto the region between 1 P and 3 P by redesigning the tower'sthickness and radius. However, this approach does not work for atwo-blade WT because changing the tower's natural frequency tobe lower than 1 P or higher than 2 P will greatly increase the cost.Therefore, to prevent the WT from operating in the SEZ (speed
Nomenclature
qset,qm the pitch angle set-point and the measured pitchangle.
wA,wB,wC, wD four speed points at optimal tip speed section.wb,wc the lower and upper speed boundaries of the
speed exclusion zone.wo the critical speed of a two-blade wind turbine.wr p the speed reference of the pitch controllerwr pl, wr ph wr p in low power mode and high power modewr t the speed reference of the PI torque controllerwr tl,wr th wr t in low power mode and high power modewr m the measured rotor speedTopt the optimal generator torquePset the power command from wind farm controller
Prated, Pm the rated power and the measured electrical powerPset b the power set-point to the boost converter
controllerPl the power set-point from the lookup torque
controllerPl l, Pl h Pl in low power mode and high power modePB, PC the power set-points at rotor speeds wB and wC
PE, PF the upper and lower power limits at the speedboundaries wb and wc
Pl1, Pl2, Pl3 three power limits at the speed boundary wc
Ph1, Ph2, Ph3 three power limits at the speed boundary wb
ttask,tcross time of control system task and set time to cross theSEZ
Hs, Hm,Hl three hysteresis timeMx, My, Mz the rolling, nodding and yawing moments
Table 1Specifications of the studied WT.
Parameters Value
Rotor diameter 110 mNumber of rotor blades 2Rated electrical power 3000 kWRotor speed range 6.0e21.0 rpmNominal rotor speed 16.2 rpmRated wind speed 12.2 m/sRotor moment of inertia 1:5� 107kg$m2
Generator moment of inertia 2:1� 103kg$m2
Gearbox ratio 23.94Cut-in wind speed 3 m/sCut-out wind speed 20 m/s
J. Yang et al. / Energy 109 (2016) 294e309 295
exclusion zone), the only feasible way is to redesign the controlsystem.
Control algorithms for a WT with a SEZ are described inprevious works [12e17]. Among these works, two control ap-proaches can be distinguished. The first one, recorded in [12], isbased on the torque control with a conventional lookup table.The second one, proposed in [13e15], is developed based on aproportional integral (PI) torque control method. In both ofthem, a certain speed region, including the critical speed and itsvicinity, is built up to form the SEZ. Differences between themare the means of establishing and bridging over the SEZ. The firstapproach is to create an ambiguous function between rotorspeed and generator torque, so that the generator can accelerateto cross the SEZ, through an unbalanced relation between theaerodynamic torque and demanded generator torque. The sec-ond is to gradually adjust the speed reference from one fixedspeed boundary to another. Despite the two approaches avail-able, studies about their applications in real wind turbines arefew. As far as we know, only in [16] are different widths of SEZs,based on the second approach, investigated and validated on a1.3 kW test rig. In addition, in [17], the first approach isemployed for the design of a two-bladed WT's control system. Inthe wind energy industry, control strategy validation throughfield trials is vital and irreplaceable. Based on field trials andrelated data analysis, for the control approach applied in [17],two drawbacks are exposed: i) the experimental turbine fails tocross over the SEZ under certain wind conditions; ii) the powercapture performance is unsatisfactory. Therefore, optimizationtechniques must be further investigated. Moreover, the perfor-mance of available control approaches is not studied in theliterature, which is vital for WT designers and owners to select acontrol system for a WT with a SEZ.
The control strategies discussed above are utilized only tomaximize power production while maintaining the desired rotorspeed and avoiding equipment overloads [18]. Currently, windfarms are required to play roles similar to those of conventionalpower plants in power systems [19]. As a result, WTs are com-manded to regulate power according to the power set-points set bycentral control systems of wind farms. Thus, these WTs mustperform three power generation tasks: power optimization, powerlimitation, and power regulation. These three tasks are fulfilled in acertain operation region, constrained by the rotor speed. In the caseof aWTwithout a SEZ, it is necessary only to limit the rotor speed tothe speed reference by the pitch controller under the power limi-tation. To date, many studies have focused on generic WTs,
especially those with doubly fed induction generators [20e24]. Fora WT with a SEZ, specific control strategies must be studied, whichare required to perform power generation tasks while maintainingthe rotor speed outside the SEZ. However, there is no literature onsuch strategies.
The objective of this work is to perform comparative studies ofcontrol systems for a two-bladed WT with a SEZ. Starting fromavailable methods, this paper develops two control systems toperform power generation taskswhile bypassing the SEZ. For both ofthem, three operation strategies are discussed, including poweroptimization, power limitation and power regulation. In such stra-tegies, optimal designs are introduced to improve existing SEZ al-gorithms and solve their problems. Moreover, to perform powerregulation outside SEZ, simple yet effective down power regulationsolutions are presented. The control strategies are verified throughsimulations and field tests. Their performance is evaluated accordingto International Electro-technical Commission (IEC) standards.
2. Studied two-blade WT
2.1. Basic information
The studied WT is a two-blade 3.0 MW super compact drivemachine. It is manufactured by China Ming Yang Wind PowerCompany, and its specifications are shown in Table 1.
The WT has a super compact structure, and its main bodyconsists of two parts: the energy conversion system and its sup-porting tubular steel tower. The energy conversion system diagramis shown in Fig. 1, including a blade rotor, a low-ratio gearbox, a
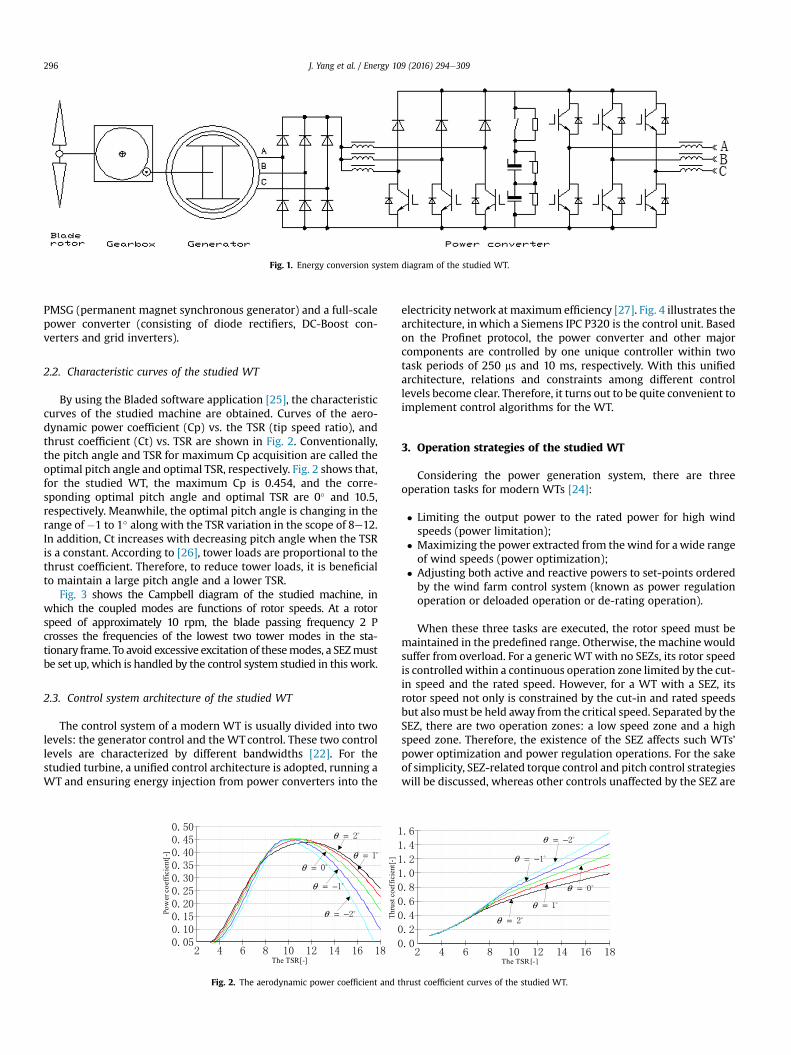
Fig. 1. Energy conversion system diagram of the studied WT.
J. Yang et al. / Energy 109 (2016) 294e309296
PMSG (permanent magnet synchronous generator) and a full-scalepower converter (consisting of diode rectifiers, DC-Boost con-verters and grid inverters).
2.2. Characteristic curves of the studied WT
By using the Bladed software application [25], the characteristiccurves of the studied machine are obtained. Curves of the aero-dynamic power coefficient (Cp) vs. the TSR (tip speed ratio), andthrust coefficient (Ct) vs. TSR are shown in Fig. 2. Conventionally,the pitch angle and TSR for maximum Cp acquisition are called theoptimal pitch angle and optimal TSR, respectively. Fig. 2 shows that,for the studied WT, the maximum Cp is 0.454, and the corre-sponding optimal pitch angle and optimal TSR are 0� and 10.5,respectively. Meanwhile, the optimal pitch angle is changing in therange of�1 to 1� along with the TSR variation in the scope of 8e12.In addition, Ct increases with decreasing pitch angle when the TSRis a constant. According to [26], tower loads are proportional to thethrust coefficient. Therefore, to reduce tower loads, it is beneficialto maintain a large pitch angle and a lower TSR.
Fig. 3 shows the Campbell diagram of the studied machine, inwhich the coupled modes are functions of rotor speeds. At a rotorspeed of approximately 10 rpm, the blade passing frequency 2 Pcrosses the frequencies of the lowest two tower modes in the sta-tionary frame. To avoid excessive excitation of thesemodes, a SEZmustbe set up, which is handled by the control system studied in this work.
2.3. Control system architecture of the studied WT
The control system of a modern WT is usually divided into twolevels: the generator control and the WTcontrol. These two controllevels are characterized by different bandwidths [22]. For thestudied turbine, a unified control architecture is adopted, running aWT and ensuring energy injection from power converters into the
Fig. 2. The aerodynamic power coefficient and t
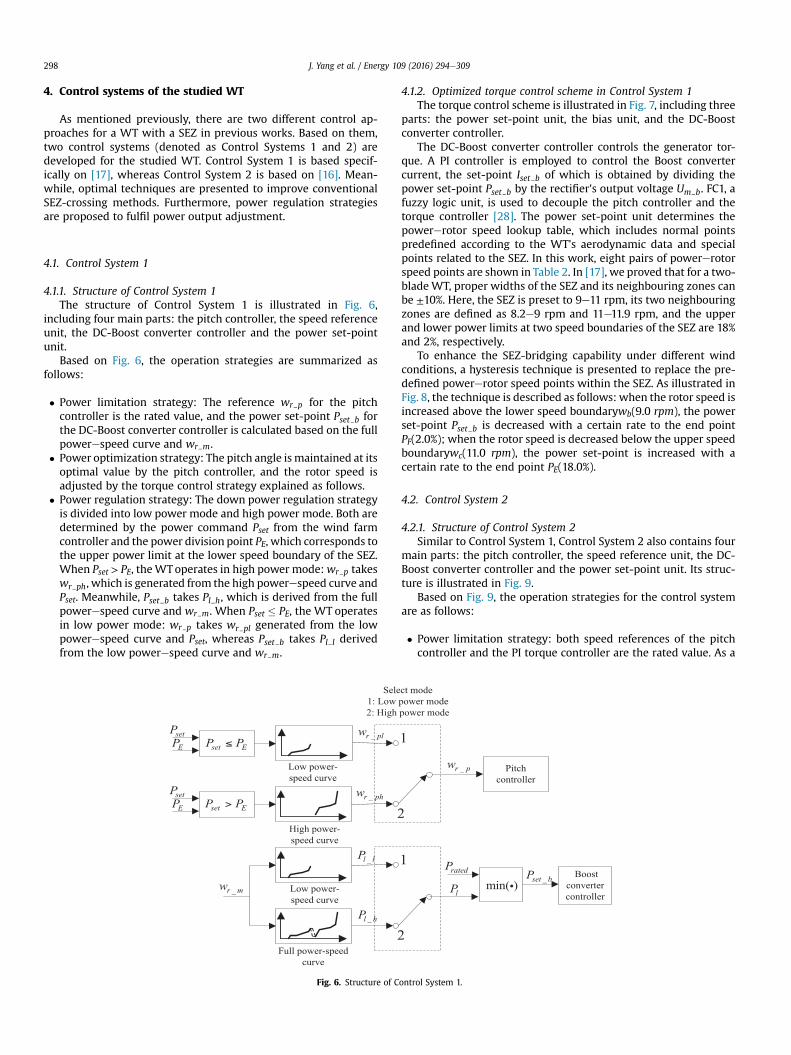
electricity network at maximum efficiency [27]. Fig. 4 illustrates thearchitecture, in which a Siemens IPC P320 is the control unit. Basedon the Profinet protocol, the power converter and other majorcomponents are controlled by one unique controller within twotask periods of 250 ms and 10 ms, respectively. With this unifiedarchitecture, relations and constraints among different controllevels become clear. Therefore, it turns out to be quite convenient toimplement control algorithms for the WT.
3. Operation strategies of the studied WT
Considering the power generation system, there are threeoperation tasks for modern WTs [24]:
� Limiting the output power to the rated power for high windspeeds (power limitation);
� Maximizing the power extracted from thewind for a wide rangeof wind speeds (power optimization);
� Adjusting both active and reactive powers to set-points orderedby the wind farm control system (known as power regulationoperation or deloaded operation or de-rating operation).
When these three tasks are executed, the rotor speed must bemaintained in the predefined range. Otherwise, the machine wouldsuffer from overload. For a generic WT with no SEZs, its rotor speedis controlled within a continuous operation zone limited by the cut-in speed and the rated speed. However, for a WT with a SEZ, itsrotor speed not only is constrained by the cut-in and rated speedsbut alsomust be held away from the critical speed. Separated by theSEZ, there are two operation zones: a low speed zone and a highspeed zone. Therefore, the existence of the SEZ affects such WTs’power optimization and power regulation operations. For the sakeof simplicity, SEZ-related torque control and pitch control strategieswill be discussed, whereas other controls unaffected by the SEZ are
hrust coefficient curves of the studied WT.
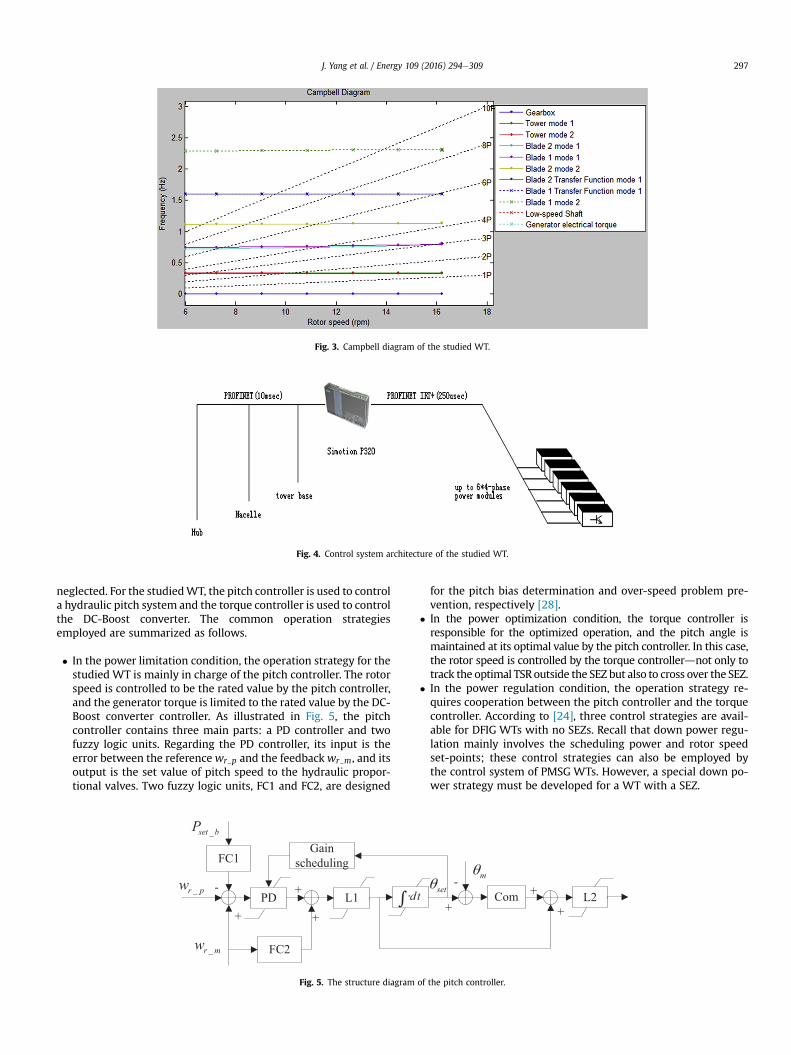
Fig. 3. Campbell diagram of the studied WT.
Fig. 4. Control system architecture of the studied WT.
J. Yang et al. / Energy 109 (2016) 294e309 297
neglected. For the studiedWT, the pitch controller is used to controla hydraulic pitch system and the torque controller is used to controlthe DC-Boost converter. The common operation strategiesemployed are summarized as follows.
� In the power limitation condition, the operation strategy for thestudied WT is mainly in charge of the pitch controller. The rotorspeed is controlled to be the rated value by the pitch controller,and the generator torque is limited to the rated value by the DC-Boost converter controller. As illustrated in Fig. 5, the pitchcontroller contains three main parts: a PD controller and twofuzzy logic units. Regarding the PD controller, its input is theerror between the referencewr p and the feedbackwr m, and itsoutput is the set value of pitch speed to the hydraulic propor-tional valves. Two fuzzy logic units, FC1 and FC2, are designed
-
+
_r mw
L1 d
FC2
+
+
FC1
_set bP
PD
Gainscheduling
_r pw
Fig. 5. The structure diagram
for the pitch bias determination and over-speed problem pre-vention, respectively [28].
� In the power optimization condition, the torque controller isresponsible for the optimized operation, and the pitch angle ismaintained at its optimal value by the pitch controller. In this case,the rotor speed is controlled by the torque controllerdnot only totrack the optimal TSRoutside the SEZ but also to cross over the SEZ.
� In the power regulation condition, the operation strategy re-quires cooperation between the pitch controller and the torquecontroller. According to [24], three control strategies are avail-able for DFIG WTs with no SEZs. Recall that down power regu-lation mainly involves the scheduling power and rotor speedset-points; these control strategies can also be employed bythe control system of PMSG WTs. However, a special down po-wer strategy must be developed for a WT with a SEZ.
m
t Comset
+
-+
+L2
of the pitch controller.
J. Yang et al. / Energy 109 (2016) 294e309298
4. Control systems of the studied WT
As mentioned previously, there are two different control ap-proaches for a WT with a SEZ in previous works. Based on them,two control systems (denoted as Control Systems 1 and 2) aredeveloped for the studied WT. Control System 1 is based specif-ically on [17], whereas Control System 2 is based on [16]. Mean-while, optimal techniques are presented to improve conventionalSEZ-crossing methods. Furthermore, power regulation strategiesare proposed to fulfil power output adjustment.
4.1. Control System 1
4.1.1. Structure of Control System 1The structure of Control System 1 is illustrated in Fig. 6,
including four main parts: the pitch controller, the speed referenceunit, the DC-Boost converter controller and the power set-pointunit.
Based on Fig. 6, the operation strategies are summarized asfollows:
� Power limitation strategy: The reference wr p for the pitchcontroller is the rated value, and the power set-point Pset b forthe DC-Boost converter controller is calculated based on the fullpowerespeed curve and wr m.
� Power optimization strategy: The pitch angle is maintained at itsoptimal value by the pitch controller, and the rotor speed isadjusted by the torque control strategy explained as follows.
� Power regulation strategy: The down power regulation strategyis divided into low power mode and high power mode. Both aredetermined by the power command Pset from the wind farmcontroller and the power division point PE, which corresponds tothe upper power limit at the lower speed boundary of the SEZ.When Pset > PE, theWToperates in high power mode:wr p takeswr ph, which is generated from the high powerespeed curve andPset. Meanwhile, Pset b takes Pl h, which is derived from the fullpowerespeed curve and wr m. When Pset � PE, the WT operatesin low power mode: wr p takes wr pl generated from the lowpowerespeed curve and Pset, whereas Pset b takes Pl l derivedfrom the low powerespeed curve and wr m.
Fig. 6. Structure of C
4.1.2. Optimized torque control scheme in Control System 1The torque control scheme is illustrated in Fig. 7, including three
parts: the power set-point unit, the bias unit, and the DC-Boostconverter controller.
The DC-Boost converter controller controls the generator tor-que. A PI controller is employed to control the Boost convertercurrent, the set-point Iset b of which is obtained by dividing thepower set-point Pset b by the rectifier's output voltage Um b. FC1, afuzzy logic unit, is used to decouple the pitch controller and thetorque controller [28]. The power set-point unit determines thepowererotor speed lookup table, which includes normal pointspredefined according to the WT's aerodynamic data and specialpoints related to the SEZ. In this work, eight pairs of powererotorspeed points are shown in Table 2. In [17], we proved that for a two-blade WT, proper widths of the SEZ and its neighbouring zones canbe ±10%. Here, the SEZ is preset to 9e11 rpm, its two neighbouringzones are defined as 8.2e9 rpm and 11e11.9 rpm, and the upperand lower power limits at two speed boundaries of the SEZ are 18%and 2%, respectively.
To enhance the SEZ-bridging capability under different windconditions, a hysteresis technique is presented to replace the pre-defined powererotor speed points within the SEZ. As illustrated inFig. 8, the technique is described as follows: when the rotor speed isincreased above the lower speed boundarywb(9.0 rpm), the powerset-point Pset b is decreased with a certain rate to the end pointPF(2.0%); when the rotor speed is decreased below the upper speedboundarywc(11.0 rpm), the power set-point is increased with acertain rate to the end point PE(18.0%).
4.2. Control System 2
4.2.1. Structure of Control System 2Similar to Control System 1, Control System 2 also contains four
main parts: the pitch controller, the speed reference unit, the DC-Boost converter controller and the power set-point unit. Its struc-ture is illustrated in Fig. 9.
Based on Fig. 9, the operation strategies for the control systemare as follows:
� Power limitation strategy: both speed references of the pitchcontroller and the PI torque controller are the rated value. As a
ontrol System 1.
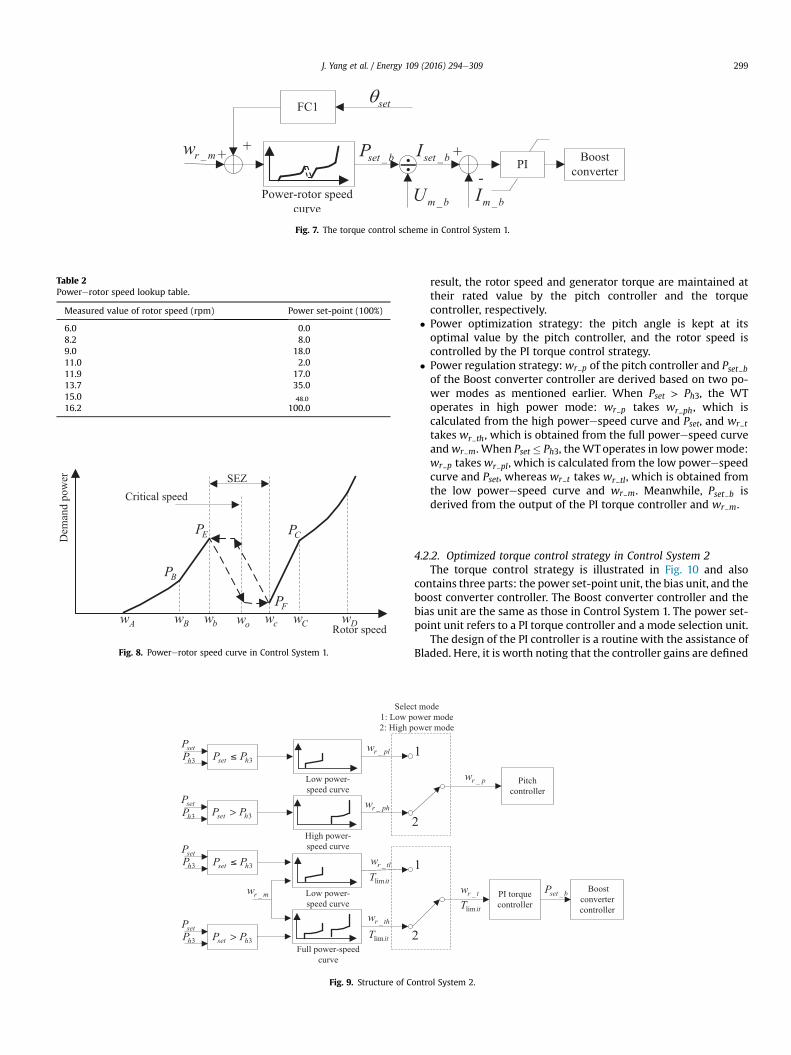
Fig. 7. The torque control scheme in Control System 1.
Table 2Powererotor speed lookup table.
Measured value of rotor speed (rpm) Power set-point (100%)
6.0 0.08.2 8.09.0 18.011.0 2.011.9 17.013.7 35.015.0 48.0
16.2 100.0
Fig. 8. Powererotor speed curve in Control System 1.
Selec1: Low p2: High p
3hPsetP
3set hP P _r plw
_r phw
3hPsetP
3set hP P
Low power-speed curve
High power-speed curve
Low power-speed curve
Full power-speedcurve
_r mw
_r tlw
_r thw
lim itT
lim itT
3hPsetP
3set hP P>
3hPsetP
3set hP P>
Fig. 9. Structure of C
J. Yang et al. / Energy 109 (2016) 294e309 299
result, the rotor speed and generator torque are maintained attheir rated value by the pitch controller and the torquecontroller, respectively.
� Power optimization strategy: the pitch angle is kept at itsoptimal value by the pitch controller, and the rotor speed iscontrolled by the PI torque control strategy.
� Power regulation strategy:wr p of the pitch controller and Pset bof the Boost converter controller are derived based on two po-wer modes as mentioned earlier. When Pset > Ph3, the WToperates in high power mode: wr p takes wr ph, which iscalculated from the high powerespeed curve and Pset, and wr t
takes wr th, which is obtained from the full powerespeed curveandwr m. When Pset � Ph3, theWToperates in low power mode:wr p takes wr pl, which is calculated from the low powerespeedcurve and Pset, whereas wr t takes wr tl, which is obtained fromthe low powerespeed curve and wr m. Meanwhile, Pset b isderived from the output of the PI torque controller and wr m.
4.2.2. Optimized torque control strategy in Control System 2The torque control strategy is illustrated in Fig. 10 and also
contains three parts: the power set-point unit, the bias unit, and theboost converter controller. The Boost converter controller and thebias unit are the same as those in Control System 1. The power set-point unit refers to a PI torque controller and a mode selection unit.
The design of the PI controller is a routine with the assistance ofBladed. Here, it is worth noting that the controller gains are defined
1
2
PI torquecontroller
Boostconvertercontroller
Pitchcontroller
1
2
t modeower modeower mode
_r pw
_r tw
lim itT_set bP
ontrol System 2.
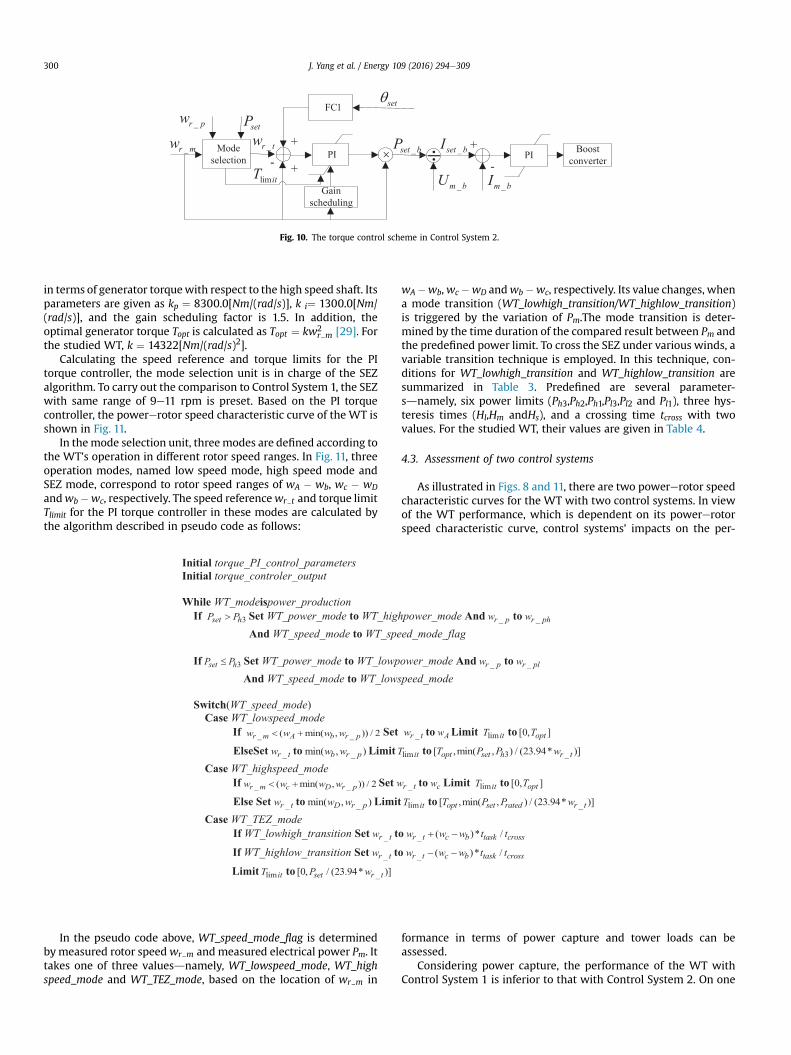
Fig. 10. The torque control scheme in Control System 2.
J. Yang et al. / Energy 109 (2016) 294e309300
in terms of generator torquewith respect to the high speed shaft. Itsparameters are given as kp ¼ 8300.0[Nm/(rad/s)], k i¼ 1300.0[Nm/(rad/s)], and the gain scheduling factor is 1.5. In addition, theoptimal generator torque Topt is calculated as Topt ¼ kw2
r m [29]. Forthe studied WT, k ¼ 14322[Nm/(rad/s)2].
Calculating the speed reference and torque limits for the PItorque controller, the mode selection unit is in charge of the SEZalgorithm. To carry out the comparison to Control System 1, the SEZwith same range of 9e11 rpm is preset. Based on the PI torquecontroller, the powererotor speed characteristic curve of the WT isshown in Fig. 11.
In themode selection unit, threemodes are defined according tothe WT's operation in different rotor speed ranges. In Fig. 11, threeoperation modes, named low speed mode, high speed mode andSEZ mode, correspond to rotor speed ranges of wA � wb, wc � wD
andwb�wc, respectively. The speed referencewr t and torque limitTlimit for the PI torque controller in these modes are calculated bythe algorithm described in pseudo code as follows:
In the pseudo code above, WT_speed_mode_flag is determinedbymeasured rotor speedwr m andmeasured electrical power Pm. Ittakes one of three valuesdnamely, WT_lowspeed_mode, WT_highspeed_mode and WT_TEZ_mode, based on the location of wr m in
wA�wb,wc�wD andwb�wc, respectively. Its value changes, whena mode transition (WT_lowhigh_transition/WT_highlow_transition)is triggered by the variation of Pm.The mode transition is deter-mined by the time duration of the compared result between Pm andthe predefined power limit. To cross the SEZ under various winds, avariable transition technique is employed. In this technique, con-ditions for WT_lowhigh_transition and WT_highlow_transition aresummarized in Table 3. Predefined are several parameter-sdnamely, six power limits (Ph3,Ph2,Ph1,Pl3,Pl2 and Pl1), three hys-teresis times (Hl,Hm andHs), and a crossing time tcross with twovalues. For the studied WT, their values are given in Table 4.
4.3. Assessment of two control systems
As illustrated in Figs. 8 and 11, there are two powererotor speedcharacteristic curves for the WT with two control systems. In viewof the WT performance, which is dependent on its powererotorspeed characteristic curve, control systems’ impacts on the per-
formance in terms of power capture and tower loads can beassessed.
Considering power capture, the performance of the WT withControl System 1 is inferior to that with Control System 2. On one
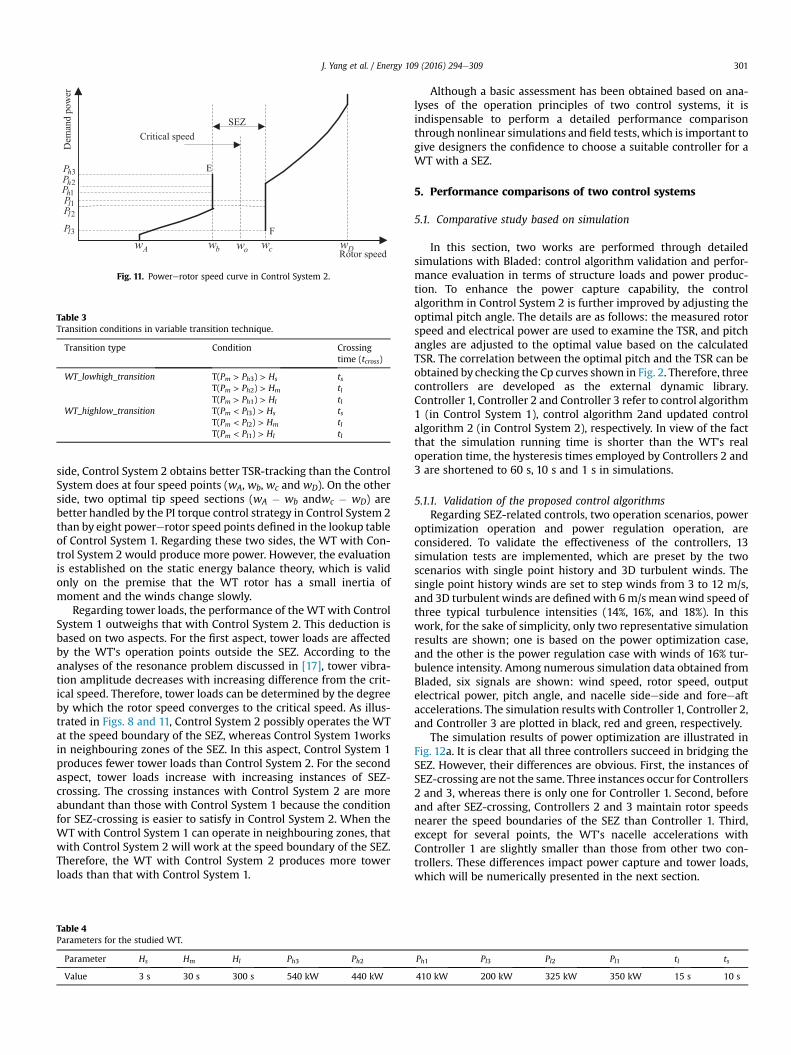
Table 3Transition conditions in variable transition technique.
Transition type Condition Crossingtime (tcross)
WT_lowhigh_transition T(Pm > Ph3) > Hs tsT(Pm > Ph2) > Hm tlT(Pm > Ph1) > Hl tl
WT_highlow_transition T(Pm < Pl3) > Hs tsT(Pm < Pl2) > Hm tlT(Pm < Pl1) > Hl tl
Fig. 11. Powererotor speed curve in Control System 2.
J. Yang et al. / Energy 109 (2016) 294e309 301
side, Control System 2 obtains better TSR-tracking than the ControlSystem does at four speed points (wA, wb, wc and wD). On the otherside, two optimal tip speed sections (wA � wb andwc � wD) arebetter handled by the PI torque control strategy in Control System 2than by eight powererotor speed points defined in the lookup tableof Control System 1. Regarding these two sides, the WT with Con-trol System 2 would produce more power. However, the evaluationis established on the static energy balance theory, which is validonly on the premise that the WT rotor has a small inertia ofmoment and the winds change slowly.
Regarding tower loads, the performance of the WT with ControlSystem 1 outweighs that with Control System 2. This deduction isbased on two aspects. For the first aspect, tower loads are affectedby the WT's operation points outside the SEZ. According to theanalyses of the resonance problem discussed in [17], tower vibra-tion amplitude decreases with increasing difference from the crit-ical speed. Therefore, tower loads can be determined by the degreeby which the rotor speed converges to the critical speed. As illus-trated in Figs. 8 and 11, Control System 2 possibly operates the WTat the speed boundary of the SEZ, whereas Control System 1worksin neighbouring zones of the SEZ. In this aspect, Control System 1produces fewer tower loads than Control System 2. For the secondaspect, tower loads increase with increasing instances of SEZ-crossing. The crossing instances with Control System 2 are moreabundant than those with Control System 1 because the conditionfor SEZ-crossing is easier to satisfy in Control System 2. When theWT with Control System 1 can operate in neighbouring zones, thatwith Control System 2 will work at the speed boundary of the SEZ.Therefore, the WT with Control System 2 produces more towerloads than that with Control System 1.
Table 4Parameters for the studied WT.
Parameter Hs Hm Hl Ph3 Ph2
Value 3 s 30 s 300 s 540 kW 440 kW
Although a basic assessment has been obtained based on ana-lyses of the operation principles of two control systems, it isindispensable to perform a detailed performance comparisonthrough nonlinear simulations and field tests, which is important togive designers the confidence to choose a suitable controller for aWT with a SEZ.
5. Performance comparisons of two control systems
5.1. Comparative study based on simulation
In this section, two works are performed through detailedsimulations with Bladed: control algorithm validation and perfor-mance evaluation in terms of structure loads and power produc-tion. To enhance the power capture capability, the controlalgorithm in Control System 2 is further improved by adjusting theoptimal pitch angle. The details are as follows: the measured rotorspeed and electrical power are used to examine the TSR, and pitchangles are adjusted to the optimal value based on the calculatedTSR. The correlation between the optimal pitch and the TSR can beobtained by checking the Cp curves shown in Fig. 2. Therefore, threecontrollers are developed as the external dynamic library.Controller 1, Controller 2 and Controller 3 refer to control algorithm1 (in Control System 1), control algorithm 2and updated controlalgorithm 2 (in Control System 2), respectively. In view of the factthat the simulation running time is shorter than the WT's realoperation time, the hysteresis times employed by Controllers 2 and3 are shortened to 60 s, 10 s and 1 s in simulations.
5.1.1. Validation of the proposed control algorithmsRegarding SEZ-related controls, two operation scenarios, power
optimization operation and power regulation operation, areconsidered. To validate the effectiveness of the controllers, 13simulation tests are implemented, which are preset by the twoscenarios with single point history and 3D turbulent winds. Thesingle point history winds are set to step winds from 3 to 12 m/s,and 3D turbulent winds are definedwith 6m/s meanwind speed ofthree typical turbulence intensities (14%, 16%, and 18%). In thiswork, for the sake of simplicity, only two representative simulationresults are shown; one is based on the power optimization case,and the other is the power regulation case with winds of 16% tur-bulence intensity. Among numerous simulation data obtained fromBladed, six signals are shown: wind speed, rotor speed, outputelectrical power, pitch angle, and nacelle sideeside and foreeaftaccelerations. The simulation results with Controller 1, Controller 2,and Controller 3 are plotted in black, red and green, respectively.
The simulation results of power optimization are illustrated inFig. 12a. It is clear that all three controllers succeed in bridging theSEZ. However, their differences are obvious. First, the instances ofSEZ-crossing are not the same. Three instances occur for Controllers2 and 3, whereas there is only one for Controller 1. Second, beforeand after SEZ-crossing, Controllers 2 and 3 maintain rotor speedsnearer the speed boundaries of the SEZ than Controller 1. Third,except for several points, the WT's nacelle accelerations withController 1 are slightly smaller than those from other two con-trollers. These differences impact power capture and tower loads,which will be numerically presented in the next section.
Ph1 Pl3 Pl2 Pl1 tl ts
410 kW 200 kW 325 kW 350 kW 15 s 10 s
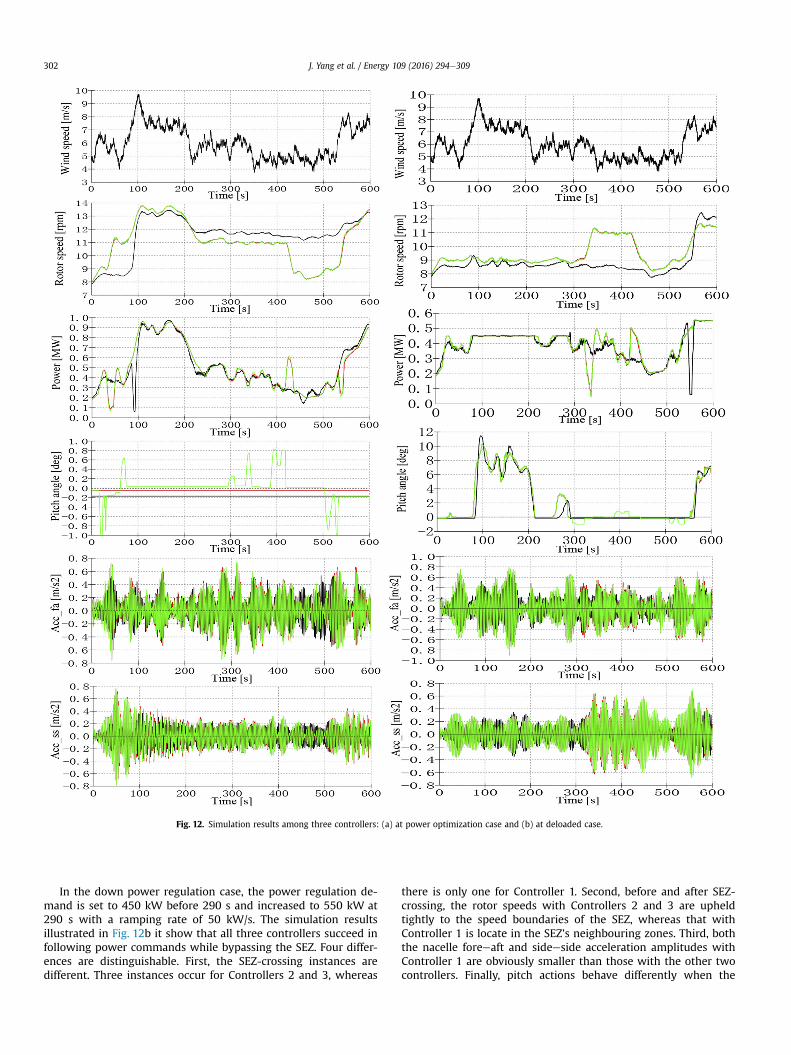
Fig. 12. Simulation results among three controllers: (a) at power optimization case and (b) at deloaded case.
J. Yang et al. / Energy 109 (2016) 294e309302
In the down power regulation case, the power regulation de-mand is set to 450 kW before 290 s and increased to 550 kW at290 s with a ramping rate of 50 kW/s. The simulation resultsillustrated in Fig. 12b it show that all three controllers succeed infollowing power commands while bypassing the SEZ. Four differ-ences are distinguishable. First, the SEZ-crossing instances aredifferent. Three instances occur for Controllers 2 and 3, whereas
there is only one for Controller 1. Second, before and after SEZ-crossing, the rotor speeds with Controllers 2 and 3 are upheldtightly to the speed boundaries of the SEZ, whereas that withController 1 is locate in the SEZ's neighbouring zones. Third, boththe nacelle foreeaft and sideeside acceleration amplitudes withController 1 are obviously smaller than those with the other twocontrollers. Finally, pitch actions behave differently when the
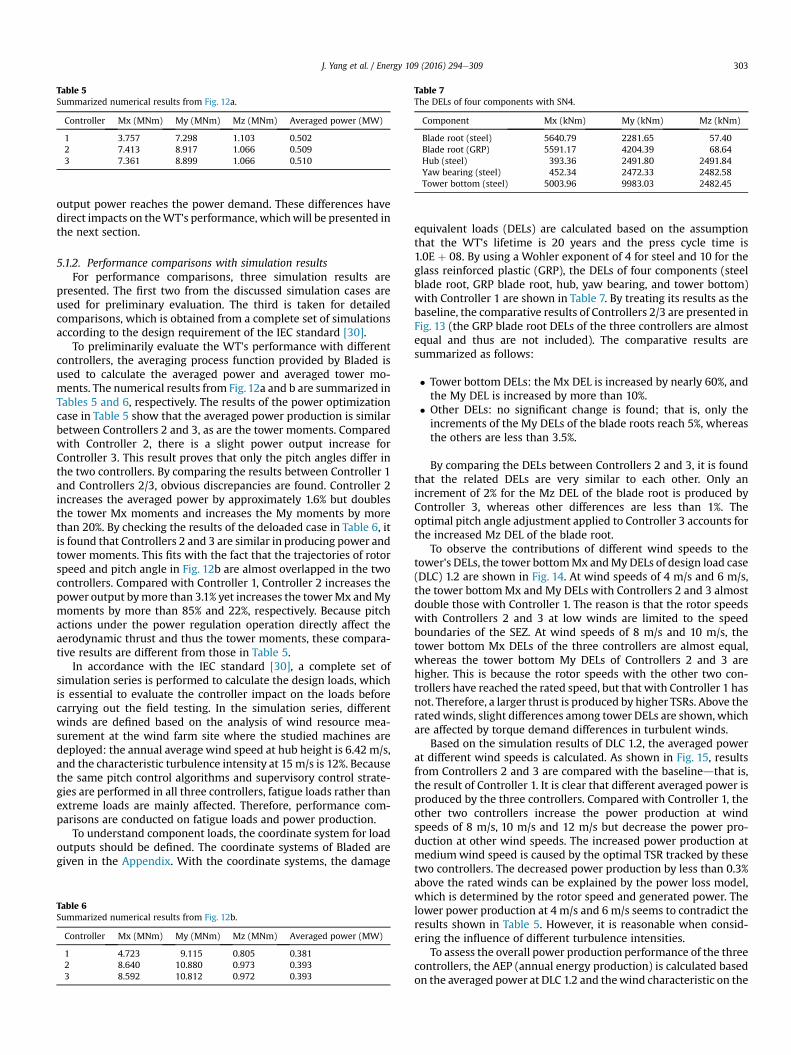
Table 7The DELs of four components with SN4.
Component Mx (kNm) My (kNm) Mz (kNm)
Blade root (steel) 5640.79 2281.65 57.40Blade root (GRP) 5591.17 4204.39 68.64Hub (steel) 393.36 2491.80 2491.84Yaw bearing (steel) 452.34 2472.33 2482.58Tower bottom (steel) 5003.96 9983.03 2482.45
Table 5Summarized numerical results from Fig. 12a.
Controller Mx (MNm) My (MNm) Mz (MNm) Averaged power (MW)
1 3.757 7.298 1.103 0.5022 7.413 8.917 1.066 0.5093 7.361 8.899 1.066 0.510
J. Yang et al. / Energy 109 (2016) 294e309 303
output power reaches the power demand. These differences havedirect impacts on theWT's performance, whichwill be presented inthe next section.
5.1.2. Performance comparisons with simulation resultsFor performance comparisons, three simulation results are
presented. The first two from the discussed simulation cases areused for preliminary evaluation. The third is taken for detailedcomparisons, which is obtained from a complete set of simulationsaccording to the design requirement of the IEC standard [30].
To preliminarily evaluate the WT's performance with differentcontrollers, the averaging process function provided by Bladed isused to calculate the averaged power and averaged tower mo-ments. The numerical results from Fig. 12a and b are summarized inTables 5 and 6, respectively. The results of the power optimizationcase in Table 5 show that the averaged power production is similarbetween Controllers 2 and 3, as are the tower moments. Comparedwith Controller 2, there is a slight power output increase forController 3. This result proves that only the pitch angles differ inthe two controllers. By comparing the results between Controller 1and Controllers 2/3, obvious discrepancies are found. Controller 2increases the averaged power by approximately 1.6% but doublesthe tower Mx moments and increases the My moments by morethan 20%. By checking the results of the deloaded case in Table 6, itis found that Controllers 2 and 3 are similar in producing power andtower moments. This fits with the fact that the trajectories of rotorspeed and pitch angle in Fig. 12b are almost overlapped in the twocontrollers. Compared with Controller 1, Controller 2 increases thepower output bymore than 3.1% yet increases the towerMx andMymoments by more than 85% and 22%, respectively. Because pitchactions under the power regulation operation directly affect theaerodynamic thrust and thus the tower moments, these compara-tive results are different from those in Table 5.
In accordance with the IEC standard [30], a complete set ofsimulation series is performed to calculate the design loads, whichis essential to evaluate the controller impact on the loads beforecarrying out the field testing. In the simulation series, differentwinds are defined based on the analysis of wind resource mea-surement at the wind farm site where the studied machines aredeployed: the annual average wind speed at hub height is 6.42 m/s,and the characteristic turbulence intensity at 15m/s is 12%. Becausethe same pitch control algorithms and supervisory control strate-gies are performed in all three controllers, fatigue loads rather thanextreme loads are mainly affected. Therefore, performance com-parisons are conducted on fatigue loads and power production.
To understand component loads, the coordinate system for loadoutputs should be defined. The coordinate systems of Bladed aregiven in the Appendix. With the coordinate systems, the damage
Table 6Summarized numerical results from Fig. 12b.
Controller Mx (MNm) My (MNm) Mz (MNm) Averaged power (MW)
1 4.723 9.115 0.805 0.3812 8.640 10.880 0.973 0.3933 8.592 10.812 0.972 0.393
equivalent loads (DELs) are calculated based on the assumptionthat the WT's lifetime is 20 years and the press cycle time is1.0E þ 08. By using a Wohler exponent of 4 for steel and 10 for theglass reinforced plastic (GRP), the DELs of four components (steelblade root, GRP blade root, hub, yaw bearing, and tower bottom)with Controller 1 are shown in Table 7. By treating its results as thebaseline, the comparative results of Controllers 2/3 are presented inFig. 13 (the GRP blade root DELs of the three controllers are almostequal and thus are not included). The comparative results aresummarized as follows:
� Tower bottom DELs: the Mx DEL is increased by nearly 60%, andthe My DEL is increased by more than 10%.
� Other DELs: no significant change is found; that is, only theincrements of the My DELs of the blade roots reach 5%, whereasthe others are less than 3.5%.
By comparing the DELs between Controllers 2 and 3, it is foundthat the related DELs are very similar to each other. Only anincrement of 2% for the Mz DEL of the blade root is produced byController 3, whereas other differences are less than 1%. Theoptimal pitch angle adjustment applied to Controller 3 accounts forthe increased Mz DEL of the blade root.
To observe the contributions of different wind speeds to thetower's DELs, the tower bottomMx andMy DELs of design load case(DLC) 1.2 are shown in Fig. 14. At wind speeds of 4 m/s and 6 m/s,the tower bottomMx and My DELs with Controllers 2 and 3 almostdouble those with Controller 1. The reason is that the rotor speedswith Controllers 2 and 3 at low winds are limited to the speedboundaries of the SEZ. At wind speeds of 8 m/s and 10 m/s, thetower bottom Mx DELs of the three controllers are almost equal,whereas the tower bottom My DELs of Controllers 2 and 3 arehigher. This is because the rotor speeds with the other two con-trollers have reached the rated speed, but that with Controller 1 hasnot. Therefore, a larger thrust is produced by higher TSRs. Above theratedwinds, slight differences among tower DELs are shown, whichare affected by torque demand differences in turbulent winds.
Based on the simulation results of DLC 1.2, the averaged powerat different wind speeds is calculated. As shown in Fig. 15, resultsfrom Controllers 2 and 3 are compared with the baselinedthat is,the result of Controller 1. It is clear that different averaged power isproduced by the three controllers. Compared with Controller 1, theother two controllers increase the power production at windspeeds of 8 m/s, 10 m/s and 12 m/s but decrease the power pro-duction at other wind speeds. The increased power production atmediumwind speed is caused by the optimal TSR tracked by thesetwo controllers. The decreased power production by less than 0.3%above the rated winds can be explained by the power loss model,which is determined by the rotor speed and generated power. Thelower power production at 4 m/s and 6 m/s seems to contradict theresults shown in Table 5. However, it is reasonable when consid-ering the influence of different turbulence intensities.
To assess the overall power production performance of the threecontrollers, the AEP (annual energy production) is calculated basedon the averaged power at DLC 1.2 and thewind characteristic on the
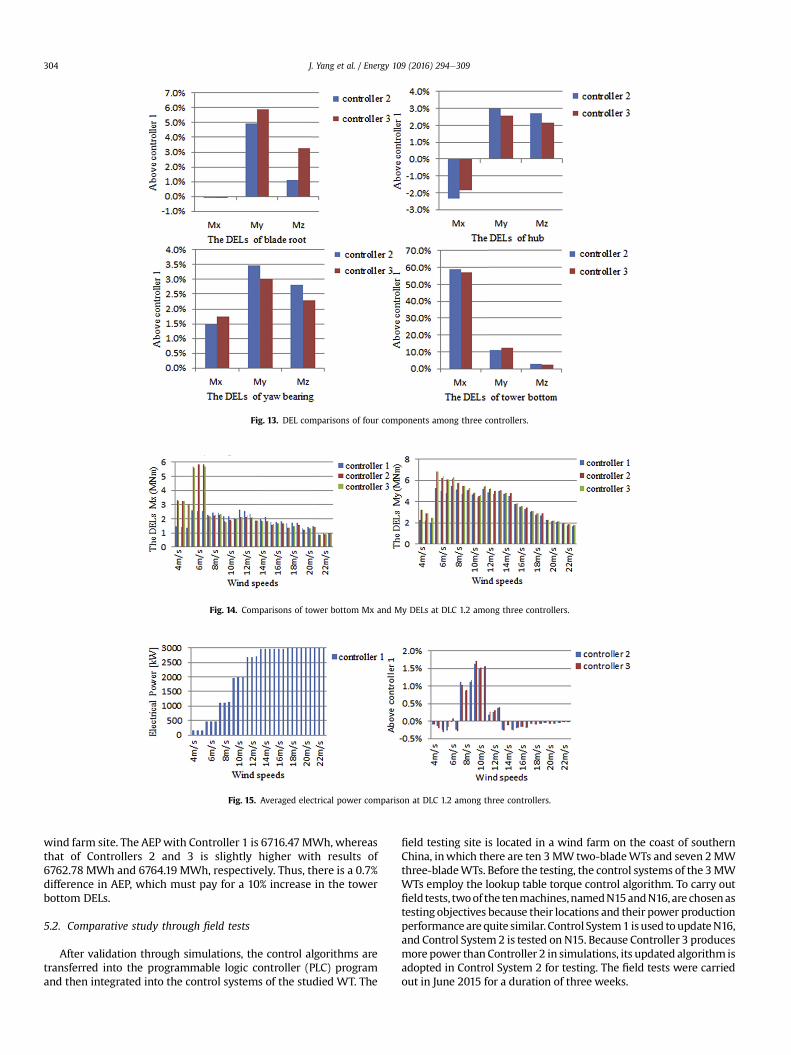
Fig. 13. DEL comparisons of four components among three controllers.
Fig. 14. Comparisons of tower bottom Mx and My DELs at DLC 1.2 among three controllers.
Fig. 15. Averaged electrical power comparison at DLC 1.2 among three controllers.
J. Yang et al. / Energy 109 (2016) 294e309304
wind farm site. The AEPwith Controller 1 is 6716.47MWh, whereasthat of Controllers 2 and 3 is slightly higher with results of6762.78 MWh and 6764.19 MWh, respectively. Thus, there is a 0.7%difference in AEP, which must pay for a 10% increase in the towerbottom DELs.
5.2. Comparative study through field tests
After validation through simulations, the control algorithms aretransferred into the programmable logic controller (PLC) programand then integrated into the control systems of the studied WT. The
field testing site is located in a wind farm on the coast of southernChina, inwhich there are ten 3MW two-bladeWTs and seven 2MWthree-bladeWTs. Before the testing, the control systems of the 3MWWTs employ the lookup table torque control algorithm. To carry outfield tests, twoof the tenmachines,namedN15andN16,are chosenastesting objectives because their locations and their power productionperformance arequite similar. Control System1 isused toupdateN16,and Control System 2 is tested on N15. Because Controller 3 producesmore power than Controller 2 in simulations, its updated algorithm isadopted in Control System 2 for testing. The field tests were carriedout in June 2015 for a duration of three weeks.
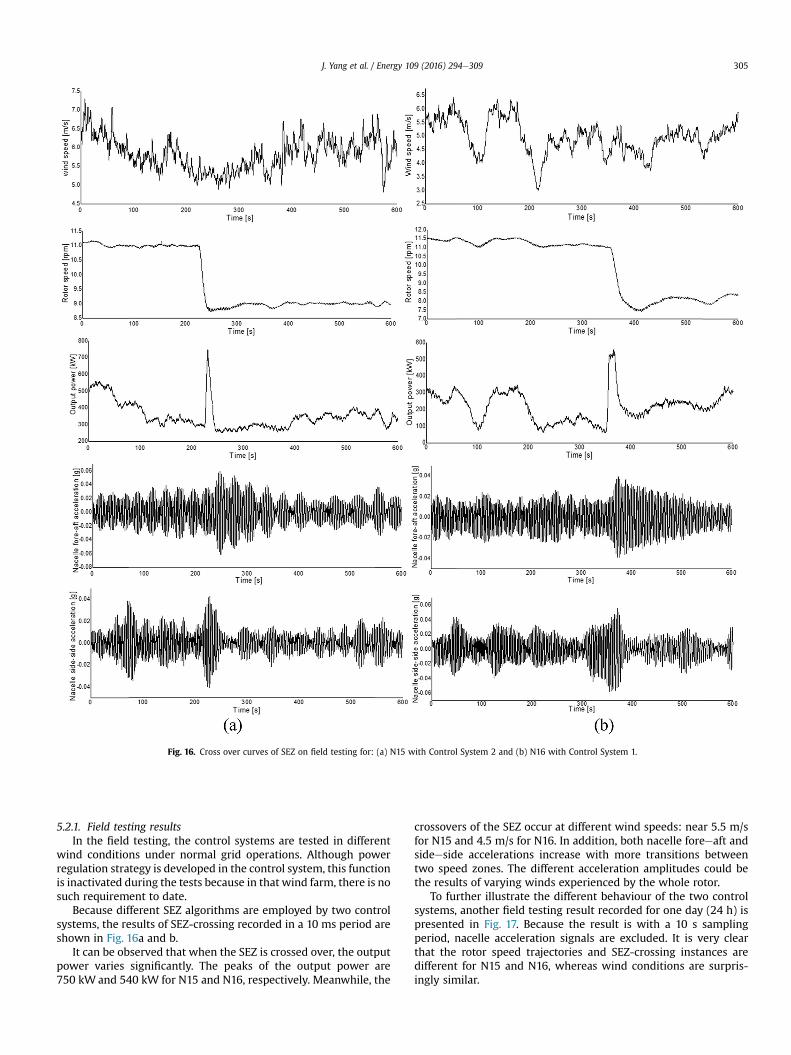
Fig. 16. Cross over curves of SEZ on field testing for: (a) N15 with Control System 2 and (b) N16 with Control System 1.
J. Yang et al. / Energy 109 (2016) 294e309 305
5.2.1. Field testing resultsIn the field testing, the control systems are tested in different
wind conditions under normal grid operations. Although powerregulation strategy is developed in the control system, this functionis inactivated during the tests because in that wind farm, there is nosuch requirement to date.
Because different SEZ algorithms are employed by two controlsystems, the results of SEZ-crossing recorded in a 10 ms period areshown in Fig. 16a and b.
It can be observed that when the SEZ is crossed over, the outputpower varies significantly. The peaks of the output power are750 kW and 540 kW for N15 and N16, respectively. Meanwhile, the
crossovers of the SEZ occur at different wind speeds: near 5.5 m/sfor N15 and 4.5 m/s for N16. In addition, both nacelle foreeaft andsideeside accelerations increase with more transitions betweentwo speed zones. The different acceleration amplitudes could bethe results of varying winds experienced by the whole rotor.
To further illustrate the different behaviour of the two controlsystems, another field testing result recorded for one day (24 h) ispresented in Fig. 17. Because the result is with a 10 s samplingperiod, nacelle acceleration signals are excluded. It is very clearthat the rotor speed trajectories and SEZ-crossing instances aredifferent for N15 and N16, whereas wind conditions are surpris-ingly similar.
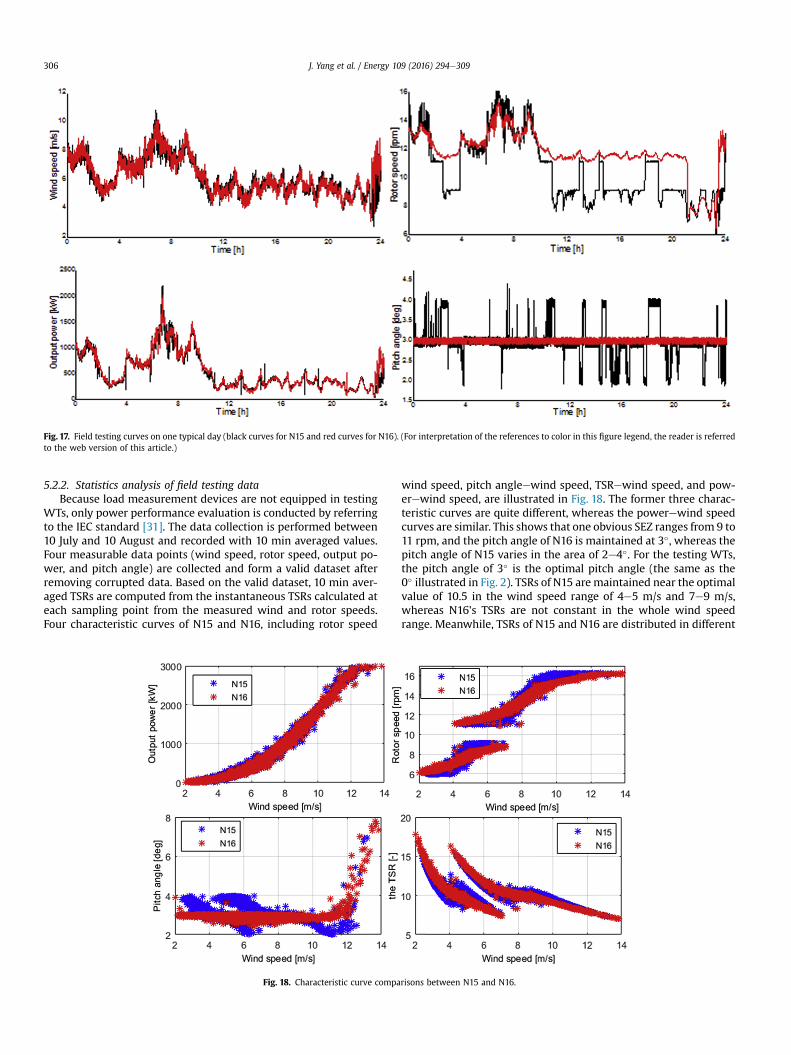
Fig. 17. Field testing curves on one typical day (black curves for N15 and red curves for N16). (For interpretation of the references to color in this figure legend, the reader is referredto the web version of this article.)
J. Yang et al. / Energy 109 (2016) 294e309306
5.2.2. Statistics analysis of field testing dataBecause load measurement devices are not equipped in testing
WTs, only power performance evaluation is conducted by referringto the IEC standard [31]. The data collection is performed between10 July and 10 August and recorded with 10 min averaged values.Four measurable data points (wind speed, rotor speed, output po-wer, and pitch angle) are collected and form a valid dataset afterremoving corrupted data. Based on the valid dataset, 10 min aver-aged TSRs are computed from the instantaneous TSRs calculated ateach sampling point from the measured wind and rotor speeds.Four characteristic curves of N15 and N16, including rotor speed
Fig. 18. Characteristic curve compa
wind speed, pitch angleewind speed, TSRewind speed, and pow-erewind speed, are illustrated in Fig. 18. The former three charac-teristic curves are quite different, whereas the powerewind speedcurves are similar. This shows that one obvious SEZ ranges from 9 to11 rpm, and the pitch angle of N16 is maintained at 3�, whereas thepitch angle of N15 varies in the area of 2e4�. For the testing WTs,the pitch angle of 3� is the optimal pitch angle (the same as the0� illustrated in Fig. 2). TSRs of N15 aremaintained near the optimalvalue of 10.5 in the wind speed range of 4e5 m/s and 7e9 m/s,whereas N16's TSRs are not constant in the whole wind speedrange. Meanwhile, TSRs of N15 and N16 are distributed in different
risons between N15 and N16.
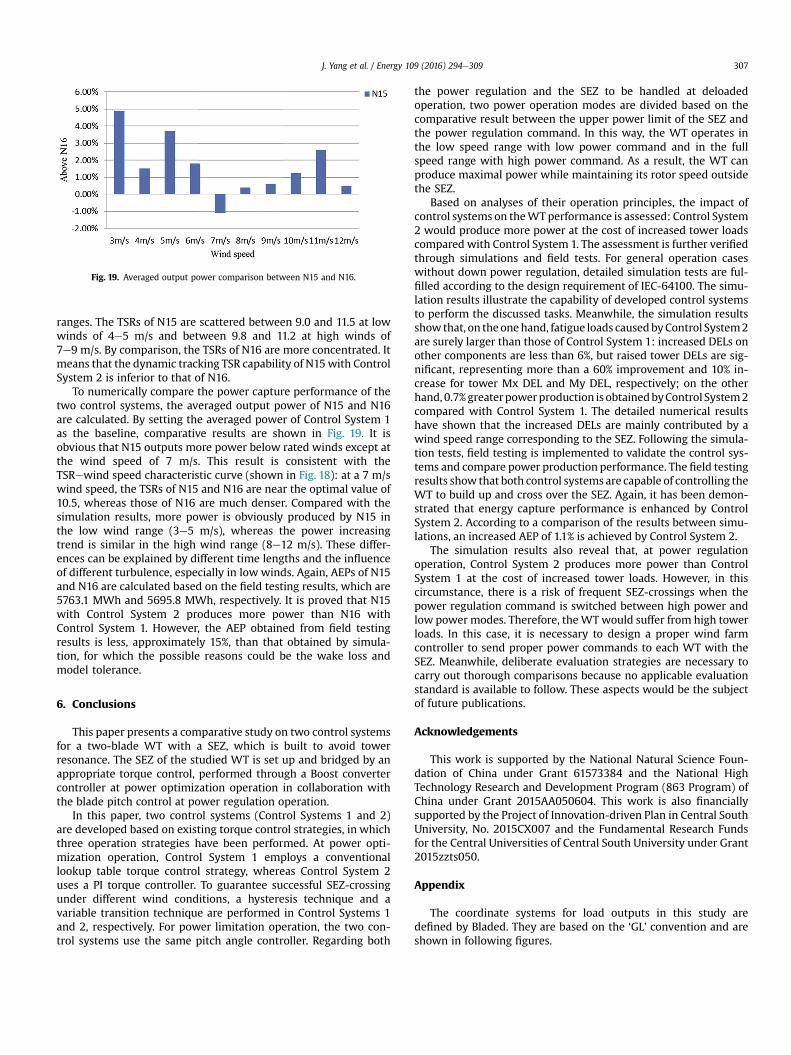
Fig. 19. Averaged output power comparison between N15 and N16.
J. Yang et al. / Energy 109 (2016) 294e309 307
ranges. The TSRs of N15 are scattered between 9.0 and 11.5 at lowwinds of 4e5 m/s and between 9.8 and 11.2 at high winds of7e9 m/s. By comparison, the TSRs of N16 are more concentrated. Itmeans that the dynamic tracking TSR capability of N15with ControlSystem 2 is inferior to that of N16.
To numerically compare the power capture performance of thetwo control systems, the averaged output power of N15 and N16are calculated. By setting the averaged power of Control System 1as the baseline, comparative results are shown in Fig. 19. It isobvious that N15 outputs more power below rated winds except atthe wind speed of 7 m/s. This result is consistent with theTSRewind speed characteristic curve (shown in Fig. 18): at a 7 m/swind speed, the TSRs of N15 and N16 are near the optimal value of10.5, whereas those of N16 are much denser. Compared with thesimulation results, more power is obviously produced by N15 inthe low wind range (3e5 m/s), whereas the power increasingtrend is similar in the high wind range (8e12 m/s). These differ-ences can be explained by different time lengths and the influenceof different turbulence, especially in low winds. Again, AEPs of N15and N16 are calculated based on the field testing results, which are5763.1 MWh and 5695.8 MWh, respectively. It is proved that N15with Control System 2 produces more power than N16 withControl System 1. However, the AEP obtained from field testingresults is less, approximately 15%, than that obtained by simula-tion, for which the possible reasons could be the wake loss andmodel tolerance.
6. Conclusions
This paper presents a comparative study on two control systemsfor a two-blade WT with a SEZ, which is built to avoid towerresonance. The SEZ of the studied WT is set up and bridged by anappropriate torque control, performed through a Boost convertercontroller at power optimization operation in collaboration withthe blade pitch control at power regulation operation.
In this paper, two control systems (Control Systems 1 and 2)are developed based on existing torque control strategies, in whichthree operation strategies have been performed. At power opti-mization operation, Control System 1 employs a conventionallookup table torque control strategy, whereas Control System 2uses a PI torque controller. To guarantee successful SEZ-crossingunder different wind conditions, a hysteresis technique and avariable transition technique are performed in Control Systems 1and 2, respectively. For power limitation operation, the two con-trol systems use the same pitch angle controller. Regarding both
the power regulation and the SEZ to be handled at deloadedoperation, two power operation modes are divided based on thecomparative result between the upper power limit of the SEZ andthe power regulation command. In this way, the WT operates inthe low speed range with low power command and in the fullspeed range with high power command. As a result, the WT canproduce maximal power while maintaining its rotor speed outsidethe SEZ.
Based on analyses of their operation principles, the impact ofcontrol systems on theWTperformance is assessed: Control System2 would produce more power at the cost of increased tower loadscompared with Control System 1. The assessment is further verifiedthrough simulations and field tests. For general operation caseswithout down power regulation, detailed simulation tests are ful-filled according to the design requirement of IEC-64100. The simu-lation results illustrate the capability of developed control systemsto perform the discussed tasks. Meanwhile, the simulation resultsshow that, on theonehand, fatigue loads causedbyControl System2are surely larger than those of Control System 1: increased DELs onother components are less than 6%, but raised tower DELs are sig-nificant, representing more than a 60% improvement and 10% in-crease for tower Mx DEL and My DEL, respectively; on the otherhand, 0.7%greaterpowerproduction is obtainedbyControl System2compared with Control System 1. The detailed numerical resultshave shown that the increased DELs are mainly contributed by awind speed range corresponding to the SEZ. Following the simula-tion tests, field testing is implemented to validate the control sys-tems and compare power production performance. The field testingresults show that both control systems are capable of controlling theWT to build up and cross over the SEZ. Again, it has been demon-strated that energy capture performance is enhanced by ControlSystem 2. According to a comparison of the results between simu-lations, an increased AEP of 1.1% is achieved by Control System 2.
The simulation results also reveal that, at power regulationoperation, Control System 2 produces more power than ControlSystem 1 at the cost of increased tower loads. However, in thiscircumstance, there is a risk of frequent SEZ-crossings when thepower regulation command is switched between high power andlow power modes. Therefore, theWT would suffer from high towerloads. In this case, it is necessary to design a proper wind farmcontroller to send proper power commands to each WT with theSEZ. Meanwhile, deliberate evaluation strategies are necessary tocarry out thorough comparisons because no applicable evaluationstandard is available to follow. These aspects would be the subjectof future publications.
Acknowledgements
This work is supported by the National Natural Science Foun-dation of China under Grant 61573384 and the National HighTechnology Research and Development Program (863 Program) ofChina under Grant 2015AA050604. This work is also financiallysupported by the Project of Innovation-driven Plan in Central SouthUniversity, No. 2015CX007 and the Fundamental Research Fundsfor the Central Universities of Central South University under Grant2015zzts050.
Appendix
The coordinate systems for load outputs in this study aredefined by Bladed. They are based on the ‘GL’ convention and areshown in following figures.
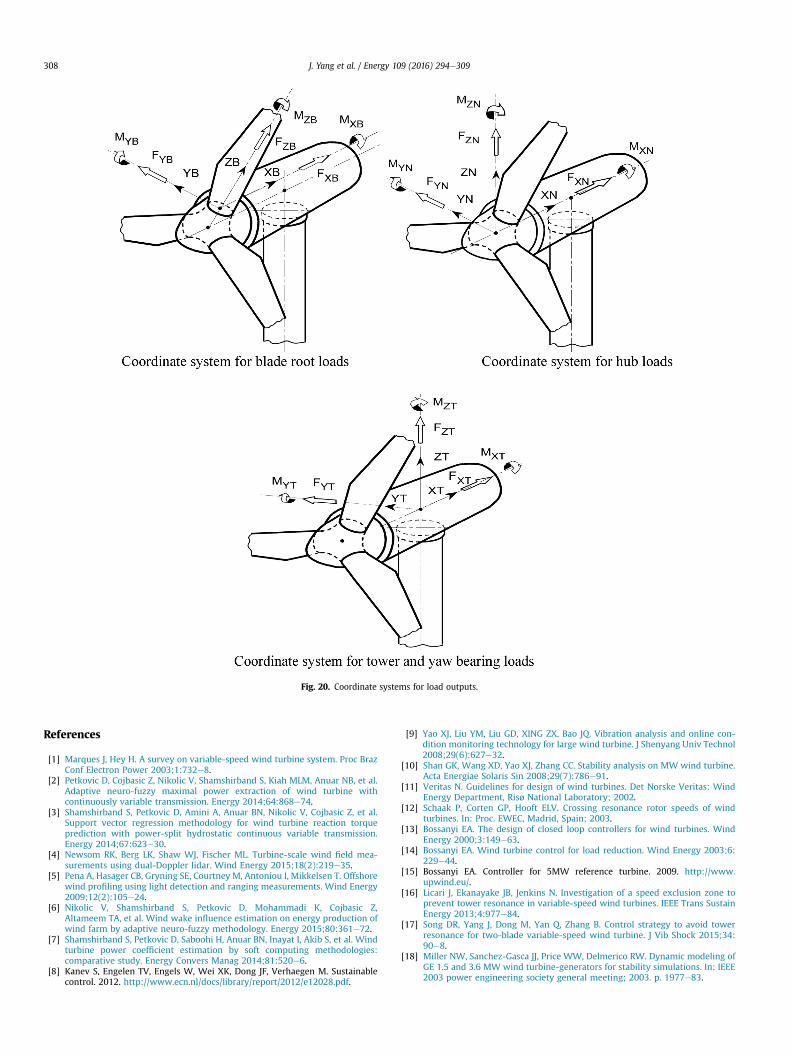
Fig. 20. Coordinate systems for load outputs.
J. Yang et al. / Energy 109 (2016) 294e309308
References
[1] Marques J, Hey H. A survey on variable-speed wind turbine system. Proc BrazConf Electron Power 2003;1:732e8.
[2] Petkovic D, Cojbasic Z, Nikolic V, Shamshirband S, Kiah MLM, Anuar NB, et al.Adaptive neuro-fuzzy maximal power extraction of wind turbine withcontinuously variable transmission. Energy 2014;64:868e74.
[3] Shamshirband S, Petkovic D, Amini A, Anuar BN, Nikolic V, Cojbasic Z, et al.Support vector regression methodology for wind turbine reaction torqueprediction with power-split hydrostatic continuous variable transmission.Energy 2014;67:623e30.
[4] Newsom RK, Berg LK, Shaw WJ, Fischer ML. Turbine-scale wind field mea-surements using dual-Doppler lidar. Wind Energy 2015;18(2):219e35.
[5] Pena A, Hasager CB, Gryning SE, Courtney M, Antoniou I, Mikkelsen T. Offshorewind profiling using light detection and ranging measurements. Wind Energy2009;12(2):105e24.
[6] Nikolic V, Shamshirband S, Petkovic D, Mohammadi K, Cojbasic Z,Altameem TA, et al. Wind wake influence estimation on energy production ofwind farm by adaptive neuro-fuzzy methodology. Energy 2015;80:361e72.
[7] Shamshirband S, Petkovic D, Saboohi H, Anuar BN, Inayat I, Akib S, et al. Windturbine power coefficient estimation by soft computing methodologies:comparative study. Energy Convers Manag 2014;81:520e6.
[8] Kanev S, Engelen TV, Engels W, Wei XK, Dong JF, Verhaegen M. Sustainablecontrol. 2012. http://www.ecn.nl/docs/library/report/2012/e12028.pdf.
[9] Yao XJ, Liu YM, Liu GD, XING ZX, Bao JQ. Vibration analysis and online con-dition monitoring technology for large wind turbine. J Shenyang Univ Technol2008;29(6):627e32.
[10] Shan GK, Wang XD, Yao XJ, Zhang CC. Stability analysis on MW wind turbine.Acta Energiae Solaris Sin 2008;29(7):786e91.
[11] Veritas N. Guidelines for design of wind turbines. Det Norske Veritas: WindEnergy Department, Risø National Laboratory; 2002.
[12] Schaak P, Corten GP, Hooft ELV. Crossing resonance rotor speeds of windturbines. In: Proc. EWEC, Madrid, Spain; 2003.
[13] Bossanyi EA. The design of closed loop controllers for wind turbines. WindEnergy 2000;3:149e63.
[14] Bossanyi EA. Wind turbine control for load reduction. Wind Energy 2003;6:229e44.
[15] Bossanyi EA. Controller for 5MW reference turbine. 2009. http://www.upwind.eu/.
[16] Licari J, Ekanayake JB, Jenkins N. Investigation of a speed exclusion zone toprevent tower resonance in variable-speed wind turbines. IEEE Trans SustainEnergy 2013;4:977e84.
[17] Song DR, Yang J, Dong M, Yan Q, Zhang B. Control strategy to avoid towerresonance for two-blade variable-speed wind turbine. J Vib Shock 2015;34:90e8.
[18] Miller NW, Sanchez-Gasca JJ, Price WW, Delmerico RW. Dynamic modeling ofGE 1.5 and 3.6 MW wind turbine-generators for stability simulations. In: IEEE2003 power engineering society general meeting; 2003. p. 1977e83.

J. Yang et al. / Energy 109 (2016) 294e309 309
[19] Jauch C, Matevosyan J, Ackermann T, Bolik S. International comparison ofrequirements for connection of wind turbines to power systems. Wind Energy2005;8:295e306.
[20] Rodriguez-Amenedo JL, Arnalte S, Burgos JC. Automatic generation control ofa wind farm with variable speed wind turbines. IEEE Trans Energy Convers2002;17(2):279e84.
[21] Hansen AD, Sorensen P, Iov F, Blaabjeg F. Centralised power control of windfarm with doubly fed induction generators. Renew Energy 2006;31(7):935e51.
[22] Sorensen P, Hansen AD, Iov F, Blaabjeg F, Donovan MH. Wind farm modelsand control strategies. Roskilde, Denmark: Risø National Laboratory; 2005.Technical Report.
[23] De Almeida RG, Castronuovo ED, Pecas Lopes JA. Optimum generation controlin wind parks when carrying out system operator requests. IEEE Trans PowerSyst 2006;21(2):718e25.
[24] Fernandez LM, Garcia CA, Jurado F. Comparative study on the performance ofcontrol systems for doubly fed induction generator (DFIG) wind turbinesoperating with power regulation. Energy 2008;33(9):1438e52.
[25] GH bladed user manual. Garrad Hassan and Partners Ltd; 2009.[26] Soleimanzadeh M, Wisniewski R. Controller design for a wind farm, consid-
ering both power and load aspects. Mechatronics 2011;21:720e7.[27] Gort S, Doran HD, Weber K, Norbert H. Communication aspects of wind tur-
bine control-architecture redesign. In: International conference on powerengineering. Energy and Electrical Drives; 2011.
[28] Yang J, Song DR, Han H, Tong PS, Zhou L. The integrated control of fuzzy logicand model-based approach for variable-speed wind turbine. Turkish J ElectrEng Comput Sci 2015;23(6):1715e34.
[29] Wang N, Johnson KE, Wright AD. Comparison of strategies for enhancingenergy capture and reducing loads using LIDAR and feed-forward control.IEEE Trans Control Syst Technol 2013;21:1129e42.
[30] International Electro-technical Commission. IEC 61400-1 International stan-dard, wind turbines e Part 1: design requirements. 3rd ed. Geneva,Switzerland: IEC; 2005.
[31] International Electro-technical Commission. IEC 61400-12-1 InternationalStandard, Wind Turbines ePart 12-1: power performance measurements ofelectricity producing wind turbines. 1st ed. Geneva, Switzerland: IEC; 2005.