Embed Size (px)
Citation preview

Comparative Social Visualization for Personalized E-learning
I-Han Hsiao School of Information
Sciences, University of Pittsburgh 135 N. Bellefield Ave.
Pittsburgh PA 15260, USA +1 412 624 9437 [email protected]
Julio Guerra School of Information
Sciences, University of Pittsburgh 135 N. Bellefield Ave.
Pittsburgh PA 15260, USA +1 412 624 9437 [email protected]
Denis Parra School of Information
Sciences, University of Pittsburgh 135 N. Bellefield Ave.
Pittsburgh PA 15260, USA +1 412 624 9437
Fedor Bakalov Institute for Computer
Science, University of Jena Ernst-Abbe-Platz 2
07743 Jena, Germany +49 3641 946435
Birgitta König-Ries Institute for Computer
Science, University of Jena Ernst-Abbe-Platz 2
07743 Jena, Germany +49 3641 946430
Peter Brusilovsky School of Information Sciences,
University of Pittsburgh 135 N. Bellefield Ave.
Pittsburgh PA 15260, USA +1 412 624 9404
[email protected] Social learning has confirmed its value in enhancing the learning outcomes across a wide spectrum. To support social learning, a visual approach is a common technique to represent and organize multiple students’ data in an informative way. This paper presents a design of comparative social visualization for E-learning, which encourages information discovery and social comparisons. Classroom studies confirmed the motivational impact of personalized social guidance provided by the visualization in the target context. The visualization encouraged students to do some work ahead of the course schedule. Moreover, class leaders provided an implicit social guidance for the rest of the class and successfully led the way to discover the most relevant resources creating good trails for the rest of the class. We summarized the evidence of students’ engagement and performance through the social visualization interface.
Categories and Subject Descriptors H5.m. Information interfaces and presentation (e.g., HCI): Miscellaneous.
General Terms Design, Experimentation
Keywords Social visualization; Personalized E-learning; Social learning; Social guidance; Social comparison
1. INTRODUCTION A large number of educational resources is now made available
on the Web to support both regular classroom learning and online learning. However, the abundance of available content produced at least two problems: how to help students to find the most appropriate resources and how to engage them into using these resources and benefit from them. Personalized and social learning has been suggested as potential ways to address these problems. To solve these problems, the modern E-Learning technologies rely strongly on the user interfaces to facilitate the interactions and provide a better-personalized environment. The interactivity between the student and the interface in an E-Learning system has been considered as one of the most important aspects on improving the quality of education [1]. For instance, a poor interface design in education may impair students’ motivation as well as their performance [2]. On the other hand, a good E-Learning system interface can increase the learners’ motivation by providing them with controls and awareness, digesting complex concepts and staying interested in the subject [3-5]. Over the last 10 years, a number of advanced visual interfaces for E-learning were developed and evaluated. Among others, two kinds of visual interfaces emerged as successful in increasing student engagement and learning. Social visualization interfaces [5-7] made E-Learnng process social, increased social interaction and competition among students. Open student modeling interfaces improved self-reflection and motivation to learn [8-10]. Our work presented in this paper attempts to combine the ideas of open student modeling and social learning. Our challenge is to discover an effective visual approach to help students to find the most relevant resources in a large collection of parameterized self-assessment questions for programming.
To address this challenge, we developed a social comparative visualization that allows students to observe and reflect their learning process and performance along with the progress of their peers. It is known that visual approaches for open student modeling provide students with an easy-to-grasp and holistic view of their progress [8-10]. However, most of the research in this area focuses on an individual student representation and ignores the social aspects of learning. Literature has also shown
Permission to make digital or hard copies of all or part of this work for personal or classroom use is granted without fee provided that copies are not made or distributed for profit or commercial advantage and that copies bear this notice and the full citation on the first page. To copy otherwise, or republish, to post on servers or to redistribute to lists, requires prior specific permission and/or a fee. AVI’12, May 21–25, 2012, Capri Island, Italy. Copyright 2012 ACM 978-1-4503-1287-5/12/05…$10.00.
that students have a range of preferences of presentations to view their own knowledge [11]. Therefore, in our system Progressor presented in this paper we explored a specific combination of these two approaches - a social visualization based on open student models, which allows presenting multiple peer models to support self-reflection, social learning, and personalized access to a collection of programming problems.
We conducted a semester long classroom study and confirmed the motivational impact of personalized social guidance provided by the social visualization in the target context. The interface encouraged students to do some work ahead of the course schedule. A deeper analysis of the social guidance mechanism revealed that the top students (that provided an implicit social guidance for the rest of the class) successfully led the way to discover the most relevant resources creating good trails for the rest of the class. The rest of the paper is organized as follows. After a short literature review, we describe the interface design rationale and underlying features of Progressor. A study design and evaluation results of Progressor is reported in Section 4. Finally, we summarize this work and discuss potential future work.
2. BACKGROUND To support social learning, a visual approach is a common technique to represent or organize multiple students’ data in an informative way. For instance, social navigation is a technique that attempts to support a known social phenomenon where people tend to follow the “footprints” of other people [12, 13]. The educational value has been confirmed in several studies [14, 15]. It is common to show learners average values of the group model in providing social visualization in E-Learning, e.g., average knowledge status of the group in a given topic. Open group modeling enables students to compare and understand their own states. Such group models have been used to support collaboration between learners among the same group, and to foster competition in a group of learners [5]. The studies [5-7] showed that the social visualization increases social interaction among students, encourages competition, and gives students the opportunity to build trust in others and in the group. According to social comparison theory [16], people tend to compare their achievements and performance with people who they think are similar to them in some way. Depending on the comparison targets (lateral, downward and upward comparison), the motives of self-evaluation, self-enhancement, and self-improvement drive one to compare him/herself to others. [17, 18] summarized that upward comparisons in the classroom often lead to better performances, decreased social loafing and increased productivity by inducing the social comparison with a graphical feedback tool.
3. PROGRESSOR Progressor is a visual interface for open student modeling and social learning. It provides students with a holistic and easy-to-grasp view on their progress and allows relating it to the progress of other students in the class. The system integrates two earlier projects, namely the QuizJET system [19] for the authoring and delivery of parameterized questions for the Java Programming Language and the IntrospectiveViews [20] visualization of semantic user models. The predecessor of Progressor was introduced in [21] as Parallel IntrospectiveViews.
Progressor offers visualization of student progress on QuizJET questions of an Object-Oriented Programming course. All
questions are parameterized, i.e., they include a random parameter, which QuizJET instantiates when the question is delivered to a student. As a result, the student can attempt to answer the same question multiple times with different values of the parameter, which helps to achieve the mastery level.
Figure 1. Progressor. The circular sectors represent the lectures and the annular sectors represent the topics of individual lectures. The shades of the sectors indicate whether the topic has been covered
and for the covered ones, denote the progress the student has made. The left pane displays progress charts of peers. Color screenshots
available at: http://www.minervaportals.de/research/introspective-views/
The visualization (Fig.1) displays the student’s progress as a pie chart consisting of circular sectors representing the class lectures. The lectures are displayed in a clockwise order denoting their prerequisite sequence, i.e., the order they are taught in class. Lectures may consist of one or several topics, which are represented as annular sectors placed within the circular sector of the corresponding lecture. The shade of each annular sector denotes whether the topic has been covered and, for the covered ones, indicates the progress the student has made with respect to the topic. The sectors painted light grey represent the topics that have not been covered yet, whereas the sectors painted a shade from the color range red to green represent the sectors that have been already covered. For the covered topics, the interface displays the student progress, i.e., the ratio of successfully completed quizzes to the total quiz count in the topic. If the ratio equals 0, i.e., no quiz has been successfully completed, the sector is painted red. If it equals 1, i.e., all quizzes have been completed, the sector appears green. The shades in the range between red and green denote partial completion of the quizzes.
from the drop-down menu located on the top of the right pane.
Each pane visualizes the respective student’s progress as a pie
chart consisting of circular sectors representing the class lectures.
The lectures are displayed in a clockwise order denoting their pre-
requisite sequence, i.e., the order they are taught in class. Lectures
may consist of one or several topics, which are represented as
annular sectors placed within the circular sector of the
corresponding lecture. The shade of each annular sector denotes
whether the topic has been covered and, for the covered ones,
indicates the progress the student has made with respect to the
topic. The sectors painted light grey represent the topics that have
not been covered yet, whereas the sectors painted a shade from the
color range red to green represent the sectors that have been
already covered. For the covered topics, the interface displays the
student progress, i.e., the ratio of successfully completed quizzes
to the total quiz count in the topic. If the ratio equals 0, i.e., no
quiz has been successfully completed, the sector is painted red. If
it equals 1, i.e., all quizzes have been completed, the sector
appears green. The shades in the range between red and green
denote partial completion of the quizzes. By clicking a sector, the
interface will display the contents of the corresponding topic, i.e.,
the list of questions for the topic (Fig. 2). For each question, the
interface provides a visual cue indicating the student’s progress
and displays the total number of attempts the student has made on
the quiz and the number of successful attempts. By clicking a quiz
label the interface will display the quiz in a new window.
Figure 2. Parallel IntrospectiveViews. Quizzes of the selected topic.
As our previous study [22] shows, Parallel IntrospectiveViews not
only helped students in understanding the organization of class
lectures and accessing quizzes, but also caused 28% increase of
the number of attempts on questions. However, we believed that
the motivational effects can be even stronger, if students are
provided with a ranking of their peers by progress. To check this
hypothesis we developed Progressor, which is an extension of the
original Parallel IntrospectiveViews. In the newer version (Fig. 3
& 4), the user is provided with a sortable list of thumbnails of pie
charts representing progress of the user’s peers. Unlike the list of
student names in the previous version, the list with thumbnails of
progress charts provide an immediate overview of the peers’
performance. Apart from sorting students by name and model
access, the user can sort peers’ models by overall progress and by
progress in a certain topic. By choosing the option for sorting by
progress, the interface will sort the models from the highest to the
lowest progress. Also, it will display the models of the three
students with the highest progress on the top. We believe that by
displaying the progress of top students in such a manner can make
the rest of the class eager to catch up with them. The sorted list
rudimentarily contains the thumbnail of the user’s own progress,
which allows determining his/her ranking in the class with respect
to either the overall progress or the progress in a selected topic.
Also, the list contains a thumbnail with the average progress of
the entire class. We believe that such a way for relating the
student’s own progress to the progress of other individual students
and the class on average can be a strong motivating factor for
completing quizzes in a timely manner and achieving better
scores.
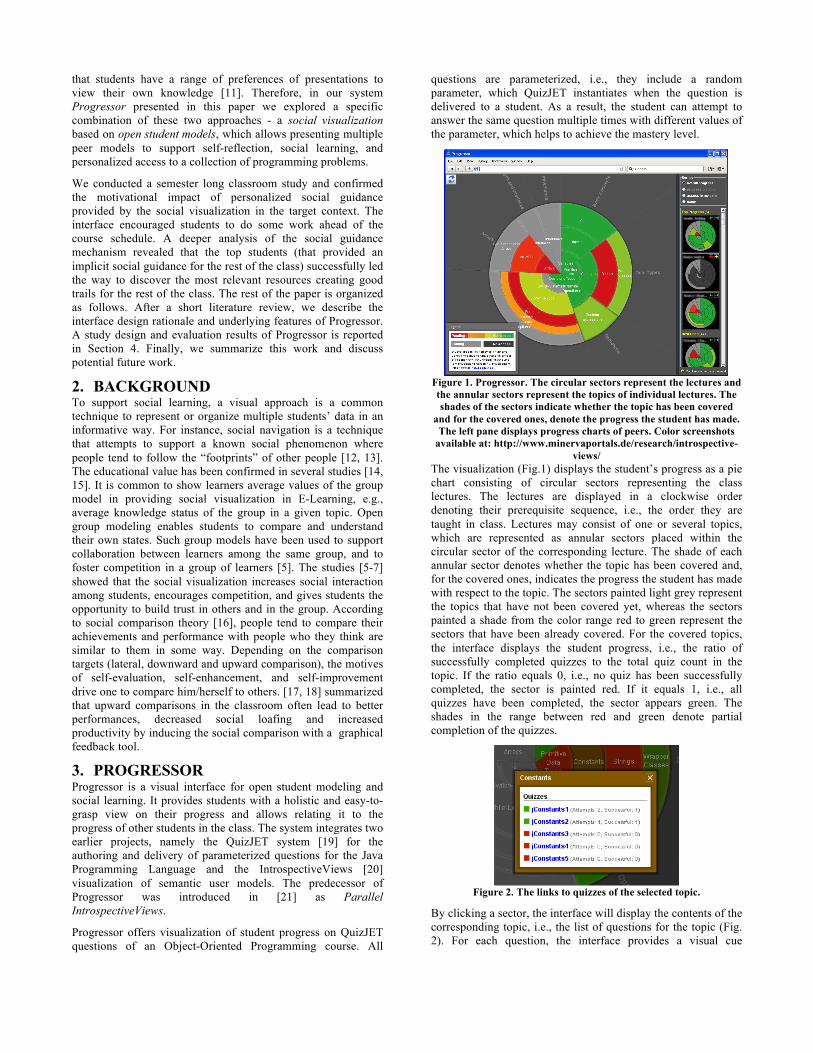
Figure 3. Progressor: Peers model comparison.
In addition to the preview of peers’ progress shown as thumbnails,
the user can obtain a detailed view on the progress of an
individual peer. By clicking the thumbnail of a certain student, the
interface will turn into the one-to-one comparison mode (Fig. 3).
In this mode, the user can obtain detailed information about the
peer’s progress, including the information about the progress on
individual quizzes.
To compensate for the increase peer visibility, Progressor adds
privacy management functionality. The user can grant and
discontinue access to his/her progress data for each peer
individually. The pie charts of the closed models are shaded in
dark grey. The interface allows sending requests for access to
models of other peers. The privacy settings for each peer are
displayed on the peer’s thumbnail as two arrows: the left arrow
indicates the peer’s access to the user’s data and the right arrow
indicates the user’s access to the peer’s data. The arrows may be
in one of the three shades: green – access granted, red – no access,
yellow – access requested. By clicking an arrow, the user can
change the access status for each peer individually, e.g., by
clicking the left arrow the user can grant and discontinue the
peer’s access to the own model. In such a way the user should be
able to quickly define the desired progress sharing settings.
Figure 2. The links to quizzes of the selected topic.
By clicking a sector, the interface will display the contents of the corresponding topic, i.e., the list of questions for the topic (Fig. 2). For each question, the interface provides a visual cue

indicating the student’s progress and displays the total number of attempts the student has made on the quiz and the number of successful attempts. By clicking a quiz label the interface will display the quiz in a new window.
The interface enables students to compare their progress to the progress of their peers, which we believe could be a strong motivating factor to progress. According to social comparison theory, there are three motives namely, self-evaluation, self-enhancement, and self-improvement, which depend on the comparison targets [16]. To check this hypothesis we introduced in progress Progressor a feature of ranking students by progress.
On the right pane (Fig. 1), the interface shows a sortable list of pie chart thumbnails representing progress of other students in the class. These charts provide an immediate overview of the peers’ performance. We hypothesized that the exposure of peer models will have two layers of effects. First, it will support students’ information discovery. Second, it will lead to useful social phenomenon such as feelings of obligations and peer pressure, which result in higher participation in return. Apart from sorting students by name and model access, the user can sort peers’ models by overall progress and by progress in a certain topic. By choosing the option for sorting by progress, the interface will sort the models from the highest to the lowest progress. Also, it will display the models of the three students with the highest progress on the top. We believe that by displaying the progress of top students in such a manner can make the rest of the class eager to catch up with them. The design rationale is aligned with years of social comparison studies’ results where the upward comparisons in the classroom often lead to better performances [18]. The sorted list rudimentarily contains the thumbnail of the user’s own progress, which allows determining his/her ranking in the class with respect to either the overall progress or the progress in a selected topic. Also, the list contains a thumbnail with the average progress of the entire class. We believe that such a way for relating the student’s own progress to the progress of other individual students and the class on average can be a strong motivating factor for completing quizzes in a timely manner and achieving better scores.
In addition to the preview of peers’ progress shown as thumbnails, the user can obtain a detailed view on the progress of an individual peer. By clicking the thumbnail of a certain student, the interface will turn into the one-to-one comparison mode (Fig. 3). In this mode, the user can obtain detailed information about the peer’s progress, including the information about the progress on individual quizzes.
Figure 3. Progressor: Peers model comparison.
To compensate for the increased peer visibility, Progressor adds privacy management functionality. The user can grant and discontinue access to his/her progress data for each peer individually. The pie charts of the closed models are shaded in dark grey. The interface allows sending requests for access to models of other peers. The privacy settings for each peer are displayed on the peer’s thumbnail as two arrows: the left arrow indicates the peer’s access to the user’s data and the right arrow indicates the user’s access to the peer’s data. The arrows may be in one of the three shades: green – access granted, red – no access, yellow – access requested. By clicking an arrow, the user can change the access status for each peer individually, e.g., by clicking the left arrow the user can grant and discontinue the peer’s access to the own model. In such a way the user should be able to quickly define the desired progress visibility settings.
4. EVALUATION To evaluate the social visualization interface for learning, we designed a classroom study. The study was conducted in an undergraduate Object-Oriented Programming course in the 2011 Fall semester in School of Information Sciences, University of Pittsburgh. Progressor was introduced to the class at the beginning of the course and served as the non-mandatory course tool over the complete semester period. All student activity with Progressor was recorded, including the interactions with the visualization and the interactions with the content (self-assessment quizzes). Pre- and post- tests were administered at the beginning and the end of the semester for measuring the students’ learning gain.
4.1 Experimental Design and Setup To investigate the additional effects of privacy in a social visualization system, students were randomly assigned into two groups with different initial privacy settings. Students of Group started with the privacy settings that made their progress visible to all peers (all students could view the details of their models; we called it an Open group). Students of Group 2 was started with the privacy setting that made their progress invisible (all students could not viewed any details of their models; we called it a Closed group). Students acknowledged that they were allowed to change their visibility settings from Open to Closed, Closed to Open at any given time. Table 1 summarizes the groups and number of users. Accounts were created for 48 students enrolled in the course, 24 for each visibility setup group. Note that the use of the system was not a course requirement. As a result, 22 students did not use Progressor at all (Group A). Among the remaining 36 students, 11 students interacted solely with Progressor social visualization component and did not work with the content at all (Group B). Group C represents the students who worked with the self-assessment quizzes and also interacted with the social features. Over the course duration, 15 out of 48 students dropped the course, 6 from Group A, 6 from Group B, and 3 from Group C.
Table 1. Progressor user groups summary
Groups Open Closed total A. No interactions 10 12 22 B. Visualization 5 6 11 C. Visualization + Content 9 6 15
total 24 24 48
4.2 The Use of Social Visualization The first question of our study was whether the social visualization interface was interesting and meaningful for the

students. Note that in its essence, social visualization was an interface to access self-assessment questions. If the visualization itself was not interesting and useful, we should expect that the students communicated with visualization very little focusing instead on the work with the quizzes. However, the log data demonstrated exactly the opposite. Most remarkable is the very existence of the group B. As mentioned above, 11 students forming Group B used the system solely to explore the progress of their peers contributing 18.67% of all visualization interactions. The use of the social visualization features, was, however, even higher in the group C that contributed the remaining 81.33% of interactions with the visualization part. An interesting observation was that those who had their work visible to the class interacted with the system more actively. We aggregated the interactions among Group B & Group C and we found that there was 60.24% of total usage from the Open group and 39.76% from the Closed group. Such results backed up our general assumption that increasing the exposure has impacts on the participation. Table 2 summarized the usage of social features for Open and Closed groups.
Table 2. Summary of social features usage frequency Open Closed Privacy change 58 29 Peer comparison 13 20 Sorting 20 16
4.3 The Impact of Social Visualization To assess the impact of the social visualization we compared the student work with self-assessment quizzes through Progressor (Tab. 3) with another comparable class: a class that accessed self-assessment quizzes using a traditional course portal called QuizJET. The designs and effects of using QuizJET is reported in [19]. The studies of QuizJET were performed in the context of the same course with a comparable student cohort thus the main difference between the groups was the availability of the social visualization interface.
We expected to discover several effects of social visualization. First, we expected that visibility of other students’ progress will encourage students who used Progressor to work more with the quizzes. Second, we hoped that the visibility of past students’ success shown by Progressor will provide an effective social guidance, i.e., focus students’ attention on most appropriate quizzes to try – not those that are still too complicated to the class level, neither those that are too simple and useless for learning. Note that students who used the baseline QuizJET system had no social guidance – for them all questions looked equally good to try. We also expected that the ability to focus on more appropriate quizzes will result in a better learning outcome.
Table 3. Summary of content interactions
QuizJET Progressor Parameter n=16 n=12
Attempt 80.81±22.06 102.17±21.98 Success Rate 42.63%±1.99% 75.55%±3.31%
Average User
Statistic Session 3.75±0.53 5.42±1.50 Pre-test score (M±SE) 9.56±1.29 3.54±0.91 Post-test score (M±SE) 17.12±0.86 12.38±1.24
Normalized Knowledge Gain 0.36±0.05 0.56±0.06
Due to a relatively small number of students who actively
worked with quizzes, we were not able to fully confirm our first hypothesis, however. As Table 3 shows, students in Progressor group who had access to social visualization, indeed, worked with the quizzes considerably more than students in the QuizJET group. However, this difference was not significant.
4.3.1 Social guidance effect To assess the social guidance effect, we examined student success rate (a ratio of correct solutions to total attempts). A low success rate would indicate that students frequently accessed questions that are too hard for their current level of knowledge. A high, but not 100% success rate would indicate that students were guided to questions of optimal difficulty. As Table 3 shows, students managed to achieve significantly higher success rate, t(19)=2.86, p<.01, d=1.31. Levene’s test indicated unequal variances (F=65.938, p<.01), so the degrees of freedom were adjusted from 26 to 19. Such results (no significant more of work with the growth of the success rate) demonstrates the effectiveness of the social guidance which guided the students to the questions that they are ready to handle.
Figure 4. The distribution of all attempts performed by the students
through Progressor. X axis is the time; Y axis is the complexity of the quizzes. Blue dots represent the Top3 students’ actions; blue
ones are the actions belonged to the rest of the class.
We expected that the mechanism of social guidance is driven by the leading ability of strong students. These students have a much better understanding of the course content than the rest of the class and had a good ability to choose appropriate questions to try. Through the social visibility process, their action can effectively guide the rest of the class. To find out how students followed the social guidance, we plotted each student’s interactions with the content in Figure 4, while X-axis represents time and Y-axis represents the complexity of the quizzes. Since the top 3 class leaders were always displayed on top of the model list, we color-coded the interactions into blue and orange, for class leaders respectively the rest of the students in the class. The complexity of the content increase as the course moved toward the end of the semester. There were two dotted lines drawn to distinguish the lecture stream area (between lines) and self-motivated area (outside the lines). We found three interesting phenomena. First of all, the class leaders tended to explore quizzes ahead of the course schedule (there are more blue dots that exceed the upper lecture stream threshold). Secondly, class leader tended to work on the quizzes earlier than the rest of the class, except at the beginning of the course. Such effect was especially obvious as the complexity increased (there are more blue dots that appear before the orange ones in the chronological order). Lastly, the class leaders were more self-motivated and had more work done (there are more blue dots

than orange ones outside the lecture streams).
4.3.2 Social learning effect To evaluate the impacts of the social visualization interface on student learning, we measured the differences between pre- and post- tests. We found that the students achieved a significant knowledge growth as measured by pre- and post- test scores for both QuizJET and Progressor, t1(15)= 6.108, p< .01, t2(11)= 5.348, p< .01. Due to the group that used Progressor being particularly weak, potentially it had bigger room to improve. Therefore, in order to have a fair comparison between groups, we calculated the normalized knowledge gain. An independent sample T-Test was performed to examine the normalized knowledge gain between the different interfaces (QuizJET and Progressor). We found that student obtained significant normalized knowledge gain by working on the self-assessment questions through Progressor (M= 0.56, SE= 0.06) than QuizJET (M= 0.36, SE= 0.05), t(26)= 2.181, p< .05, d= 0.85. It should be noted that all three studies were performed in a non-controlled classroom context where the systems were used as just supplementary course tools. The students were able to learn the subject by many ways besides the self-assessment questions from the systems.
5. SUMMARY In this paper we introduced an innovative social comparative visualization for E-learning. The visualization was implemented in the Progressor system and explored in a semester-long classroom study that was also presented in the paper. We observed the impact of social visualization: when students are enabled to compare their own progress with their peers they work and they tend to follow the traces left by the most advanced peers beyond the topics covered each week in the class. The classroom study confirmed the motivational impact of personalized social guidance provided by the visualization in the context programming language learning. The visualization encouraged students to work more and supported them in achieving a higher success rate. Moreover, class leaders provided an implicit social guidance for the rest of the class and successfully led the way to discover most relevant resources creating good trails for the rest of the class.
6. REFERENCES [1] Chou, C., Interactivity and interactive functions in web-
based learning systems: A technical framework for designers. British Journal of Educational Technology, 2003. 34(3): p. 265-279.
[2] Crowther, M.S., C.C. Keller, and G.L. Waddoups, Improving the quality and effectiveness of computer-mediated instruction through usability evaluations. British Journal of Educational Technology, 2004. 35(3): p. 289-303.
[3] Barolli, L., et al., A web-based e-learning system for increasing study efficiency by stimulating learner's motivation. Information Systems Frontiers, 2006. 8(4): p. 297-306.
[4] Méndez, J.A., et al., A web-based tool for control engineering teaching. Computer Applications in Engineering Education, 2006. 14(3): p. 178-187.
[5] Vassileva, J. and L. Sun, Evolving a Social Visualization Design Aimed at Increasing Participation in a Class-Based Online Community. International Journal of Cooperative Information Systems (IJCIS), 2008. 17(4): p. 443-466.
[6] Bull, S. and M. Britland. Group Interaction Prompted by a Simple Assessed Open Learner Model that can be Optionally Released to Peers. in Workshop on Personalization in E-learning Environments at Individual and Group Level at the 11th International Conference on User Modeling, UM 2007. 2007. Corfu, Greece.
[7] Mazza, R. and V. Dimitrova, CourseVis: A graphical student monitoring tool for supporting instructors in web-based distance courses. International Journal of Human-Computer Studies, 2007. 65(2): p. 125-139.
[8] Bull, S. Supporting learning with open learner models. in 4th Hellenic Conference on Information and Communication Technologies in Education. 2004. Athens, Greece.
[9] Mitrovic, A. and B. Martin, Evaluating the Effect of Open Student Models on Self-Assessment. International Journal of Artificial Intelligence in Education, 2007. 17(2): p. 121-144.
[10] Zapata-Rivera, J.-D. and J.E. Greer. Inspecting and Visualizing Distributed Bayesian Student Models. in 5th International conference Intelligent Tutoring Systtems. 2000.
[11] Mabbott, A. and S. Bull, Alternative Views on Knowledge: Presentation of Open Learner Models Intelligent Tutoring Systems, J.C. Lester, R.M. Vicari, and F.b. Paraguaçu, Editors. 2004, Springer Berlin / Heidelberg. p. 131-150.
[12] Dieberger, A., Supporting social navigation on the World Wide Web. International Journal of Human-Computer Interaction, 1997. 46: p. 805-825.
[13] Wexelblat, A. and P. Maes, Footprints: history-rich tools for information foraging, in Proceedings of the SIGCHI conference on Human factors in computing systems: the CHI is the limit. 1999, ACM: Pittsburgh, Pennsylvania, United States. p. 270-277.
[14] Brusilovsky, P., S. Sosnovsky, and M. Yudelson, Addictive links: The motivational value of adaptive link annotation. New Review of Hypermedia and Multimedia, 2009. 15(1): p. 97-118.
[15] Kurhila, J., et al., Educo- A Collaborative Learning Environment Based on Social Navigation Adaptive Hypermedia and Adaptive Web-Based Systems, P. De Bra, P. Brusilovsky, and R. Conejo, Editors. 2006, Springer Berlin / Heidelberg. p. 242-252.
[16] Festinger, L., A theory of social comparison processes. Human Relations, 1954. 7: p. 117-140.
[17] Veroff, J., Social comparison and the development of achievement motivation. Achievement related motives in children, ed. C.P. Smith. 1969, New York: Sage.
[18] Pieternel Dijkstra, et al., Social Comparison in the Classroom: A Review. REVIEW OF EDUCATIONAL RESEARCH, 2008. 78(4).
[19] Hsiao, I.-H., S. Sosnovsky, and P. Brusilovsky, Guiding students to the right questions: adaptive navigation support in an E-Learning system for Java programming. Journal of Computer Assisted Learning, 2010. 26(4): p. 270-283.
[20] Bakalov, F., et al. IntrospectiveViews: An Interface for Scrutinizing Semantic User Models. in 18th International Conference on User Modeling, Adaptation, and Personalization. 2010. Big Island, HI, USA: Springer.
[21] Hsiao, I.-H., et al. Open Social Student Modeling: Visualizing Student Models with Parallel IntrospectiveViews. in 19th International Conference on User Modeling, Adaptation and Personalization. 2011. Girona, Spain: Lecture Notes in Computer Science.


![Comparative Analysis of Content-based Personalized ......Comparative Analysis of Content-based Personalized Microblog Recommendations [Experiments and Analysis] E Karra Taniskidou](https://img.pdfslide.us/doc/110x75/60a524598498bf72d253ee71/comparative-analysis-of-content-based-personalized-comparative-analysis.jpg)


![CrusView: A Java-Based Visualization Platform for Comparative … · CrusView: A Java-Based Visualization Platform for Comparative Genomics Analyses in Brassicaceae Species[OPEN]](https://img.pdfslide.us/doc/110x75/5fe2db489d40b15c7c182911/crusview-a-java-based-visualization-platform-for-comparative-crusview-a-java-based.jpg)