Embed Size (px)
Citation preview
Phytochemistry xxx (2014) xxx–xxx
Contents lists available at ScienceDirect
Phytochemistry
journal homepage: www.elsevier .com/locate /phytochem
Comparative plant sphingolipidomic reveals specific lipids in seedsand oil
http://dx.doi.org/10.1016/j.phytochem.2014.03.0230031-9422/� 2014 Elsevier Ltd. All rights reserved.
⇑ Corresponding author. Tel.: +33 (0)1 30 83 31 90; fax: +33 (0)1 30 83 31 19.E-mail address: [email protected] (F. Tellier).
Please cite this article in press as: Tellier, F., et al. Comparative plant sphingolipidomic reveals specific lipids in seeds and oil. Phytochemistryhttp://dx.doi.org/10.1016/j.phytochem.2014.03.023
Frédérique Tellier a,⇑, Alessandra Maia-Grondard a, Isabelle Schmitz-Afonso b, Jean-Denis Faure a
a Institut Jean-Pierre Bourgin, UMR1318, INRA-AgroParisTech, route de Saint-Cyr, 78026 Versailles Cedex, Franceb Centre de recherche de Gif, Institut de Chimie des Substances Naturelles, CNRS, Avenue de la Terrasse, 91198 Gif-sur-Yvette, France
a r t i c l e i n f o a b s t r a c t
Article history:Received 7 November 2013Received in revised form 17 March 2014Available online xxxx
Keywords:SeedlingSeedOilSphingolipidCeramideGIPCMass spectrometry
Plant sphingolipids are a highly diverse family of structural and signal lipids. Owing to their chemicaldiversity and complexity, a powerful analytical method was required to identify and quantify a largenumber of individual molecules with a high degree of structural accuracy. By using ultra-performanceliquid chromatography with a single elution system coupled to electrospray ionization tandem massspectrometry (UPLC–ESI-MS/MS) in the positive multiple reaction monitoring (MRM) mode, detailedsphingolipid composition was analyzed in various tissues of two Brassicaceae species Arabidopsis thalianaand Camelina sativa. A total of 300 molecular species were identified defining nine classes of sphingoli-pids, including Cers, hCers, Glcs and GIPCs. High-resolution mass spectrometry identified sphingolipidsincluding amino- and N-acylated-GIPCs. The comparative analysis of seedling, seed and oil sphingolipidsshowed tissue specific distribution suggesting metabolic channeling and compartmentalization
� 2014 Elsevier Ltd. All rights reserved.
Introduction
Plant sphingolipids is a complex family of lipids with a largestructural diversity (Lynch and Dunn, 2004; Pata et al., 2010;Sperling and Heinz, 2003). The basic building block of sphingoli-pids is an amino alcohol long-chain base (LCB), which is composedpredominantly of 18 carbon atoms. The LCBs are characterized bythe presence of an amino group on the second carbon (C2) and atleast, two hydroxyl groups on the first (C1) and third carbons(C3) to form sphinganine (d18:0). The LCB moiety is also oftenhydroxylated at position C4 leading to 4-hydroxysphinganine(t18:0). Finally, LCBs can also be desaturated (D4 and/or D8) toform for instance, 8-sphingenine (d18:1, D8) or 4-hydroxy-8-sphingenine (t18:1, D8) (Markham et al., 2006). The LCBs areN-acylated with fatty acids (FAs) to form ceramides (Cers). Thefatty acid moieties are diverse in structure with chain lengths rang-ing from C16 to C26, a-hydroxylation (hCers) and/or desaturation(Markham and Jaworski, 2007). The attachment of a polar headgroup to the primary hydroxyl group of the LCB moiety of Cersand hCers produced complex sphingolipids such as glucosylcera-mides (Glcs) and glycosylinositolphosphoceramides (GIPCs) (Blaasand Humpf, 2013; Buré et al., 2011). The various FAs, LCBs, andhead groups generate an important structural diversity and com-plexity of sphingolipids, with at least 168 individual molecular
species of sphingolipids reported in Arabidopsis (Markham andJaworski, 2007). Recently, additional identifications (Blaas andHumpf, 2013; Buré et al., 2011) increased this number in plantsto about a thousand molecular species which makes sphingolipidsto the most structurally diverse group of lipids.
Plant sphingolipids are bioactive compounds that not only serveas structural components of cellular membranes but are also in-volved in different physiological functions, such as cell polarity,programmed cell death, guard cell closure and different stress re-sponses (Berkey et al., 2012; Lynch and Dunn, 2004; Markhamet al., 2013; Pata et al., 2010; Sperling and Heinz, 2003). In plants,sphingolipids are important for plant development, adaptation toabiotic stress and the response to pathogens (Chao et al., 2011;Chen et al., 2008, 2012; Markham et al., 2011; Saucedo-Garciaet al., 2011; Wang et al., 2008). However, the molecular determi-nants of sphingolipid functions are still poorly understood. Becauseof their structural complexity, powerful analytical tools arerequired to identify a large number of individual sphingolipidmolecules with a high degree of structural accuracy. One has toprecisely determine the structure of the LCB, the FA as well asthe polar head. It has been showed for instance that the FA lengthor the LCB C4-hydroxylation were essential for plant sphingolipidfunctions (Chen et al., 2008; Markham et al., 2011). The methodof choice for sphingolipid analysis is liquid chromatographycoupled to electrospray ionization, tandem mass spectrometry(LC–ESI-MS/MS) that provides the necessary sensitivity, structuralspecificity and relative high-throughput. It could also be carried
(2014),
2 F. Tellier et al. / Phytochemistry xxx (2014) xxx–xxx
out for small sample quantities and in complex matrices. Thismethod was previously applied with success to animal (Bielawskiet al., 2006; Bui et al., 2012; Masood et al., 2012; Merrill et al.,2005; Shaner et al., 2009) and plant (Bartke et al., 2006; Islamet al., 2012; Markham and Jaworski, 2007) sphingolipids. In plants,the GIPCs class was also specifically analyzed by matrix-assistedlaser desorption/ionization (MALDI) MS/MS (Buré et al., 2011)and by LC–Fourier Transform MS (Blaas and Humpf, 2013).
The objective of this work was to develop a simplified ultraper-formance liquid chromatography (UPLC) separation coupled to ESI-MS/MS method to quickly obtain a complete profiling of differentclasses of sphingolipids including Cers, hCers, Glcs and GIPCs instructurally and functionally very different plant tissues. Thismethod was applied to the comparative sphingolipidomic of thethree different plant tissues: the actively growing seedlings, thequiescent seeds and its storage fraction, the pressed oil. The pres-ence of sphingolipids in plant oil was never precisely documentedbefore and was a matter of debate. The oil fraction was also ofinterest to validate our analytical method in presence of a high ma-trix effect in the ESI-MS/MS mode.
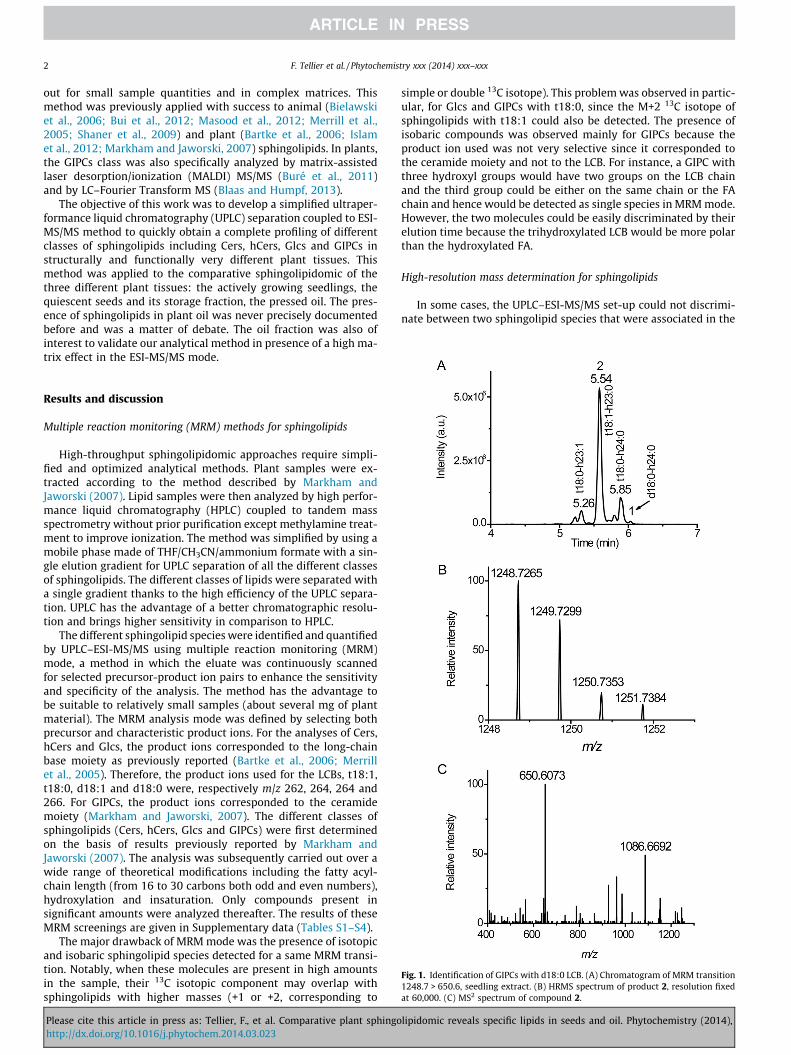
Fig. 1. Identification of GIPCs with d18:0 LCB. (A) Chromatogram of MRM transition1248.7 > 650.6, seedling extract. (B) HRMS spectrum of product 2, resolution fixedat 60,000. (C) MS2 spectrum of compound 2.
Results and discussion
Multiple reaction monitoring (MRM) methods for sphingolipids
High-throughput sphingolipidomic approaches require simpli-fied and optimized analytical methods. Plant samples were ex-tracted according to the method described by Markham andJaworski (2007). Lipid samples were then analyzed by high perfor-mance liquid chromatography (HPLC) coupled to tandem massspectrometry without prior purification except methylamine treat-ment to improve ionization. The method was simplified by using amobile phase made of THF/CH3CN/ammonium formate with a sin-gle elution gradient for UPLC separation of all the different classesof sphingolipids. The different classes of lipids were separated witha single gradient thanks to the high efficiency of the UPLC separa-tion. UPLC has the advantage of a better chromatographic resolu-tion and brings higher sensitivity in comparison to HPLC.
The different sphingolipid species were identified and quantifiedby UPLC–ESI-MS/MS using multiple reaction monitoring (MRM)mode, a method in which the eluate was continuously scannedfor selected precursor-product ion pairs to enhance the sensitivityand specificity of the analysis. The method has the advantage tobe suitable to relatively small samples (about several mg of plantmaterial). The MRM analysis mode was defined by selecting bothprecursor and characteristic product ions. For the analyses of Cers,hCers and Glcs, the product ions corresponded to the long-chainbase moiety as previously reported (Bartke et al., 2006; Merrillet al., 2005). Therefore, the product ions used for the LCBs, t18:1,t18:0, d18:1 and d18:0 were, respectively m/z 262, 264, 264 and266. For GIPCs, the product ions corresponded to the ceramidemoiety (Markham and Jaworski, 2007). The different classes ofsphingolipids (Cers, hCers, Glcs and GIPCs) were first determinedon the basis of results previously reported by Markham andJaworski (2007). The analysis was subsequently carried out over awide range of theoretical modifications including the fatty acyl-chain length (from 16 to 30 carbons both odd and even numbers),hydroxylation and insaturation. Only compounds present insignificant amounts were analyzed thereafter. The results of theseMRM screenings are given in Supplementary data (Tables S1–S4).
The major drawback of MRM mode was the presence of isotopicand isobaric sphingolipid species detected for a same MRM transi-tion. Notably, when these molecules are present in high amountsin the sample, their 13C isotopic component may overlap withsphingolipids with higher masses (+1 or +2, corresponding to
Please cite this article in press as: Tellier, F., et al. Comparative plant sphingohttp://dx.doi.org/10.1016/j.phytochem.2014.03.023
simple or double 13C isotope). This problem was observed in partic-ular, for Glcs and GIPCs with t18:0, since the M+2 13C isotope ofsphingolipids with t18:1 could also be detected. The presence ofisobaric compounds was observed mainly for GIPCs because theproduct ion used was not very selective since it corresponded tothe ceramide moiety and not to the LCB. For instance, a GIPC withthree hydroxyl groups would have two groups on the LCB chainand the third group could be either on the same chain or the FAchain and hence would be detected as single species in MRM mode.However, the two molecules could be easily discriminated by theirelution time because the trihydroxylated LCB would be more polarthan the hydroxylated FA.
High-resolution mass determination for sphingolipids
In some cases, the UPLC–ESI-MS/MS set-up could not discrimi-nate between two sphingolipid species that were associated in the
lipidomic reveals specific lipids in seeds and oil. Phytochemistry (2014),
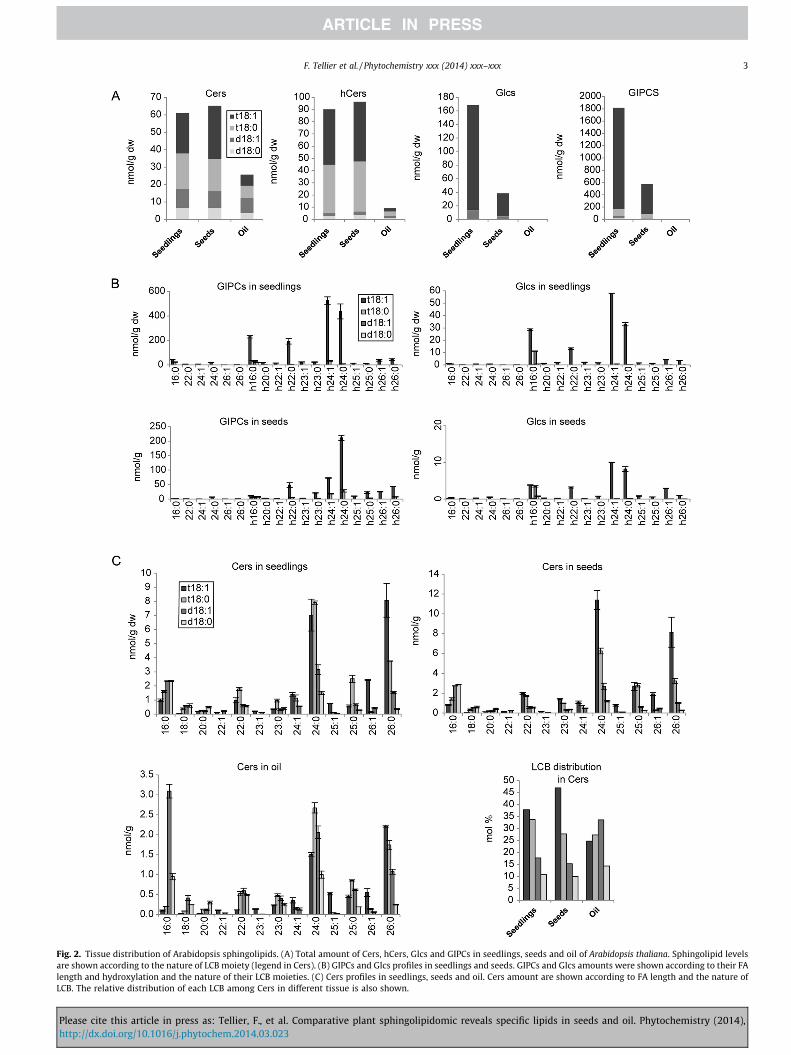
Fig. 2. Tissue distribution of Arabidopsis sphingolipids. (A) Total amount of Cers, hCers, Glcs and GIPCs in seedlings, seeds and oil of Arabidopsis thaliana. Sphingolipid levelsare shown according to the nature of LCB moiety (legend in Cers). (B) GIPCs and Glcs profiles in seedlings and seeds. GIPCs and Glcs amounts were shown according to their FAlength and hydroxylation and the nature of their LCB moieties. (C) Cers profiles in seedlings, seeds and oil. Cers amount are shown according to FA length and the nature ofLCB. The relative distribution of each LCB among Cers in different tissue is also shown.
F. Tellier et al. / Phytochemistry xxx (2014) xxx–xxx 3
Please cite this article in press as: Tellier, F., et al. Comparative plant sphingolipidomic reveals specific lipids in seeds and oil. Phytochemistry (2014),http://dx.doi.org/10.1016/j.phytochem.2014.03.023
4 F. Tellier et al. / Phytochemistry xxx (2014) xxx–xxx
same transition. High-resolution mass spectrometry (HRMS) bylinear ion trap–orbitrap mass spectrometry associated to a highperformance liquid chromatography (HPLC) separation was thusrequired to elucidate the structure of the different molecular spe-cies. In particular for GIPCs with d18:0, a product more polar than
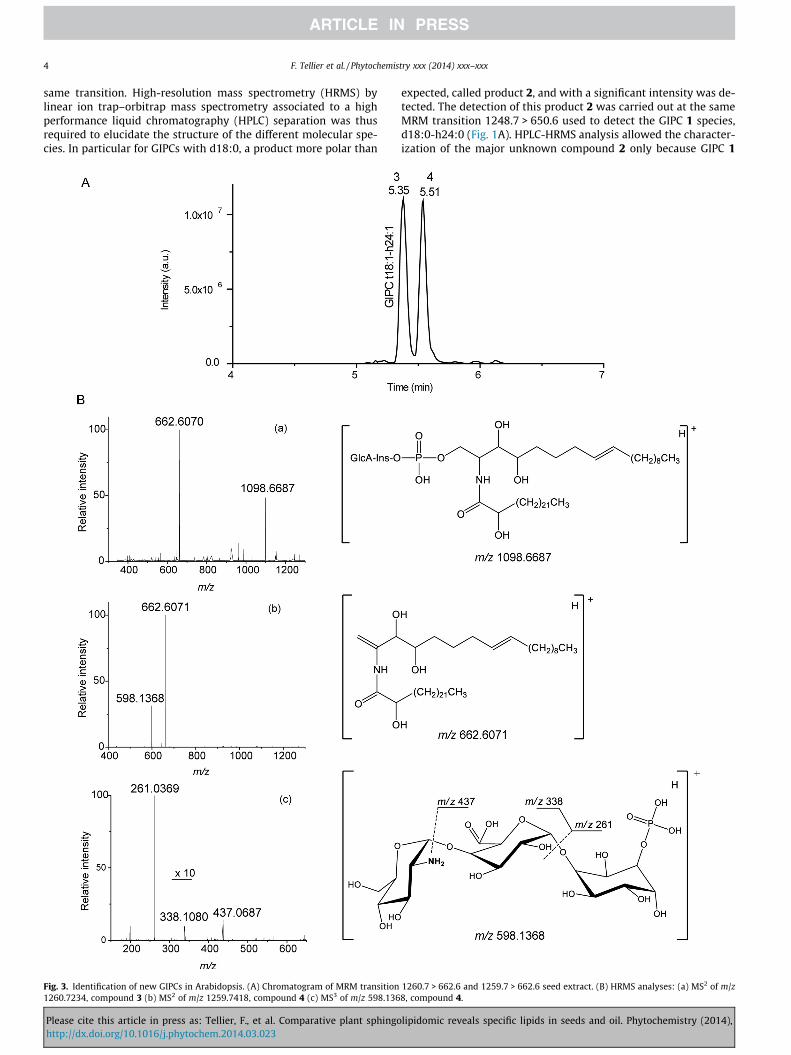
Fig. 3. Identification of new GIPCs in Arabidopsis. (A) Chromatogram of MRM transition1260.7234, compound 3 (b) MS2 of m/z 1259.7418, compound 4 (c) MS3 of m/z 598.136
Please cite this article in press as: Tellier, F., et al. Comparative plant sphingohttp://dx.doi.org/10.1016/j.phytochem.2014.03.023
expected, called product 2, and with a significant intensity was de-tected. The detection of this product 2 was carried out at the sameMRM transition 1248.7 > 650.6 used to detect the GIPC 1 species,d18:0-h24:0 (Fig. 1A). HPLC-HRMS analysis allowed the character-ization of the major unknown compound 2 only because GIPC 1
1260.7 > 662.6 and 1259.7 > 662.6 seed extract. (B) HRMS analyses: (a) MS2 of m/z8, compound 4.
lipidomic reveals specific lipids in seeds and oil. Phytochemistry (2014),
F. Tellier et al. / Phytochemistry xxx (2014) xxx–xxx 5
could not be detected. The HRMS spectrum of this compound 2exhibited a [M+H]+ ion signal at m/z 1248.7265 (Dm/z = 3.0 ppm)corresponding to the C59H110024NP formula (Fig. 1B). The CID spec-trum of 2 gave the major ion product at m/z 650.5073 (formulaC41H8004N, Dm/z = �1.4 ppm) corresponding to the ceramide moi-ety (Fig. 1C). Only two fragment ions could be identified in theCID spectrum due to low signal to noise ratio. Indeed, the sensitiv-ity of the orbitrap analyser is lower in comparison to the MRMdetection mode for the triple quadrupole analyser. The rawformula of the ceramide moiety indicated the presence of an oddcarbon number for either the LCB or the FA chain, associated to a
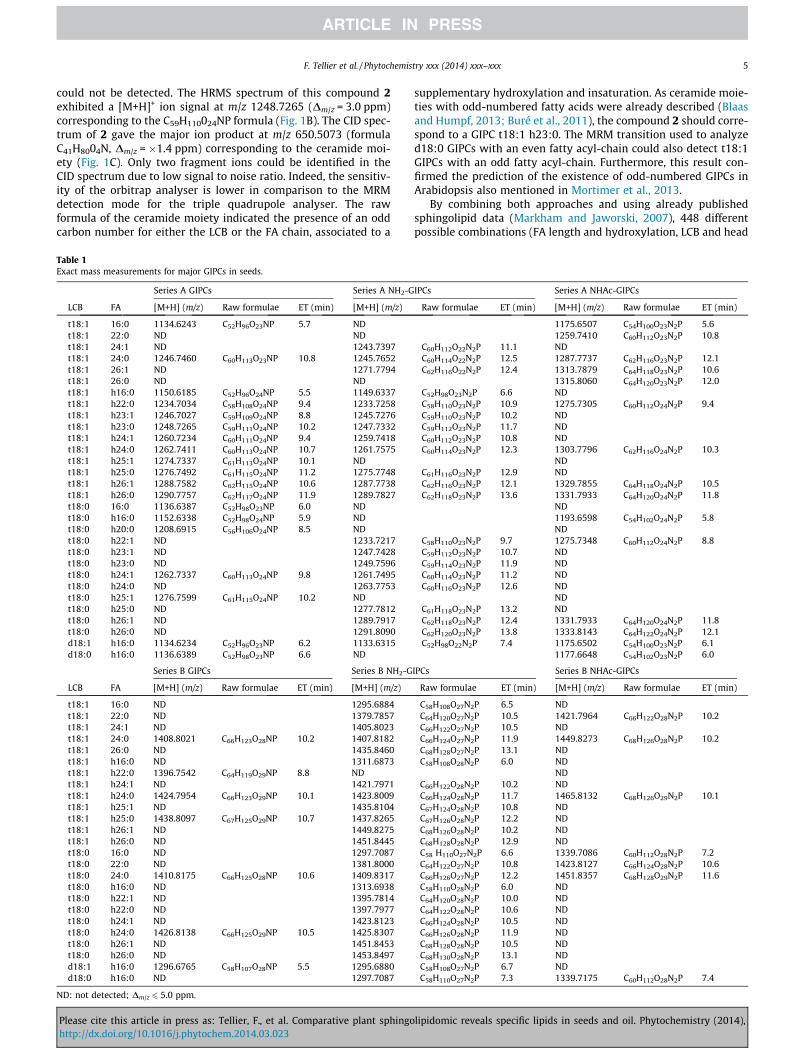
Table 1Exact mass measurements for major GIPCs in seeds.
Series A GIPCs Series A NH2-G
LCB FA [M+H] (m/z) Raw formulae ET (min) [M+H] (m/z)
t18:1 16:0 1134.6243 C52H96O23NP 5.7 NDt18:1 22:0 ND NDt18:1 24:1 ND 1243.7397t18:1 24:0 1246.7460 C60H113O23NP 10.8 1245.7652t18:1 26:1 ND 1271.7794t18:1 26:0 ND NDt18:1 h16:0 1150.6185 C52H96O24NP 5.5 1149.6337t18:1 h22:0 1234.7034 C58H108O24NP 9.4 1233.7258t18:1 h23:1 1246.7027 C59H109O24NP 8.8 1245.7276t18:1 h23:0 1248.7265 C59H111O24NP 10.2 1247.7332t18:1 h24:1 1260.7234 C60H111O24NP 9.4 1259.7418t18:1 h24:0 1262.7411 C60H113O24NP 10.7 1261.7575t18:1 h25:1 1274.7337 C61H113O24NP 10.1 NDt18:1 h25:0 1276.7492 C61H115O24NP 11.2 1275.7748t18:1 h26:1 1288.7582 C62H115O24NP 10.6 1287.7738t18:1 h26:0 1290.7757 C62H117O24NP 11.9 1289.7827t18:0 16:0 1136.6387 C52H98O23NP 6.0 NDt18:0 h16:0 1152.6338 C52H98O24NP 5.9 NDt18:0 h20:0 1208.6915 C56H106O24NP 8.5 NDt18:0 h22:1 ND 1233.7217t18:0 h23:1 ND 1247.7428t18:0 h23:0 ND 1249.7596t18:0 h24:1 1262.7337 C60H113O24NP 9.8 1261.7495t18:0 h24:0 ND 1263.7753t18:0 h25:1 1276.7599 C61H115O24NP 10.2 NDt18:0 h25:0 ND 1277.7812t18:0 h26:1 ND 1289.7917t18:0 h26:0 ND 1291.8090d18:1 h16:0 1134.6234 C52H96O23NP 6.2 1133.6315d18:0 h16:0 1136.6389 C52H98O23NP 6.6 ND
Series B GIPCs Series B NH2-G
LCB FA [M+H] (m/z) Raw formulae ET (min) [M+H] (m/z)
t18:1 16:0 ND 1295.6884t18:1 22:0 ND 1379.7857t18:1 24:1 ND 1405.8023t18:1 24:0 1408.8021 C66H123O28NP 10.2 1407.8182t18:1 26:0 ND 1435.8460t18:1 h16:0 ND 1311.6873t18:1 h22:0 1396.7542 C64H119O29NP 8.8 NDt18:1 h24:1 ND 1421.7971t18:1 h24:0 1424.7954 C66H123O29NP 10.1 1423.8009t18:1 h25:1 ND 1435.8104t18:1 h25:0 1438.8097 C67H125O29NP 10.7 1437.8265t18:1 h26:1 ND 1449.8275t18:1 h26:0 ND 1451.8445t18:0 16:0 ND 1297.7087t18:0 22:0 ND 1381.8000t18:0 24:0 1410.8175 C66H125O28NP 10.6 1409.8317t18:0 h16:0 ND 1313.6938t18:0 h22:1 ND 1395.7814t18:0 h22:0 ND 1397.7977t18:0 h24:1 ND 1423.8123t18:0 h24:0 1426.8138 C66H125O29NP 10.5 1425.8307t18:0 h26:1 ND 1451.8453t18:0 h26:0 ND 1453.8497d18:1 h16:0 1296.6765 C58H107O28NP 5.5 1295.6880d18:0 h16:0 ND 1297.7087
ND: not detected; Dm/z 6 5.0 ppm.
Please cite this article in press as: Tellier, F., et al. Comparative plant sphingohttp://dx.doi.org/10.1016/j.phytochem.2014.03.023
supplementary hydroxylation and insaturation. As ceramide moie-ties with odd-numbered fatty acids were already described (Blaasand Humpf, 2013; Buré et al., 2011), the compound 2 should corre-spond to a GIPC t18:1 h23:0. The MRM transition used to analyzed18:0 GIPCs with an even fatty acyl-chain could also detect t18:1GIPCs with an odd fatty acyl-chain. Furthermore, this result con-firmed the prediction of the existence of odd-numbered GIPCs inArabidopsis also mentioned in Mortimer et al., 2013.
By combining both approaches and using already publishedsphingolipid data (Markham and Jaworski, 2007), 448 differentpossible combinations (FA length and hydroxylation, LCB and head
IPCs Series A NHAc-GIPCs
Raw formulae ET (min) [M+H] (m/z) Raw formulae ET (min)
1175.6507 C54H100O23N2P 5.61259.7410 C60H112O23N2P 10.8
C60H112O22N2P 11.1 NDC60H114O22N2P 12.5 1287.7737 C62H116O23N2P 12.1C62H116O22N2P 12.4 1313.7879 C64H118O23N2P 10.6
1315.8060 C64H120O23N2P 12.0C52H98O23N2P 6.6 NDC58H110O23N2P 10.9 1275.7305 C60H112O24N2P 9.4C59H110O23N2P 10.2 NDC59H112O23N2P 11.7 NDC60H112O23N2P 10.8 NDC60H114O23N2P 12.3 1303.7796 C62H116O24N2P 10.3
NDC61H116O23N2P 12.9 NDC62H116O23N2P 12.1 1329.7855 C64H118O24N2P 10.5C62H118O23N2P 13.6 1331.7933 C64H120O24N2P 11.8
ND1193.6598 C54H102O24N2P 5.8ND
C58H110O23N2P 9.7 1275.7348 C60H112O24N2P 8.8C59H112O23N2P 10.7 NDC59H114O23N2P 11.9 NDC60H114O23N2P 11.2 NDC60H116O23N2P 12.6 ND
NDC61H118O23N2P 13.2 NDC62H118O23N2P 12.4 1331.7933 C64H120O24N2P 11.8C62H120O23N2P 13.8 1333.8143 C64H122O24N2P 12.1C52H98O22N2P 7.4 1175.6502 C54H100O23N2P 6.1
1177.6648 C54H102O23N2P 6.0
IPCs Series B NHAc-GIPCs
Raw formulae ET (min) [M+H] (m/z) Raw formulae ET (min)
C58H108O27N2P 6.5 NDC64H120O27N2P 10.5 1421.7964 C66H122O28N2P 10.2C66H122O27N2P 10.5 NDC66H124O27N2P 11.9 1449.8273 C68H126O28N2P 10.2C68H128O27N2P 13.1 NDC58H108O28N2P 6.0 ND
NDC66H122O28N2P 10.2 NDC66H124O28N2P 11.7 1465.8132 C68H126O29N2P 10.1C67H124O28N2P 10.8 NDC67H126O28N2P 12.2 NDC68H126O28N2P 10.2 NDC68H128O28N2P 12.9 NDC58 H110O27N2P 6.6 1339.7086 C60H112O28N2P 7.2C64H122O27N2P 10.8 1423.8127 C66H124O28N2P 10.6C66H126O27N2P 12.2 1451.8357 C68H128O29N2P 11.6C58H110O28N2P 6.0 NDC64H120O28N2P 10.0 NDC64H122O28N2P 10.6 NDC66H124O28N2P 10.5 NDC66H126O28N2P 11.9 NDC68H128O28N2P 10.5 NDC68H130O28N2P 13.1 NDC58H108O27N2P 6.7 NDC58H110O27N2P 7.3 1339.7175 C60H112O28N2P 7.4
lipidomic reveals specific lipids in seeds and oil. Phytochemistry (2014),
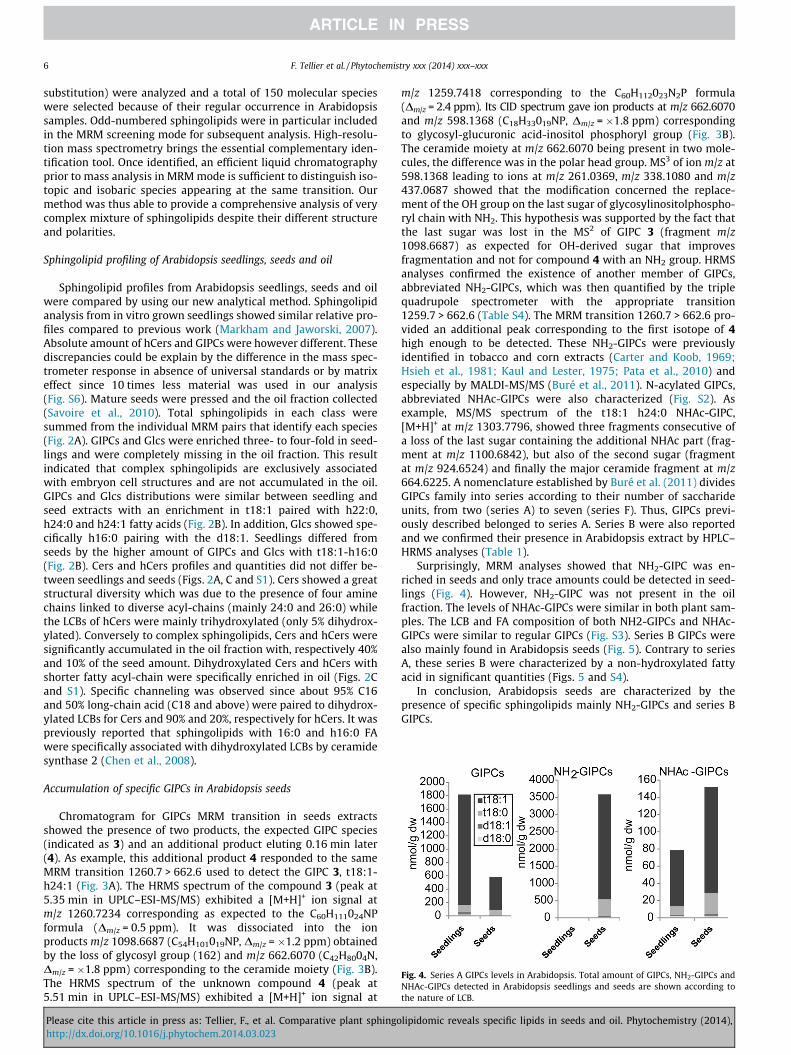
Fig. 4. Series A GIPCs levels in Arabidopsis. Total amount of GIPCs, NH2-GIPCs andNHAc-GIPCs detected in Arabidopsis seedlings and seeds are shown according tothe nature of LCB.
6 F. Tellier et al. / Phytochemistry xxx (2014) xxx–xxx
substitution) were analyzed and a total of 150 molecular specieswere selected because of their regular occurrence in Arabidopsissamples. Odd-numbered sphingolipids were in particular includedin the MRM screening mode for subsequent analysis. High-resolu-tion mass spectrometry brings the essential complementary iden-tification tool. Once identified, an efficient liquid chromatographyprior to mass analysis in MRM mode is sufficient to distinguish iso-topic and isobaric species appearing at the same transition. Ourmethod was thus able to provide a comprehensive analysis of verycomplex mixture of sphingolipids despite their different structureand polarities.
Sphingolipid profiling of Arabidopsis seedlings, seeds and oil
Sphingolipid profiles from Arabidopsis seedlings, seeds and oilwere compared by using our new analytical method. Sphingolipidanalysis from in vitro grown seedlings showed similar relative pro-files compared to previous work (Markham and Jaworski, 2007).Absolute amount of hCers and GIPCs were however different. Thesediscrepancies could be explain by the difference in the mass spec-trometer response in absence of universal standards or by matrixeffect since 10 times less material was used in our analysis(Fig. S6). Mature seeds were pressed and the oil fraction collected(Savoire et al., 2010). Total sphingolipids in each class weresummed from the individual MRM pairs that identify each species(Fig. 2A). GIPCs and Glcs were enriched three- to four-fold in seed-lings and were completely missing in the oil fraction. This resultindicated that complex sphingolipids are exclusively associatedwith embryon cell structures and are not accumulated in the oil.GIPCs and Glcs distributions were similar between seedling andseed extracts with an enrichment in t18:1 paired with h22:0,h24:0 and h24:1 fatty acids (Fig. 2B). In addition, Glcs showed spe-cifically h16:0 pairing with the d18:1. Seedlings differed fromseeds by the higher amount of GIPCs and Glcs with t18:1-h16:0(Fig. 2B). Cers and hCers profiles and quantities did not differ be-tween seedlings and seeds (Figs. 2A, C and S1). Cers showed a greatstructural diversity which was due to the presence of four aminechains linked to diverse acyl-chains (mainly 24:0 and 26:0) whilethe LCBs of hCers were mainly trihydroxylated (only 5% dihydrox-ylated). Conversely to complex sphingolipids, Cers and hCers weresignificantly accumulated in the oil fraction with, respectively 40%and 10% of the seed amount. Dihydroxylated Cers and hCers withshorter fatty acyl-chain were specifically enriched in oil (Figs. 2Cand S1). Specific channeling was observed since about 95% C16and 50% long-chain acid (C18 and above) were paired to dihydrox-ylated LCBs for Cers and 90% and 20%, respectively for hCers. It waspreviously reported that sphingolipids with 16:0 and h16:0 FAwere specifically associated with dihydroxylated LCBs by ceramidesynthase 2 (Chen et al., 2008).
Accumulation of specific GIPCs in Arabidopsis seeds
Chromatogram for GIPCs MRM transition in seeds extractsshowed the presence of two products, the expected GIPC species(indicated as 3) and an additional product eluting 0.16 min later(4). As example, this additional product 4 responded to the sameMRM transition 1260.7 > 662.6 used to detect the GIPC 3, t18:1-h24:1 (Fig. 3A). The HRMS spectrum of the compound 3 (peak at5.35 min in UPLC–ESI-MS/MS) exhibited a [M+H]+ ion signal atm/z 1260.7234 corresponding as expected to the C60H111024NPformula (Dm/z = 0.5 ppm). It was dissociated into the ionproducts m/z 1098.6687 (C54H101019NP, Dm/z = �1.2 ppm) obtainedby the loss of glycosyl group (162) and m/z 662.6070 (C42H8004N,Dm/z = �1.8 ppm) corresponding to the ceramide moiety (Fig. 3B).The HRMS spectrum of the unknown compound 4 (peak at5.51 min in UPLC–ESI-MS/MS) exhibited a [M+H]+ ion signal at
Please cite this article in press as: Tellier, F., et al. Comparative plant sphingohttp://dx.doi.org/10.1016/j.phytochem.2014.03.023
m/z 1259.7418 corresponding to the C60H112023N2P formula(Dm/z = 2.4 ppm). Its CID spectrum gave ion products at m/z 662.6070and m/z 598.1368 (C18H33019NP, Dm/z = �1.8 ppm) correspondingto glycosyl-glucuronic acid-inositol phosphoryl group (Fig. 3B).The ceramide moiety at m/z 662.6070 being present in two mole-cules, the difference was in the polar head group. MS3 of ion m/z at598.1368 leading to ions at m/z 261.0369, m/z 338.1080 and m/z437.0687 showed that the modification concerned the replace-ment of the OH group on the last sugar of glycosylinositolphospho-ryl chain with NH2. This hypothesis was supported by the fact thatthe last sugar was lost in the MS2 of GIPC 3 (fragment m/z1098.6687) as expected for OH-derived sugar that improvesfragmentation and not for compound 4 with an NH2 group. HRMSanalyses confirmed the existence of another member of GIPCs,abbreviated NH2-GIPCs, which was then quantified by the triplequadrupole spectrometer with the appropriate transition1259.7 > 662.6 (Table S4). The MRM transition 1260.7 > 662.6 pro-vided an additional peak corresponding to the first isotope of 4high enough to be detected. These NH2-GIPCs were previouslyidentified in tobacco and corn extracts (Carter and Koob, 1969;Hsieh et al., 1981; Kaul and Lester, 1975; Pata et al., 2010) andespecially by MALDI-MS/MS (Buré et al., 2011). N-acylated GIPCs,abbreviated NHAc-GIPCs were also characterized (Fig. S2). Asexample, MS/MS spectrum of the t18:1 h24:0 NHAc-GIPC,[M+H]+ at m/z 1303.7796, showed three fragments consecutive ofa loss of the last sugar containing the additional NHAc part (frag-ment at m/z 1100.6842), but also of the second sugar (fragmentat m/z 924.6524) and finally the major ceramide fragment at m/z664.6225. A nomenclature established by Buré et al. (2011) dividesGIPCs family into series according to their number of saccharideunits, from two (series A) to seven (series F). Thus, GIPCs previ-ously described belonged to series A. Series B were also reportedand we confirmed their presence in Arabidopsis extract by HPLC–HRMS analyses (Table 1).
Surprisingly, MRM analyses showed that NH2-GIPC was en-riched in seeds and only trace amounts could be detected in seed-lings (Fig. 4). However, NH2-GIPC was not present in the oilfraction. The levels of NHAc-GIPCs were similar in both plant sam-ples. The LCB and FA composition of both NH2-GIPCs and NHAc-GIPCs were similar to regular GIPCs (Fig. S3). Series B GIPCs werealso mainly found in Arabidopsis seeds (Fig. 5). Contrary to seriesA, these series B were characterized by a non-hydroxylated fattyacid in significant quantities (Figs. 5 and S4).
In conclusion, Arabidopsis seeds are characterized by thepresence of specific sphingolipids mainly NH2-GIPCs and series BGIPCs.
lipidomic reveals specific lipids in seeds and oil. Phytochemistry (2014),
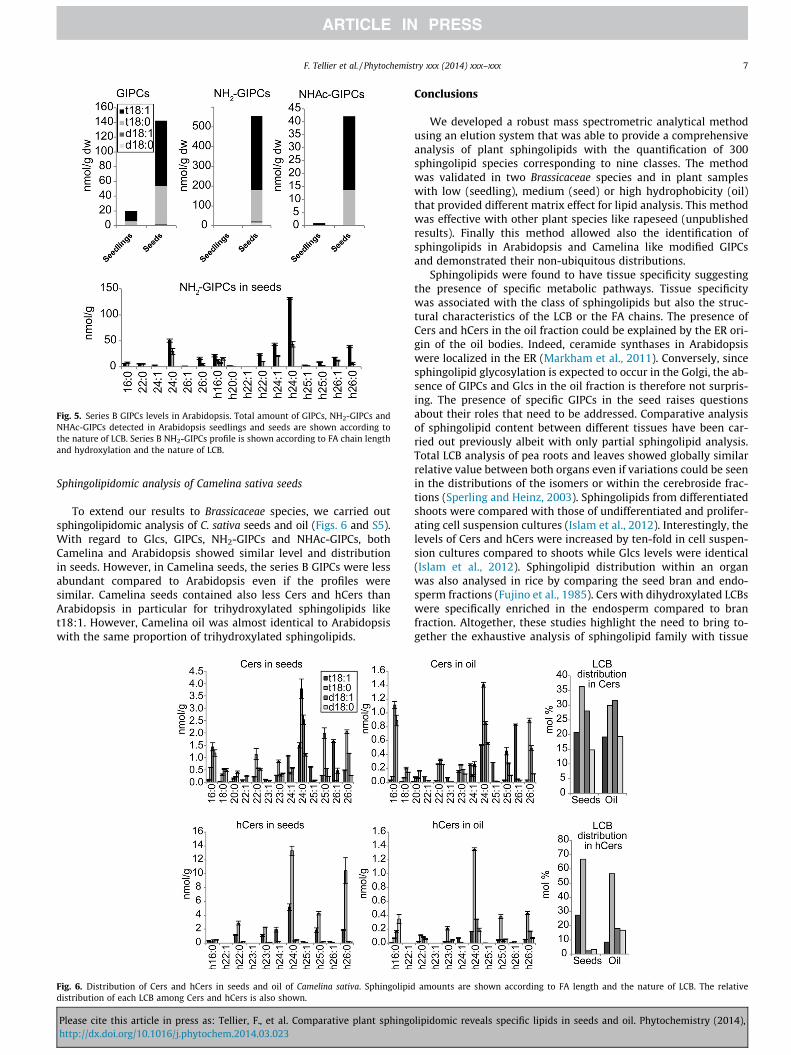
Fig. 5. Series B GIPCs levels in Arabidopsis. Total amount of GIPCs, NH2-GIPCs andNHAc-GIPCs detected in Arabidopsis seedlings and seeds are shown according tothe nature of LCB. Series B NH2-GIPCs profile is shown according to FA chain lengthand hydroxylation and the nature of LCB.
F. Tellier et al. / Phytochemistry xxx (2014) xxx–xxx 7
Sphingolipidomic analysis of Camelina sativa seeds
To extend our results to Brassicaceae species, we carried outsphingolipidomic analysis of C. sativa seeds and oil (Figs. 6 and S5).With regard to Glcs, GIPCs, NH2-GIPCs and NHAc-GIPCs, bothCamelina and Arabidopsis showed similar level and distributionin seeds. However, in Camelina seeds, the series B GIPCs were lessabundant compared to Arabidopsis even if the profiles weresimilar. Camelina seeds contained also less Cers and hCers thanArabidopsis in particular for trihydroxylated sphingolipids liket18:1. However, Camelina oil was almost identical to Arabidopsiswith the same proportion of trihydroxylated sphingolipids.
Fig. 6. Distribution of Cers and hCers in seeds and oil of Camelina sativa. Sphingolipiddistribution of each LCB among Cers and hCers is also shown.
Please cite this article in press as: Tellier, F., et al. Comparative plant sphingohttp://dx.doi.org/10.1016/j.phytochem.2014.03.023
Conclusions
We developed a robust mass spectrometric analytical methodusing an elution system that was able to provide a comprehensiveanalysis of plant sphingolipids with the quantification of 300sphingolipid species corresponding to nine classes. The methodwas validated in two Brassicaceae species and in plant sampleswith low (seedling), medium (seed) or high hydrophobicity (oil)that provided different matrix effect for lipid analysis. This methodwas effective with other plant species like rapeseed (unpublishedresults). Finally this method allowed also the identification ofsphingolipids in Arabidopsis and Camelina like modified GIPCsand demonstrated their non-ubiquitous distributions.
Sphingolipids were found to have tissue specificity suggestingthe presence of specific metabolic pathways. Tissue specificitywas associated with the class of sphingolipids but also the struc-tural characteristics of the LCB or the FA chains. The presence ofCers and hCers in the oil fraction could be explained by the ER ori-gin of the oil bodies. Indeed, ceramide synthases in Arabidopsiswere localized in the ER (Markham et al., 2011). Conversely, sincesphingolipid glycosylation is expected to occur in the Golgi, the ab-sence of GIPCs and Glcs in the oil fraction is therefore not surpris-ing. The presence of specific GIPCs in the seed raises questionsabout their roles that need to be addressed. Comparative analysisof sphingolipid content between different tissues have been car-ried out previously albeit with only partial sphingolipid analysis.Total LCB analysis of pea roots and leaves showed globally similarrelative value between both organs even if variations could be seenin the distributions of the isomers or within the cerebroside frac-tions (Sperling and Heinz, 2003). Sphingolipids from differentiatedshoots were compared with those of undifferentiated and prolifer-ating cell suspension cultures (Islam et al., 2012). Interestingly, thelevels of Cers and hCers were increased by ten-fold in cell suspen-sion cultures compared to shoots while Glcs levels were identical(Islam et al., 2012). Sphingolipid distribution within an organwas also analysed in rice by comparing the seed bran and endo-sperm fractions (Fujino et al., 1985). Cers with dihydroxylated LCBswere specifically enriched in the endosperm compared to branfraction. Altogether, these studies highlight the need to bring to-gether the exhaustive analysis of sphingolipid family with tissue
amounts are shown according to FA length and the nature of LCB. The relative
lipidomic reveals specific lipids in seeds and oil. Phytochemistry (2014),
8 F. Tellier et al. / Phytochemistry xxx (2014) xxx–xxx
specific distribution to better understand the role of this largefamily of lipids.
Experimental
Plant and chemical materials
HPLC-grade solvents for ESI-MS/MS (acetonitrile (CH3CN), tetra-hydrofuran (THF) and water) were purchased from BiosolveChimie, France. Arabidopsis thaliana plants were in the Columbia(Col-0) ecotype background. Sterilized seeds were sown on med-ium prepared according to Estelle and Somerville (1987) and the12 day-old seedlings were used for sphingolipid extraction.C. sativa (var. Céline) were obtained from CAVAC (Coopérativeagricole Vendéenne d’approvisionnement, de ventes de céréaleset autres produits agricoles, La Roche-sur-Yon, France). Oilswere obtained by hand pressing (Camelina) or by a texturometer(Arabidopsis) of several grams of seeds (Savoire et al., 2010) andrecovered on whatman paper.
Internal standards
Because of the multiplicity of individual sphingolipid species inthe analyzed plant samples, the use of labeled standard for eachsphingolipid species is not possible. Only Internal standards repre-senting each class of sphingolipids were used. The standards usedfor quantification of sphingolipids were as follow: [C12-Cer:N-(dodecanoyl)-sphing-4-enine (d18:1-12:0); C12-Glc: N-(dodec-anoyl)-1-b-glucosyl-sphing-4-enine; ganglioside GM1 (ovine)]were purchased from AvantiPolar Lipids Inc. (Alabaster, AL, USA).Standards were dissolved at 1 mg/mL in chloroform–methanol–water(16:16:5) and mixed as follow: GM1, 20 nmol; C12-Glc, 10 nmol;C12-Cer, 1 nmol. The solvent was evaporated under nitrogenand the standards dissolved in 1 mL of extraction solvent(isopropanol–hexane–water (55:20:25)) and stored at �20 �C.
The internal standards were diluted prior to analysis withextraction solvent in the range of 0.1 pmol/mL up to 1 nmol/mLfor C12-Cer and C12-Glc and 1 pmol/mL up to 5 nmol/mL forGM1. Each standard showed linear response curve (R2 = 0.9999).
Sample preparation
Plant material (three biological replicates per condition) was ex-tracted according to the method described by Markham and Jaworski(2007). 500 lL of extraction solvent (isopropanol–hexane–water(55:20:25)) and 10 lL of internal standards were added to 2 mg ofplant material (freeze-dried seedlings or seeds) and grinded usingPolytron homogenizer. After rinsing of the plunger with 500 lL ofextraction solvent, the sample was incubated at 60 �C for 15 min.After centrifugation at 4000 rpm for 5 min at room temperature,the supernatant was recovered and the pellet extracted once morewith 1 mL of extraction solvent as previously. Supernatants werecombined and dried with a speed Vac.
To improve ionization, the samples (seedling and seed extractsor oil) were subjected to alkaline hydrolysis by incubating at 50 �Cfor 1 h with 500 lL of 33% methylamine solution in ethanol–water(7:3). Samples were dried under nitrogen and stored at �20 �C. Allsphingolipids could be re-suspended in THF except for GIPCs fromseedling extracts that are too polar. Conversely, samples from oilfractions have to be re-suspended in THF. In this study and forthe sake of comparison, samples were re-suspended by sonicationin 100 lL of THF–methanol–water (2:1:2) containing 0.1% formicacid (for GIPCs and Glcs) or THF (for Cers and hCers) and filtratedprior to analysis.
Please cite this article in press as: Tellier, F., et al. Comparative plant sphingohttp://dx.doi.org/10.1016/j.phytochem.2014.03.023
Mass spectrometry
UPLC–ESI-MS/MS MRM mode analysisUPLC–ESI-MS/MS analyses were carried out on a Waters Acqui-
ty UPLC system coupled to a Waters Xevo tandem quadrupolemass spectrometer (Manchester, UK) equipped with an electro-spray ionization (ESI) source. Data acquisition and processing wereperformed using MassLynx 4.1 (TargetLynx) software (Waters).
Chromatographic separation was achieved on a reverse-phasecolumn (Uptisphere C18 NEC, 100 � 2.1 mm id, 2.2 lm particlesize; Interchim). The sample was eluted with binary gradient con-sisting of solvent A, THF–CH3CN–5 mM ammonium formate(20:20:60) with 0.1% formic acid and solvent B, THF–CH3CN(80:20) with 0.1% of formic acid. UPLC gradient was created byan increase of B buffer from 5% to 100% in 10 min followed by a sta-tionary phase of 3 min at 100%. The column was then equilibratedfor 5 min prior to the next injection. The flow rate and the columntemperature were 0.4 mL min�1 and 30 �C, respectively. Sampleinjection volume was 1 lL.
The mass spectrometer was operated in positive electrosprayionization mode with multiple reaction monitoring (MRM). Thenitrogen gas flows in cone and desolvation were set at 150 and350 L h�1, respectively. The capillary voltage was set at 3.0 kV,the source temperature at 130 �C, desolvation temperature at500 �C and cone voltage at 20 V. Argon was used for fragmentationby collision-induced dissociation in the ScanWave collision cell.Using different collision energies (both with standards and ex-tracts) led to only slight differences regarding the signal intensityin a same sphingolipid class. For this reason the collision energyfor all transition reactions was set at the same value in a sameclass, 30, 35, 45 and 45 eV, for respectively Cers, hCers, Glcs andGIPCs. MRM transitions were optimized using the Waters Intelli-Start MS Console. The acquisition parameters were automaticallyset. The number of transitions monitored in parallel was limitedto provide at least 10 data points per sec of elution time. Thus, nineMRM methods (one for each class, with 30–50 transitions) werecreated (Tables S1–S5).
HPLC–HRMS analysisHPLC–HRMS analyses were carried out using a Dionex Ultimate
3000 HPLC system coupled to a Thermo linear trap-orbitrap hybridmass spectrometer (LTQ-orbitrap, Thermo Fisher Scientific, Bre-men, Germany) equipped with an ESI ionization source. Dataacquisition and processing were performed using Xcalibur 2.0.7software (Thermo Fisher Scientific).
Chromatographic separation was achieved on a reverse-phasecolumn (Uptisphere C18 NEC, 150 � 2 mm id, 5 lm; Interchim).The sample was eluted with binary gradient consisting of solventA, THF–CH3CN–5 mM ammonium formate (30:20:50) with 0.1%formic acid and solvent B, THF–CH3CN–5 mM ammonium formate(70:20:10) with 0.1% of formic acid. HPLC gradient was created byan increase of B buffer from 20% to 100% in 20 min followed by astationary phase of 15 min at 100%. The flow rate and the columntemperature were set at 0.2 mL min�1 and 40 �C, respectively.Sample injection volume was 10 lL.
The mass spectrometer was operated in positive electrosprayionization mode. Nebulisation and desolvation nitrogen gas flowswere set at 12 and 40 a.u., respectively. Helium was used for frag-mentation by collision-induced dissociation in the ion trap. Sourceconditions were as follows: spray voltage, 5 kV; capillary voltage,25 V; tube lens voltage 65 V; capillary temperature, 300 �C. Colli-sion energy was set at 30 a.u. The mass spectrometer was exter-nally calibrated using caffeine, MRFA (met-arg-phe-ala) peptideand Ultramark 1621 allowing a mass precision below 5 ppm. Datawere acquired with a mass resolution fixed at 60,000 for mostexperiments (100,000 for confirmation purposes).
lipidomic reveals specific lipids in seeds and oil. Phytochemistry (2014),
F. Tellier et al. / Phytochemistry xxx (2014) xxx–xxx 9
Development of extract preparation to decrease matrix effects
The response in pure solvent can differ significantly from thatobtained in the matrix sample. To obtain accurate results, matrixeffects should be as low as possible. First, the amount of plantmaterial minimizing matrix effect was determined by increasingthe amount of plant material extracted (1, 2, 5, 7 and 10 mg dryweight of seedlings, seeds and oil of Arabidopsis (Fig. S6)). ForGIPCs, the relationship between signal intensity and materialamount was linear with a high correlation coefficient (r2 = 0.995)even for large amounts of seeds or seedlings. In the case of Glcs,the curve was linear until 4 mg of material (seedlings or seeds).In the case of Cers and hCers, the analysis had to be performedfor each long-chain base since the matrix affected the ionizationof compounds according to the LCB type and nature of the sample.For instance, the amount of material had little influence on thequantitation of hCers with t18:1 but impacted significantly thosewith t18:0 (Fig. S6). Linearity was nonetheless observed up to2 mg of material. In conclusion, comparison could only be achievedwith identical amounts of material which was set at 2 mg.
Appendix A. Supplementary data
Supplementary data associated with this article can be found, inthe online version, at http://dx.doi.org/10.1016/j.phytochem.2014.03.023.
References
Bartke, N., Fischbeck, A., Humpf, H.-U., 2006. Analysis of sphingolipids in potatoes(Solanum tuberosum L.) and sweet potatoes (Ipomoea batatas (L.) Lam.) byreversed phase high-performance liquid chromatography electrosprayionization tandem mass spectrometry (HPLC–ESI-MS/MS). Mol. Nutr. FoodRes. 50, 1201–1211.
Berkey, R., Bendigeri, D., Xiao, S., 2012. Sphingolipids and plant defense/disease: the‘‘death’’ connection and beyond. Front. Plant Sci. 3, 1–22.
Bielawski, J., Szulc, Z.M., Hannun, Y.A., Bielawska, A., 2006. Simultaneousquantitative analysis of bioactive sphingolipids by high-performance liquidchromatography–tandem mass spectrometry. Methods 39, 82–91.
Blaas, N., Humpf, H.-U., 2013. Structural profiling and quantitation of glycosylinositol phosphoceramides in plants with Fourier transform mass spectrometry.J. Agric. Food Chem. 61, 4257–4269.
Bui, H.H., Leohr, J.K., Kuo, M.-S., 2012. Analysis of sphingolipids in extracted humanplasma using liquid chromatography electrospray ionization tandem massspectrometry. Anal. Biochem. 423, 187–194.
Buré, C., Cacas, J.-L., Wang, F., Gaudin, K., Domergue, F., Mongrand, S., Schmitter, J.-M., 2011. Fast screening of highly glycosylated plant sphingolipids by tandemmass spectrometry. Rapid Commun. Mass Spectrom. 25, 3131–3145.
Carter, H.E., Koob, J.L., 1969. Sphingolipid in bean leaves (Phaseolus vulgaris). J. LipidRes. 10, 363–369.
Chao, D.-Y., Kenneth Gable, K., Chen, M., Baxter, I., Dietrich, C.R., Cahoon, E.B.,Guerinot, M.L., Lahner, B., Lü, S., Markham, J.E., Morrissey, J., Han, G., Gupta, S.D.,Harmon, J.M., Jaworski, J.G., Dunn, T.M., Salt, D.E., 2011. Sphingolipids in theroot play an important role in regulating the leaf ionome in Arabidopsis thaliana.Plant Cell 23, 1061–1081.
Chen, M., Markham, J.E., Dietrich, C.R., Jaworski, J.G., Cahoon, E.B., 2008.Sphingolipid long-chain base hydroxylation is important for growth andregulation of sphingolipid content and composition in Arabidopsis. Plant Cell20, 1862–1878.
Please cite this article in press as: Tellier, F., et al. Comparative plant sphingohttp://dx.doi.org/10.1016/j.phytochem.2014.03.023
Chen, M., Markham, J.E., Cahoon, E.B., 2012. Sphingolipid D8 unsaturation isimportant for glucosylceramide biosynthesis and low-temperatureperformance in Arabidopsis. Plant J. 69, 769–781.
Estelle, M.A., Somerville, C., 1987. Auxin-resistant mutants of Arabidopsis thalianawith an altered morphology. Mol. Gen. Genet. 206, 200–206.
Fujino, Y., Ohnishi, M., Ito, S., 1985. Molecular species of ceramide and mono-, di-,tri-, and tetraglycosylceramide in bran and endosperm of rice grains. Agric. Biol.Chem. 49, 2753–2762.
Hsieh, T.C.-Y., Lester, R.L., Laine, R.A., 1981. Glycophosphoceramides from plants.Purification and characterization of a novel tetrasaccharide derived fromtobacco leaf glycolipids. J. Biol. Chem. 256, 7747–7755.
Islam, M.N., Chambers, J.P., Ng, C.K.-Y., 2012. Lipid profiling of the model temperategrass, Brachypodium Distachyon. Metabolomics 8, 598–613.
Kaul, K., Lester, R.L., 1975. Characterization of inositol-containingphosphosphingolipids from tobacco leaves: isolation and identification of twonovel, major lipids: N-acetylglucosamidoglucuronidoinositolphosphorylceramide and glucosamidoglucuronidoinositolphosphorylceramide. Plant Physiol. 55, 120–129.
Lynch, D.V., Dunn, T.M., 2004. An introduction to plant sphingolipids and a reviewof recent advances in understanding their metabolism and function. NewPhytol. 161, 677–702.
Markham, J.E., Li, J., Cahoon, E.B., Jaworski, J.G., 2006. Separation and identificationof major plant sphingolipid classes from leaves. J. Biol. Chem. 281, 22684–22694.
Markham, J.E., Jaworski, J.G., 2007. Rapid measurement of sphingolipids fromArabidopsis thaliana by reversed-phase high-performance liquidchromatography coupled to electrospray ionization tandem massspectrometry. Rapid Commun. Mass Spectrom. 21, 1304–1314.
Markham, J.E., Molino, D., Gissot, L., Bellec, Y., Hematy, K., Marion, J., Belcram, K.,Palauqui, J.-C., Satiat-JeuneMaitre, B., Faure, J.-D., 2011. Sphingolipidscontaining very-long-chain fatty acids define a secretory pathway for specificpolar plasma membrane protein targeting in Arabidopsis. Plant Cell 23, 2362–2378.
Markham, J.E., Lynch, D.V., Napier, J.A., Dunn, T.M., Cahoon, E.B., 2013. Plantsphingolipids: function follows form. Curr. Opin. Plant Biol. 16, 350–357.
Masood, M.A., Rao, R.P., Acharya, J.K., Blonder, J., Veenstra, T.D., 2012. Quantitationof multiple sphingolipid classes using normal and reversed-phase LC–ESI-MS/MS: comparative profiling of two cell lines. Lipids 47, 209–226.
Merrill Jr., A.H., Sullards, M.C., Allegood, J.C., Kelly, S., Wang, E., 2005.Sphingolipidomics: high-throughput, structure-specific, and quantitativeanalysis of sphingolipids by liquid chromatography tandem massspectrometry. Methods 36, 207–224.
Mortimer, J.C., Yu, X., Albrecht, S., Sicilia, F., Huichalaf, M., Ampuero, D., Michaelson,L.V., Murphy, A.M., Matsunaga, T., Kurz, S., Stephens, E., Baldwin, T.C., Ishii, T.,Napier, J.A., Weber, A.P.M., Handford, M.G., Dupree, P., 2013. Abnormalglycosphingolipid mannosylation triggers salicylic acid-mediated responses inArabidopsis. Plant Cell 25, 1881–1894.
Pata, M.O., Hannun, Y.A., Ng, C.K.-Y., 2010. Plant sphingolipids: decoding the enigmaof the Sphinx. New Phytol. 185, 611–630.
Savoire, R., Quinsac, A., Chardot, T., Miquel, M., Nesi, N., Lanoisellé, J.-L., Vorobiev, E.,2010. Micro-pressing of rapeseed (Brassica napus L.) and Arabidopsis thalianaseeds for evaluation of the oil extractability. OCL 17, 115–119.
Saucedo-Garcia, M., Guevara-Garcia, A., Gonzalez-Solis, A., Cruz-García, F., Vázquez-Santana, S., Markham, J.E., Lozano-Rosas, M.G., Dietrich, C., Ramos-Vega, M.,Cahoon, E.B., Gavilanes-Ruíz, M., 2011. MPK6, sphinganine and the LCB2 a genefrom serine palmitoyl transferase are required in the signaling pathway thatmediates cell death induced by long chain bases in Arabidopsis. New Phytol.191, 943–957.
Shaner, R.L., Allegood, J.C., Park, H., Wang, E., Kelly, S., Haynes, C.A., Sullards, M.C.,Merrill Jr., A.H., 2009. Quantitative analysis of sphingolipids for lipidomics usingtriple quadrupole and quadrupole linear ion trap mass spectrometers. J. LipidRes. 50, 1692–1707.
Sperling, P., Heinz, E., 2003. Plant sphingolipids: structural diversity, biosynthesis,first genes and functions. Biochim. Biophys. Acta 1632, 1–15.
Wang, W., Yang, X., Tangchaiburana, S., Ndeh, R., Markham, J.E., Tsegaye, Y., Dunn,T.M., Wang, G.L., Bellizzi, M., Parsons, J.F., Morrissey, D., Bravo, J.E., Lynch, D.V.,Xiao, S., 2008. An inositolphosphorylceramide synthase is involved in regulationof plant programmed cell death associated with defense in Arabidopsis. PlantCell 20, 3163–3179.
lipidomic reveals specific lipids in seeds and oil. Phytochemistry (2014),