Embed Size (px)
Citation preview

Comparative Life Cycle Assessment of
Single-Serve Coffee Packaging in
Ontario
by
Jingxi Li
A thesis
presented to the University of Waterloo
in fulfillment of the
thesis requirement for the degree of
Master of Environmental Studies
in
Sustainability Management
Waterloo, Ontario, Canada, 2017
© Jingxi Li 2017

ii
AUTHOR'S DECLARATION
I hereby declare that I am the sole author of this thesis. This is a true copy of the thesis, including
any required final revisions, as accepted by my examiners.
I understand that my thesis may be made electronically available to the public.

iii
Abstract
Single-serve coffee pods are occupying a growing share in the coffee market. In Ontario, with 14
million people, it is estimated that 2 billion single-serve coffee pods are consumed annually, the
consumption of which generates 30,000 tons of landfill waste in Ontario, equivalent to 0.3% of
total landfill waste generated in the province in 2014.
Different formats of coffee pods have been introduced, and each addresses the waste problem
differently. Two examples are recyclable coffee pods made of aluminum and compostable coffee
pods made from biodegradable polymers. In this research, these two coffee pod formats are
investigated together with a typical petroleum-based plastic coffee pod, which represents the
baseline landfilling scenario. A cradle-to-grave life cycle assessment (LCA) is conducted to
quantify and compare the environmental effects of these systems, with a special focus on packaging
materials and end-of-life management.
The results show that among the three investigated coffee pods, the recyclable aluminum format
has the highest potential environmental effects across nine impact categories. Whereas, the
Biodegradable Pod, which is assumed to be composted in 40% of uses, has reduced greenhouse gas
emissions and landfill waste generation potential when compared with the petroleum-based plastic
coffee pod. After applying a standard LCA weighting, results indicate that human toxicity is the
most important life cycle impact assessment indicator result associated with all three of coffee pod
formats.
This research is important from both a biodegradable material and a circular economy perspective.
From a biodegradable material perspective, this study is the first to compare polylactic acid, a bio-
based biodegradable polymer, with polystyrene, a petroleum-based non-degradable plastic.
Biodegradable materials enable consumers easily to compost the coffee waste together with the
coffee pod, but at the same time, it requires an extra plastic packaging warp for each coffee pod.
From a circular economy perspective, the study is important because the results indicate the
strength of using compostable biological nutrients over recyclable technical nutrients in the context
of small single-use food products. Like all LCA studies, the results are dependent on specific
assumptions and scenarios analyzed.

iv
Acknowledgements
It gives me great pleasure to thank everyone who helped me to finish this work.
I would like to show my gratitude to Professor Steven B. Young who has been my advisor and
provided me with unlimited help and guidance. He has always been there to support, motivate and
enlighten me when I was faced with all kinds of problems. He is the best supervisor I could have
ever wished for.
My sincere thank-you goes to my committee member, Professor Komal Habib for her patience in
pointing out my mistakes and her encouragement when I feel lost. I appreciate her continuous help
even when she was pregnant.
I would like to thank Professor Murray Haight from School of Planning for being my reader and
providing precious suggestions to improve this work.
Finally, I would like to thank my parents who inspired and supported me to pursue environmental
studies and sustainability.

v
Table of Contents
List of Figures ........................................................................................................................... vii
List of Tables ...........................................................................................................................viii
List of Abbreviations .................................................................................................................. ix
Introduction .......................................................................................................... 1
1.1 Coffee Pods in Ontario .............................................................................................. 1
1.2 Ontario’s Environmental Plans .................................................................................. 2
1.2.1 Five Year Climate Change Plan ...................................................................... 2
1.2.2 Waste-Free Ontario ........................................................................................ 2
Literature Review .................................................................................................. 4
2.1 Single-Serve Coffee Pod ........................................................................................... 4
2.1.1 Waste Problem ............................................................................................... 4
2.1.2 Innovations for Coffee Pod Packaging ............................................................ 5
2.2 New Polymers .......................................................................................................... 6
2.2.1 Biodegradability ............................................................................................ 6
2.2.2 Polylactic Acid (PLA) .................................................................................... 7
2.2.3 Industrially Compostable Product................................................................... 8
2.3 Circular Economy ..................................................................................................... 9
2.3.1 Evolvement and Definition............................................................................. 9
2.3.2 Implementations .......................................................................................... 10
2.4 Municipal Solid Waste Management ....................................................................... 11
2.4.1 Development and Trends .............................................................................. 11
2.4.2 Landfilling ................................................................................................... 12
2.4.3 Recycling ..................................................................................................... 13
2.4.4 Composting ................................................................................................. 14
2.4.5 Incineration .................................................................................................. 14
2.5 Summary of Literature Review ............................................................................... 15
Methodology and Data ........................................................................................ 17
3.1 Investigating Packaging Systems............................................................................. 17
3.2 Goal and Scope ....................................................................................................... 21
3.2.1 Goal ............................................................................................................. 21
3.2.2 The Function and Reference Unit ................................................................. 22
3.2.3 Spatial and Temporal Scope ......................................................................... 22
3.2.1 System boundary.......................................................................................... 22
3.2.2 Allocation Procedures .................................................................................. 25
3.2.3 Assumptions ................................................................................................ 26
3.3 Life Cycle Inventory ............................................................................................... 27
3.3.1 Unit Processes.............................................................................................. 27
3.3.2 End-of-Life Scenarios .................................................................................. 40
3.4 Life Cycle Impact Categories .................................................................................. 45

vi
Results ................................................................................................................ 47
4.1 Overall LCIA Results .............................................................................................. 47
4.1.1 Characterization Results from TRACI 2 ....................................................... 47
4.1.2 Weighting Results from ReCiPe ................................................................... 50
4.2 Global Warming Potential ....................................................................................... 51
4.2.1 GWP of Polystyrene Pod .............................................................................. 53
4.2.2 GWP of Aluminum Pod ............................................................................... 54
4.2.3 GWP of Biodegradable Pod.......................................................................... 55
4.3 Effect of Coffee Ground EOL Approach .................................................................. 56
4.4 Sensitivity Analysis ................................................................................................. 58
4.4.1 Primary Aluminum Fraction of Aluminum Pod............................................. 58
4.4.2 Recycling Rate of Aluminum Pod ................................................................ 59
4.4.3 Composting Rate of Biodegradable Pod ....................................................... 61
Discussion ........................................................................................................... 62
5.1 Key Findings .......................................................................................................... 62
5.1.1 Environmental Hotspots ............................................................................... 62
5.1.2 Low GHG Emission Pod .............................................................................. 63
5.1.3 Landfill Waste Generation ............................................................................ 63
5.2 Practical Implications .............................................................................................. 65
5.2.1 Implications for Policy Makers..................................................................... 65
5.2.2 Implications for Industry .............................................................................. 66
5.2.3 Implication for Consumers ........................................................................... 66
5.3 Theoretical Implications .......................................................................................... 66
5.3.1 Waste Problem and Material Innovations ...................................................... 66
5.3.2 Circular Economy ........................................................................................ 67
5.3.3 Municipal Solid Waste Management ............................................................ 68
5.4 Limitations ............................................................................................................. 68
5.5 Future Research Directions ..................................................................................... 70
5.6 Conclusions ............................................................................................................ 70
References .............................................................................................................................. 71
Appendixes ............................................................................................................................. 81
Appendix A Characterization Results of Polystyrene Pod........................................................... 81
Appendix B Characterization Results of Aluminum Pod ............................................................ 84
Appendix C Characterization Results of Biodegradable Pod ...................................................... 86
Appendix D Weighing Results of Three Coffee Pods ................................................................. 88

vii
List of Figures
Figure 1 Image of Polystyrene Pod .................................................................................... 18
Figure 2 Image of Aluminum Pod system .......................................................................... 18
Figure 3 Image of Biodegradable Pod system .................................................................... 19
Figure 4 Life cycle flow diagram of petroleum plastic coffee pod ...................................... 23
Figure 5 Life cycle flow diagram of aluminum coffee pod ................................................. 24
Figure 6 Life cycle flow diagram of biobased polymer coffee pod...................................... 25
Figure 7 Flow diagram for high quality composting facility ............................................... 43
Figure 8 Characterization result comparison ...................................................................... 48
Figure 9 Characterization results of Polystyrene Pod .......................................................... 48
Figure 10 Characterization results of Aluminum Pod ......................................................... 49
Figure 11 Life cycle analysis results of Biodegradable Pod ................................................ 50
Figure 12 Weighting result comparison .............................................................................. 51
Figure 13 Global warming potential comparison ................................................................ 52
Figure 14 Global warming potential breakdown of Polystyrene Pod ................................... 53
Figure 15 Global warming potential breakdown of Aluminum Pod .................................... 54
Figure 16 Global warming potential breakdown of Biodegradable Pod .............................. 55
Figure 17 EOL stage contribution with and without coffee ground in five categories .......... 57
Figure 18 Amount of waste before and after diversion (unit: kg/1,000 pieces) .................... 64

viii
List of Tables
Table 1 Packaging materials of investigated coffee pods .................................................... 19
Table 2 Process datasets for modeling the production of 1000 pieces of Polystyrene Pod.... 29
Table 3 Process datasets for modeling the production of 1000 pieces of Aluminum Pod ..... 34
Table 4 Process datasets for modeling the production of Biodegradable Pod....................... 36
Table 5 Material transportation distance of Aluminum Pod................................................. 39
Table 6 Material transportation of Biodegradable Pod ........................................................ 39
Table 7 Vermont electricity generation mix by fuel type (ISO New England, 2016) ............ 40
Table 8 Ontario electricity generation mix by fuel type (IESO, 2017) ................................. 40
Table 9 End-of-life scenarios for coffee pods ..................................................................... 41
Table 10 Life Cycle Inventory (LCI) for High-quality Composting .................................... 44
Table 11 Impact categories in TRACI 2 methodology ........................................................ 45
Table 12 Impact categories in ReCiPe ................................................................................ 45
Table 13 Total amount of coffee grounds in each pod and their EOL approaches (unit: kg/1,000
p) ............................................................................................................................... 56
Table 14 Sensitivity analysis results and percentages of change for primary aluminum fraction
of Aluminum Pod ....................................................................................................... 58
Table 15 Sensitivity analysis results and percentages of change for recycling rate of Aluminum
Pod ............................................................................................................................ 60
Table 16 Sensitivity analysis results and percentages of change for composting rate of
Biodegradable Pod ..................................................................................................... 60

ix
List of Abbreviations
14DCB 1,4-Dichlorobenzene
Al Aluminum
ASTM American Society for Testing and Materials
BPI Biodegradable Products Institute
CAD Canadian Dollars
CE Circular Economy
CH4 Methane
CO Carbon Monoxide
CO2 Carbon Dioxide
CTUe Comparative Toxic Unites for environment
CTUh Comparative Toxic Unites for human
EMF Ellen MacArthur Foundation
EOL End of Life
EPA United States Environmental Protection Agency
Eq. Equivalent
EVOH Ethylene Vinyl Alcohol
FAO Food and Agriculture Organization of the United Nations
GEO5 Global Environment Outlook 5
GHG Greenhouse Gases
GWP Global Warming Potential
HQCF High-Quality Composting Facility
H2S Hydrogen Sulfide
IESO Independent Electricity System Operator
ISO International Organization of Standardization
IWM Integrated Waste Management
LCA Life Cycle Assessment
LCI Life Cycle Inventory
LCIA Life Cycle Impact Assessment
LDPE Low Density Polyethylene
MSWM Municipal Solid Waste Management
NE New England
NH3 Ammonia
N2O Nitrous Oxide
NZWC National Zero Waste Council of Canada
ON Ontario
OPS Oriented Polystyrene
Pb Lead
PBS polybutylene succinate
PCL Polycaprolactone

x
PE Polyethylene
PET Polyethylene Terephthalate
PLA Polylactic Acid
PlasticsEurope Plastics Industry Association in Western Europe
PM Particulate Matter
PP Polypropylene
PS Polystyrene
RPRA Resource Productivity and Recovery Authority
SBB Solid Bleached Board
SimaPro System for Integrated Environmental Assessment of Products
SUB Solid Unbleached Board
TRACI Tool for the Reduction and Assessment of Chemical and other
environmental Impacts
UCTE Union for the Coordination of the Transmission of Electricity
UNEP United Nation Environment Program
USDA United States Department of Agriculture
USEIA United States Energy Information Administration
USEPA United States Environment Protection Agency
VOC Volatile Organic Compounds

1
Introduction
1.1 Coffee Pods in Ontario
Coffee is the most popular prepared beverage among adult Canadians. According to market
research, 67% of adult Canadians enjoy at least one cup of coffee a day with the average at 3.0
cups/day, and 29% of their coffee beverage are brewed by single-serve pod machines (Coffee
Association of Canada, 2017). In Ontario, the home of 14 million people (Statistics Canada, 2017),
it is estimated that 2 billion single-serve coffee pods are consumed annually. With a large and
growing market size, the environmental effects of single-serve coffee pod are necessary to be
estimated.
Single-serve coffee pod in this study is a packaging system, which contains a small amount of
ground coffee, could be used in a special coffee brewing machine to make a cup of coffee for an
individual. Such coffee pod was brought into the market as early as 1976 by the Swiss food and
beverage giant, Nestlé (LA Société, 2008). Its development was slow in 1970s and 1980s, because
of the high price of a pod and a brewing machine. But in 1997, a new product called K-Cup was
invented by Green Mountain Coffee Roasters. This new product used plastics instead of aluminum
for the pod body and reduced the cost of the pod (Keurig Green Mountain, 2016). The low priced
single-serve coffee pod shocked the coffee beverage market t with its convenience in making a
freshly brewed coffee. Since then, the market of single-serve coffee pod has experienced a rapid
growth. In the fiscal year of 2016, Keurig Green Mountain (formerly Green Mountain Coffee
Roasters) sold 57 billion coffee pods globally (Keurig Green Mountain, 2016), equivalent to CAD
34 billion. Nespresso, a coffee pod brand owned by Nestlé, also reported annual sales of 3 billion
Swiss Franc, or CAD 3.85 billion, in 2011 (Nestlé, 2011). In Europe, pod machines have become
the second most common preparation method after a filter drip coffee maker by the year of 2011.
It is indicated that 23% of German people use pod machines (Brommer, Stratmann, & Quack,
2011.).
However, the coffee pods are not welcomed by everyone. Media has been criticizing the K-Cup for
its single-use of petroleum materials and creating landfill waste for years (Oatman, 2014; Hamblin,
2015; Gelles, 2016). The Germen city of Hamburg even banned coffee pods from state-run
buildings as part of an environmental drive to reduce waste (BBC News, 2016). In Province of
Ontario, the estimated 2 billion coffee pod annual consumption would generate 30,000 tons of
waste at 15 g per pods, equivalent to 0.3% of landfilled waste generated in the province in 2014
(Statistics Canada, 2016). Ontario, who declared their ambitions in reducing greenhouse gas
emission and being waste-free (Ontario Ministry of Environment and Climate Change, 2016a,
2016b), should be conscious of the environmental burdens of the consumption of single-serve
coffee pods.

2
1.2 Ontario’s Environmental Plans
Ontario has the second highest total provincial greenhouse gas (GHG) emissions of any province
in Canada, with 166.2 megatons of carbon dioxide equivalent greenhouse gases in 2015
(Environment and Climate Change Canada, 2017). Ontario leads in the volume of waste disposal
in Canada, generating 9.2 million tons of waste in 2014 (Statistics Canada, 2016). To decrease GHG
emissions and waste generation, the Ontario Ministry of Environment and Climate Change put
forward the Ontario’s Five-Year Climate Change Action Plan and the Strategy for a Waste-Free
Ontario in 2016 (Ontario Ministry of Environment and Climate Change, 2016a, 2016b). In the latter
document, building a circular economy was written into a provincial strategy in Canada for the first
time.
1.2.1 Five Year Climate Change Plan
Ontario’s people and businesses are already feeling the effects of global warming and paying the
price. Climate change has damaged the environment and has caused extreme weather events such
as flooding and drought, and has hurt the ability to grow food in some regions (Ontario Ministry of
Environment and Climate Change, 2016). Ontario’s Five-Year Climate Change Action Plan
(“Action Plan”) stressed climate change as a grave concern, and highlighted the actions required
for the next five years (2016-2020) to address climate change, reduce greenhouse gas pollution and
help move us to a prosperous low-carbon economy (Government of Ontario, 2016).
According to Ontario’s Climate Change Update 2014, transportation and industry remain to be the
two largest GHG emitting sectors in Ontario since 1990. However, the industrial sector succeeded
in reducing emissions by 14% compared to 1990, whereas transportation sector has an 11% higher
emission (Government of Ontario, 2014). The Action Plan sees reducing the emissions from
transportation sector as the most important target. Approaches that are put forward in the Action
Plan associated with transportation include promoting lower-carbon fuels and electric vehicles,
supporting cycling and walking, increasing the use of low-carbon trucks and buses, and developing
public transits (Ontario Ministry of Environment and Climate Change, 2016a). The Action Plan
also emphasizes other action areas, such as buildings and homes, land-use planning, and industry
and business. As conclusion, the Action Plan emphasizes public involvement and mobilizes all
stakeholders to act together to fight climate change.
1.2.2 Waste-Free Ontario
At the same time when the Action Plan was released, the Ontario Ministry of Environment and
Climate Change was also drafting the Strategy for a Waste-Free Ontario Building the Circular
Economy (“The Strategy”). The goals of The Strategy are to achieve a zero waste Ontario and zero
greenhouse gas emission from the waste sector, and to achieve a transformation to a circular
economy (Ontario Ministry of Environment and Climate Change, 2016). To achieve a waste-free

3
Ontario, The Strategy puts forward four functional objectives and a series of actions to attain them,
these objectives are
To enhance provincial direction and oversight
To enable efficient and effective recovery systems
To increase waste reduction and improve resource productivity, and
To create conditions for sustainable end-markets.
Among the actions, “waste diversion” and “resource recovery” are two keywords that are brought
up multiple times.
The current research is expected to help waste diversion and resource recovery by providing a case
study on coffee pod packaging systems. As a single-use product that has a high sales volume, coffee
pods are generating 30,000 tons of packaging waste (2 billion pods multiplied by 15g per pod)
every year in Ontario. Different pod formats on the market are made from different materials and
therefore fall under different waste management approaches. In this study, the comparison between
different coffee pods formats can identify the one that has higher possibility and value to be diverted
from landfill and may provide a generalizable reference for design of other single-use product.

4
Literature Review
2.1 Single-Serve Coffee Pod
2.1.1 Waste Problem
The popularity of single-serve coffee pods in Europe and North America could not be overstated,
but its inefficient usage of packaging materials has created a waste problem. Take a common coffee
pod in the market, for example, the K-cup is made of 2.41 g of composite plastic, 0.22 g of
aluminum foil and 0.31 g of paper, and packaged in 2.88 g of cardboard on average. A total amount
of 5.77 g materials is used for the package of 9.81 g of coffee. On the other hand, a bulk package
system using a traditional stand-up pouch requires 2.57 g of materials to package the same amount
of coffee (Humbert et al., 2009). The plastic composite and the structure of a coffee pod make it
impossible to be recycled in most municipal and industrial recycling facilities. It turns out that
billions of coffee pods end up being buried in the landfills or incinerated across the world (Humbert
et al., 2009). Media criticized that used K-Cups in 2013 were enough to wrap around the equator
10.5 times (Oatman, 2014). Although recyclable coffee pods are available in the market, but they
are also criticized for their low recycling rate (Gelles, 2016; Bali, 2017)
Sustainability of coffee cultivation and coffee product systems have been an academic topic of
interest (Chayer & Kicak, 2015; Dubois, Humbert, & Margni, 2011; Jaffee, 2014; Manezes, Finzer,
& Oliveira, 1998), because of their large consumption volume in developed countries and socio-
economic implications of its production in developing countries (Hassard, Couch, Techa-Erawan,
& Mclellan, 2014). 8 million metric tons of coffee beans were consumed globally in 2016, half of
which were produced in Brazil and Colombia (International Coffee Organization (ICO), 2017).
Efforts have been made to quantify the energy use and other environmental burdens of the life cycle
of coffee products. A full life cycle inventory of Brazilian green coffee bean agriculture (Coltro,
Mourad, Oliveira, Baddini, & Kletecke, 2006) has been an important basis for many life cycle
assessment studies of coffee beverages (Büsser & Jungbluth, 2009; Chayer & Kicak, 2015; Dubois
et al., 2011; Humbert, Loerincik, et al., 2009). Most of the available coffee beverage studies focused
on traditional coffee brewing methods, i.e. a filter drip coffee maker. Their results show that coffee
bean cultivation and use stage are the two main sources of greenhouse gas (GHG) emission. Coffee
bean cultivation relies on nitrogen fertilizer which causes the emission of a strong greenhouse gas,
nitrous oxide (N2O) (Büsser & Jungbluth, 2009; Chayer & Kicak, 2015; Hassard et al., 2014).
Heating water and keeping coffee warm in use stage is responsible for half of the life-cycle energy
consumption, which also causes GHG emission (Büsser & Jungbluth, 2009; Dubois et al., 2011;
Haas, Krausmann, Wiedenhofer, & Heinz, 2015; Humbert, Loerincik, et al., 2009). These studies
also indicated that packaging is not an influential stage in a bulk package scenario. However, other
studies comparing between a single-serve brewing system and a drip filter brewing system

5
indicated that packaging materials and their production play more important roles in the life cycle
of a single-serve coffee pod, because more packaging materials required for small amount of coffee
(Brommer et al., 2011; Chayer & Kicak, 2015; Dubois et al., 2011).
2.1.2 Innovations for Coffee Pod Packaging
The coffee pod industry is looking for a solution to handle the waste problem and to increase
resource efficiency. Developing recyclable or compostable pods are two potential strategies. As
early as 1991, Nespresso launched the world’s first capsule recycling system in Switzerland.
Nespresso provides two options for customers to recycle their used pods. They can either take the
used pods back to the Nespresso Boutique, where the recycler will collect the pods and send them
to a recycling facility, or the consumers can separate ground coffee from the used pod, and put the
aluminum shell into their household recycling bin for municipal recycling service. By 2013,
Nespresso had reached 75% global recycling capacity, achieved with the help of some 14,000
dedicated capsule collection points operational around the world (Nespresso, 2017). However,
recycling capacity does not ensure recycling rate in practice. Although Nespresso has set up a
complete pod recycling route and has made continuous effort to encourage their customers to
recycle used pods, only 24% of their used pods were recycled in 2016 (Nestlé Nespresso S.A.,
2017). According to environmental authority of Ontario, municipal recycling facilities in Ontario
don’t accept an enclosed Nespresso pod as recyclable waste (Ren, 2017). Additionally, the
distribution of Nespresso Boutique in Ontario is less intensive than Europe, consumers tend to buy
the capsules online. It is rational to believe that the Nespresso recycling rate in Ontario is lower
than global average. In this study, it is assumed that its recycling rate in Ontario is 14%. Bali (2017),
an informant from the coffee pod industry, indicated that low recycling rate of Nespresso overall is
because consumers prefer single serve pods rather than bulk coffee as they are convenient and time-
saving, but recycling the pods takes coffee consumers extra time.
Compostable pod is another direction that the industry is working on. In 2016, a new product, called
PURPOD100™, was launched in the market by a coffee roaster company based in Ontario.
According to information disclosed by the National Zero Waste Council of Canada (NZWC), the
main materials used for PURPOD100™ are polylactic acid (PLA) and other compostable biobased
polymers (NZWC, 2017). This pod is claimed to be “100% compostable” and “the first coffee pod
to earn certification from the Biodegradable Products Institute (BPI)” (Club Coffee, 2016). The
producer claims that this coffee pod can break down in twelve weeks in well-managed municipal
composting facilities (Club Coffee, 2016). In the US, PURPOD100™ is accepted as compostable
waste by many municipal composting facilities, but in Ontario, it has not been accepted in any of
the composting facilities yet (Recycling Today, 2016). It is reported that the situation in Ontario
can be improved if the funding for municipal composting facilities is increased (Club Coffee, 2016;
Mckillop, 2017; Ren, 2017).
Recyclable and compostable pods are both available in the Ontario market. In this study, a typical

6
petroleum plastic coffee pod, representing a traditional landfilling scenario, is used as the baseline
for the comparison between a recyclable aluminum pod and a compostable biobased polymer pod.
2.2 New Polymers
Polylactic acid (PLA) and other biobased polymers are used as raw materials in PURPOD100™.
The term biobased, according to the definition from European Bioplastics and the U.S. Department
of Agriculture (USDA), means that the material is (partly) derived from biomass, or produced from
living organisms (European Bioplastics, 2017; Golden, J; Handfield R; Daystar, J; McConnell,
2015). USDA further defined biobased polymers as polymers that produced by living organisms
that form long chains by the interlinking of repeating chemical blocks (Golden et al., 2015).
Biobased polymers can be natural or synthetic. Cellulose and starch are two examples of biobased
polymers that are abundant in nature. The history of artificial synthesis of biobased polymer dates
back to 1860s, when celluloid was invented, and since then, many other biobased polymers have
been developed (Dodiuk & Goodman, 2013).
2.2.1 Biodegradability
Biodegradability is another term that is commonly referred to when people talk about new polymer
materials. But being biodegradable and biobased are not the same (Ellen MacArthur Foundation
(EMF), 2016). Being biodegradable means a material is capable of being decomposed by biological
agents (Golden et al., 2015). Not all biodegradable polymers are biobased: polycaprolactone (PCL)
and most polybutylene succinate (PBS) are petroleum based, but they can be degraded by
microorganisms. Vice versa, biobased polymers are not necessary to be biodegradable, e.g.
biobased polyethylene and Nylon 11 (Tokiwa, Calabia, Ugwu, & Aiba, 2009).
The interest in the development and production of biodegradable polymers arose in 1990s in
response to problems associated with plastic waste and its effect on the environment (Poirier,
Nawrath, & Somerville, 1995). The difficulty in recycling highly contaminated plastic, and the high
(energy) cost have limited the effect of mechanical recycling. Generation of dioxins and other toxic
products has made incineration unwelcomed by municipal residences. When neither mechanical
recycling nor incineration provides a complete solution to the problem of plastics wastes,
biodegradation becomes an attractive ecological alternative to locking away polymer wastes in
expensive landfills. (Scott, 2002)
The application of biodegradable polymers is the most common in food packaging (Pawar &
Purwar, 2013; Siracusa, Rocculi, Romani, & Rosa, 2008) and medicine (Dash & Konkimalla, 2012;
Reed & Gilding, 1981). Biodegradable polymers are preferable to the non-degradable in food
packaging because the package is often contaminated by foodstuff and biological substance and
difficult to recycle, but contamination does not bother degradation (Siracusa et al., 2008). The
medical use of biodegradable polymer has a long history (Gilding & Reed, 1979). Because a series

7
of biodegradable polymers can be degraded and absorbed by human body, and is harmless, they
were first used in bone surgeries later in drug delivery and tissue engineering (Dash & Konkimalla,
2012; Reed & Gilding, 1981).
2.2.2 Polylactic Acid (PLA)
Polylactic acid (PLA) is a highly versatile linear aliphatic thermoplastic polyester that is both
biobased and biodegradable (Drumright, Gruber, & Henton, 2000; Martin.O, 2001; Tokiwa &
Calabia, 2006). Enantiomerically pure PLA is semi-crystalline polymer with a glass transition
temperature of about 55 ℃ and melting point of about 180 ℃, and soluble in chlorinated or
fluorinated organic solvents, dioxane, dioxolane, and furan (Södergård & Stolt, 2002). The
mechanical properties of PLA are comparable to polystyrene (PS) and polyethylene (PE) (Tokiwa
& Calabia, 2006). But the physical, chemical and mechanical properties of PLA composites can be
varied to a large extent according to the lactic acid chiral molecular structures (D-Lactide, L-
Lactide or meso-lactide) and the use of additives (Ellen MacArthur Foundation (EMF), 2016;
Martin.O, 2001; Södergård & Stolt, 2002).
The commercial production of PLA from corn starch started in 1994 by a company called Cargill
Inc., who used and is still using the technology of ring-opening polymerization of lactides (Vink et
al., 2003, 2015). Nowadays, PLA is used in a wide range of applications, including food service
ware; films and sheet; rigid, thermoformed packaging; fibers and nonwovens; three-dimensional
printing; and durable products (Vink & Davies, 2015).
The production of PLA can use starch derived from different feedstocks. The choice of starch
feedstock depends on the local availability in the production locations, for example corn in the USA
(Vink & Davies, 2015), sugarcane in Thailand (Groot & Borén, 2010), and rice in Japan
(Fukushima, Sogo, Miura, & Kimura, 2004). Considering the availability, the current research
assumes that PLA in PURPOD100 are sourced from a facility in Blair, Nebraska, USA, which is
owned by NatureWorks, owned by Cargill Inc. NatureWorks, who named their PLA polymer as
Ingeo, published a cradle-to-polymer factory gate life cycle inventory data for PLA production
every couple years since 2003 (Vink et al., 2003, 2007, 2010, 2015). According to the latest report
(Vink & Davies, 2015), the production of 1 kg Ingeo (PLA) uses the starch fraction of 2.67kg corn
(15% moisture) or the starch from 400,500 t of corn if running the Ingeo production plant at full
capacity. This represents the starch from 0.11% of total 2014 US corn production and 0.04% of
world corn production. And for other corn product markets, e.g. corn oil, gluten feed and gluten
meal markets would remain unaffected. The feedstock from corn, sugarcane or rice, is categorized
as 1st Generation of feedstock, which is defined as biomass from plants that are rich in
carbohydrates and that can be used as food or animal feed, by EMF, who envisions the use of plants
that are not suitable for food or animal feed (2nd Generation) and biomass derived from algae (3rd
Generation) as feedstock (Ellen MacArthur Foundation (EMF), 2016).
8
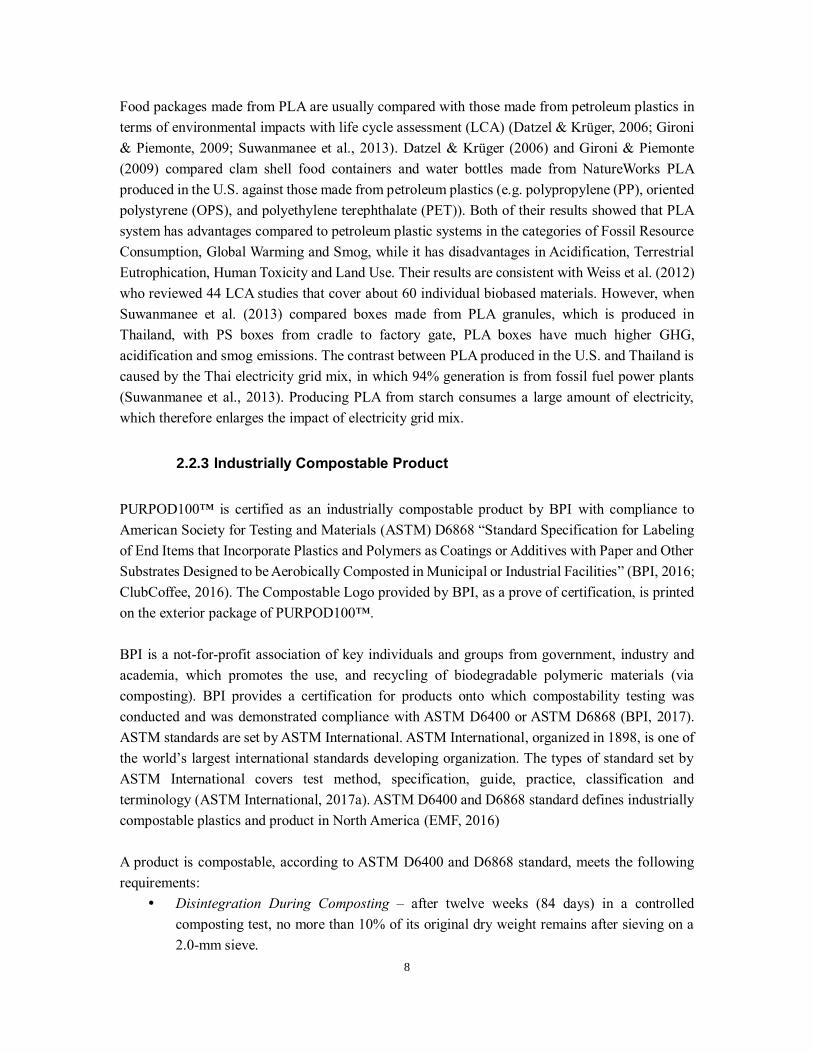
Food packages made from PLA are usually compared with those made from petroleum plastics in
terms of environmental impacts with life cycle assessment (LCA) (Datzel & Krüger, 2006; Gironi
& Piemonte, 2009; Suwanmanee et al., 2013). Datzel & Krüger (2006) and Gironi & Piemonte
(2009) compared clam shell food containers and water bottles made from NatureWorks PLA
produced in the U.S. against those made from petroleum plastics (e.g. polypropylene (PP), oriented
polystyrene (OPS), and polyethylene terephthalate (PET)). Both of their results showed that PLA
system has advantages compared to petroleum plastic systems in the categories of Fossil Resource
Consumption, Global Warming and Smog, while it has disadvantages in Acidification, Terrestrial
Eutrophication, Human Toxicity and Land Use. Their results are consistent with Weiss et al. (2012)
who reviewed 44 LCA studies that cover about 60 individual biobased materials. However, when
Suwanmanee et al. (2013) compared boxes made from PLA granules, which is produced in
Thailand, with PS boxes from cradle to factory gate, PLA boxes have much higher GHG,
acidification and smog emissions. The contrast between PLA produced in the U.S. and Thailand is
caused by the Thai electricity grid mix, in which 94% generation is from fossil fuel power plants
(Suwanmanee et al., 2013). Producing PLA from starch consumes a large amount of electricity,
which therefore enlarges the impact of electricity grid mix.
2.2.3 Industrially Compostable Product
PURPOD100™ is certified as an industrially compostable product by BPI with compliance to
American Society for Testing and Materials (ASTM) D6868 “Standard Specification for Labeling
of End Items that Incorporate Plastics and Polymers as Coatings or Additives with Paper and Other
Substrates Designed to be Aerobically Composted in Municipal or Industrial Facilities” (BPI, 2016;
ClubCoffee, 2016). The Compostable Logo provided by BPI, as a prove of certification, is printed
on the exterior package of PURPOD100™.
BPI is a not-for-profit association of key individuals and groups from government, industry and
academia, which promotes the use, and recycling of biodegradable polymeric materials (via
composting). BPI provides a certification for products onto which compostability testing was
conducted and was demonstrated compliance with ASTM D6400 or ASTM D6868 (BPI, 2017).
ASTM standards are set by ASTM International. ASTM International, organized in 1898, is one of
the world’s largest international standards developing organization. The types of standard set by
ASTM International covers test method, specification, guide, practice, classification and
terminology (ASTM International, 2017a). ASTM D6400 and D6868 standard defines industrially
compostable plastics and product in North America (EMF, 2016)
A product is compostable, according to ASTM D6400 and D6868 standard, meets the following
requirements:
Disintegration During Composting – after twelve weeks (84 days) in a controlled
composting test, no more than 10% of its original dry weight remains after sieving on a
2.0-mm sieve.

9
Biodegradation – 90% of the organic carbon in the whole item or for each organic
constituent shall be converted to carbon dioxide within a 180 days period at 58°C (±2°C).
Support Plant Growth – the end item shall have concentrations of heavy metals less than
50%, and the germination rate and the plant biomass of the sample composts shall be no
less than 90% of blank composts. (ASTM International, 2012, 2017b)
2.3 Circular Economy
It is evident that the concept of circular economy (CE) has recently gain importance for academia,
policymakers and companies (Geissdoerfer, Savaget, Bocken, & Jan, 2017; Ghisellini, Cialani, &
Ulgiati, 2016). CE, as alternative to a traditional take-make-dispose linear economic system
(Bocken, Olivetti, Cullen, Potting, & Lifset, 2017), has inspired the administration of Ontario. In
the Waste-Free Ontario Strategy, building a circular economy was written into a provincial strategy
in Canada for the first time (Ontario Ministry of Environment and Climate Change, 2016).
Although CE is still a developing concept, it provides conceptual framework for Ontario to build a
more eco-efficient and sustainable future.
2.3.1 Evolvement and Definition
The concept of CE has been evolving since the late 1970s (EMF, 2013). Ghisellini et al. (2016)
stressed in their review on the development of CE that the concept of CE was initially inspired by
Boulding (1966), whose idea of economy as a circular system is seen as a prerequisite for the
maintenance of the sustainability of human life on Earth. Ghisellini et al. (2016) credited Pearce &
Turner (1990) as scholars who primarily introduced the concept of CE based on Boulding's (1966)
idea, and explained the shift from the traditional open-ended economic system to the circular
economic system as a consequence of the law of thermodynamics that dictate matter and energy
degradation, and identify economic functions of the environment as: provision of resources, life
support system, and sink for waste and emissions.
McDonough & Braungart (2002) inspected the cradle-to-grave production system emerged since
industrial revolution, and propagated a cradle-to-cradle system. McDonough & Braungart (2002)
also introduced how products and materials circulate in a cradle-to-cradle system, and put forward
the concept of biological nutrients and technical nutrients. Biological nutrients are materials, which
can safely be returned to the biosphere, should flow within a biological metabolism; and technical
nutrients, which cannot be broken down and safely absorbed by biological systems, should flow in
the technical metabolism (Brennan, Tennant, & Blomsma, 2013; McDonough & Braungart, 2002).
The biological and technical nutrient framework was further illustrated by EMF (2013) with their
famous “butterfly figure”, and the figure has been instrumental in visualizing a hierarchy of
circularity strategies (reuse, repair, refurbishment, remanufacturing, repurpose, and recycling)
(Bocken et al., 2017).
10
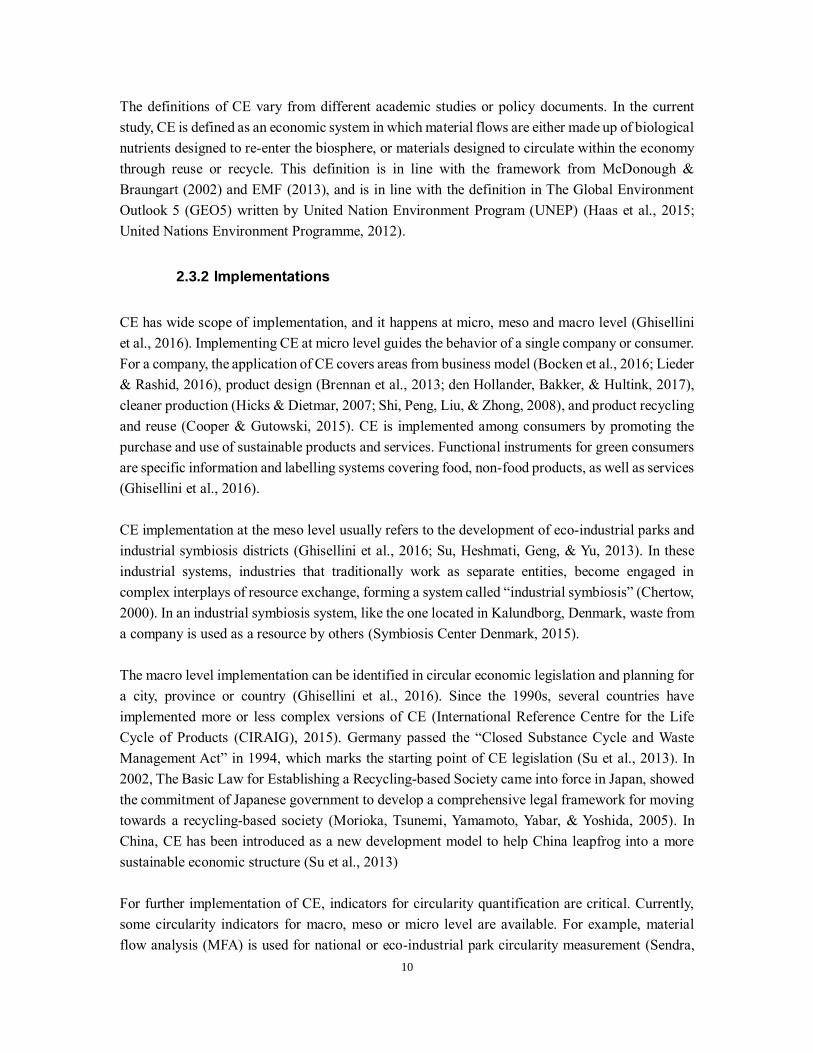
The definitions of CE vary from different academic studies or policy documents. In the current
study, CE is defined as an economic system in which material flows are either made up of biological
nutrients designed to re-enter the biosphere, or materials designed to circulate within the economy
through reuse or recycle. This definition is in line with the framework from McDonough &
Braungart (2002) and EMF (2013), and is in line with the definition in The Global Environment
Outlook 5 (GEO5) written by United Nation Environment Program (UNEP) (Haas et al., 2015;
United Nations Environment Programme, 2012).
2.3.2 Implementations
CE has wide scope of implementation, and it happens at micro, meso and macro level (Ghisellini
et al., 2016). Implementing CE at micro level guides the behavior of a single company or consumer.
For a company, the application of CE covers areas from business model (Bocken et al., 2016; Lieder
& Rashid, 2016), product design (Brennan et al., 2013; den Hollander, Bakker, & Hultink, 2017),
cleaner production (Hicks & Dietmar, 2007; Shi, Peng, Liu, & Zhong, 2008), and product recycling
and reuse (Cooper & Gutowski, 2015). CE is implemented among consumers by promoting the
purchase and use of sustainable products and services. Functional instruments for green consumers
are specific information and labelling systems covering food, non-food products, as well as services
(Ghisellini et al., 2016).
CE implementation at the meso level usually refers to the development of eco-industrial parks and
industrial symbiosis districts (Ghisellini et al., 2016; Su, Heshmati, Geng, & Yu, 2013). In these
industrial systems, industries that traditionally work as separate entities, become engaged in
complex interplays of resource exchange, forming a system called “industrial symbiosis” (Chertow,
2000). In an industrial symbiosis system, like the one located in Kalundborg, Denmark, waste from
a company is used as a resource by others (Symbiosis Center Denmark, 2015).
The macro level implementation can be identified in circular economic legislation and planning for
a city, province or country (Ghisellini et al., 2016). Since the 1990s, several countries have
implemented more or less complex versions of CE (International Reference Centre for the Life
Cycle of Products (CIRAIG), 2015). Germany passed the “Closed Substance Cycle and Waste
Management Act” in 1994, which marks the starting point of CE legislation (Su et al., 2013). In
2002, The Basic Law for Establishing a Recycling-based Society came into force in Japan, showed
the commitment of Japanese government to develop a comprehensive legal framework for moving
towards a recycling-based society (Morioka, Tsunemi, Yamamoto, Yabar, & Yoshida, 2005). In
China, CE has been introduced as a new development model to help China leapfrog into a more
sustainable economic structure (Su et al., 2013)
For further implementation of CE, indicators for circularity quantification are critical. Currently,
some circularity indicators for macro, meso or micro level are available. For example, material
flow analysis (MFA) is used for national or eco-industrial park circularity measurement (Sendra,

11
Gabarrell, & Vicent, 2007). For micro level, EMF, co-operating with GRANTA, built up Material
Circularity Indicator that estimates the circularity of a product based on the fraction of recycled
content of a product after use (EMF, 2015). Other product circularity indicators include Circular
Economic Index developed by Di Maio & Rem (2015), which emphasizes the economic value of
recycled materials, and Circular Economy Performance Indicator by (Huysman, De Schaepmeester,
Ragaert, Dewulf, & De Meester, 2017), which compares quality of virgin material over recycled
material. But existing micro-level indicators focus on recyclable materials, fail to evaluate the
circularity of biological nutrients.
2.4 Municipal Solid Waste Management
This section makes a brief introduction of development of municipal solid waste management
(MSWM) in North America, and its current trends. Three waste management methods associated
with coffee pod wastes are also introduced in the context of Ontario: landfilling, recycling and
composting.
2.4.1 Development and Trends
Waste management can be defined as the organized collection, transportation, processing, recycling
or disposal of waste in ways that minimizes potential ruinous effects on the environment and human
health (Squire, 2012). MSWM is a waste management service provided by municipalities to
manage the solid waste generated by the residential, commercial, institutional, construction and
demolition activities in their jurisdictions (Kreith & Tchobanoglous, 2002). During the middle of
19th century, it was realized for the first time that municipal solid waste management practice has
an impact on public health. Industrialization and growing populations in cities led to excessive
accumulation of wastes, which would essentially cause diseases if not properly managed (Zavodska,
2000). During the 1890s, major cities in North America realized the necessity to better manage
their sewage and solid wastes. At that time land application was the most popular method for the
disposal of municipal refuse, followed by farm use and dumping in water (Louis, 2004).
From the 1920s to 1960s, MSWM was strongly characterized as engineering-based management
in North America (Chen, 2008; Louis, 2004). Along with technological progress, sanitary
landfilling, incineration, recycling, and other alternative methods emerged, which significantly
strengthened the capacity for waste treatment and safe disposal (Chen, 2008). During that period,
landfilling and combustion were still the main waste management approaches. Resource recovery
from waste and environmental impacts were typically not considered (Kollikkathara, Feng, & Stern,
2009; Mader, 2011).
An important shift in attitude emerged in the 1970s, where the focus gradually shifted to recycling,
and material and energy recovery rather than simply burying or burning the municipal waste (Louis,
2004). One reason of the shift was urbanization. The population concentrated in urban areas created

12
higher and higher pressures on the landfill sites, and locations for landfill became harder to find.
City planners needed better methods to manage the wastes (Manaf, Samah, & Zukki, 2009). The
shift was also attributed to legislation hat encouraged recycling and recovery and set up guidelines
for operation and monitoring at state/provincial and federal/national level (Chen, 2008). Since the
implementation of U.S. Resource Conservation and Recovery Act in 1976, the MSW recycling and
composting rate in the United States has grown from 7.5% in 1975 to 34.6% in 2014 (USEPA,
2016).
Since the early 1990s, sustainability has gradually become a concern in MSWM, waste
management planning has been required to consider its economic, social and environmental
impacts. As Haight (1991: ix) stated, “owing to the complex and variable nature of municipal solid
waste and the various evaluation criteria, it can be difficult to identify the optimal option for a
particular community.” Because of this complexity, the Integrated Waste Management (IWM)
approach evolved and attained its popularity in North America (Kollikkathara et al., 2009;
Tchobanoglous, Theisen, & Vigil, 1993; Van De Klundert, 1999). IWM is a systematic approach
that considers all methods of waste prevention, waste collection, resource recovery and disposal
and chooses the best combination of methods to achieve the specific waste management goals of a
community (Morrissey & Browne, 2004). The IWM approach considers the environmental, energy,
socio-economic and political impacts of waste management techniques and seeks to incorporate
options with the potential to cause less harm (Tchobanoglous et al., 1993). Currently, municipalities
in North America are still committed to further implementation of IWM. It helped Canada and the
U.S. achieve 36.1% and 34.6% municipal solid waste diversion rate respectively in 2014 (Statistics
Canada, 2017; USEPA, 2016). European Union promotes guidelines on waste prevention under a
IWM infrastructure (European Commission, 2012). The benefit of IWM does not limit to diverting
resources from waste, it also reduced the GHG emissions from the waste sector, due to using less
incineration and more recycling and composting (Habib, Schmidt, & Christensen, 2013).
However, several features limited the promotion of IWM in developing countries. Implementing
IWM emphasizes on public participation and demands for substantial financial, technical and
human resources (Furedy, 1992; Squire, 2012). Furthermore, the IWM approach requires effective
coordination and partnership among various agencies (Squire, 2012).
2.4.2 Landfilling
Landfilling involves the controlled deposit of waste in a designated space and covering such wastes
with top-cover as a means of minimizing and preventing pollution (Cointreau-Levine, 1999; Squire,
2012). Landfilling has advantages in being simple, versatile and relatively inexpensive, and it offers
final disposal route for other waste management options (Cheremisinoff, 2003). However,
landfilling also threatens environment and human health with its leachates and landfill gas emission.
Leachate from landfills contains pollutants such as dissolved organic matter, inorganic macro
components, heavy metals and xenobiotic organic compounds (Koerner & Daniel, 1997). Landfills

13
generate gases that can contribute to global warming including methane, carbon dioxide (CO2),
hydrogen sulfide (H2S) and volatile organic compounds (VOC), oxygen, nitrogen, benzene and
vinyl chloride. Other issues like land occupation and post-closure maintenance also bother
municipalities and their residences.
The current standards for new landfill designs in Ontario were effective on August 1, 1998, under
Regulation 232/98 (Government of Ontario, 2012). The regulation covers issues such as waste fill
area and leachate collection system design requirements, mandatory air emissions control, water
condition assessment and monitoring, leachate contingency plan and post closure care
(Government of Ontario, 2012). Leachate collection and landfill gas control are mandatory for
landfills in Ontario, which effectively reduce pollution from the landfills. It is reported that there
are 805 active landfill sites across Ontario, with the total remaining capacity of 127.3 million tons
in 2014 (Ontario Waste Management Association, 2016).
2.4.3 Recycling
Recycling involves the conversion of post-usage products into new useful products through
physical, chemical or biological processes (Cunningham & Cunningham, 2012; Oskamp, 1995).
Usually, recyclables are collected through buy-back, drop-off and/or curb-side programs and sent
to recycling plants for conversion (Squire, 2012). In addition to reducing landfill use and extending
the useful life of landfills, recycling as a waste management method has other significant benefits.
Those benefits includes saving natural resources for a sustainable development, reducing energy
use, pollution, GHG emission for new material production, and creating jobs (Oskamp, 1995). But
not all products or materials will be recycled because the value of the recycled products are
sometimes not enough to cover the cost of collecting, sorting, transporting, processing and
packaging (Cunningham & Cunningham, 2012). In this study two materials, aluminum and
cardboard, are considered recyclable. Electricity is the main energy input for aluminum recycling,
whose electricity consumption is 5% that of producing primary aluminum from primary oxides
(Green, 2007). Cardboard recycling is a mature and widespread industry, and it is beneficial from
energy consumption and wastewater emission perspectives (Villanueva & Wenzel, 2007).
Municipalities in Ontario are running a series of recycling activities to help residence to recycle
their recyclables, according to the Resource Productivity and Recovery Authority (RPRA) (2017)
the activities are:
Blue Box printed paper and packaging
Waste Electrical and Electronic Equipment;
Municipal Hazardous or Special Waste;
Other recyclables (e.g., scrap metal); and
Used tires
The Ontario RPRA (2017) also indicated that the overall provincial residential waste diversion rate
in Ontario is 47.7% in 2015, and recycling activities contributed 60% of diverted waste with the

14
balance comprising organic diversion, including compositing.
2.4.4 Composting
Composting is defined as the controlled biological decomposition of organic material with the aid
of air, moisture, temperature, fungi and bacteria (Epstein, 2011; Haug, 1993). The composting
process produces compost as end product, which is defined as a stabilized organic soil conditioner
devoid of human and plant pathogens that is beneficial to plant growth (Haug, 1993). Compost is
used primarily as a soil amendment or mulch by farmers, horticulturalists and households as
nutrients that enable plant growth (Squire, 2012).
Aerobic composting and anaerobic digestion are the two techniques for composting. Aerobic
composting is defined as the bacterial process of decomposition or rotting occurring in the presence
of oxygen (Haug, 1993). In the presence of oxygen, bacteria would rapidly consume organic matter
and convert it into carbon dioxide. While anaerobic digestion is a process in which microorganisms
break down organics and generate methane in the absence of oxygen, anaerobic digestion is
typically a slower procedure than aerobic composting, and produce less heat during reaction (Squire,
2012). A certain level of moisture content is required by both processes, while aerobic composting
needs high temperature to accelerate the decomposition. Both aerobic composting and anaerobic
digestion are available in Ontario, but in this study, the composting of used coffee pod is modelled
as the aerobic composting process, because the decomposition of PLA is much faster in a high
temperature environment (Tokiwa et al., 2009). There are three major types of aerobic composting
processes including the “windrow”, “aerated static pile” and ‘in-vessel’ systems, with the former
and latter most dominant (Komilis & Ham, 2004). With a cold climate in Ontario, aerobic
composting is usually conducted in an in-vessel system, in which composting takes place in an
enclosed vessel with air pumped into the organic piles (City of Guelph, 2017).
Benefits of composting as a waste management method include diverting waste from landfills and
incinerators, generating compost, and provision of renewable natural gas in anaerobic digestion
(Tokiwa et al., 2009). However, there are some challenges associated with composting. Large scale
composting facilities are expensive to run and can be labor intensive. There is also a danger of
leachate pollution in areas where large scale composting is carried out. The release of ammonia gas
during composting can contribute to devaluing the quality of compost and may also cause a myriad
of environmental problems (O’Leary, 1999).
2.4.5 Incineration
Incineration involves a regulated thermal destruction process that converts combustible materials
into non-combustible residue or ash (Squire, 2012), producing heat, water vapor, particulate matter,
products of incomplete combustion, nitrogen, carbon dioxide and oxygen (Carter- Whitney, 2007).

15
There are many types of incineration systems including grate burners, fluidized bed burners and
more recently, pyrolysis and gasification (Porter, 2010). Incinerators are typically fed mixed waste
containing low levels of hazardous substances such as heavy metals and chlorinated organic
chemicals (Carter- Whitney, 2007). These substances can be transformed by incineration into forms
that are likely to be more toxic (Franchini, Rial, Buiatti, & Bianchi, 2004). Depending on the nature
of the waste being incinerated, other compounds may be produced, including hydrogen chloride,
hydrogen fluoride, nitrogen oxides, sulphur dioxide, volatile organic carbons, dioxins and furans,
heavy metals, etc. (Williams, 2005).
As a waste management option, incineration has several benefits. It can reduce the volume and
toxicity of solid, liquid and gaseous residue by as much as 80-90%, imposing a lesser demand for
land in comparison to landfilling (Squire, 2012). Further, incineration technology is capable of
generating electricity and energy for heating purposes. On the other hand, the most worrying
disadvantage of incineration is the discharge of dangerous dioxins and furans into the atmosphere
causing significant levels of air pollution (Squire, 2012). Additionally, incineration is critiqued for
contributing to the retardation of recycling efforts (Carter- Whitney, 2007). The disposal of
incinerated ash in landfills may also cause pollution of surface, ground and drinking water (Enger,
Smith, & Bockarie, 2000).
Currently, Emerald Energy From Waste Inc. located in Brampton is the only operating municipal
waste incinerator in Ontario, and the opening of Durham-York Energy Centre in Clarington has
been postponed since December, 2014 (Carter- Whitney, 2007; Javed, 2016). The fact that only one
incineration facility is in full operation in Ontario shows how hesitant municipalities have been to
them as a management option. Based on the fact that incineration is only available for a small
proportion of Ontario, this research does not consider incineration as one of the waste management
option in Ontario. Other energy-from-waste options (like anaerobic digestion) were not considered
as options for municipal waste processing, and for coffee pod waste specifically.
2.5 Summary of Literature Review
This research investigates three single-serve coffee pod systems, compares their potential
environmental effects and waste generation in the context of Ontario. The three coffee pods are
primarily made from petroleum-based plastics, aluminum, and biobased polymers, respectively.
And therefore, fall under different waste management approaches, i.e. landfilling, mechanic
recycling, and composting. Biobased polymers are attracting more attention from the academia and
industry, because they, as alternatives of petroleum based plastics, can reduce fossil resource
consumption and GHG emissions, and have more and more applications.
Since the concept of circular economy appeared, it has been closely connected to substituting
landfilling with other waste management approaches like recycling and composting, and recovering
resources from wastes. In the last decade, the conceptual framework of CE has been applied by
more and more regional or national governments to guide their sustainable development in Asia

16
and Europe. The Province of Ontario followed their steps by enacting the Waste-Free Ontario Act
and Five-Year Climate Change Plan in 2016. In these documents, Ontario set targets in building a
circular economy, increasing waste diversion rate and reducing GHG emissions. This case study of
a single-use product with high sales volume can provides more insights of biobased materials
versus traditional materials, and waste management approaches, therefore, help Ontario to attain
its targets.
17
Methodology and Data
3.1 Investigating Packaging Systems
Three brands of single serve coffee pods are considered in this study, named as Polystyrene Pod,
Aluminum Pod and Biodegradable Pod, respectively. Life cycle assessment (LCA) is used as a
method to assess and compare the potential environmental effects of three selected brands of coffee
pods over their life cycle. Polystyrene Pod is the most popular coffee pod product in North
American market, it is therefore chosen as the baseline scenario for this LCA study. Polystyrene
Pod has a cup-shaped polyethylene and polystyrene composite shell that is sealed with an aluminum
foil lid. Inside the shell, there is an abaca fiber filter holding some ground coffee. Aluminum Pod
is a hemispherical aluminum capsule with an aluminum foil lid. There is not a filter inside
Aluminum Pod. Biodegradable Pod is consisted of three parts, a cotton mesh that serve as filter and
the container for ground coffee, a paper lid and a biobased polymer ring that holds the mesh and
the lid together. For secondary package, both Polystyrene Pod and Aluminum Pod are airtight, only
a cardboard box is necessary. But Biodegradable Pod is not airtight, and therefore a low-density
polyethylene (LDPE) overwrap is necessary for each pod before putting in a cardboard box. The
cardboard box for the pods are made from different materials. Boxes for Polystyrene Pod and
Biodegradable Pod use solid unbleached board, while boxes for Aluminum Pod are made from
solid bleached board. Figures 1, 2 and 3 show the images of packaging systems for Polystyrene
Pod, Aluminum Pod and Biodegradable Pod, respectively. Table 1 indicates the packaging materials
used in each packaging system.

18
Figure 1 Image of Polystyrene Pod
Figure 2 Image of Aluminum Pod system

19
Figure 3 Image of Biodegradable Pod system
Table 1 Packaging materials of investigated coffee pods
Coffee Pod # Components Materials Mass (g) Data source
Polystyrene
Pod
Abaca filter
Abaca fiber 0.202
(Chayer &
Kicak, 2015)
Softwood 0.0224
Polyethylene (PE) 0.056
Aluminum lid
Aluminum foil 0.0692
Polyethylene
terephthalate (PET) 0.034
PE 0.144
Shell
Polystyrene (PS) 2.52
Ethylene vinyl
alcohol (EVOH) 0.0428
PE 0.115
Cardboard box Solid unbleached
board (SUB) 2.83
Measurement Coffee ground 9.81
Total 15.85
Aluminum Pod Aluminum lid
Al foil 0.042 Measurement
and assumption PET 0.020
PE 0.087

20
Shell Al alloy 1.81
Cardboard box Solid bleached board 4.47
Coffee ground 12.92
Total 19.35
Biodegradable
Pod
Paper lid Kraft paper 0.288
Measurement
and assumption
Polylactic acid (PLA) 0.032
Ring PLA 1.82
Coffee chaff 0.46
Mesh PLA 0.24
Wrapping bag PE 1.23
Cardboard box SUB 4.95
Coffee ground 10.46
Total 19.48
A Quantis LCA report (Chayer & Kicak, 2015), which compares single-serve coffee and bulk coffee
brewing, has provided a comprehensive life cycle inventory of a single-serve coffee pod that is
identical to Polystyrene Pod. Primary data on material used in Chayer & Kicak (2015) was collected
directly from Mother Parkers Tea & Coffee, a coffee pod manufacturer. The coffee pod assembly
takes place in Waterbury, Vermont, the United States. Inventory data on Polystyrene Pod’s
component, material and mass, and transportation distance are derived from Chayer & Kicak (2015).
Inventory data of Aluminum Pod and Biodegradable Pod are empirical data collected through
weighing the component of coffee pods. The weighing was carried out on a scale with an accuracy
of 0.1g. For each measurement, ten identical products were disassembled into components listed in
Table 1, each component was weighed respectively. The same component of ten products were
weighted together to assure accuracy. The results were then divided by ten to generate the mass of
each component. The materials in each component were not possible to be extracted for weighing
separately, nor were they available from reliable sources. Therefore, the mass of materials was
converted from mass of components based either on information provided by producer or from
assumptions. The material of aluminum lid in Aluminum Pod was assumed to be 57.9% PE, 28.5%
Al foil and 13.6% PET. This assumption was based on the material assumption of aluminum lid in
Polystyrene Pod in Chayer & Kicak (2015). According to the Biodegradable Pod producer, the
biobased polymer ring of Biodegradable Pod is made from a composite with 80% polylactic acid
and 20% coffee chaff by mass, and the paper lid is made of kraft paper with PE membrane (Personal
communication, 2017).
For clarification, Polystyrene Pod and Biodegradable Pod are usable in the same brewing machine,
but Aluminum Pod is only usable in its specially-designed machine. These two different brewing
machines may consume different amount of energy in use stage. However, this study focused only
on the environmental effects of the coffee pods’ packaging systems. All other aspects regarding the
manufacturing and use of the brewing machines are beyond the scope of this study.

21
3.2 Goal and Scope
3.2.1 Goal
By comparing the environmental effects of three single-serve coffee pod packaging systems
- Polystyrene Pod: a petroleum plastic coffee pod with aluminum lid and paper filter,
- Aluminum Pod: an aluminum coffee pod,
- Biodegradable Pod: a biobased polymer coffee pod that made of polylactic acid and kraft
paper,
The objectives of this case study are:
1. To quantify the environmental hotspots of each coffee pod packaging system,
2. To compare global warming potential (GWP) between the systems, and to identify tradeoffs in
other life cycle impact categories,
3. To estimate the landfill waste generated by the consumption of the coffee pods under current
waste management system in Ontario.
The ultimate goal of this research is to evaluate and compare different packaging options that may
contribute to achieve a circular economy.
The results of this study are intended to inform at least three groups of audiences who could make
efforts towards a more circular economy,
1. The government of the Province of Ontario who is seeking to cut down wastes and greenhouse
gas(GHG) emission. Ontario has issued two environmental documents in 2016 (Ontario
Ministry of Environment and Climate Change, 2016, 2016) .The first one is Strategy for a
Waste Free Ontario: Building the Circular Economy, in which diverting more waste from
landfill is an important part of their plan. The second one is Ontario’s Five-Year Climate
Change Action Plan 2016-2020, which encourages industries and business to reduce GHG
emission. This study provides insights into efficiency of waste reduction programs, GHG
reduction and other environmental effects of replacing petroleum plastics with aluminum and
biobased polymers.
2. The producers of single serve coffee pods who are aware of the heavy environmental burdens
of their products, are looking forward to improve their products to avoid the burdens and reduce
GHG emission. Recyclable pods and compostable pods are two potential methods to solve the
waste problem of the coffee pods. The results of this study are possible to provide some
information for their improvement.
3. To consumers of the single-serve coffee pod, this research illustrates the environmental effects
of the selected coffee pod formats, and provides supporting information for consumer decision
making regarding which coffee pod to buy and how to manage wastes after use.

22
3.2.2 The Function and Reference Unit
According to the instruction of the brewing machines, for a single use of a Polystyrene Pod or
Biodegradable Pod, it is capable of providing a 6oz, 8 oz. or 10 oz. cup of coffee drink, and an
Aluminum Pod can provide a cup of 8oz (Keurig Green Mountain Inc., 2016; Nespresso, 2016).
This study assumes that every use of a coffee pod provides 8 oz. of coffee beverage. The functional
unit of the study is packaging required to deliver coffee product sufficient for providing 8 oz. of
coffee beverage. The reference flow is 1000 units of single-serve coffee pods used for coffee
beverage brewing, which is a reasonable quantity for a small household in one year.
3.2.3 Spatial and Temporal Scope
Although the coffee pods are produced in different parts of the world (Polystyrene Pod in Waterbury,
Vermont, the United States, Aluminum Pod in Orbe, Switzerland, and Biodegradable Pod in
Toronto, Canada), it is assumed that the three types of coffee pods in this study are used and
managed after use within the Province of Ontario.
All activities in this study were modeled on the temporal base of 2016, for the reason that the newest
background data available are 2016 data, for example electricity generation mix (IESO, 2017;
USEIA, 2017). As for the pre-existing datasets derived from EcoInvent v. 2.2, most of which were
built up with data collected before 2010, it is assumed that those production and processing
technologies have not experienced major evolutions, and the datasets are still reflecting current
situation.
3.2.1 System boundary
This comparative LCA study considers cradle-to-grave full life cycles of three types of coffee pods,
from extraction and process of all raw materials through the end-of-life of all product components.
The following flow diagrams (Figure 4, 5 and 6) show the system of petroleum plastic coffee pod,
aluminum coffee pod and biobased polymer coffee pod, respectively.
The analysis covered all of the identified materials used for the coffee packaging systems, including
the coffee pods and their secondary package. In this study, it is assumed that the coffee ground
contained in the three systems are from the same source and undergoes identical roasting and
grinding processes. Although the average coffee contents vary from 9.81 to 12.92 g/capsule, in this
LCA study, coffee cultivation and its following processing procedures are excluded from the system
boundary. Because this study focused on the packaging system and their end-of-life management,
the retail and use phase were excluded, also excluded were the manufacture and use of the brewing
machines which the coffee pods are put in to brew coffee.

23
Figure 4 Life cycle flow diagram of Polystyrene Pod. Coffee cultivation and processing, and coffee pod
use are excluded from the system boundary of this LCA study. After use, all Polystyrene Pods are
landfilled together with the coffee wastes, whereas 62.5% of the cardboard boxes are recycled.
Polystyrene Pod was chosen as the baseline for the comparison of environmental impact categories
between the three coffee pods, because it is the most common form of single-serve coffee pod in
the market. The pod consists of three parts, a cup-shape plastic cell, a paper filter containing ground
coffee and an aluminum lid. There are 12 pods packed in one solid unbleached cardboard box. After
use, the whole pod is assumed to be landfilled with ground coffee inside, while 62.5% of the
cardboard box is assumed to be recycled in a municipal recycling facility according to the U.S.
paper and paperboard recycling rate in 2013 (USEPA, 2016).

24
Figure 5 Life cycle flow diagram of Aluminum Pod. After use, 14% of the Aluminum Pods and 62.5% of
the cardboard boxes are recycled. The coffee wastes contained in the recycled pods are composted.
Aluminum Pod is fully made of aluminum, whose shell is colored by aluminum anodizing from the
outside. A solid bleached board box will contain 10 pieces of this pod. The end-of-life scenario
designed for Aluminum Pod is an aluminum recycling scenario. According to the producer, 24% of
the used pods were recycled in 2016 (Nestlé Nespresso S.A., 2017). However, considering the less
intensive distribution of recycling spots in Ontario than in European nations, this study assumed
that 14% of the used pods are collected for recycling via the recycling system established by the
pod producer in Ontario. For those pods that are assumed be recycled, the coffee ground contained
inside is diverted and sent for aerobic composting. The rest of the used pods will be landfilled with
the coffee ground contained inside. The same as Polystyrene Pod, 62.5% of the cardboard boxes
are assumed to be recycled.

25
Figure 6 Life cycle flow diagram of Biodegradable Pod. After use, 40% of the Biodegradable Pods are
aerobic composted with their coffee wastes, and 62.5% of the cardboard boxes are recycled.
Biodegradable Pod consists of three parts, a filter mesh that contains ground coffee, a biobased
polymer ring that holds the mesh and a paper lid. Unlike the other two products, each Biodegradable
Pod is wrapped individually in a polyethylene (PE) bag. For this brand, 20 pods will be packed in
one solid unbleached board box. The end-of-life scenario for Biodegradable Pod is partially
composting scenario, 40% of the used pods are sent to industrial composting facility, along with
the ground coffee contained inside, for aerobic composting. The rest 60% will be sent to a landfill.
However, all of the PE bags are assumed to be landfilled and 62.5% of the cardboard boxes are
assumed to be recycled.
3.2.2 Allocation Procedures
Coffee chaff, a by-product of coffee roasting process, is used as one of the raw material for
Biodegradable Pod. For most cases, coffee chaff has no utility value, and is a problematic waste to
deal with (The Roasterie, 2013). The coffee roasting procedure produce both valuable roasted
coffee beans and valueless coffee chaff. According to an economic allocation method, neither the

26
environmental burden of coffee cultivation, nor of coffee roasting should be carried on by coffee
chaff, but by roasted coffee beans. Therefore, coffee chaff is treated as an emission-free raw
material input in the ring production of Biodegradable Pod consistent with established LCA practice
(Baumann & Tillman, 2004; Guinée, Heijungs, & Huppes, 2004).
In this study, aluminum in Aluminum Pod and cardboard boxes were considered to be recycled at
a recycling rate of 14% and 62.5%, respectively (USEPA, 2016). To avoid allocation in modelling
recycling, a system boundary expansion approach was used, meaning that the recycled materials
were modelled as they contribute to avoiding the production of virgin materials (Chayer & Kicak,
2015; ISO, 2006).
3.2.3 Assumptions
Critical assumptions of this study are:
1. It is assumed that the material processing technologies used in coffee pod manufacture,
including plastic film calendaring, extrusion forming and cardboard box production, are
identical in Europe and North America. This assumption is important because the modeling of
the same process applied in different countries are based on the same dataset from EcoInvent.
2. It is assumed that coffee itself can be excluded from the comparison of packaging systems. In
this study, it is assumed that the three coffee pod companies sourced their coffee bean from
the same region, and roasted and grinded them with similar technology. Although slightly
different amount of coffee grounds, varying from 9.8g to 12.9g per capsule, are contained in
different coffee pods, coffee bean cultivation and processing are excluded from the system
boundary in order to emphasize the effects of packaging system.
3. To prevent coffee oxidation, nitrogen is injected into single-serve coffee pods (Chayer & Kicak,
2015). But because of the lack of reliable data source, it is assumed that the amount nitrogen
injected into each capsule are similar and limited, and generates insignificant amount of
emissions. The nitrogen injection process is excluded from the system boundary. For the same
reason, the compressing process, in which a small amount of electricity is consumed to
combine different components to produce a coffee pod, is assumed to be insignificant and
excluded from the system boundary.
4. Different road transportation vehicles may be used for different cargoes or in different regions.
To simplify the model, it is assumed that all the raw material, finished product and waste are
transported by diesel fueled lorries which have a maximum capacity of 16 metric ton and meet
Euro 5 emission standard. The USEPA Tire 3 Standard, which is the functioning standard in
the U.S. and Canada, has a higher requirement than the Euro 5 standard in terms of nitrogen
oxides and total hydrocarbon emission (Blumberg & Posada, 2015). The difference between
the standards increased uncertainty of the study. As for marine transportation, transoceanic
freight ships are assumed to be the carrier.
Other assumptions applicable for a specific coffee pod modeling in the study, will be explained in

27
the life cycle inventory section (3.2).
3.3 Life Cycle Inventory
Life cycle inventory Data from Chayer & Kicak (2015) was used for the material used and material
transportation distances of Polystyrene Pod. Primary data was collected for the mass of the
components of the Aluminum Pod and Biodegradable Pod through direct measurement. Data for
the material transportation distances of Aluminum Pod was converted from Dubois, Humbert, &
Margni (2011), in which an LCA study was conducted on a coffee capsule that was manufactured
in the same site as Aluminum Pod located in Orbe Switzerland. Material transportation distance
data of Biodegradable Pod were results of assumptions and estimations.
LCA software SimaPro (version 7.3.0), created by PRé Consultants, was used for the unit process
modeling and calculation in this study. SimaPro has been the leading LCA software package for 25
years. It is trusted by industry and academics in more than 80 countries (Long Trail Sustainability,
2017; Boureima, Sergeant, & Wynen, 2007).
3.3.1 Unit Processes
Although different datasets for one material may be available from different databases, all
background life cycle inventory data were derived from EcoInvent Database Version 2.2, which is
the main source for secondary LCI data. More importantly, EcoInvent shows higher completeness
and transparency, and a wider coverage of material and process variety than any other databases
that available in SimaPro. Using datasets from the same database for different modules helps to
maintain data quality. But most of the datasets in EcoInvent were generated in Europe and
representing European industrial conditions. Therefore, the datasets were modified in terms of
electricity source mix according to the location of the production sites to increase geographical
correlation. A dataset of medium voltage electricity generation of Ontario is created based on the
Ontario’s supply mix extracted from the Independent Electricity System Operator (IESO) website
(IESO, 2017).
Material loss happens in most processing procedures, and the percentages of material loss in plastic
processing are documented in EcoInvent datasets (PRé Consultants, 2013). The current research
considers the plastic losses in the LCA modeling, and increased the quantities of relevant material
input. But material losses smaller than 2% were considered insignificant and ignored. The ignored
losses occur in rigid sheet calendering (0.3%) and injection molding (0.6%). On the other hand,
losses occur in film extrusion (2.6%) and thermoforming (2.3%) were calculated.
3.3.1.1 Production of Polystyrene Pod
Life cycle inventory data on the production of 1000 pieces of Polystyrene Pod were converted from
Chayer & Kicak (2015). Material inputs and processing methods are listed in Table 2. Since the
production site of Polystyrene Pod is located in Waterbury, Vermont, United States of America, the

28
datasets from EcoInvent related to Polystyrene Pod were adapted by replacing the European
electricity grid mix with an Vermont mix.

29
Table 2 Process datasets for modeling the production of 1000 pieces of Polystyrene Pod
Product (1,000p) Component Dataset (Source: EcoInvent) Value Unit
Polystyrene Pod
Shell
Materials
Polystyrene, expandable, at plant/RER U 2.64 kg
Polyethylene, LDPE, granulate, at plant/RER U 0.121 kg
Ethylene vinyl acetate copolymer, at plant/RER U 0.0449 kg
Processes Extrusion, plastic film/RER U (New England (NE.) electricity mix) 2.68 kg
Thermoforming, with calendering/RER U (NE. electricity mix) 2.68 kg
Lid
Materials
Aluminum, primary, at plant/RER U 0.0692 kg
Polyethylene terephthalate, granulate, amorphous, at plant/RER U 0.035 kg
Polyethylene, LDPE, granulate, at plant/ RER U 0.148 kg
Printing color, offset, 47.5% solvent, at plant/RER U (NE. electricity
mix) 0.038
kg
Processes
Calendering, rigid sheets/RER U (NE. electricity mix) 0.178 kg
Extrusion, plastic film/RER U (NE. electricity mix) 0.178 kg
Sheet rolling, aluminum/RER U (NE. electricity mix) 0.0692 kg
Filter Materials
Kraft paper, bleached, at plant/RER U (NE. electricity mix) 0.224 kg
Polyethylene, LDPE, granulate, at plant/RER U 0.057 kg
Process Extrusion, plastic film/RER U (NE. electricity mix) 0.056 kg
Secondary
package
Material Solid unbleached board, SUB, at plant/RER U (NE. electricity mix) 2.83 kg
Process Production of carton board boxes, offset printing, at plant/CH U (NE.
electricity mix) 2.35
kg
Transportation Transport, lorry 7.5-16t, EURO5/RER U 8.31 t-km
Transport, transoceanic freight ship/OCE U 5.05 t-km
Note: About 70% of the electricity in Vermont is supplied by the New England grid and Canada, in this study the New England grid is used as a proxy for
the electricity supply for the production of Polystyrene Pod.

30
3.3.1.1.1 Shell Production
The outer shell of Polystyrene Pod is made from a petroleum plastic composite of polystyrene (94.1%
in mass), polyethylene (4.3%) and ethylene-vinyl acetate copolymer (1.6%). The composite is
extruded, via a melt-down or spun-bounded process, into a continuous sheet that is then rolled and
shipped for thermoforming.
Polystyrene (PS)
PS is the most important raw material for Polystyrene Pod, making up 77.7% of each capsule by
mass. For the modeling of PS production, the expandable PS EcoInvent dataset was used. The
dataset was originally from the Eco-profiles of the European plastics industry (PlasticsEurope),
covering 21 European production sites which produce PS with suspension polymerization out of
benzene and ethylene (Hischier, 2010). Although the PS used for production of Polystyrene Pod
was produced in the United States, European based data were used. It is assumed that the
technology used in American production sites are similar to that used in Europe.
Polyethylene (PE)
PE is another important plastic material for Polystyrene Pod, in addition to the shell, PE also plays
roles in its lid and filter. For its wide-use as a packaging material, low-density polyethylene (LDPE)
was found in the material lists of all three coffee pods under investigation. LDPE is a thermoplastic
made from monomer ethylene with a density range from 0.910-0.940 g/cm3. For the modeling of
LDPE production, a pre-existing EcoInvent dataset for LDPE granulate production was used. The
data are also from Plastics Europe, representing 27 European production sites (Hischier, 2010).
Polystyrene Pod, Aluminum Pod and Biodegradable Pod contain LDPE from different origins
respectively, but the same dataset was used for their modeling, because the origins of the plastics
are uncertain.
Ethylene vinyl alcohol (EVOH)
EVOH is a copolymer of ethylene and vinyl alcohol, which is commonly used as an oxygen barrier
in food packaging (Premium Pack, 2017). The dataset used for EVA modeling is for ethylene-vinyl
acetate copolymer production process, which the only available dataset for EVA production. This
dataset represents the technology of producing EVA from ethylene and vinyl acetate by emulsion
polymerization (Hischier, 2007).
Processing
Two datasets were used for modeling the processes applied on the plastic composite to form the
shell. The plastic film extrusion dataset modeled the first stage where resin is extruded into a
continuous sheet. And dataset of thermoforming with calendering modeled the process in which
the sheet in formed into a pod shape. Both of the datasets were modified in terms of electricity mix,
from an original European mix into an American one.

31
3.3.1.1.2 Lid Production
The lid of Polystyrene Pod is produced from aluminum that undergoes sheet rolling process to
obtain an aluminum foil sheet. The sheet is coated with a heat-sealing adhesive on one surface, and
is printed with the brand name and logo of the relevant company on the other. A thin layer of sealant
is applied over the printing to protect the image. The sheet is then cut into the right shape and
dimensions to fit the capsules (Chayer & Kicak, 2015).
Primary Aluminum Production
The lid of Polystyrene Pod, as well as the shell and lid of Aluminum Pod, are produced out of
primary aluminum. Primary aluminum originates from bauxite, the ore from which aluminum oxide
compound, also known as alumina, is extracted. Then, the alumina is smelted into pure aluminum
metal. The modeling of primary aluminum production used the pre-existing EcoInvent primary
aluminum process dataset in SimaPro. This dataset includes input and output data of cast aluminum
ingot production, transportation of materials to the plant and the disposal of the wastes (Althaus,
2003).
Polyethylene Terephthalate (PET)
PET is used for the coating of the lid. An amorphous PET granulate production dataset from
EcoInvent was used for its modeling in this study. This dataset represents average data for the
production of amorphous PET out of ethylene glycol and purified terephthalic acid (Hischier, 2003).
Offset Printing Color
The logo of the coffee brand is printed on one surface of the lid via offset printing, the printing
color is also included in the system as one of the raw materials. This printing is applied on both
Polystyrene Pod and Biodegradable Pod. The printing ink is included in the model as one of the
materials and an EcoInvent dataset of 47.5% solvent offset printing color is used for its modeling.
The dataset includes material inputs (solvents, binders, pigments and fillers) and energy
consumption, but doesn’t include emission to air or water (Hischier, 2003).
Processing
In the analyzing model, three EcoInvent datasets were modified in electricity mix and employed to
model the processes applied upon the production of aluminum lid. In addition to the dataset of
aluminum sheet rolling, the datasets of rigid sheets calendering and plastic film extrusion were used
for the modeling of sheet coating processes. Note that die cutting is also one of the process that the
lid undergoes, but because of the absence of a pre-existing dataset and the information of power
consumption, the modeling of die cutting was not included in the system.
Both of the lid of Polystyrene Pod and Aluminum Pod are a piece of circular aluminum membrane
that covered by plastic film on each side. It is assumed that the production of both lid used the same

32
materials and underwent identical processes except for colored printing. However, the modeling of
Aluminum Pod used original EcoInvent datasets, as its production site locates in Orbe, Switzerland.
3.3.1.1.3 Filter Production
According to Chayer & Kicak (2015), the paper filter sealed inside a Polystyrene Pod is made from
abaca fiber, a natural plant fiber grown in Philippines and Ecuador. Since Philippines produces 83%
of global abaca (FAO, 2010), it is assumed that the filter in Polystyrene Pod uses Philippine abaca
fiber as raw material. After harvested in Philippines, the abaca is pulped and sent to the filter
production facility, which is assumed to be located in Lydney, UK. The process of production of
bleached kraft paper was used as a proxy for the wet laid process, which is similar to paper
production except that it is made from synthetic fibers blended with the natural fibers (EDANA,
2008). Thus, the processes for paper production would account for the abaca filter step. The
bleached kraft paper EcoInvent dataset was adapted to approximate the abaca portion of the filter
(Chayer & Kicak, 2015).
After abaca fiber is made into a continuous, thin sheet of filter material, it will be shipped to fluted
and cut into filter form. Heat-sealable abaca filter material is coated with a thin layer of PE around
the top of the filter, where it will be sealed onto the side of the outer hard shell. The processes used
to cut and attach the paper are still unknown (Chayer & Kicak, 2015). Therefore, only the process
of PE coating was included and modeled with a modified EcoInvent plastic film extrusion dataset.
3.3.1.1.4 Solid Unbleached Board Production
Solid unbleached board (SUB) box is used as the secondary package for Polystyrene Pod and
Biodegradable Pod product systems, but their mass varies because of different box sizes. SUB is
made mainly of unbleached chemical pulp. To achieve a white surface, it is coated with mineral
pigments (Stora Enso Renewable Packaging, 2013). The pre-existing SUB EcoInvent dataset used
for the modeling of the cardboard production, and another dataset of carton board boxes production
modeled the cutting, folding and printing of the boxes. Per kg of used cardboard, 0.83 kg of box
production module is needed (PRé Consultants, 2013). Both datasets origin from European
producers, and is used as European average data (Hischier, 2011). Since cardboard producers are
universally distributed, in this study, it is assumed that the cardboard was sourced from producers
that is close to the pod production sites, therefore the datasets were altered in the aspect of electricity
mix according to the locations of the coffee pods’ production sites.
3.3.1.2 Production of Aluminum Pod
The materials used for production of Aluminum Pod are aluminum, solid bleached board and a
small amount of petroleum plastics. The aluminum in Aluminum Pod was assumed to be 100%
primary aluminum produced from bauxite ores. But according to its producer, a small amount of
the pod is produced from recycled pods, and the number is possible to increase(Nestlé Nespresso
S.A., 2017). The assumption of primary aluminum fraction will undergo a sensitivity analysis to
evaluate its impact on results and conclusions. Aluminum could be found in both the shell and the

33
lid of Aluminum Pod, which underwent different processes before they were put together.
Aluminum for the shell was cut into the required dimensions and extruded into the right shape, and
then anodized for exterior coloring and corrosion prevention. On the other hand, treatments on the
aluminum lid were assumed to be identical as the lid of Polystyrene Pod, including aluminum sheet
rolling and plastic film coating, but offset printing was not applied on Aluminum Pod. The lid
production model, cardboard box production model, and plastic model have been introduced in
3.2.1.1.
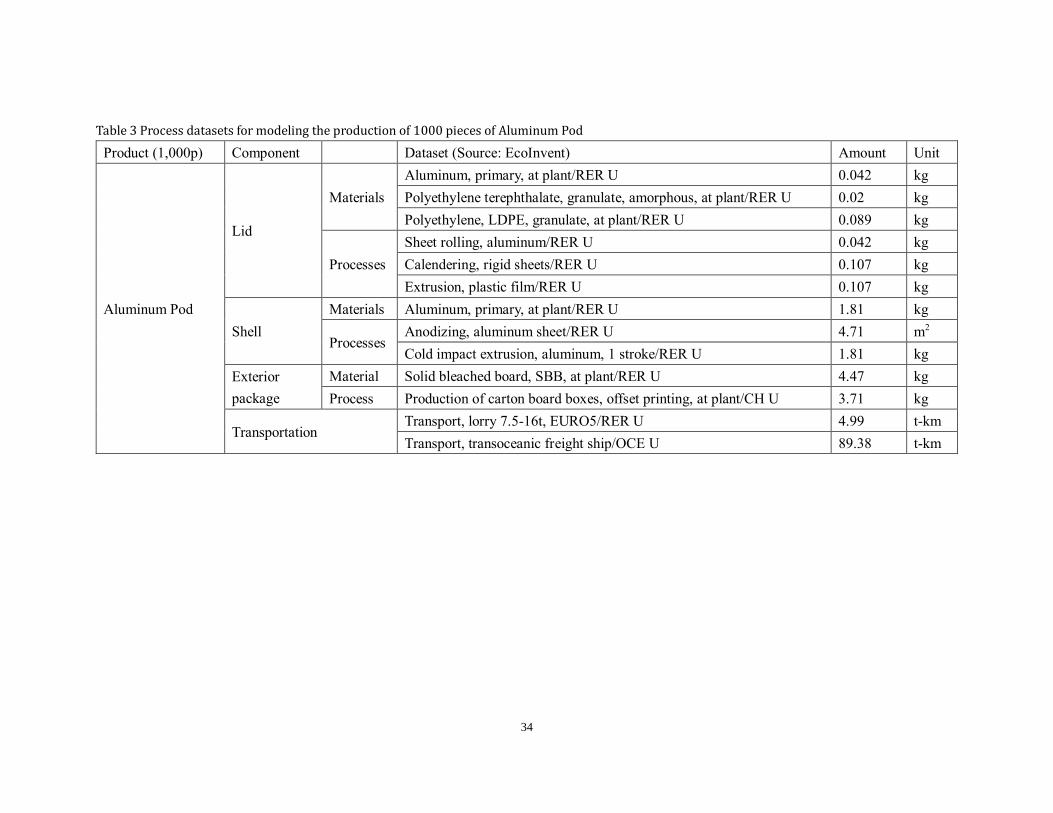
34
Table 3 Process datasets for modeling the production of 1000 pieces of Aluminum Pod
Product (1,000p) Component Dataset (Source: EcoInvent) Amount Unit
Aluminum Pod
Lid
Materials
Aluminum, primary, at plant/RER U 0.042 kg
Polyethylene terephthalate, granulate, amorphous, at plant/RER U 0.02 kg
Polyethylene, LDPE, granulate, at plant/RER U 0.089 kg
Processes
Sheet rolling, aluminum/RER U 0.042 kg
Calendering, rigid sheets/RER U 0.107 kg
Extrusion, plastic film/RER U 0.107 kg
Shell
Materials Aluminum, primary, at plant/RER U 1.81 kg
Processes Anodizing, aluminum sheet/RER U 4.71 m2
Cold impact extrusion, aluminum, 1 stroke/RER U 1.81 kg
Exterior
package
Material Solid bleached board, SBB, at plant/RER U 4.47 kg
Process Production of carton board boxes, offset printing, at plant/CH U 3.71 kg
Transportation Transport, lorry 7.5-16t, EURO5/RER U 4.99 t-km
Transport, transoceanic freight ship/OCE U 89.38 t-km

35
3.3.1.2.1 Shell Processing
Extrusion Shaping
Impact extrusion is a type of specialty cold forming used for larger parts with hollow cores and thin
wall thickness (Metal Forming Industries, 2017). A one-stroke cold impact extrusion is used to
approximate the shaping process of the aluminum shell. The 1-stroke cold impact extrusion dataset
from EcoInvent is used for the modeling of the extrusion shaping process. This dataset encompasses
the electricity consumption of the machine as well as common pre- and post-treatments.
Furthermore, machine as well as factory infrastructure and operation are considered as well (Steiner,
2007). The aluminum loss during the extrusion process is unclear in the dataset, it is assumed that
such loss is insignificant in this study.
Anodizing
Anodizing is the procedure to increase corrosion resistance and allow dyeing on the surface of
aluminum alloys (Davis, 1993). The anodizing dataset used in this study is from EcoInvent, which
includes mechanical surface treatment, degreasing, pickling, anodizing and sealing processes.
3.3.1.2.2 Solid Bleached Board Production
Another character that distinguishes packaging system of Aluminum Pod from the other two is the
use of solid bleached board (SBB) box instead of solid unbleached board box. SBB is a virgin fiber
grade of paperboard, which is made purely from bleached chemical pulp and usually has a mineral
or synthetic pigment (Stora Enso Renewable Packaging, 2013). The modeling of SBB production
used pre-existing European based EcoInvent dataset.
3.3.1.3 Production of Biodegradable Pod
The use of bio-based polylactic acid (PLA) as a substitution petroleum plastic is a significant
difference between Biodegradable Pod and traditional coffee pods similar to Polystyrene Pod. The
materials that make up Biodegradable Pod are a composite of coffee chaff and plant-based resins
which formed the ring, PLA which made up the filter, and PLA coated kraft paper which making
up the lid (NZWC, 2017). Injection molding is applied to shape the composite into the ring. The
coffee pod is wrapped by a polyethylene bag to avoid direct exposure to air and light, before it is
put into a cardboard box. Based on the appearance of the inner side of the cardboard box, the box
for Biodegradable Pod was made of solid unbleached box, which is different from the box of
Polystyrene Pod and Aluminum Pod. But the process that fold and print the box is the same as those
for the other two pods.
Note that the datasets used for the Biodegradable Pod model were modified by replacing the
European electricity mix with an Ontario mix to adapt to the situation that Biodegradable Pod is
produced in Ontario, Canada. The Ontario’s electricity grid mix will be introduced in a later part
of this chapter.

36
Table 4 Process datasets for modeling the production of Biodegradable Pod
Product (1,000p) Component Dataset (Source: EcoInvent) Amount Unit
Biodegradable Pod
Lid
Materials Kraft paper, unbleached, at plant/RER U (ON. electricity mix) 0.288 kg
Polylactide, granulate, at plant/GLO U 0.033 kg
Processes Extrusion, plastic film/RER U (ON. electricity mix) 0.032 kg
Calendering, rigid sheets/RER U (ON. electricity mix) 0.032 kg
Ring Material Polylactide, granulate, at plant/GLO U 1.82 kg
Process Injection molding/RER U 2.28 kg
Mesh Material Polylactide, granulate, at plant/GLO U 0.25 kg
Process Extrusion, plastic film/RER U (ON. electricity mix) 0.24 kg
Plastic wrap Material Polyethylene, LDPE, granulate, at plant/RER U 1.26 kg
Process Thermoforming, with calendering/RER U (ON. electricity mix) 1.23 kg
Secondary
package
Material Solid unbleached board, SBB, at plant/RER U (ON. electricity mix) 4.95 kg
Process Production of carton board boxes, offset printing, at plant/CH U (ON.
electricity mix) 4.11
kg
Transportation Transport, lorry 7.5-16t, EURO5/RER U 4.16 t-km
The Biodegradable Pod is produced in Ontario; therefore, the datasets were modified by replacing the original electricity input with an Ontario
electricity grid mix.

37
3.3.1.3.1 Ring Production
Based on the technology developed by the University of Guelph, the bioplastic ring of
Biodegradable Pod is made from a composite of coffee chaff and plant-based resins, and may
contain other additional additives, such as reinforcing agents and/or compatibilizers (Mohanty,
Misra, Rodriguez-Uribe, & Vivekanandhan, 2015). The plant-based resins that mixed with coffee
chaff are not disclosed, but are assumed to be PLA based. The name and mass of additional
additives are also unknown. It is assumed that PLA and coffee chaff dominate the fraction of the
composite by weigh, and the environmental effects of the additives are insignificant.
Polylactic Acid (PLA)
PLA is produced from lactic acid by ring-opening polymerization through the lactide intermediate
(Datzel & Krüger, 2006). In this study, PLA production is modeled with the polylactide granulate
production dataset in EcoInvent database. The dataset is based on data from the world largest PLA
plant which uses corn starch as raw material. The inventories include the LCI data from the report
of the producer NatureWorks (Stettler, 2007). The dataset covers corn growing, corn wet milling,
lactic acid production as well as lactide and polylactide production.
Coffee chaff
Coffee chaff, the outer shin of a coffee bean, is usually a waste product of the roasting process of
coffee beans (The Roasterie, 2013). Coffee chaff is mixed with PLA resins to form the ring of
Biodegradable Pod, making up 20% of the ring by mass. It is claimed to reduce the consumption
of PLA and increase toughness and heat distortion temperature. For the production of 1,000 pieces
of Biodegradable Pod, 0.29 kg of coffee chaff is used. Since coffee chaff is a waste product from
the coffee bean roasting process without an economic value, it was not included in the life cycle
assessment model as a raw material according to the economic value based allocation method
Injection molding
Injection molding is the processing technology used for the formation of bioplastic composite ring.
The EcoInvent database provides the only injection molding process dataset in SimaPro. It is
assumed that the technology used in the ring production site matches the one in the dataset.
3.3.1.3.2 Lid Production
Unlike Polystyrene Pod and Aluminum Pod, which have an aluminum lid, the lid of Biodegradable
Pod is a kraft paper sheet coated with a transparent PLA film on one surface, and is printed with
the brand name and logo on the other. The PLA film is produced via an extrusion process and stick
onto the kraft paper sheet via calendering. The sheet is cut into the right shape and dimensions to
fit the base ring. The modeling of extrusion, calendering and offset printing are similar to those in
the model of Polystyrene Pod, except that they use an Ontario electricity mix instead of an
American one.
Kraft paper
38
Kraft paper is produced from sulfuric pulp, which is stronger than that made by other pulping
processes. Bleaching is commonly used for kraft paper production to attain white color (Paper
Shipping Sack Manufactures Association, 2017), but the original color of the unprinted area shows
that the lid is made from unbleached kraft paper. A modified EcoInvent dataset for unbleached kraft
paper production is used in the analyzing model. The module includes the European production of
unbleached kraft paper in an integrated mill – including transports to paper mill, wood handling,
chemical pulping, paper production, energy production on-site and internal waste water treatment.
To fit into the Canadian production context, the unbleached kraft paper dataset uses an Ontario
electricity mix instead of the original European mix.
3.3.1.3.3 Filter Production
The filter of Biodegradable Pod is a PLA mesh according to the information disclosed by the
National Zero Waste Council (NZWC, 2017). Plastic film extrusion is assumed to be the processing
method applied to form the mesh. Both of the modeling of PLA production and extrusion process
have been introduced in this chapter (3.2.1.3.1 and 3.2.1.1.1), except that the extrusion modeling
dataset is modified with an Ontario electricity mix.
3.3.1.3.4 Plastic Warp
Unlike Polystyrene Pod and Aluminum Pod, which are air-tight with their sealed shell and lid,
Biodegradable Pod doesn’t have a shell that blocks air and sunlight and keeps the coffee fresh.
Therefore, Biodegradable Pod needs an extra plastic warp to ensure air-tightness. The plastic wrap
is made from LDPE and underwent a thermoforming process with calendering. The modeling of
LDPE production and thermoforming process are the same as those in Polystyrene Pod (3.2.1.1.1),
except the electricity mix use. After use, the PE wrapping bag is landfilled in the end-of-life
scenario.
3.3.1.4 Transportation
Transportation data used in this study are based on existing LCA studies of coffee pods (Chayer &
Kicak, 2015; Dubois et al., 2011) and estimations. Transportation distance was calculated in
kilometers (km), after the transportation distance was multiplied by material mass, their results
were entered in the models in ton-kilometer (t-km).
Chayer & Kicak (2015) provided cradle-to-gate transportation data of Polystyrene Pod, which
includes the abaca fiber transportation from farm to processing site and transportation of all
components from suppliers to Polystyrene Pod production site. Both road transport and marine
transport were calculated. But transportations from producer to retailer, from retailer to end-user
and waste collection were not included (Chayer & Kicak, 2015). In this study, all the coffee pods
are assumed to be transported from production sites to Toronto, Ontario for retail and consumption.
The road transport distance from Polystyrene Pod’s production site in Waterbury, Vermont is 730
kilometers. It is assumed that waste collection trucks travel 50 km to deliver waste to the treatment
sites. There are 8.31 t-km road transport and 5.05 t-km marine transport for the life cycle of 1,000
pieces of Polystyrene Pod in total.

39
Transportation data of Aluminum Pod was calculated based on assumptions and information
provided in Dubois et al., (2011). It is assumed that all packaging materials used for Aluminum Pod
were produced in Switzerland and transported by truck for 100 km on average from material
production site to the pod manufacture site. Dubois et al., (2011) suggested that the empty pod is
transported for 250 km from the manufacture site to the filling center in Orbe, Switzerland, where
the finished product will be distributed for retail (Nestlé Nespresso S.A., 2015). To transport form
Orbe to Toronto, coffee pods will be trucked to Marseille, France, then shipped to Toronto in a
transoceanic freight ship. The accumulated transportation value is 4.7 t-km road transport and 89
t-km marine transport.
Table 5 Material transportation distance of Aluminum Pod
Material Route Transport mode Distance (km)
Aluminum and
plastics
Material production
site to pod
manufacture site
Truck (7.5-16t) 100
Empty pod Pod manufacture site
to filling center
Truck (7.5-16t) 250
Solid bleached board Material production
site to filling center
Truck (7.5-16t) 100
Finished product Orbe, Switzerland to
Marseille, France
Truck (7.5-16t) 550
Finished product Marseille, France to
Toronto, Canada
Transoceanic freight
ship
13,900
Transportation data of Biodegradable Pod is based on the assumption and estimation. PLA was
assumed to be supplied by NatureWorks, a major vender of PLA located in Blair, Nebraska, the
USA. Cardboard and kraft paper were assumed to be produced in a paper mill in southern Ontario.
LDPE was assumed to be sourced from a plastic producer in Ontario. Biodegradable Pod is
manufactured and packaged in Toronto, the transportation distance from manufacturer to retail is
assumed to be small and insignificant. Total transportation value for Biodegradable Pod is 4.3t-km
route transport, marine transport was not identified.
Table 6 Material transportation of Biodegradable Pod
Material Route Transport mode Distance (km)
PLA Blair, Nebraska, USA
to Toronto, Canada
Truck (7.5-16t) 1,600
Kraft paper and
cardboard
Material production
site to pod
manufacture site
Truck (7.5-16t) 50
LDPE Material production
site to pod
manufacture site
Truck (7.5-16t) 250

40
3.3.1.5 Electricity Generation
Electricity is an important source of energy for most, if not all, of the industrial processes. The
generation mix of electricity consumed in any stage in the life cycle of a product, process, or
industrial sector has a significant effect on the associated inventory of emissions and environmental
effects because of large differences in the power generation method used (Marriott, Matthews, &
Hendrickson, 2010).
Polystyrene Pod is produced in Waterbury, Vermont, USA. About 70% of the electricity in Vermont
is supplied by the New England grid and Canada (U.S. Energy Information Administration, 2017).
To simulate the context of Vermont, the New England electricity generation mix dataset was built
according to the information provided by ISO New England (2016).
Table 7 Vermont electricity generation mix by fuel type (ISO New England, 2016)
Gas Nuclear Hydro Waste Wood Coal Wind
49% 31% 7% 3% 3% 2.4% 2.4%
Based on the 2016 Yearly Energy Output by Fuel Type of Ontario data provided by the Independent
Electricity System Operator (ISIE), an Ontario medium voltage electricity mix dataset was created
to simulate Ontario’s electricity generation status. This electricity mix dataset is used to modify the
EcoInvent datasets associated with the Ontario-based production of Biodegradable Pod, except for
PLA production.
Table 8 Ontario electricity generation mix by fuel type (IESO, 2017)
Nuclear Hydro Gas/Oil Wind Biofuel Solar
61% 24% 9% 6% <1% <1%
Datasets associated with the production of Aluminum Pod used the original electricity mix in the
module as they occurred in Europe. Most of them used the UCTE mix, which represents the average
electricity mix consumed in Western Europe through the highly interconnected electricity grid
(Dubois et al., 2011).
3.3.2 End-of-Life Scenarios
Because of the different packaging materials, each of the coffee pods is designed for different EOL
management methods. To be specific, Polystyrene Pod does not have any option other than
landfilling, a portion of Aluminum Pod is recycled, the remained is landfilled, while a portion of
Biodegradable Pod is composted, the remained is landfill. However, in present situation, not all of
these coffee pods go through their ideal EOL route. To estimate the environmental impacts
associated with the EOL management of the coffee pods, EOL scenarios were created for each pod
format, according to baseline diversion rates.

41
A landfilling scenario was built up for Polystyrene Pod. In this scenario, all used pods are thrown
into waste bin after brewing, with the coffee waste inside. The used coffee pod is then sent to a
landfill together with other solid waste. Because there is only one fully operational in Ontario
(Carter- Whitney, 2007), which is serving a small proportion of the population and processing a
small amount of wastes, incineration is not considered as an available waste management option in
Ontario and is not included in the EOL scenarios of the coffee pods.
A recycling scenario is applicable to Aluminum Pod, in which the aluminum pod is opened, and
ground coffee is taken away from the pod, so that the aluminum alloy can be thrown to the blue bin
to recycle. In additional to disassembling the pod by the customers, the producer of Aluminum Pod
provides used pod collection service to their customers. They can bring the used pods back to the
retailer shops, and recycling companies will finish the sorting and recycling. Assumption is that
sorting either by consumers or by recyclers creates equal amount of environmental impacts. It is
assumed that Aluminum Pod has 14% recycling rate in Ontario. The recycling rate of Aluminum
Pod is converted as 14% of the aluminum in 1,000 pieces Aluminum Pod will be recycled in the
EOL scenario.
A composting scenario is applicable to Biodegradable Pod. In this scenario, Biodegradable Pod is
thrown into household green bin for organic waste and collected by curbside organic waste
collection truck, and sent to an industrial composting facility with the ground coffee inside. In a
composting facility, the coffee pod is treated along with other organic wastes. It is claimed that the
coffee pod could be turn into usable compost in 12 weeks in a well-managed facility (Club Coffee,
2017). Biodegradable Pod is assumed to go through an aerobic composting progress as part of the
municipal organic waste. But the LDPE wrap of Biodegradable Pod will be landfilled. According
to the information disclosed in Waste-Free Ontario Act, Ontario currently has an organic diversion
rate at about 40% (Ontario Ministry of Environment and Climate Change, 2016), therefore, it is
assumed that 40% of used Biodegradable Pods are diverted and composted.
Although single-serve pods could be landfilled, recycled or composted, the exterior packaging box
was assumed to be recycled at a rate representing the average North American residential rate,
while the rest is landfilled. A recycling rate of 62.5% was used to represent cardboard based on
average US and Canadian rates (EPA, 2011). Notably, the coffee ground is still excluded from the
EOL stage of the LCA analysis. Table 9 shows detailed EOL treatments for each component of the
investigated products.
Table 9 End-of-life scenarios for coffee pods
Product Material EOL treatment Diversion rate
Polystyrene
Pod
Plastics
Landfilled 0% Aluminum alloy
Filter paper
Solid unbleached board Recycled 62.5%

42
Aluminum
Pod
Aluminum alloy Recycled 14%
Plastics Landfilled 0%
Solid bleached board Recycled 62.5%
Biodegradable
Pod
PLA
Composted 40% Coffee chaff
Paper
LDPE warp Landfilled 0%
Solid unbleached board Recycled 62.5%
The modeling of waste landfilling used a pre-existing municipal solid waste dataset with 22.9%
waste disposal to sanitary landfill in EcoInvent. This dataset includes waste-specific short-term
emissions to air via landfill gas incineration and landfill leachate, burdens from treatment of short-
term leachate in wastewater treatment plant and long-term emissions from landfill to groundwater
(EcoInvent, 2003).
The recycling of packaging materials is analyzed using the system expansion principle, in which
all avoided burden is credited as a function of recycling. System expansion is a method used to
avoid coproduct allocation by expanding the boundary of the system investigated to include the
alternative production of exported functions (Humbert, Rossi, Margni, Jolliet, & Loerincik, 2009).
In any EOL scenario, solid paper board, either bleached or unbleached, has a recycling rate of
62.5%, which means 1.46kg, 2.31 and 2.554kg of solid paper board input is avoided in the
production on 1,000 pieces of Polystyrene Pod, Aluminum Pod and Biodegradable Pod,
respectively. While in the recycling scenario, 0.24kg of primary aluminum input is avoided in the
production of 1,000 pieces of Aluminum Pod, based on the 14% recycling rate.
3.3.2.1 Composting Model
Different composting facilities in Ontario use different composting technology, for example
anaerobic composting that produce methane in addition to compost is available for residences in
Toronto, while composting facilities in Hamilton and Guelph use aerobic composting technology
(Toronto Environmental Alliance, 2017; City of Guelph, 2017; AIM Environmental Group, 2006).
According to the certification information disclosed by BPI, the Biodegradable Pod is certified to
be aerobically compostable based on the ASTM D6868 Standard (BPI, 2016). Therefore, only
aerobic composting is considered as composting option for Biodegradable Pod waste. The
composting process is modeled as those happen in an aerobic composting with a windrow
composting system, based on a secondary life cycle inventory (LCI) of municipal solid waste
windrow composting in the US (Komilis & Ham, 2004).
Komilis & Ham (2004) built up an LCI for low quality and high quality MSW composting facility
and yard waste composting facility respectively. A low quality MSW composting facility is
characterized by undergoing a short (4 weeks) composting period and producing a final product

43
that can be used as landfill cover or can be directly landfilled in a “zero emission” landfill. While
on the other hand, it takes a high-quality composting facility (HQCF) 8 weeks for composting stage
and another 4 weeks for curing stage to produce compost for use as a soil amendment. And a yard
waste composting facility only accepts yard waste and also produces compost as a soil amendment
product (Komilis & Ham, 2004).
The 12-week composting procedure in a HQCF is assumed to be the procedure Biodegradable Pod
waste undergoes. This assumption is based on that fact that the 12-week timeframe meets the time
requirement claimed by the producer of Biodegradable Pod, and is the same as that in the
composting facilities in Guelph and Hamilton (City of Guelph, 2017; AIM Environmental Group,
2006).
Figure 7 Flow diagram for high quality composting facility
In such composting facility, organic waste diverted from source is first shredded by a hammermill
before being sent to the enclosed composting pad. Inside the pad, the composting pile will go
through an 8-week composting stage, and will be turned over 3 times a week, an odor control
system will run 24 hours / day to draw odor from the enclosed pad. Composting stage is followed
by a 4-week curing stage, after which the compost will go through a trammel screen to filter out
the remained solid waste from final compost product. Approximately, 1 wet t of organic waste will
produce 0.8 t of wet compost product (Komilis & Ham, 2004). Diesel is used as the fuel for front

44
end loader and windrow turner, and electricity is powering the hammermill, odor control and
trammel screen. Table 10 indicates the life cycle input and output of composting 1 t of organic
waste in a high-quality composting facility. Carbon dioxide and ammonia generated during
decomposition is the main environmental output.
Table 10 Life Cycle Inventory (LCI) for High-quality Composting
Materials Input/output Value
Energy Input
Diesel (L/t) Input 2.2
Electricity (kWh/t) Input 76
Emission to air (kg/t)
PMtotal Output 6.0E-02
NOX Output 2.9E-01
HC (non CH4) Output 5.9E-02
SOx Output 3.1E-01
CO Output 1.2E-01
CO2 biomass Output 3.9E+02
CO2 fossil Output 3.7E+01
NH3 Output 5.0E-01
Pb Output 2.8E-09
CH4 Output 2.3E-04
HCl Output 3.0E-07
Emission to water (kg/t)
Dissolved solids Output 2.6E-02
Total suspended solids Output 2.4E-05
BOD5 Output 2.6E-05
COD Output 1.3E-04
Oil Output 3.3E-04
H2SO4 Output 2.5E-02
Fe Output 6.3E-03
NH3 Output 3.6E-06
Cr Output 6.9E-09
Pb Output 3.8E-09
Zn Output 5.7E-08
Solid waste (miscellaneous) Output 4.3E+00
Compost is widely used in gardening and agriculture for soil amendment. Because the chemical
composition of compost depends heavily on the organic waste source, compost is usually mixed
with chemical fertilizers to ensure the agronomic performance, but in general, the use of compost
could significantly reduce the use of chemical fertilizer (Baldi et al., 2010; Jayathilake & Fernando,

45
2016). To evaluate the environmental benefits of the compost final product from Biodegradable
Pod composting, the compost production is credited as avoided ammonium nitrate phosphate as N
source for crops. It is assumed that 1kg of compost is capable of replace 0.8 kg of ammonium
nitrate phosphate fertilizer.
3.4 Life Cycle Impact Categories
A midpoint oriented LCIA methodology, the Tool for the Reduction and Assessment of Chemical
and other environmental Impacts (TRACI 2 v 4.00), was used in this study to convert the input and
output data into environmental performance indicators and impact categories. The TRACI 2
methodology was developed by the U.S. Environmental Protection Agency specifically for the USA
using input parameters consistent with U.S. locations (Bare, 2011). Since this study is conducted
in Ontario, which has similar environmental and geographic situations with the U.S., and in terms
of environment and technology, the method is used here. Other commonly used methods, such as
CML 2001 and Eco-Indicator, are based on European conditions. TRACI 2 involves eight impact
categories (table 11), but it does not apply normalization or weighting which are important to
understand better the relative magnitude for each indicator result (ISO, 2006)
Table 11 Impact categories in TRACI 2 methodology
In order to provide further insight into the impact potential, a second method was employed that
incorporates normalization and weighting. ReCiPe is an LCIA method that integrate ‘problem
oriented approach’ and ‘damage oriented approach’, and has both midpoint and endpoint impact
categories. The midpoint characterization factors are multiplied by damage factors, to obtain the
endpoint characterization values. Listed in Table 12 are 18 midpoint impact categories and 3
endpoint categories that are addressed in ReCiPe. (PRé Consultants, 2014)
Table 12 Midpoint and Endpoint impact categories in ReCiPe
Midpoint level
Impact category Unit
Ozone depletion year/kg CFC-11 eq.
Impact category Unit
Ozone depletion kg CFC-11 equivalent (ep.)
Global warming kg CO2 eq.
Smog kg O3 eq.
Acidification mol H+ eq.
Eutrophication kg N eq.
Carcinogenics Comparative Toxic Unites for human (CTUh)
Non carcinogenics CTUh
Respiratory effects kg Particulate Matter (PM) 10 eq.
Ecotoxicity Comparative Toxic Unites for environment (CTUe)

46
Human toxicity and ecotoxicity yr/kg 1,4- dichlorobenzeen (14DCB)
Radiation yr/kg Uranium 235 eq.
Photochemical oxidant formation yr/kg Non-methane volatile organic compound
Particulate matter formation yr/kg PM10 eq.
Climate change yr/kg CO2 eq.
Agricultural and urban land occupation m2.yr
Natural land transformation m2.yr
Marine eutrophication yr/kg N to freshwater eq.
Freshwater eutrophication yr/kg P to freshwater eq.
Fossil fuel and minerals depletion kg oil eq.
Minerals depletion kg Iron (Fe) eq.
Freshwater depletion m3
Endpoint level
Impact category Unit
Human Health years
Ecosystems years
Resources surplus costs 2000US$
In the current research, ReCiPe version 1.0.6 method was employed with a normalization/weighting
set of World ReCiPe E/A, referring to the normalization values of the world with the average
weighting set (PRé Consultants, 2013). The environmental effects of the coffee pods are presented
in midpoint impact categories. Their weighting results are converted into a single score for each
pod system, which enables easy comparison between different systems and expresses the relative
importance of the impact categories. But the score is prone to subjectivity, since the chosen
weighting factors can influence the results.

47
Results
This chapter shows the cradle-to-grave LCA results for the reference unit of 1,000 pieces of each
coffee pod formats. Polystyrene Pod refers to the petroleum-based plastic pod, Aluminum Pod is
the aluminum pod, and Biodegradable Pod is made from biobased polymers.
Overall LCA results generated by TRACI 2 and ReCiPe methods are both presented, in order to
make a more comprehensive comparison between the three systems. The global warming potential
(GWP) impact category is broken down to identify the main source of greenhouse gases (GHG).
Although coffee bean cultivation and roasting processes are excluded from the system boundary,
but different packaging formats provide the used coffee ground with different EOL management
approaches. A second comparison between the packaging systems was conducted with a
consideration of used coffee grounds into the waste management scenarios.
In the last section of the chapter, a series of sensitivity analyses were conducted on primary
aluminum fraction in Aluminum Pod and the EOL scenarios to evaluate how these assumptions
impact the LCA results.
4.1 Overall LCIA Results
4.1.1 Characterization Results from TRACI 2
Figure 8 shows the comparison on the characterization results generated by TRACI 2 method. The
highest value in each environmental impact category is presented as 100%, and the lower values in
that category are presented as percentages corresponding to the highest value. According to Figure
8, Aluminum Pod has the highest value in all of the environmental impact categories, whereas
Polystyrene Pod and Biodegradable Pod have similar values in most categories except for ozone
depletion. It indicates that the Aluminum Pod has potential to create relatively higher effects in all
the considered impact categories. The difference is the greatest in carcinogenics, in which
Aluminum Pod has a value ten times as high as Biodegradable Pod’s. While comparing Polystyrene
Pod and Biodegradable Pod, the biobased polymer pod performs better in the impact categories of
global warming, smog, acidification, and respiratory effects, but worse in the others.
In the following paragraphs, the characterization results of each pod will be broken down by life
cycle stages.

48
Figure 8 Characterization result comparison between the three pod formats. The highest indicator
value in each impact category is presented as 100%, the others are presented as a fraction of it.
Figure 9 Characterization results of Polystyrene Pod. In each impact category, the percentages
represent the fraction of the emissions generated from each life cycle stage relative to the total
0%10%20%30%40%50%60%70%80%90%
100%
Polystyrene Pod Aluminum Pod Biodegradable Pod
50%
76%87% 79%
23%
90% 81% 87%74%
37%
22%15% 31%
6%
10% 26%28%
17%
27% 9%17% 8%
1%
0%4%
6%
1%
-14% -6%-19% -18%
69%
-1%-11%
-21%
8%
-20%
0%
20%
40%
60%
80%
100%
120%
Material Production Transportation End of life
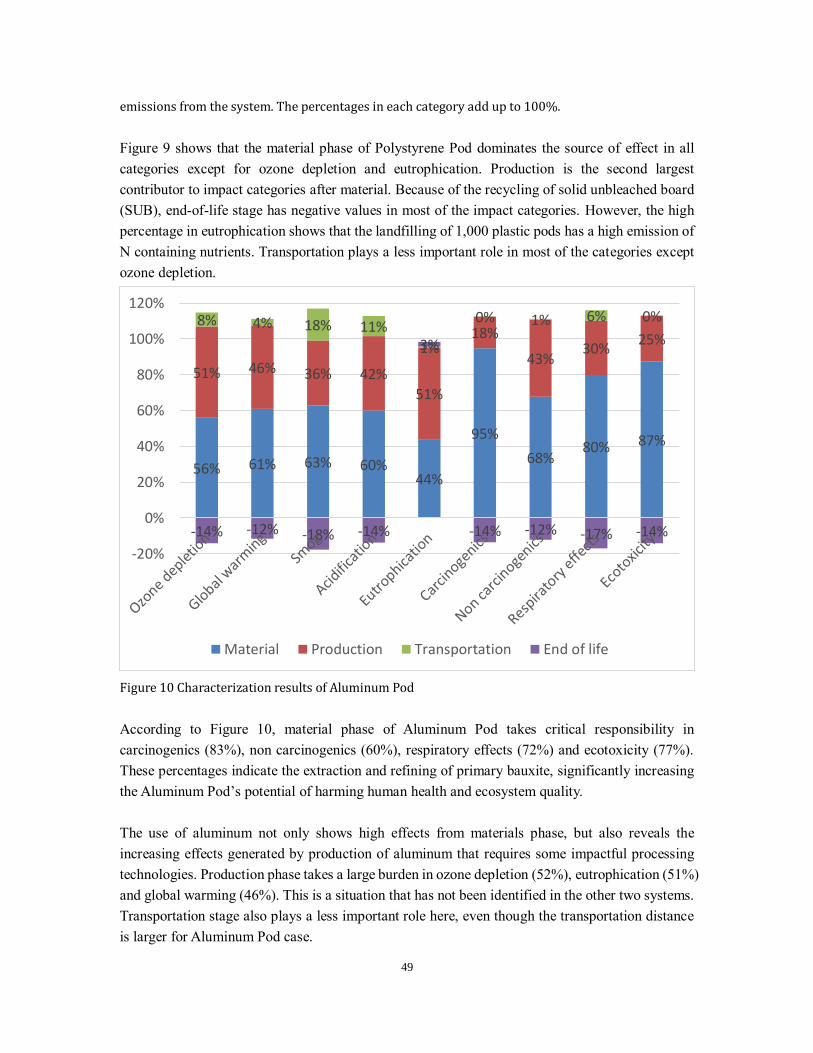
49
emissions from the system. The percentages in each category add up to 100%.
Figure 9 shows that the material phase of Polystyrene Pod dominates the source of effect in all
categories except for ozone depletion and eutrophication. Production is the second largest
contributor to impact categories after material. Because of the recycling of solid unbleached board
(SUB), end-of-life stage has negative values in most of the impact categories. However, the high
percentage in eutrophication shows that the landfilling of 1,000 plastic pods has a high emission of
N containing nutrients. Transportation plays a less important role in most of the categories except
ozone depletion.
Figure 10 Characterization results of Aluminum Pod
According to Figure 10, material phase of Aluminum Pod takes critical responsibility in
carcinogenics (83%), non carcinogenics (60%), respiratory effects (72%) and ecotoxicity (77%).
These percentages indicate the extraction and refining of primary bauxite, significantly increasing
the Aluminum Pod’s potential of harming human health and ecosystem quality.
The use of aluminum not only shows high effects from materials phase, but also reveals the
increasing effects generated by production of aluminum that requires some impactful processing
technologies. Production phase takes a large burden in ozone depletion (52%), eutrophication (51%)
and global warming (46%). This is a situation that has not been identified in the other two systems.
Transportation stage also plays a less important role here, even though the transportation distance
is larger for Aluminum Pod case.
56% 61% 63% 60%44%
95%
68%80% 87%
51% 46% 36% 42%
51%
18%
43%30%
25%8% 4% 18% 11%
1%
0% 1% 6% 0%
-14% -12% -18% -14%
3%
-14% -12% -17% -14%
-20%
0%
20%
40%
60%
80%
100%
120%
Material Production Transportation End of life

50
Figure 11 Life cycle analysis results of Biodegradable Pod
Based on Figure 11, production dominates the ozone depletion category. Material phase, more
specifically, the production of PLA, is responsible for more than 50% of the effect for the rest of
the impact categories. Similar to Polystyrene Pod, the EOL phase plays an important role in
eutrophication effect. It shows that the decomposition of nitrogen-rich organic waste, either
happening in a landfill or a composting facility, could increase the risk of aquatic eutrophication.
4.1.2 Weighting Results from ReCiPe
Although Aluminum Pod has high indicator values compared with those of Polystyrene Pod and
Biodegradable Pod (see Figure 8), and some of their differences are large, the importance of these
effects cannot be illustrated by the characterization results. Therefore, the weighting results,
generated by ReCiPe LCIA method with a world average weighting set, was added up and
presented as single score to show the importance of potential effects from the coffee pod systems.
39%
98% 93% 52%
60%76%
100%
75%
68%
24% 30%
5%
11%23%
30%
13%4%
7%3%
0%
0%1%
3%
1%
-10%-33% -27%
32%
7%
-14%-36%
7%
-40%
-20%
0%
20%
40%
60%
80%
100%
Material Production Transportation End of life

51
Figure 12 Weighting results generated by ReCiPe in midpoint impact categories.
In the weighting results, three impact categories are of higher importance than the others, namely
human toxicity, climate change and fossil depletion. The smaller weighting results of other
indicators show that although the difference of the analyzed systems in these indicators may be
large, but the indicator values themselves are too small to create significant effects.
Comparing the weighting results of the coffee pods, Aluminum Pod still has the highest total score,
Polystyrene Pod and Biodegradable Pod have similar score and shared patterns in weighting results.
The comparison is consistent with the characterization results from TRACI 2. Among all 17 impact
categories, human toxicity has made the most significant contribution to the total scores. Human
toxicity in ReCiPe aggregates carcinogenics and non-carcinogenics emissions (National Institute
for Public Health and the Environment of Netherlands, 2011). The difference of the three systems
is also great in human toxicity. This disparity is in line with the characterization results. Another
important category identified in weighting is climate change, which will be broken down and
discussed in detailed in the following section. Fossil depletion is a category with high indicator
value in ReCiPe that failed to be evaluated in TRACI 2. ReCiPe identified the largest fossil
depletion in Aluminum Pod, followed by Polystyrene Pod, with the smallest in Biodegradable Pod.
4.2 Global Warming Potential
Figure 13 shows the life cycle assessment results for the global warming potential (GWP) of the
0.
2.
4.
6.
8.
10.
12.
14.
Polystyrene Pod Aluminum Pod BiodegradablePod
Pt.
Fossil depletion
Metal depletion
Natural land transformation
Urban land occupation
Agricultural land occupation
Marine ecotoxicity
Freshwater ecotoxicity
Terrestrial ecotoxicity
Freshwater eutrophication
Terrestrial acidification
Climate change Ecosystems
Ionising radiation
Particulate matter formation
Photochemical oxidant formation
Human toxicity
Ozone depletion
Climate change Human Health

52
three coffee pod packaging systems, in the unit of kg CO2 eq./ 1,000 pieces.
Figure 13 Global warming potential comparison
For all of the packaging systems, raw material extraction, being the major contributor, is responsible
for more than half of their global warming potential. The production phase, which includes shaping
and coloring, is the next important source of the greenhouse gas emission. The EOL stage has an
overall positive GWP output because of the credits of recycled materials and compost product.
Transportation, including transportation of raw materials to production site and transportation of
finished product to retailing shops, is relatively insignificant in Aluminum Pod and Biodegradable
Pod, but accounts for 7% of GWP for Polystyrene Pod.
In comparison, Biodegradable Pod has the lowest GWP, which is 14.34 kg CO2 eq./ 1,000 p, which
is 19% lower than Polystyrene Pod (17.73 kg CO2 eq./ 1,000p). Aluminum Pod, with a figure of
43.79 kg CO2 eq./ 1,000p, is the highest, 247% higher than Polystyrene Pod and 305% higher than
Biodegradable Pod. When the three coffee pods are compared by their life cycle stages, Aluminum
Pod not only has larger GHG emission in raw material extraction, but also significantly larger in
production stage than the other two pods.
The following part of this section will present detailed GWP results for each coffee pod, categorized
in components. In this way, the GWP hotspots will be revealed.
17.75
43.79
14.34
-10.00
0.00
10.00
20.00
30.00
40.00
50.00
Polystyrene Pod Aluminum Pod Biodegradable Pod
kg C
O2
eq.
Materials Production Transportation EOL

53
4.2.1 GWP of Polystyrene Pod
Figure 14 Global warming potential breakdown of Polystyrene Pod. Each column includes the GWP
from the materials and the production of one packaging component. EOL includes GWP from
transportation for waste collection, landfilling and credits from recycled materials.
Figure 14 shows the breakdown of global warming potential effect by different components and
processes involved in Pod # 1 system. It indicates that the major part of GHG comes from the
production of pod shell, which takes up half of the packaging system by mass. The polystyrene,
used as the main material of the shell, is responsible for 50% of the GHG emission. Whereas
shaping the shell, including extrusion and thermoforming, is responsible for another 16%. Another
important contributor is the use of solid unbleached board box as the secondary package, causing
19% of the total GWP, however, the recycling of solid unbleached board is effective in reducing
the burden of it.
17.75
8.90
0.34
Other plastics 0.12
0.46
0.35
0.82 2.40
0.94
2.80
Shaping 0.02
Shaping 0.16
1.53
Transportation0.06
0.35
(1.50)
-5
0
5
10
15
20
kg C
O2
eq
.
PS Other plastics Kraft paper Aluminum SUB
Box production Shaping Transportation Landfilling Recycled SUB

54
4.2.2 GWP of Aluminum Pod
Figure 15 Global warming potential breakdown of Aluminum Pod
Figure15 indicates that the aluminum shell of Aluminum Pod dominates the source of GHG
emissions, accounting for over 90% of total GWP. Half of the GHG emission is caused by the
extraction and refinery of bauxite to produce primary aluminum. Whereas anodizing, the
processing technology applied to prevent oxidation and to color the shell, also has a high emission
because of its high consumption of heat and electricity. The recycling of aluminum, at a 14%
recycling rate, does not have a major impact on reducing GWP. The secondary package, which used
solid bleached board, has higher emission than the unbleached board boxes in the other two systems.
Because aluminum is stable in a landfill environment, the GHG emission regarding landfilling is
notably lower in Aluminum Pod
43.59
21.50
Al 0.50
Plastics 0.24
17.60
1.47
Shaping 0.12
4.44
1.17
1.65 Transportation 0.05
(2.20)
(3.00)
Landfilling 0.05
-10
0
10
20
30
40
50
Shell Lid Secondarypackage
Transportation EOL Total
kg C
O2
eq
.
Aluminum Plastics Anodzing Shaping
SBB Box production Transportation Recycled SBB
Aluminum recycling Landfilling

55
4.2.3 GWP of Biodegradable Pod
Figure 16 Global warming potential breakdown of Biodegradable Pod
Figure 16 shows that PLA, as the most important packaging material, accounts for 44% of the total
GWP. The ring-based design of Biodegradable Pod has reduced the use of PLA, but it requires a
plastic wrap to prevent coffee oxidation. Being made from LDPE, the plastic wrap is responsible
for 19% of the total GWP. Biodegradable Pod has the heaviest secondary package box among the
three systems. But because solid unbleached board has a smaller GWP than bleached board per
kilogram (Hischier, 2010), the overall GWP associated with secondary package of Biodegradable
Pod is smaller than Aluminum Pod
From a component stand point, the base of a coffee pod, namely the shell of Polystyrene Pod and
Aluminum Pod, and the ring of Biodegradable Pod, is the most significant source of their GWP.
Both raw material extraction and production of this part carry heavy GWP burdens. Another GWP
hotspot is the secondary packaging box. Although an effective cardboard recycling system can
avoid a fraction of GWP from the cardboard box, the GWP associated with the cardboard box could
be much higher in areas without a sound recycling system.
14.32
5.44
0.75 PLA 0.10
Kraft paper 0.15
1.47
Shaping 0.01
Shaping 0.05
0.40
2.79
1.23
2.64 0.69 Transportation 0.08
Composting & landfill0.28
(1.74)
Compost product(0.02)
-5
0
5
10
15
20
kg C
O2
eq.
PLA Injection molding Kraft paper Shaping
SUB Box production LDPE Transportation
Composting & landfilling Recycled SUB Compost product

56
4.3 Effect of Coffee Ground EOL Approach
Although coffee bean cultivation and roasting are excluded from the system boundary, different
packaging formats provide the used coffee ground with different EOL management approaches.
Specifically, for the landfilling of Polystyrene Pod, coffee grounds contained inside will also end
up in landfill. For the 14% of Aluminum Pod, which are assumed to be recycled, their coffee ground
will be diverted from the pod to be composted, with the remaining being landfilled. As for
Biodegradable Pod, 40% will be composted with the pod, and 60% will be landfilled. Table 13
shows the total and diverted amount of coffee ground in each pod system. A second comparison
between the packaging systems was conducted with the consideration of used coffee grounds into
the waste scenarios. In the LCA model, coffee ground waste is simulated untreated wood waste
with 20% moisture.
Table 13 Total amount of coffee grounds in each pod and their EOL approaches (unit: kg/1,000 p)
Coffee pod # Total amount of coffee EOL approach Treated amount
Polystyrene
Pod 9.81
Landfilling 9.81
Aluminum Pod 12.92 Landfilling 11.11
Composting (14%) 1.81
Biodegradable
Pod 10.46
Landfilling 6.28
Composting (40%) 4.18
In Figure 17, the EOL scenario, from which coffee ground is excluded, is compare with the EOL
scenario that includes coffee ground in five impact categories. These five impact categories are
GWP, eutrophication, carcinogenics, non-carcinogenics, and ecotoxicity. They are identified to
have significant differences in overall LCA results when coffee waste is (not) considered in the
EOL stage of the coffee pods.
Except for global warming potential, the largest changes before and after coffee ground was
included in the EOL scenario are identified in Aluminum Pod. This can be explained by that
aluminum, as a mineral, does not reacts with microorganisms in the landfills, and has very small,
if there is any, emission. On the other hand, Biodegradable Pod has the smallest changes, which
illustrates that composting has smaller emissions than landfill in the listed impact categories. When
it comes to global warming potential, coffee landfilling is responsible for about 1.5 kg CO2 eq., this
is similar to another LCA study conducted on this format of coffee pod (Chayer & Kicak, 2015).
The smaller changes in Aluminum Pod and Biodegradable Pod are due to the credits from compost
product.

57
Figure 17 EOL stage contribution with and without coffee ground in five categories.

58
4.4 Sensitivity Analysis
The objective of the sensitivity check is to assesses the reliability of the final results and conclusions
by determining how they are affected by uncertainties in the data, allocation methods or calculation
of category indicator results (ISO, 2006). Sensitivity analyses were carried out to evaluate how the
LCA results would be influenced by three critical assumptions: the fraction of primary aluminum
contained in the aluminum of Aluminum Pod, the recycling rate of Aluminum Pod, and the
composting rate of Biodegradable Pod. As suggested by international practice standard, with the
assumption varied by ±25%, if the results have a change for more than ±10%, the changes will
be identified as significant (ISO, 2006).
4.4.1 Primary Aluminum Fraction of Aluminum Pod
The aluminum metal used in Aluminum Pod was assumed to be 100% primary aluminum in the
original model. For sensitivity analysis, a ratio of 75% was used for comparison. Table 14 shows
the comparison between original analysis results and the sensitivity analysis results.
Table 14 Sensitivity analysis results and percentages of change for primary aluminum fraction of
Aluminum Pod
Impact category Unit Original
(100% primary)
Variation
(75% primary,
25% secondary)
Change
Ozone depletion kg CFC-11 eq 3.94E-06 3.54E-06 -10.1%
Global warming kg CO2 eq 4.38E+01 3.84E+01 -12.2%
Smog kg O3 eq 2.11E+00 1.90E+00 -9.6%
Acidification mol H+ eq 1.09E+01 9.70E+00 -10.9%
Eutrophication kg N eq 2.15E-01 1.99E-01 -7.3%
Carcinogenics CTUh 6.33E-06 4.89E-06 -22.6%
Non
carcinogenics CTUh 7.17E-06 6.43E-06 -10.4%
Respiratory
effects kg PM10 eq 6.13E-02 5.16E-02 -15.8%
Ecotoxicity CTUe 8.16E+01 6.63E+01 -18.8%
For most of the impact categories, characterization results of sensitivity analysis are more than 10%
lower than the original results, showing that the primary aluminum fraction has significant
influence on LCA results of Aluminum Pod. However, if the GWP result of sensitivity analysis
(38.4 kg CO2 eq.) is compared with the results for Polystyrene Pod (20.6 kg CO2 eq.) and
Biodegradable Pod (16.7 kg CO2 eq.), the conclusion that Biodegradable Pod has the lowest global
warming potential remains valid.

59
4.4.2 Recycling Rate of Aluminum Pod
A low recycling rate (0%) and a high recycling rate (39%) of Aluminum Pod are used for sensitivity
analysis comparing with the original 14% recycling rate. The sensitivity analysis results are shown
in Table 15. In the lower recycling rate situation, carcinogenics and ecotoxicity have more evident
changes. With the higher recycling rate, all changes are significant except smog formation and
eutrophication. However, when the GWP result in the 39% recycling scenario is compared with the
GWP of Polystyrene Pod and Biodegradable Pod in their base scenario, Aluminum Pod in its high
recycling rate scenario is the highest.

60
Table 15 Sensitivity analysis results and percentages of change for recycling rate of Aluminum Pod
Impact category Unit Original (14%
recycling rate) 0% recycling rate Change
39% recycling
rate Change
Ozone depletion kg CFC-11 eq 3.94E-06 4.16E-06 5.6% 3.54E-06 -10.0%
Global warming kg CO2 eq 4.38E+01 4.66E+01 6.5% 3.87E+01 -11.7%
Smog kg O3 eq 2.11E+00 2.22E+00 5.2% 1.91E+00 -9.4%
Acidification mol H+ eq 1.09E+01 1.15E+01 5.9% 9.73E+00 -10.6%
Eutrophication kg N eq 2.15E-01 2.24E-01 4.3% 1.99E-01 -7.7%
Carcinogenics CTUh 6.33E-06 7.08E-06 11.9% 4.98E-06 -21.3%
Non carcinogenics CTUh 7.17E-06 7.68E-06 7.1% 6.26E-06 -12.7%
Respiratory effects kg PM10 eq 6.13E-02 6.65E-02 8.4% 5.20E-02 -15.1%
Ecotoxicity CTUe 8.16E+01 9.00E+01 10.3% 6.66E+01 -18.4%
Table 16 Sensitivity analysis results and percentages of change for composting rate of Biodegradable Pod
Impact category Unit Original (40%
composting rate)
15% composting
rate
Change 65% composting
rate
Change
Ozone depletion kg CFC-11 eq 3.43E-06 3.43E-06 0.0% 3.43E-06 0.0%
Global warming kg CO2 eq 1.67E+01 1.67E+01 0.0% 1.67E+01 0.0%
Smog kg O3 eq 8.30E-01 8.30E-01 0.0% 8.29E-01 0.0%
Acidification mol H+ eq 3.85E+00 3.86E+00 0.1% 3.85E+00 -0.1%
Eutrophication kg N eq 1.20E-01 1.21E-01 0.4% 1.20E-01 -0.4%
Carcinogens CTUh 5.71E-07 5.72E-07 0.2% 5.70E-07 -0.2%
Non-carcinogens CTUh 1.55E-06 1.56E-06 0.5% 1.54E-06 -0.5%
Respiratory effects kg PM10 eq 1.42E-02 1.42E-02 0.0% 1.42E-02 0.0%
Ecotoxicity CTUe 2.85E+01 2.86E+01 0.3% 2.84E+01 -0.3%
61
4.4.3 Composting Rate of Biodegradable Pod
For Biodegradable Pod, 40% of the used coffee pods were diverted from landfill waste to
composting in the original model. In the sensitivity analysis, such diversion rate was both increased
to 65% and decreased to 15%. As showed in Table 16, changes of the indicator values are small
when the composting rate of Biodegradable Pod is increased or decreased for 25%. Considering
the fact that environmental effects from coffee pod EOL stage is rather small comparing to the full
life cycle, this is a reasonable outcome. However, the contribution of composting the coffee wastes
is not considered in this LCA study. With coffee waste management included in the EOL scenario,
the impact of different composting rate is expected to be greater.

62
Discussion
In this chapter, the objectives of this study will be revisited. The life cycle impact assessment will
help us to identify the coffee pod with the lowest GHG emission and its environmental tradeoff,
and the landfill waste generated by each coffee pod system will be added up for comparison. In
addition to the findings, this chapter discusses the practical and theoretical implications of the study
and its limitation. In the end, the research will be wrap up with future research directions and
conclusion.
The discussion needs to address synthesis of the findings, the practical and theoretical implications,
the strengths and limitations of the research, and the future research directions.
objectives:
1. To quantify the environmental hotspots of each coffee pod packaging system,
2. To compare GWP between the systems, and to identify tradeoffs in other life cycle impact
categories,
3. To estimate the landfill waste generated by the consumption of the coffee pods under current
waste management system in Ontario.
5.1 Key Findings
5.1.1 Environmental Hotspots
This life cycle assessment study reveals that for the three coffee pod packages, material stage is the
most important contributor to the overall life cycle effects, while coffee supply and use stage are
not considered. In addition to the pod materials, materials for secondary packages and plastic wraps
also made an important contribution to the results. Production stage also plays an important role,
especially for Aluminum Pod. Transportation of materials and distribution of finished products do
not have significant impacts on the LCA results, while end-of-life stage has a positive overall effect
in most categories with the credit of recycled materials.
While comparing aluminum pods with traditional plastic pods, it is not an environmentally wise
choice to promote aluminum pods over petroleum-based plastic pod. Considering that aluminum
recycling consumes much less electricity than producing aluminum from its primary orcs, the
amount of recycled aluminum is increasing over time (Green, 2007). But in the case of aluminum
coffee pod, the used pod cannot be recycled in a municipal recycling system because of the coffee
remain. The inconvenient recycling route resulted in a lower recycling rate than other aluminum
package (according to USEPA (2016), the recycling rate for aluminum packaging in the U.S. was

63
39% in 2014). Moreover, as indicated by sensitivity analysis results, the conclusion remains the
same, even when the recycling rate of aluminum pod is increased to a higher level (40%). This
illustrated that primary aluminum production generates much higher impacts than PS and PLA.
Also, electricity system choice is a long-standing and controversial discussion in aluminum LCAs
(Liu & Müller, 2012). The EcoInvent dataset for primary aluminum production uses a special global
average grid mix for aluminum industry, in which 53% is hydropower electricity (Frischknecht,
2007). The electricity mix for anodizing dataset is the mix of UCTE (Union for the Coordination
of the Transmission of Electricity, substituted by the European network of transmission system
operators for electricity, or ENTSO-E, in 2009), in which nuclear power plays an important role
(Tuchschmid, 2007). Both of them are relatively clean power mixes. The results could be worse if
the processes are powered by fossil-dependent grid.
5.1.2 Low GHG Emission Pod
The characterization results show that a bio-based polymer coffee pod has evident advantages in
global warming potential, acidification, and respiratory effects in comparison with a petroleum
plastic pod. On the other hand, disadvantages are identified in ozone depletion and eutrophication.
This conclusion is in line with earlier LCA studies that compare bio-based polymer products with
petroleum based plastic products (Datzel & Krüger, 2006; Gironi & Piemonte, 2009). Weiss et al.
(2012) who conducted a literature review on forty-four LCA studies that compared bio-based
materials and petroleum materials, also put forward similar conclusions. However, the weighting
results presented in section 4.1.2 indicate that the difference between the two coffee pod packaging
systems is limited. The bio-based polymer coffee pod system incorporates other materials, like
LDPE warp and cardboard box, which may result in some inconsistency against other bio-based
material LCA studies. But from both a CE and a landfill waste generation point of view, the
promotion of bio-based polymer coffee pod should be supported, because the compostable
materials can re-enter the biosphere as biological nutrients (UNEP, 2012), and enable coffee ground
to be composted after use. With coffee waste considered in the EOL stage, the coffee waste in the
aluminum pod and the bio-based polymer pod generate less GHG. The benefits from coffee waste
management increase the advantage of the bio-based polymer pod in GHG emission.
5.1.3 Landfill Waste Generation
LCA is capable of estimating various categories of environmental effects, but it does not reveal
how much landfill waste is generated by a system directly. To fulfill the objective of waste
generation estimation, a manual calculation is required.
In this part, the mass of landfill waste generated by the use of 1,000 pieces of the three coffee pods

64
will be calculated. The calculation includes the coffee grounds, coffee pods and their secondary
packages, but does not include coffee waste generated during roasting or grinding, due to lack of
information. Although coffee cultivation and processing were excluded from the LCA system
boundary, used coffee ground is calculated in waste generation. Because different packaging
systems not only provide different end-of-life approaches for the packaging materials, but also
change the patterns of coffee ground EOL treatments. For the Aluminum Pod diverted for recycling,
the coffee ground will be sent for composting after the coffee ground were separated from the pod
by the recycling company, instead of being landfilled. For coffee Pods Biodegradable Pod diverted
from landfill, the coffee ground will be composted together with the pod. The calculation is based
on the EOL scenarios introduced in section 3.2.2 (see Table9).
Figure 18 Amount of waste before and after diversion (unit: kg/1,000 pieces). For all coffee pods 62.5%
of secondary package is diverted. For Aluminum Pods, 14% of the pods and coffee ground are diverted.
For Biodegradable Pod, 40% of the pods and coffee ground are diverted
As shown in Figure 18, coffee ground accounts for more than 50% of the mass of any coffee pod
systems, hence diverting coffee waste can highly contribute to the overall waste reduction. Notably,
secondary packages produce equivalent or even more waste than the coffee pod itself before
diversion. It is indicated that the diversion of secondary packages and the plastic wrap of
Biodegradable Pod is influential to reducing the landfilled waste generation.
Before diversion, Biodegradable Pod generated the largest amount of total waste (19.52 kg/ 1,000
pieces), closely followed by Aluminum Pod (19.35 kg/ 1,000 pieces). Polystyrene Pod is the
9.81 9.8112.92
11.11 10.46
6.28
3.38 3.38
1.96
1.69 2.85
1.71
2.831.06
4.47
1.68
4.95
1.86
1.26
1.26
0
5
10
15
20
25
beforediversion
afterdiversion
beforediversion
afterdiversion
beforediversion
afterdiversion
Polystyrene Pod Aluminum Pod Biodegradable Pod
kg/
1,0
00
pie
ces
Coffee ground Pod Secondary package Plastic wrap

65
smallest with a mass of 16.02 kg/ 1,000 pieces. After diversion, the rankings are totally different.
Biodegradable Pod, with 40% of the pod and coffee diverted, has the smallest amount of waste
(11.11 kg/ 1,000 pieces). Polystyrene Pod and Aluminum Pod have similar amount of waste
remaining after diversion, adding up to 14.25 and 14.48 kg/ 1,000 pieces respectively. If the
consumers switch from Polystyrene Pod to Biodegradable Pod for their daily coffee consumption,
more than 6,000 tons of landfill waste can be avoided, equivalent to the annual landfill waste
generation of 9,000 people (The Conference Board of Canada, 2016).
What is not considered in the landfilled waste generation is coffee chaff – the waste product of the
coffee bean roasting process. Roasting 1 kg of wet coffee bean generates about 0.18 kg of coffee
chaff (Humbert, Loerincik, et al., 2009). The producers of Polystyrene Pod and Aluminum Pod will
treat the coffee chaff as organic wastes, but the producer of Biodegradable Pod is using the coffee
chaff as one of the raw materials to produce the coffee pod. Using the coffee chaff, they are not
only reducing the wastes from the coffee bean roasting process, but also reducing the use of bio-
based polymers. Since coffee bean processing is not included in the system boundary of this study,
the benefit of using coffee chaff in Biodegradable Pods is not quantified.
5.2 Practical Implications
5.2.1 Implications for Policy Makers
1. From both a greenhouse gas emission perspective and a landfill waste generation perspective,
consumers should be encouraged to switch from Polystyrene Pod to a Biodegradable Pod for
single-serve coffee pod consumption. Consumers should also be discouraged to the use of
Aluminum Pod.
2. The bio-based polymer system outweighs petroleum-based plastic system in GHG emission
and landfill waste generation in this study. It shows bio-based material’s potential in reducing
emissions in these two categories. Considering Ontario’s ambition regarding GHG and landfill
waste reduction, support should be offered to further research in bio-based material
development and application.
3. By being compostable, Biodegradable Pod not only provides better EOL management approach
to its coffee ground, but also generates the least GHG. Benefits of composting include
providing an ideal EOL management approach to contaminated food packages, diverting waste
from landfill and incinerators, and generating compost (Tokiwa et al., 2009). However,
currently industrial composting is not available to residents in every municipality in Ontario.
The government should support the composting programs. Consumer behavior will have
significant impact on waste diversion. Education should be provided to the residents to take
part in organic waste diversion.

66
5.2.2 Implications for Industry
1. For the single-use product industries, packaging material could play an important role in
reducing the life cycle environmental effects of a single-use product. Inspired by the bio-based
polymer coffee pod, using light weight packaging design and choosing packaging material
wisely can effectively reduce the environmental effects. Recycling is more efficient on
contaminated materials, for food package that is usually contaminated by food residue,
composting is a more appropriate waste management approach. More generally speaking, it is
important to design a product from a life-cycle engineering stand point, and to consider not
only financial, but also environment, health and safety throughout its life cycle (Fava, Brady,
Young, & Saur, 2000).
2. For the coffee pod industry, the use of aluminum as pod material is questionable. As indicated
in the LCIA results, producing and processing aluminum are much more impactful than its
substitutes. In the case of aluminum, life cycle stewardship options to source more sustainable
aluminum (ASI 2017) and certified metals (Young, Zhe, Dias 2014) should be emphasized to
improve the life cycle of aluminum products. Given that, consumers are often not motivated to
take part in the recycling program. On the other hand, the producer of compostable pod is
supposed to find a replacement for the plastic wrap, which is currently unrecyclable and
contributes to relatively high GHG emissions.
3. In addition to improving their products, the coffee pod producers should also cooperate with
municipalities to promote the diversion of the pods wastes via consumer education. There is a
need to educate consumers how to better manage their used pods.
5.2.3 Implication for Consumers
The results of this research suggest that the Biodegradable Pod is a better option for single-serve
coffee pod consumption regarding landfill waste generation and GWP. However, to achieve these
benefits, it requires the consumers to actively take part into the diversion of used pods. Considering
the fact that the Biodegradable Pod is not accepted by all municipal composting facilities in Ontario,
it is suggested that the consumers should consult to their local composting facility before using the
Biodegradable Pod. In the case of which Biodegradable Pods are not accepted as compostable
organic wastes, Polystyrene Pod and Biodegradable Pod are considered interchangeable. In either
case, Aluminum Pod is not suggested.
5.3 Theoretical Implications
5.3.1 Waste Problem and Material Innovations
Unlike other studies on the sustainability of coffee beverages, which focused on coffee bean supply
and coffee brewing (Coltro et al., 2006; Humbert, Loerincik, et al., 2009; Manezes et al., 1998), the

67
current research focuses on packaging formats and EOL treatment options of single-serve coffee
products. The conclusion that packaging material is identified as the largest source of effects after
coffee bean cultivation and coffee brewing, is in line with other LCA studies on single-serve coffee
pods (Chayer & Kicak, 2015; De Monte, Padoano, & Pozzetto, 2005; Dubois et al., 2011).
The innovative elements of this LCA study are: it is the first available LCA study on the PLA based
compostable coffee pod, and it compares three formats of coffee pod packaging systems made from
different materials and fall under different EOL treatment approaches. The results show that the
PLA based compostable pod outweighs other coffee pods in terms of global warming potential,
fossil depletion and waste generation. This study provides information to help the Province of
Ontario to attain their goals in waste reduction and GHG emissions reduction, and to help the coffee
pod industry to design pods that generates less environmental effects.
The current research is a case study of single-serve coffee pods, but does not limit to coffee pods.
Waste problems are common, since single-use products are everywhere and the world is getting
more and more populated. In order to avoid the continuous accumulation of non-biodegradable
plastics, the development of biodegradable plastics is of higher importance. PLA used in
Biodegradable Pod is among the expending list of biodegradable plastics. The implementation of
PLA and other biodegradable plastics is getting more common and covers a wider range of
application (Tokiwa et al., 2009). This LCA study, along with many earlier LCA studies (Datzel &
Krüger, 2006; Gironi & Piemonte, 2009; Suwanmanee et al., 2013), compares the environmental
performance of biodegradable plastics and their products with traditional petroleum-based plastics.
PLA is not only a biodegradable material, but also a bio-based polymer (Vink et al., 2003). Being
bio-based emphasizes its source from biomass, and the biodegradable emphasizes its capability to
be decomposed by microorganisms (Golden, J; Handfield R; Daystar, J; McConnell, 2015). Similar
to other materials that are both bio-based and biodegradable (Weiss et al., 2012), an environmental
tradeoff is identified in this LCA study related to PLA based product. As indicated by the
characterization results, the use of PLA has benefits in global warming potential, fossil depletion
and waste generation, but disadvantages in other impact categories like ozone depletion and
eutrophication. However, the weighting results in this study support the use of bio-based materials
by indicating that the ozone depletion and eutrophication have less important global effects.
Bioplastics is a fast-developing field, new materials come out every now and then. In order to make
the most of them, future studies are required to better understand the new materials from both an
environmental and engineering perspective.
5.3.2 Circular Economy
The current literature on circular economy tends to be focused on circulating technical nutrients in
the economy by recycling or reusing than using biological nutrients. Key words like “recycling”,
“reusing” and “remanufacturing” occur much more often in CE literatures than key words like

68
“composting” or “biodegrading” (Lieder & Rashid, 2016; Stindt & Sahamie, 2014). In this research,
the aluminum pod system falls under the category of “technical nutrients”, and the PLA system is
categorized as “biological nutrients”. Both of them are substitutions for the petroleum based pod
system, which can be considered as a representative of the “linear economy”. Surprisingly, the
results show that the PLA format is preferable in any of the impact categories. When production of
primary aluminum is compared with production of PLA, aluminum refining, smelting and casting
are more energy intensive procedures than PLA production (Tan & Khoo, 2005; Vink & Davies,
2015). Seemingly, aluminum recycling is an efficient way to recover post-consumer aluminum, but
as for small single-use products like a coffee pod, the efficiency depends on public participation.
In the case of aluminum coffee pod, only one fourth of the consumers are willing to participate in
the recycling program. As a result, the recycling rate remains at a low level (Nestlé Nespresso S.A.,
2017). The compostable pod, on the other hand, is easier to be diverted from landfilling in Ontario,
where curbside organic collection programs are available to the residents (Stauch, 2012), and do
not require extra effort to disassemble the pod by the consumers.
The results of this study indicate that to employ a circular economic product design, it is critical to
consider the easy-access and the motivation of public participation. Ghisellini et al. (2016) also
emphasized the importance of public participation in implementing CE at micro level, and indicated
that the promotion of consumers’ responsibility is crucial for enhancing the purchase and use of
more sustainable products and services.
5.3.3 Municipal Solid Waste Management
In 2015, the Province of Ontario had an overall residential waste diversion rate of 47.7% (RPRA,
2017), while the Industrial, Commercial, and Institutional (IC&I) sector, which generated 60% of
all of the waste in Ontario, had a waste diversion rate plateaued at 13% in 2012 (Halton Region,
2013). The overall waste diversion rate in Ontario according to these figures is at around 22%. In
the Waste-Free Ontario Act, the Government of Ontario outlined a goal of 30% diversion rate by
2020 (Ontario Ministry of Environment and Climate Change, 2016). If Ontario wants to achieve
this goal, the province should engage and motivate every stakeholder to implement their plan.
The municipalities should adhere to employ an Integrated Waste Management system. To achieve
the 30% diversion rate, organic waste must be diverted effectively. Curbside organic collection
programs should be developed in more municipalities, experience and lessons learned from
curbside organic collection should be shared among municipalities. Moreover, both the provincial
government and municipalities should focus on the IC&I sector, in which there is a low diversion
rate. Municipalities should set up regulations to guide waste diversion in IC&I sector, and at the
same time provide integrated waste management service to them.
5.4 Limitations

69
Like most LCA studies, this study is based on many assumptions and has its limitations. It should
be considered that these limitations may have influence on the implementation of the results and
conclusions from this study. Limitations identified in this study are:
1. This study is limited by data quality. Data for Polystyrene Pod is from secondary source. Data
for Aluminum Pod and Biodegradable Pod rely heavily on assumptions. Material composition
data for Biodegradable Pod is from unverified source. Moreover, the LCA model used pre-
existing European based datasets, which is in a different geographical context from
Polystyrene Pod and Biodegradable Pod. Different locations may have different production
technologies and conditions that cause uncertainty in the results.
2. Coffee supply was assumed to have similar contribution to the environmental effects of the
three coffee pods, and thus excluded from the LCA system boundary. However, the amount of
ground coffee varies from brand to brand. In 1000 pieces of the investigated products, the
average amounts of coffee are:
- Polystyrene Pod: 9.81 kg/1000 pieces
- Aluminum Pod: 12.92 kg/1000 pieces
- Biodegradable Pod: 10.46 kg/1000 pieces.
Earlier studies indicated that coffee supply dominates the environmental emissions of many
coffee products (Brommer et al., 2011; Dubois et al., 2011; Humbert, Rossi, et al., 2009).
While including the coffee supply into the LCA, the difference in coffee amount may lead to
a different conclusion in some indicators.
3. The transportation distance was not fully calculated. The origins of the materials for Aluminum
Pod and Biodegradable Pod are based on assumptions, and their transportation between
different production facilities was not considered. Also, extra package is necessary to protect
the products during their distribution, for example corrugated boxes or plastic film wrapping,
but they are not included in the models.
4. The results generated by this study are dependent on the selection of EOL scenarios. In the
selected scenarios, the diversion rates may not accurately represent the relative material
diversion situation in Ontario. Take the composting rate of Biodegradable Pod for example,
the 40% composting rate is taken from the Waste-Free Ontario Act referring to the total organic
waste composting rate, which includes the highly diverted yard wastes. As a matter of fact,
Biodegradable Pod have not been accepted by all of the composting facilities in Ontario.
5. This study was conducted in a geographical background of Ontario, Canada. The geographical
background decides transportation distances, waste management scenarios and electricity grid
mix. Differences in these areas should be considered while conclusions are implemented in
different regions.
6. Selection of impact categories also limited the study results. Nine life cycle impact categories
were used to assess the environmental performance of the packaging systems. However,
studies of bio-based materials pointed out that land use should be considered while comparing
bio-based materials with traditional materials (Datzel & Krüger, 2006; Weiss et al., 2012; Zah
et al., 2007). This study did not include land use as one of the impact categories.

70
5.5 Future Research Directions
1. This LCA study compares bio-based polymer (PLA) coffee pod with petroleum-based plastic
(PS) coffee pod and aluminum coffee pod, and identified some advantages and disadvantages
of bio-based polymer. There is a large variety of bio-based materials that can replace the use of
petroleum-based and mineral materials. Future LCA studies can be conducted on these
materials and their applications to compare their environmental effects with petroleum-based
and mineral materials.
2. From a CE point of view, biological nutrients and technical nutrients are compared in this
research. Conclusion is that biological nutrients have better environmental performance in the
context of small single-use products. Future studies can compare large durable products that
are made from biological nutrients and technical nutrients.
3. This case study of coffee pod did not include coffee cultivation and coffee brewing into system
boundary, it actually investigated the life cycle of coffee package. Future studies can include
coffee supply and brewing, and investigate the coffee pod as a coffee beverage.
5.6 Conclusions
This research made a comparison between three coffee pod packaging systems, and revealed the
environmental effects generated over their life cycles. The results recognized the bio-based polymer
coffee pod’s advantages in greenhouse gas emission and waste generation. Moreover, it is indicated
that bio-based materials and organic waste composting have potential in helping Ontario to achieve
the GHG emissions reduction and waste-free targets.
In addition to the comparison between bio-based materials and petroleum-based materials, a
comparison between biological nutrients and technical nutrients is discussed in this research.
However, one case study is far from enough to draw a general conclusion. To draw any of
determined conclusions on whether bio-based materials, petroleum materials or mineral materials
are more sustainable than other materials, or whether biological or technical nutrients are more
favorable in CE, extensive research and more case studies are required in future.

71
References
AIM Environmental Group (2006). Hamilton Central Composting Facility. Retrieved from:
http://aimgroup.ca/?page_id=89&lang=en
ASTM International. (2012). Standard Specification for Labeling of Plastics Designed to be
Aerobically Composted in Municipal or Industrial Facilities 1. ASTM Internacional, 1, 1–3.
http://doi.org/10.1520/D6400-12.2
ASTM International. (2017a). Helping Our World Work Better.
ASTM International. (2017b). Standard Specification for Labeling of End Items that Incorporate
Plastics and Polymers as Coatings or Additives with Paper and Other Substrates Designed to
be Aerobically Composted in Municipal or Industrial Facilities 1, 11–13.
http://doi.org/10.1520/D6868-11.2
Baldi, E., Toselli, M., Marcolini, G., Quartieri, M., Cirillo, E., Innocenti, A., & Marangoni, B.
(2010). Compost can successfully replace mineral fertilizers in the nutrient management of
commercial peach orchard. Soil Use and Management, 26(3), 346–353.
http://doi.org/10.1111/j.1475-2743.2010.00286.x
Bare, J. (2011). Clean Techn Environ Policy 13: 687. doi:10.1007/s10098-010-0338-9
Baumann, H., & Tillman, A.-M. (2004). The Hitch Hiker's Guide to LCA. Lund, Sweden:
Studentlitteratur AB.
BBC News (2016). Is there a serious problem with coffee capsules? Retrieved from:
http://www.bbc.com/news/magazine-35605927
Biodegradable Products Institute, Inc. (2016). BPI Certified Products Catalog, Club Coffee
PURPOD 100. Retrieved from http://products.bpiworld.org/companies/club-coffee-purpod-
100
Blumberg, K., & Posada, F. (2015). Comparison of US and EU programs to control light- duty
vehicle emissions.
Bocken, N. M. P., Olivetti, E. A., Cullen, J. M., Potting, J., & Lifset, R. (2017). Taking the
Circularity to the Next Level: A Special Issue on the Circular Economy. Journal of
Industrial Ecology, 21(3), 476–482. http://doi.org/10.1111/jiec.12606
Bocken, N. M. P., Pauw, I. De, Bakker, C., Grinten, B. Van Der, Bocken, N. M. P., Pauw, I.
De, … Grinten, B. Van Der. (2016). Product design and business model strategies for a
circular economy. Journal of Industrial and Production Engineering, 1015(November), 1–
12. http://doi.org/10.1080/21681015.2016.1172124
Boulding, K. E. (1966). The economics of the coming spaceship earth. Environmental Quality
Issues in a Growing Economy.
Brennan, G., Tennant, M., & Blomsma, P. (2013). 10 Business and production solutions Closing
loops and the circular economy, 3(4).
Brommer, E., Stratmann, B., & Quack, D. (2011). Environmental impacts of different methods of
coffee preparation. International Journal of Consumer Studies, 35(2), 212–220.
72
http://doi.org/10.1111/j.1470-6431.2010.00971.x
Büsser, S., & Jungbluth, N. (2009). The role of flexible packaging in the life cycle of coffee and
butter. International Journal of Life Cycle Assessment, 14(SUPPL. 1), 80–91.
http://doi.org/10.1007/s11367-008-0056-2
Carter- Whitney, M. (2007). Ontario’s Waste Management Challenge: Is Incineration an Option?
Canadian Institute for Environmental Law and Policy.
Chayer, J.-A., & Kicak, K. (2015). Life Cycle Assessment of coffee consumption : comparison of
single-serve coffee and bulk coffee brewing Final Report. Quantis.
Chen, X. (2008). A Systematic Comparison of Municipal Solid Waste Management Systems :
Case Studies of Dalian City , China and the Region of Waterloo , Canada by, 1.
Cheremisinoff, N. P. (2003). Handbook of Solid Waste Management and Waste Minimization
Technologies. Handbook of Solid Waste Management and Waste Minimization
Technologies. http://doi.org/10.1016/B978-075067507-9/50005-X
Chertow, M. R. (2000). Industrial symbiosis: literature and taxonomy. Annual Review of Energy
and the Environment, 25(1), 313–337.
City of Guelph (2017). Organic Waste Processing Facility. Retrieved from:
http://guelph.ca/living/garbage-and-recycling/waste-resource-innovation-centre/owpf/
Club Coffee (2017). Achieving Certification and Testing, the Path to Certified 100% Compostable.
Retrieved from http://purpod100.com/certification/
Coffee Association of Canada (2017). Coffee Facts. Retrieved from
https://www.coffeeassoc.com/coffee-facts/
Cointreau-Levine, S. (1999). Sanitary Landfill Design and Siting Criteria. In Annex A, Terms of
Reference for Siting Study for a New Sanitary Landfill, SBMA. Retrieved from
http://www.worldbank.org/urban/uswm/landfillsitingdesign.pdf
Coltro, L., Mourad, A., Oliveira, P., Baddini, J., & Kletecke, R. (2006). Environmental Profile of
Brazilian Green Coffee. The International Journal of Life Cycle Assessment, 11(1), 16–21.
http://doi.org/10.1065/lca2006.01.230
Cooper, D. R., & Gutowski, T. G. (2015). The Environmental Impacts of Reuse A Review, 21(1).
http://doi.org/10.1111/jiec.12388
Cunningham, W., & Cunningham, M. (2012). Principles of environmental science. McGraw-Hill
Higher Education.
Dash, T. K., & Konkimalla, V. B. (2012). Polymeric modification and its implication in drug
delivery: Poly-??-caprolactone (PCL) as a model polymer. Molecular Pharmaceutics, 9(9),
2365–2379. http://doi.org/10.1021/mp3001952
Datzel, A., & Krüger, M. (2006). Life Cycle Assessment of PolyLactide(PLA) A comparison of
food packaging made from NatureWorks® PLA and alternative materials, (July).
Davis, Joseph R. (1993). Aluminum and Aluminum Alloys (4th ed.). ASM International.
ISBN 978-0-87170-496-2. OCLC 246875365.
De Monte, M., Padoano, E., & Pozzetto, D. (2005). Alternative coffee packaging: An analysis
from a life cycle point of view. Journal of Food Engineering, 66(4), 405–411.
http://doi.org/10.1016/j.jfoodeng.2004.04.006

73
den Hollander, M. C., Bakker, C. A., & Hultink, E. J. (2017). Product Design in a Circular
Economy: Development of a Typology of Key Concepts and Terms. Journal of Industrial
Ecology, 21(3), 517–525. http://doi.org/10.1111/jiec.12610
Di Maio, F., & Rem, P. C. (2015). A robust indicator for promoting circular economy through
recycling. Journal of Environmental Protection, 2015(6).
Dodiuk, H., & Goodman, S. H. (2013). Handbook of thermoset plastics. William Andrew.
Drumright, B. R. E., Gruber, P. R., & Henton, D. E. (2000). Polylactic Acid Technology,
48674(23), 1841–1846.
Dubois, C., Humbert, S., & Margni, M. (2011). Comparative full life cycle assessment of B2C
cup of espresso made using a packaging and distribution system from Nespresso Espresso
and three generic products. Quantis, (May).
Edana (2008). http://www.edana.org/Content/Default.asp?PageID=41#wetlaid. Accessed 2012
Ellen MacArthur Foundation (EMF). (2013). Towards the Circular Economy: Economic and
business rationale for an accelerated transition.
Ellen MacArthur Foundation (EMF). (2015). Circularity Indicators, An Approach to Measuring
Circularity.
Ellen MacArthur Foundation (EMF). (2016). The New Plastics Ecnomy: Rethinking the future of
plastics.
Enger, E. D., Smith, B. F., & Bockarie, A. T. (2000). Environmental science: A study of
interrelationships. McGraw-Hill Boston.
Environment and Climate Change Canada (2017). National Inventory Report 1990-2015:
Greenhouse Gas Sources and Sinks in Canada. Retrieved from https://www.ec.gc.ca/ges-
ghg/default.asp?lang=En&n=83A34A7A-1
Epstein, E. (2011). Industrial composting: Environmental engineering and facilities management.
CRC Press.
European Commission. (2012). Preparing a Waste Prevention Programme Guidance document.
Fava, J. A., Brady, K., Young, S. B., & Saur, K. (2000). Sustainable strategies using life cycle
approaches. Environmental Progress, 19(2), 61–64.
Fava, J. A., Denison, R., Jones, B., Curran, M., Vigon, B., Selke, S., & Barnum, J. (1994). A
Technical Framework for Life-cycle Assessments (Vol. Second printing). Pensacola, USA:
SETAC Foundation for Environmental Education.
Franchini, M., Rial, M., Buiatti, E., & Bianchi, F. (2004). Health effects of exposure to waste
incinerator emissions: a review of epidemiological studies. Annali dell’Istituto Superiore Di
Sanità, 40(1), 101–115.
Fukushima, K., Sogo, K., Miura, S., & Kimura, Y. (2004). Production of D-lactic acid by
bacterial fermentation of rice starch. Macromolecular Bioscience, 4(11), 1021–1027.
http://doi.org/10.1002/mabi.200400080
Furedy, C. (1992). Garbage: exploring non-conventional options in Asian cities. Environment and
Urbanization, 4(2), 42–61. http://doi.org/10.1177/095624789200400205
Geissdoerfer, M., Savaget, P., Bocken, N. M. P., & Jan, E. (2017). The Circular Economy e A
new sustainability paradigm ? Journal of Cleaner Production, 143, 757–768.

74
http://doi.org/10.1016/j.jclepro.2016.12.048
Gelles, D. (2016). Keurig’s New K-cup Coffee Is Recyclable, but Hardly Green. Retrieved from
https://www.nytimes.com/2016/04/17/business/energy-environment/keurigs-new-k-cup-
coffee-is-recyclable-but-hardly-green.html
Ghisellini, P., Cialani, C., & Ulgiati, S. (2016). A review on circular economy : the expected
transition to a balanced interplay of environmental and economic systems. Journal of
Cleaner Production, 114, 11–32. http://doi.org/10.1016/j.jclepro.2015.09.007
Gilding, D. K., & Reed, A. M. (1979). Biodegradable polymers for use in surgery—
polyglycolic/poly (actic acid) homo-and copolymers: 1. Polymer, 20(12), 1459–1464.
Gironi, F., & Piemonte, V. (2009). Life Cycle Assessment of Polylactic Acid and Polythelene
Terephthalate Bottles for Drinking Water. Environmental Progress, 28(3), 404–409.
http://doi.org/10.1002/ep
Golden, J; Handfield R; Daystar, J; McConnell, T. (2015). An Economic Impact Analysis of the
U.S. Biobased Products Industry. A Report to the Congress of the United STates of America,
(June).
Government of Ontario (2012). Landfill Standards: A guideline on the regulatory and approval
requirements for new/expanding land. Retrieved from https://www.ontario.ca/page/landfill-
standards-guideline-regulatory-and-approval-requirements-newexpanding-land
Government of Ontario (2014). Ontario’s Climate Change Update 2014. Retrieved from
https://www.ontario.ca/page/ontarios-climate-change-update-2014
Green, J. A. S. (2007). Aluminum recycling and processing for energy conservation and
sustainability. ASM International.
Groot, W. J., & Borén, T. (2010). Life cycle assessment of the manufacture of lactide and PLA
biopolymers from sugarcane in Thailand, 970–984. http://doi.org/10.1007/s11367-010-
0225-y
Guinée, J. B., Heijungs, R., & Huppes, G. (2004). Economic allocation: Examples and derived
decision tree. The International Journal of Life Cycle Assessment, 9(1), 23–33.
http://doi.org/10.1007/BF02978533
Haas, W., Krausmann, F., Wiedenhofer, D., & Heinz, M. (2015). How Circular is the Global
Economy ? An Assessment of Material Flows , Waste Production , and Recycling in the
European Union and the World in 2005, 19(5), 765–777. http://doi.org/10.1111/jiec.12244
Habib, K., Schmidt, J. H., & Christensen, P. (2013). A historical perspective of Global Warming
Potential from Municipal Solid Waste Management. Waste Management, 33(9), 1926–1933.
http://doi.org/10.1016/j.wasman.2013.04.016
Haight, Murray E. (1991). Preface. In Haight, M. E. (Ed.), Municipal Solid Waste Management:
Making Decisions in the Face of Uncertainty. Waterloo: University of Waterloo Press.
Halton Region (2013). Improving waste diversion in industrial, commercial and institutional sector.
Retrieved from https://haltonrecycles.wordpress.com/2013/06/27/improving-waste-
diversion-in-the-industrial-commercial-and-institutional-sector/
Hamblin, J. (2015). A Brewing Problem, What’s the healthiest way to keep everyone caffeinated?
Retrieved from https://www.theatlantic.com/technology/archive/2015/03/the-abominable-k-

75
cup-coffee-pod-environment-problem/386501/
Hassard, H. A., Couch, M. H., Techa-Erawan, T., & Mclellan, B. C. (2014). Product carbon
footprint and energy analysis of alternative coffee products in Japan. Journal of Cleaner
Production, 73, 310–321. http://doi.org/10.1016/j.jclepro.2014.02.006
Haug, R. T. (1993). The practical handbook of compost engineering. CRC Press.
Hicks, C., & Dietmar, R. (2007). Improving cleaner production through the application of
environmental management tools in China. Journal of Cleaner Production, 15(5), 395–408.
Humbert, S., Loerincik, Y., Rossi, V., Margni, M., & Jolliet, O. (2009). Life cycle assessment of
spray dried soluble coffee and comparison with alternatives (drip filter and capsule
espresso). Journal of Cleaner Production, 17(15), 1351–1358.
http://doi.org/10.1016/j.jclepro.2009.04.011
Humbert, S., Rossi, V., Margni, M., Jolliet, O., & Loerincik, Y. (2009). Life cycle assessment of
two baby food packaging alternatives : glass jars vs . plastic pots, 95–106.
http://doi.org/10.1007/s11367-008-0052-6
Huysman, S., De Schaepmeester, J., Ragaert, K., Dewulf, J., & De Meester, S. (2017).
Performance indicators for a circular economy: A case study on post-industrial plastic
waste. Resources, Conservation and Recycling, 120, 46–54.
International Reference Center for the Life Cyccle of Products, P. and S. (2015). Circular
Economy: A Critical Literature Review of Concepts.
ICO (2012). International Coffee Organisation, London. Data Retrieved from:
http://www.ico.org/trade_statistics.asp?section=Statistics
ISO. (2006). INTERNATIONAL STANDARD ISO14044 Environmental management — Life
cycle assessment — Requirements and guidelines, 2006.
ISO New England Inc. (2017). Resource Mix, Sources of Electricity Used in 2016. Retrieved from
https://www.iso-ne.com/about/key-stats/resource-mix
Jaffee, D. (2014). Brewing justice: Fair trade coffee, sustainability, and survival. Univ of
California Press.
Kaufman, J.G. (2000). Introduction to Aluminum Alloys and Tempers . ASM International. Online
version Retrieved from: http://app.knovel.com/hotlink/toc/id:kpIAAT0002/introduction-
aluminum/introduction-aluminum
Keurig Green Mountain Inc. (2016). Keurig Green Mountain Fiscal Year 2016. Retrieved from:
http://www.keuriggreenmountain.com/en/OurCompany/WhoWeAre.aspx
Keurig Green Mountain Inc. (2016). Keurig® K15 Classic Series. Retrieved from
http://www.keurig.ca/Brewers/Home/Keurig%C2%AE-K15-Classic-Series/p/keurig-classic-
series-k15-brewing-system
Koerner, R. M., & Daniel, D. E. (1997). Final covers for solid waste landfills and abandoned
dumps. Thomas Telford.
Kollikkathara, N., Feng, H., & Stern, E. (2009). A purview of waste management evolution:
Special emphasis on USA. Waste Management, 29(2), 974–985.
http://doi.org/https://doi.org/10.1016/j.wasman.2008.06.032
Komilis, D. P., & Ham, R. K. (2004). Life-Cycle Inventory of Municipal Solid Waste and Yard

76
Waste Windrow Composting in the United States, 130(November), 1390–1400.
Kreith, F., & Tchobanoglous, G. (2002). Handbook of Solid Waste Management. Waste
Management Research (Vol. 13). http://doi.org/10.1006/wmre.1995.0050
Lieder, M., & Rashid, A. (2016). Towards circular economy implementation : a comprehensive
review in context of manufacturing industry. Journal of Cleaner Production, 115, 36–51.
http://doi.org/10.1016/j.jclepro.2015.12.042
Liu, G., & Müller, D. B. (2012). Addressing sustainability in the aluminum industry: A critical
review of life cycle assessments. Journal of Cleaner Production, 35, 108–117.
http://doi.org/10.1016/j.jclepro.2012.05.030
Louis, G. E. (2004). A historical context of municipal solid waste management in the United
States, (August 2003), 306–322. http://doi.org/10.1177/0734242X04045425
Mader, J. E. (2011). Applying the Integrated Solid Waste Management Framework to the Waste
Collection System in.
Manaf, L. A., Samah, M. A. A., & Zukki, N. I. M. (2009). Municipal solid waste management in
Malaysia: Practices and challenges. Waste Management, 29(11), 2902–2906.
http://doi.org/10.1016/j.wasman.2008.07.015
Manezes, E. A., Finzer, J. R. D., & Oliveira, D. L. (1998). A study of the drying performance of a
vibrating tray dryer, 6.
Marriott, J., Matthews, H. S., & Hendrickson, C. T. (2010). Impact of Power Generation Mix on
Life Cycle Assessment and Carbon Footprint Greenhouse Gas Results. Journal of Industrial
Ecology, 14(6), 919–928. http://doi.org/10.1111/j.1530-9290.2010.00290.x
Martin.O, A. . (2001). Plasticization and properties of biodegradable multiphase systems
polymer. Poly(lactic Acid), 42, 6209–6219.
McDonough, W., & Braungart, M. (2002). Cradle to cradle: Remaking the way we make things.
North point press.
Metal Forming Industries (2017). Impact Extrusion. Retrieved from:
http://metalformingindustries.com/processes/impact-extrusion/
Mohanty, A., Misra, M., Rodriguez-Uribe, A., & Vivekanandhan, S. (2015). Hybrid sustainable
composites and methods of making and using thereof. Google Patents. Retrieved from
https://www.google.ca/patents/WO2015039237A1?cl=en
Morioka, T., Tsunemi, K., Yamamoto, Y., Yabar, H., & Yoshida, N. (2005). Eco-efficiency of
Advanced Loop-closing Systems for Vehicles and Household Appliances in Hyogo Eco-
town. Journal of Industrial Ecology, 9(4), 205–221.
http://doi.org/10.1162/108819805775247909
Morrissey, A. J., & Browne, J. (2004). Waste management models and their application to
sustainable waste management. Waste Management, 24(3), 297–308.
National Zero Waste Council (2016). Club Coffee. Retrieved from:
http://www.nzwc.ca/focus/design/portfolio/club-coffee
Nespresso (2016). Vertuoline, Exceptional Coffee and Espresso. Retrieved from
https://www.nespresso.com/ca/en/grands-crus-coffee-range-vertuo
Nespresso (2017). Our 2020 Goals and Ambitions. Retrieved from

77
https://www.nespresso.com/positive/ca/en#!/sustainability/commitments
Nestlé (2011). Nestlé Annual Report 2011. Retrieved from:
http://www.nestle.com/media/newsandfeatures/annual-report-2011
Nestlé Nespresso S.A. (2015). Nespresso Coffee Centres Of Excellence, (March), 1–2.
Nestlé Nespresso S.A. (2017). The Positive Cup: Creating Shared Value Report, 101. Retrieved
from https://www.nestle-nespresso.com/asset-library/documents/nespresso-positive-cup-
csv-report-interactive.pdf
Oatman, M. (2014) Your Coffee Pod’s Dirty Secret. March 19, 2014. Retrieved from:
http://www.motherjones.com/blue-marble/2014/03/coffee-k-cups-green-mountain-
polystyrene-plastic
O’Leary, P. R. (1999). Decision-maker’s guide to solid-waste management. Diane Publishing.
Ontario Ministry of Environment and Climate Change. (2016). Ontario’s Five Year Climate
Change Action Plan 2016 – 2020, 86. Retrieved from
http://www.applications.ene.gov.on.ca/ccap/products/CCAP_ENGLISH.pdf
Ontario Ministry of Environment and Climate Change. (2016). Strategy for a Waste-Free Ontario:
Building the Circular Economy, (Final Draft).
Ontario Waste Management Association. (2016). State of Waste in Ontario : Landfill Report First
Annual Report.
Oskamp, S. (1995). Resource Conservation and Recycling : Behavior and Policy, 51(4), 157–177.
Paper Shipping Sack Manufactures’ Association. (2017). Raw Materials: The Beginning Point.
Retrieved from
https://pssma.org/Public/Industry_Info/Raw_Materials/Public/Industry_Scope_Pages/Raw_
Materials.aspx?hkey=9f435af8-39d1-4477-b0e4-f754308211fe
Paulapuro, Hannu (2000). Paper and Board grades. Papermaking Science and Technology. 18.
Finland: Fapet Oy. p. 114. ISBN 952-5216-18-7.
Pawar, P. a, & Purwar, A. H. (2013). Bioderadable Polymers in Food Packaging. American
Journal of Engineering Research (AJER), (5), 151–164.
Pearce, D. W., & Turner, R. K. (1990). Economics of natural resources and the environment.
JHU Press.
Piringer, Otto G.; Baner, Albert Lawrence (2008). Plastic Packaging: Interactions with Food and
Pharmaceuticals (2nd ed.). Wiley-VCH. ISBN 978-3-527-31455-3. Retrieved 2014-02-20.
Poirier, Y., Nawrath, C., & Somerville, C. (1995). Production of Polyhydroxyalkanoates, a
Family of Biodegradable Plastics and Elastomers, in Bacteria and Plants. Nat Biotech,
13(2), 142–150. Retrieved from http://dx.doi.org/10.1038/nbt0295-142
Porter, R. C. (2010). The economics of waste. Routledge.
PRé Consultants. (2013). SimaPro Life Cycle Analysis version 7.3 (software). Amersfort, The
Netherlands.
PRé Consultants. (2014). SimaPro Database Manual. PRe, 1–48.
http://doi.org/10.1017/CBO9781107415324.004
Premium Pack (2017). Why EVOH. Retrieved from http://premiumpack.at/technology/why-evoh
Recycling Today (2016). Seattle composting facility accepts compostable coffee pods. Club

78
Coffee’s PurPod100™ is currently the only single-serve coffee pod accepted at Cedar Grove
Composting’s facilities. Retrieved from http://www.recyclingtoday.com/article/club-coffee-
compostable-coffee-pod-accepted/
Reed, A. M., & Gilding, D. K. (1981). Biodegradable polymers for use in surgery —
poly(ethylene oxide)/poly(ethylene terephthalate) (PEO/PET) copolymers: 2. In vitro
degradation. Polymer, 22(4), 499–504. http://doi.org/https://doi.org/10.1016/0032-
3861(81)90169-5
Resource Productivity and Recovery Authority. (2017). 2015 Ontario Residential Waste
Diversion Rates Ontario Residential Waste Diversion Rate 2010-2015, (May), 6–9.
Scientific Applications International Corporation. Life Cycle Assessment: Principles and Practice.
U.S. Environmental Protection Agency, Washington, DC, EPA/600/R-06/060, 2006.
Scott, G. (2002). Degradable polymers: principles and applications. Springer Science &
Business Media.
Sendra, C., Gabarrell, X., & Vicent, T. (2007). Material flow analysis adapted to an industrial
area. Journal of Cleaner Production, 15(17), 1706–1715.
Shi, H., Peng, S. Z., Liu, Y., & Zhong, P. (2008). Barriers to the implementation of cleaner
production in Chinese SMEs: government, industry and expert stakeholders’ perspectives.
Journal of Cleaner Production, 16(7), 842–852.
Siracusa, V., Rocculi, P., Romani, S., & Rosa, M. D. (2008). Biodegradable polymers for food
packaging: a review. Trends in Food Science and Technology, 19(12), 634–643.
http://doi.org/10.1016/j.tifs.2008.07.003
Societé (in French), CH: Monodor, archived from the original on May 3, 2008
Södergård, A., & Stolt, M. (2002). Properties of lactic acid based polymers and their correlation
with composition. Progress in Polymer Science (Oxford), 27(6), 1123–1163.
http://doi.org/10.1016/S0079-6700(02)00012-6
Squire, J. N. (2012). Biomedical Pollutants and Urban Waste Management in the Accra
Metropolitan Area , Ghana : A Framework for Urban Management of the Environment
( FUME ) by.
Stahel, W. R., & Reday, G. (1976). The potential for substituting manpower for energy, report to
the Commission of the European Communities.
Stahel, W. R. (1982). The product life factor. An Inquiry into the Nature of Sustainable Societies:
The Role of the Private Sector (Series: 1982 Mitchell Prize Papers), NARC.
Statistics Canada (2016). Waste Disposal by Source, Province and Territory. Retrieved from:
http://www.statcan.gc.ca/tables-tableaux/sum-som/l01/cst01/envir25b-eng.htm
Statistics Canada (2017). Table 051-0005 Estimates of population, Canada, Provinces and
Territories. Retrieved from:
http://www5.statcan.gc.ca/cansim/a26?lang=eng&retrLang=eng&id=0510005&&pattern=&
stByVal=1&p1=1&p2=31&tabMode=dataTable&csid=
Stauch, A. M. (2012). Curbside Organic Waste Collection The 60 % Waste Diversion Goal : A
Case Study of Select Municipalities in the Greater Golden Horseshoe by.
Stindt, D., & Sahamie, R. (2014). Review of research on closed loop supply chain management in

79
the process industry. Flexible Services and Manufacturing Journal, 26(1), 268–293.
http://doi.org/10.1007/s10696-012-9137-4
Stora Enso Renewable Packaging. (2013). Paperboard Guide.
Su, B., Heshmati, A., Geng, Y., & Yu, X. (2013). A review of the circular economy in China :
moving from rhetoric to implementation. Journal of Cleaner Production, 42, 215–227.
http://doi.org/10.1016/j.jclepro.2012.11.020
Suwanmanee, U., Varabuntoonvit, V., Chaiwutthinan, P., Tajan, M., Mungcharoen, T., &
Leejarkpai, T. (2013). Life cycle assessment of single use thermoform boxes made from
polystyrene (PS), polylactic acid, (PLA), and PLA/starch: Cradle to consumer gate.
International Journal of Life Cycle Assessment, 18(2), 401–417.
http://doi.org/10.1007/s11367-012-0479-7
Tan, R. B. H., & Khoo, H. H. (2005). An LCA study of a primary aluminum supply chain.
Journal of Cleaner Production, 13(6), 607–618.
http://doi.org/10.1016/j.jclepro.2003.12.022
Tchobanoglous, G., Theisen, H., & Vigil, S. A. (1993). Integrated solid waste management :
engineering principles and management issues. New York: McGraw-Hill.
The Conference Board of Canada (2016). Provincial and Territorial Rankings: Waste Generation.
Retrieved from http://www.conferenceboard.ca/hcp/provincial/environment/waste.aspx
The Conference Board of Canada (2017). Provincial and Territorial Rankings: Greenhouse Gas
Emissions. Retrieved from http://www.conferenceboard.ca/hcp/provincial/environment/ghg-
emissions.aspx#ftn1-ref
The Roasterie. (2013). Spring has Sprung and Your Garden Needs Coffee Chaff. Retrieved from
https://www.theroasterie.com/blog/spring-has-sprung-and-your-garden-needs-coffee-chaff/
Tokiwa, Y., & Calabia, B. P. (2006). Biodegradability and biodegradation of polyesters. Journal
of Polymers and the Environment, 15(4), 259–267. http://doi.org/10.1007/s10924-007-0066-
3
Tokiwa, Y., Calabia, B. P., Ugwu, C. U., & Aiba, S. (2009). Biodegradability of plastics.
International Journal of Molecular Sciences, 10(9), 3722–3742.
http://doi.org/10.3390/ijms10093722
Toronto Environmental Alliance. (2017). ORGANICS FIRST: SETTING TORONTO ON THE
ZERO WASTE.
United Nations Environment Programme. (2012). Global Environment Outlook 5 (GEO5)
Environment for the future we want.
USEIA. (2017). Vermont State Profile and Energy Estimates 2016. Retrieved from
https://www.eia.gov/state/?sid=VT#tabs-2
USEPA. (2007). Municipal Solid Waste Generation, Recycling, and Disposal in the United States:
Facts and Figures for 2006.
USEPA. (2011). Municipal Solid Waste in the United States: facts and Figures for 2011. Office of
Resource Conservation and Recovery.
USEPA. (2016). Paper Recycling Facts and Figures. Retrieved from
https://archive.epa.gov/wastes/conserve/materials/paper/web/html/faqs.html#recycle

80
USEPA. (2016). Advancing sustainable materials management: 2014 fact sheet. United States
Environmental Protection Agency, Office of Land and Emergency Management,
Washington, DC 20460, (November), 22. Retrieved from
https://www.epa.gov/sites/production/files/2016-11/documents/2014_smmfactsheet_508.pdf
Van De Klundert, A. (1999). Integrated Sustainable Waste Management: the selection of
appropriate technologies and the design of sustainable systems is not (only) a technical
issue. interRegional Workshop on Technologies for Sustainable Waste Management, (0), 1–
21.
Villanueva, A., & Wenzel, H. (2007). Paper waste - Recycling, incineration or landfilling? A
review of existing life cycle assessments. Waste Management, 27(8).
http://doi.org/10.1016/j.wasman.2007.02.019
Vink, E. T. H., & Davies, S. (2015). Life Cycle Inventory and Impact Assessment Data for 2014
IngeoTM Polylactide Production. Industrial Biotechnology, 11(3), 167–180.
http://doi.org/10.1089/ind.2015.0003
Vink, E. T. H., Davies, S., & Kolstad, J. J. (2010). The eco-profile for current Ingeo® polylactide
production. Ind Biotechnol.
Vink, E. T. H., Glassner, D. a., Kolstad, J. J., Wooley, R. J., & O’Connor, R. P. (2007).
ORIGINAL RESEARCH: The eco-profiles for current and near-future NatureWorks®
polylactide (PLA) production. Industrial Biotechnology, 3(1), 58–81.
http://doi.org/10.1089/ind.2007.3.058
Vink, E. T. H., Rábago, K. R., Glassner, D. A., & Gruber, P. R. (2003). Applications of life cycle
assessment to NatureWorksTM polylactide (PLA) production. Polymer Degradation and
Stability, 80(3), 403–419. http://doi.org/10.1016/S0141-3910(02)00372-5
Weiss, M., Haufe, J., Carus, M., Brandão, M., Bringezu, S., Hermann, B., & Patel, M. K. (2012).
A Review of the Environmental Impacts of Biobased Materials. Journal of Industrial
Ecology, 16(SUPPL.1). http://doi.org/10.1111/j.1530-9290.2012.00468.x
Williams, P. T. (2005). Waste treatment and disposal. John Wiley & Sons.
Wynen, V., Boureima, F-S., & Sergeant, N. (2007). Defining LCA objectives and functional unit.
(WP 2 ed.)
SB Young, Y Zhe, G Dias (2014). Prospects for sustainability certification of metals.
International Journal of Metallurgy, 111 (3), 131-136.
Zah, R., Böni, H., Gauch, M., Hischier, R., Lehmann, M., & Wäger, P. (2007). Life cycle
assessment of energy products: Environmental assessment of biofuels (Executive summary),
18. Retrieved from
http://www.bioenergywiki.net/images/8/80/Empa_Bioenergie_ExecSumm_engl.pdf
Zavodska, A. (2000). A Comparative Study on Residential Solid Waste Management in Selected
Developing and Developed Countries: Guyana an The United States. Unpublished
Dissertation, The University of Arizona.

81
Appendixes
Appendix A Characterization Results of Polystyrene Pod
Title: Analyzing 1,000 p 'Polystyrene Pod landfilling'
Method: TRACI 2 V4.00
Indicator: Characterization
Impact
category Unit Total
Polystyrene,
expandable, at
plant/RER U
Polyethylene,
LDPE,
granulate, at
plant/RER U
Ethylene vinyl
acetate
copolymer, at
plant/RER U
Polyethylene
terephthalate,
granulate,
amorphous, at
plant/RER U
Kraft paper,
bleached, at
plant/RER U
(NE. mix)
Ozone
depletion
kg CFC-11
eq 1.12E-06 1.53E-07 2.45E-10 4.34E-09 5.12E-09 4.54E-08
GWP kg CO2 eq 17.73266 8.908641 0.682859 0.090097 0.088694 0.351519
Smog kg O3 eq 0.778537 0.31989 0.030731 0.003566 0.003342 0.031105
Acidification mol H+ eq 3.946273 1.464943 0.134097 0.013666 0.015385 0.119542
Eutrophication kg N eq 6.75E-02 0.003562 0.000188 0.000181 0.000179 0.001151
Carcinogenics CTUh 6.43E-07 2.82E-07 2.83E-08 2.08E-09 3.80E-09 9.90E-09
Non
carcinogenics CTUh 1.28E-06 7.75E-08 6.84E-09 3.70E-09 4.46E-09 3.25E-08
Respiratory
effects
kg PM10
eq 0.015471 0.005424 0.000499 5.25E-05 6.48E-05 0.000517
Ecotoxicity CTUe 25.08131 11.09701 1.190738 0.064803 0.12206 0.249517

82
Impact
category Unit
Aluminu
m,
primary,
at
plant/RE
R U
Printing color,
offset, 47.5%
solvent, at
plant/RER U
(NE. electricity
mix)
Solid
unbleached
board, SUB, at
plant/RER U
(Vermont
electricity mix)
Extrusion, plastic
film/RER U (VT.
electricity mix)
Thermoforming,
with
calendering/RER
U (VT. electricity
mix)
Calendering,
rigid sheets/RER
U (VT. electricity
mix)
Ozone
depletion
kg CFC-11
eq 6.34E-08 2.38E-08 2.67E-07 8.82E-08 1.14E-07 4.87E-09
Global
warming kg CO2 eq 0.822431 0.058737 2.40856 1.212382 1.659992 0.051903
Smog kg O3 eq 0.031586 0.003215 0.250593 0.026685 0.050207 0.001458
Acidification mol H+ eq 0.185643 0.018239 1.156308 0.377776 0.564049 0.017773
Eutrophication kg N eq 0.002651 0.000277 0.007298 0.000754 0.001288 2.97E-05
Carcinogenics CTUh 2.16E-07 1.30E-09 3.72E-08 1.72E-08 2.82E-08 5.63E-10
Non
carcinogenics CTUh 1.47E-07 8.69E-09 7.54E-07 9.60E-08 1.30E-07 4.42E-09
Respiratory
effects
kg PM10
eq 0.00149 6.90E-05 0.00536 0.001304 0.001974 6.13E-05
Ecotoxicity CTUe 2.418775 0.075282 3.281315 1.413777 1.901957 0.043227

83
Impact
category Unit
Sheet
rolling,
aluminum/R
ER U (NE.
electricity
mix)
Production
of carton
board boxes,
offset
printing, at
plant/CH U
(VT. mix)
Transport,
lorry 7.5-
16t,
EURO5/RER
U
Transport,
transoceanic
freight
ship/OCE U
Waste
collection
(Transport,
lorry 7.5-
16t,
EURO5/RER
U)
Landfill
Solid
unbleached
board, SUB,
at plant/RER
U (NE.
electricity
mix)
Ozone
depletion
kg CFC-11
eq 3.64E-09 1.99E-07 2.95E-07 7.53E-09 1.11E-08 3.13E-09 -1.67E-07
Global
warming kg CO2 eq 0.035836 0.936971 1.481428 0.04448 0.055484 0.349057 -1.50641
Smog kg O3 eq 0.000857 0.036257 0.118743 0.017435 0.004447 0.00515 -0.15673
Acidification mol H+ eq 0.009286 0.25653 0.252482 6.19E-02 9.46E-03 0.012411 -0.7232
Eutrophicati
on kg N eq 4.49E-05 0.002222 7.47E-04 5.54E-05 2.80E-05 5.14E-02 -0.00456
Carcinogeni
cs CTUh 2.88E-09 1.72E-08 1.88E-09 7.58E-11 7.02E-11 1.67E-08 -2.33E-08
Non
carcinogenic
s
CTUh 3.25E-09 1.05E-07 4.72E-08 8.80E-10 1.77E-09 3.26E-07 -4.71E-07
Respiratory
effects kg PM10 eq 4.09E-05 0.000936 0.000769 0.00018 2.88E-05 5.17E-05 -0.00335
Ecotoxicity CTUe 0.043307 0.806544 0.332913 0.00432 0.012469 4.075571 -2.05227

84
Appendix B Characterization Results of Aluminum Pod
Title: Analyzing 1,000 p 'Aluminum Pod 14% recycling'
Method: TRACI 2 V4.00
Indicator: Characterization
Impact category Unit
Aluminum,
primary, at
plant/RER
U
Polyethylene,
LDPE,
granulate, at
plant/RER U
Polyethylene
terephthalate,
granulate,
amorphous,
at plant/RER
U
Solid
bleached
board,
SBB, at
plant/RER
U
Sheet rolling,
aluminum/RER
U
Extrusion,
plastic
film/RER
U
Calendering,
rigid
sheets/RER
S
Ozone
depletion
kg CFC-11
eq. 1.70E-06 6.69E-11 2.92E-09 4.65E-07 2.34E-09 3.64E-09 3.43E-09
Global warming kg CO2 eq. 22.01073 0.186425 0.050682 4.438948 0.024916 0.054284 0.040378
Smog kg O3 eq. 0.845349 0.00839 0.00191 0.467749 0.000843 0.001971 0.00179
Acidification mol H+ eq. 4.968357 0.036609 0.008792 1.557339 0.004569 0.0106 0.008785
Eutrophication kg N eq. 0.070947 5.13E-05 0.000102 0.023446 0.000113 0.000291 0.000228
Carcinogenics CTUh 5.79E-06 7.74E-09 2.17E-09 1.89E-07 2.51E-09 2.97E-09 2.91E-09
Non
carcinogenics CTUh 3.92E-06 1.87E-09 2.55E-09 9.07E-07 3.10E-09 7.00E-09 6.49E-09
Respiratory
effects
kg PM10
eq. 0.03988 0.000136 3.70E-05 0.009036 2.44E-05 4.66E-05 4.09E-05
Ecotoxicity CTUe 64.7337 0.325079 0.069748 6.126686 0.033052 0.072754 0.052363

85
Cold impact
extrusion,
steel, 1
stroke/RER
U
Anodizin
g,
aluminu
m
sheet/RE
R U
Production of
carton board
boxes, offset
printing, at
plant/CH U
Transport,
lorry 7.5-
16t,
EURO5/RE
R U
Transport,
transoceani
c freight
ship/OCE U
Waste
Collection
(Transport,
lorry 7.5-16t,
EURO5/RER U)
Waste
scenario/US
U
(Incineratio
n excluded)
Aluminu
m,
primary,
at
plant/RE
R U
Solid bleached
board, SBB, at
plant/RER U
(ON. electricity
mix)
1.66E-07 1.48E-06 3.08E-07 1.72E-07 1.33E-07 1.18E-08 6.32E-09 -2.31E-
07 -3.33E-07
1.46994 17.59151 1.165796 0.863704 0.787248 0.059183 0.054495 -2.99498 -2.23703
0.037711 0.665935 0.055149 0.06923 0.30858 0.004744 0.009272 -0.11503 -0.27116
0.181961 4.110336 0.236858 0.147203 1.095371 0.010087 0.049298 -0.67604 -0.88569
0.005048 0.099369 0.004287 0.000435 0.00098 2.98E-05 0.025816 -0.00965 -0.0105
7.69E-08 1.00E-06 3.27E-08 1.09E-09 1.34E-09 7.49E-11 5.63E-09 -7.88E-
07 -8.02E-08
1.76E-07 2.70E-06 1.64E-07 2.75E-08 1.56E-08 1.89E-09 1.79E-07 -5.34E-
07 -5.09E-07
0.000672 0.016785 0.000991 0.000449 0.003182 3.07E-05 0.000148 -0.00543 -0.00518
1.916641 17.47744 1.112585 0.194095 0.076468 0.0133 0.662084 -8.80826 -3.34542

86
Appendix C Characterization Results of Biodegradable Pod
Title: Analyzing 1,000 p 'Biodegradable Pod 40% Composting'
Method: TRACI 2 V4.00
Indicator: Characterization
Impact
category Unit
Polylactide,
granulate, at
plant/GLO U
(Compost)
Polyethylene,
LDPE,
granulate, at
plant/RER U
Kraft paper,
unbleached, at
plant/RER U
(ON. mix)
Solid unbleached
board, SUB, at
plant/RER U (ON.
electricity mix)
Injection
molding/RER U
(ON. electricity
mix)
Thermoforming,
with
calendering/RER
U (ON. mix)
Ozone
depletion
kg CFC-11
eq 7.42E-07 9.47E-10 3.34E-08 5.91E-07 1.81E-06 8.48E-08
Global
warming kg CO2 eq 6.289934 2.639272 0.145541 2.791637 1.469409 0.391045
Smog kg O3 eq 0.217324 0.118775 0.02353 0.423532 0.056821 0.019198
Acidificatio
n mol H+ eq 1.229102 0.51829 0.077802 1.405527 0.271512 0.097832
Eutrophica
tion kg N eq 0.048896 0.000726 0.000658 0.012206 0.000969 0.000445
Carcinoge
nics CTUh 1.81E-07 1.10E-07 3.56E-09 5.55E-08 2.13E-08 1.05E-08
Non
carcinogen
ics
CTUh -1.78E-07 2.64E-08 6.69E-08 1.29E-06 1.27E-07 5.31E-08
Respirator
y effects
kg PM10
eq 0.00336 0.001928 0.000426 0.007513 0.001076 0.00042
Ecotoxicity CTUe 11.36143 4.602237 0.226216 4.8869 0.988073 0.650824
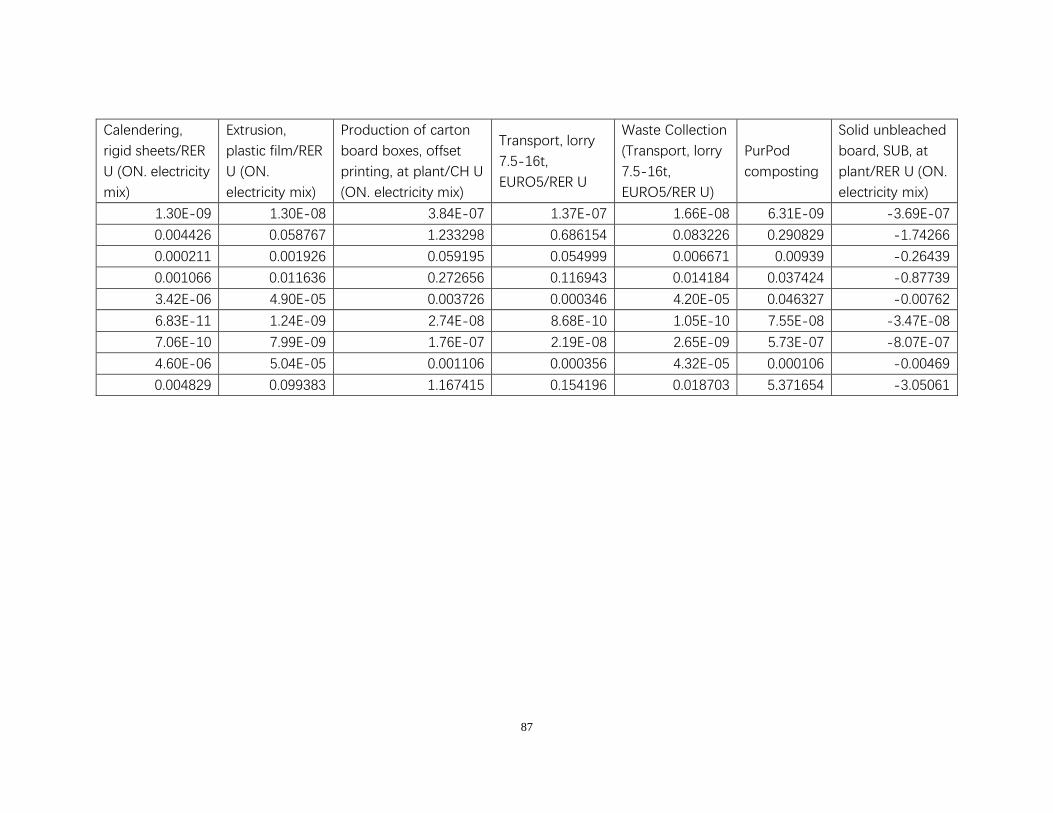
87
Calendering,
rigid sheets/RER
U (ON. electricity
mix)
Extrusion,
plastic film/RER
U (ON.
electricity mix)
Production of carton
board boxes, offset
printing, at plant/CH U
(ON. electricity mix)
Transport, lorry
7.5-16t,
EURO5/RER U
Waste Collection
(Transport, lorry
7.5-16t,
EURO5/RER U)
PurPod
composting
Solid unbleached
board, SUB, at
plant/RER U (ON.
electricity mix)
1.30E-09 1.30E-08 3.84E-07 1.37E-07 1.66E-08 6.31E-09 -3.69E-07
0.004426 0.058767 1.233298 0.686154 0.083226 0.290829 -1.74266
0.000211 0.001926 0.059195 0.054999 0.006671 0.00939 -0.26439
0.001066 0.011636 0.272656 0.116943 0.014184 0.037424 -0.87739
3.42E-06 4.90E-05 0.003726 0.000346 4.20E-05 0.046327 -0.00762
6.83E-11 1.24E-09 2.74E-08 8.68E-10 1.05E-10 7.55E-08 -3.47E-08
7.06E-10 7.99E-09 1.76E-07 2.19E-08 2.65E-09 5.73E-07 -8.07E-07
4.60E-06 5.04E-05 0.001106 0.000356 4.32E-05 0.000106 -0.00469
0.004829 0.099383 1.167415 0.154196 0.018703 5.371654 -3.05061

88
Appendix D Weighing Results of Three Coffee Pods
Title: Comparing 1,000 p 'Polystyrene Pod', 1,000 p 'Aluminum Pod' and 1,000 p 'Biodegradable Pod'
Method: ReCiPe Endpoint (E) V1.06 / World ReCiPe E/A
Indicator: Weighting
Impact category Unit Polystyrene Pod Aluminum Pod Biodegradable Pod
Total Pt 4.549212 13.77414 4.434934
Climate change Human Health Pt 0.929125 2.645079 0.795137
Ozone depletion Pt 4.09E-05 0.000132 0.00011
Human toxicity Pt 2.141543 8.760281 2.529279
Photochemical oxidant formation Pt 4.00E-05 8.14E-05 3.67E-05
Particulate matter formation Pt 0.094989 0.321374 0.078099
Ionising radiation Pt 0.000769 0.004708 0.002121
Climate change Ecosystems Pt 0.050916 0.145005 0.043574
Terrestrial acidification Pt 0.000184 0.000504 0.000157
Freshwater eutrophication Pt 9.93E-06 0.000174 3.07E-05
Terrestrial ecotoxicity Pt 0.00027 0.000866 0.000638
Freshwater ecotoxicity Pt 1.07E-05 2.47E-05 1.28E-05
Marine ecotoxicity Pt 2.19E-05 0.00011 3.70E-05
Agricultural land occupation Pt 0.026884 0.025705 0.048821
Urban land occupation Pt 0.00076 0.000947 0.001439
Natural land transformation Pt 0.017615 0.050258 0.028917
Metal depletion Pt 3.40E-05 0.00015 2.83E-05
Fossil depletion Pt 1.285998 1.818743 0.906496