Embed Size (px)
Citation preview
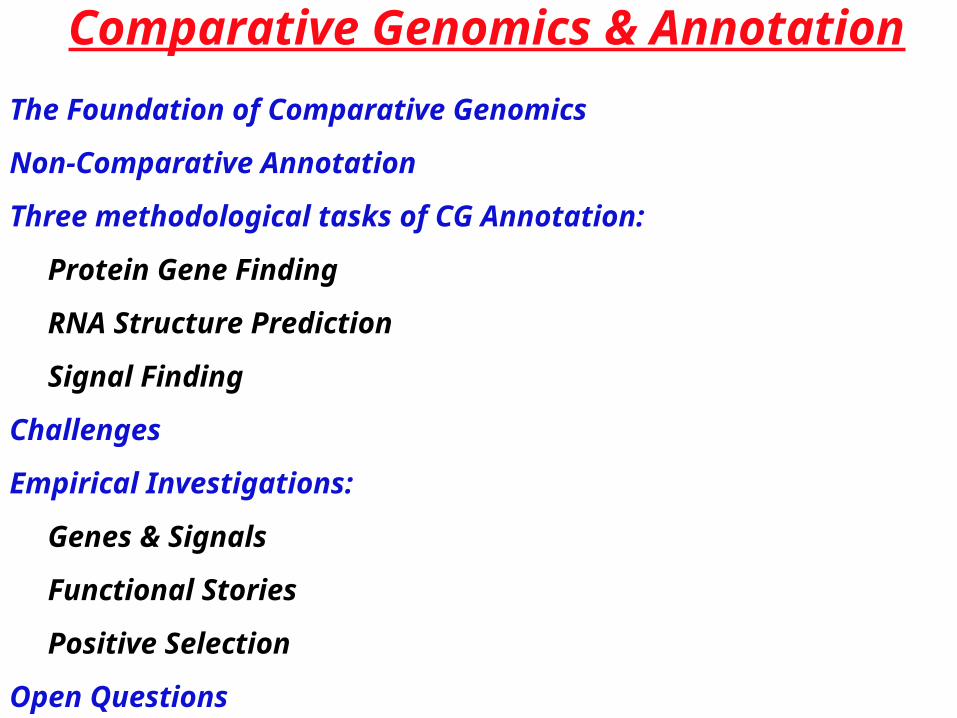
Comparative Genomics & Annotation
The Foundation of Comparative Genomics
Non-Comparative Annotation
Three methodological tasks of CG Annotation:
Protein Gene Finding
RNA Structure Prediction
Signal Finding
Challenges
Empirical Investigations:
Genes & Signals
Functional Stories
Positive Selection
Open Questions
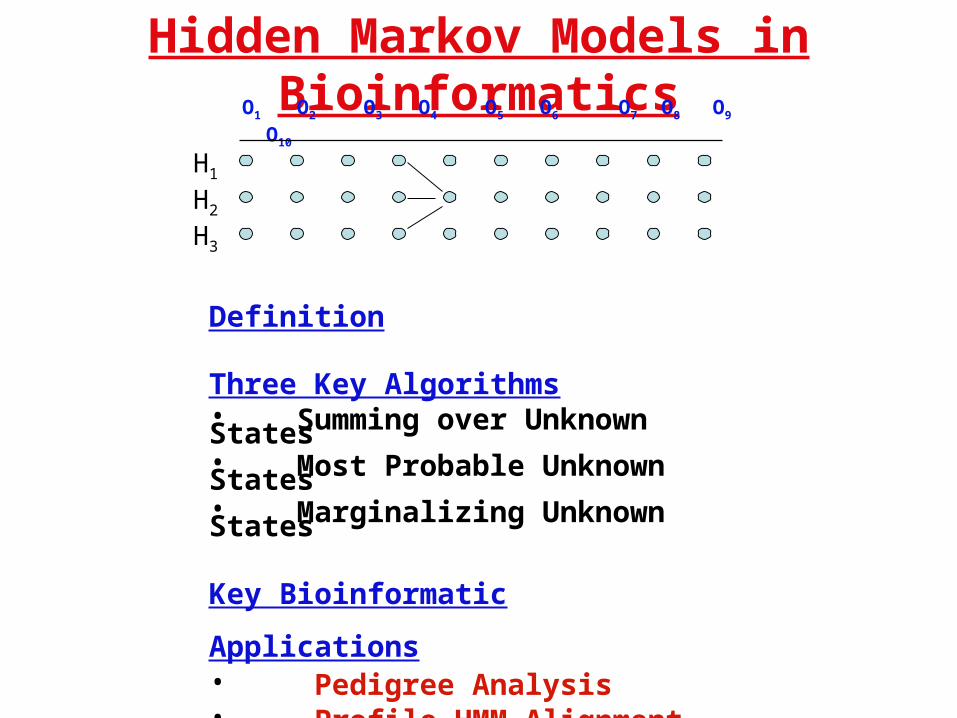
Hidden Markov Models in Bioinformatics
Definition
Three Key Algorithms• Summing over Unknown States• Most Probable Unknown States• Marginalizing Unknown States
Key Bioinformatic Applications• Pedigree Analysis• Profile HMM Alignment• Fast/Slowly Evolving States• Statistical Alignment
O1 O2 O3 O4 O5 O6 O7 O8 O9 O10
H1
H2
H3
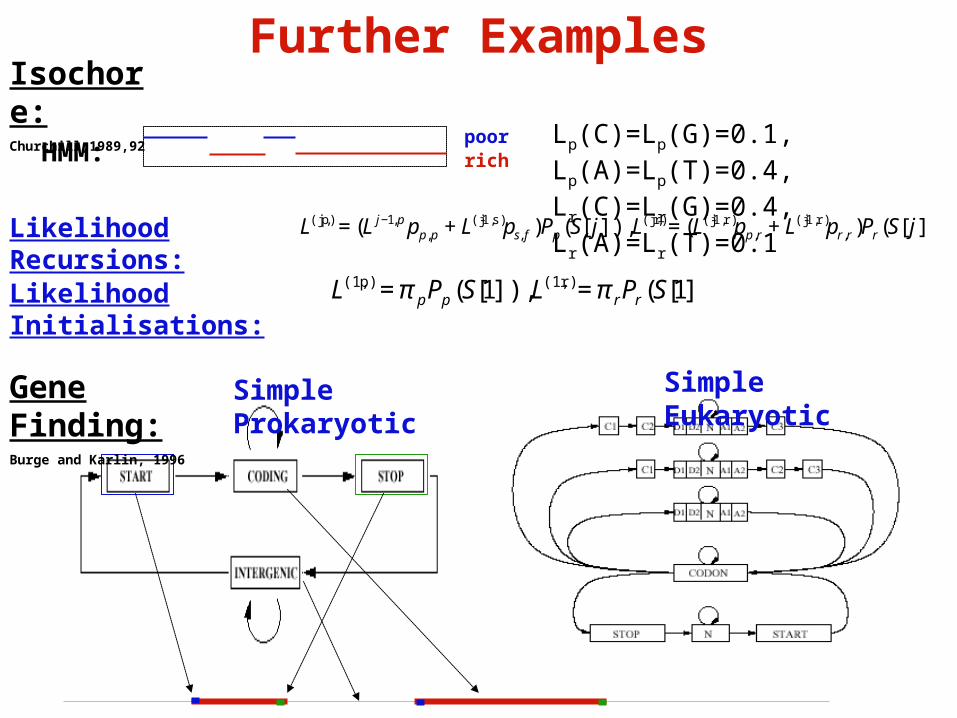
Further Examples
Simple Prokaryotic Simple EukaryoticGene Finding:Burge and Karlin, 1996
Isochore:Churchill,1989,92
€
L(j,p) = (L j−1,p pp,p + L(j-1,s)ps, f )Pp (S[ j]), L(j,r) = (L(j-1,r) pp,r + L(j-1,r)pr,r)Pr (S[ j])Likelihood Recursions:
Likelihood Initialisations:
€
L(1,p) = π pPp (S[1]), L(1,r) = π rPr (S[1])
poorrichHMM:
Lp(C)=Lp(G)=0.1, Lp(A)=Lp(T)=0.4, Lr(C)=Lr(G)=0.4, Lr(A)=Lr(T)=0.1
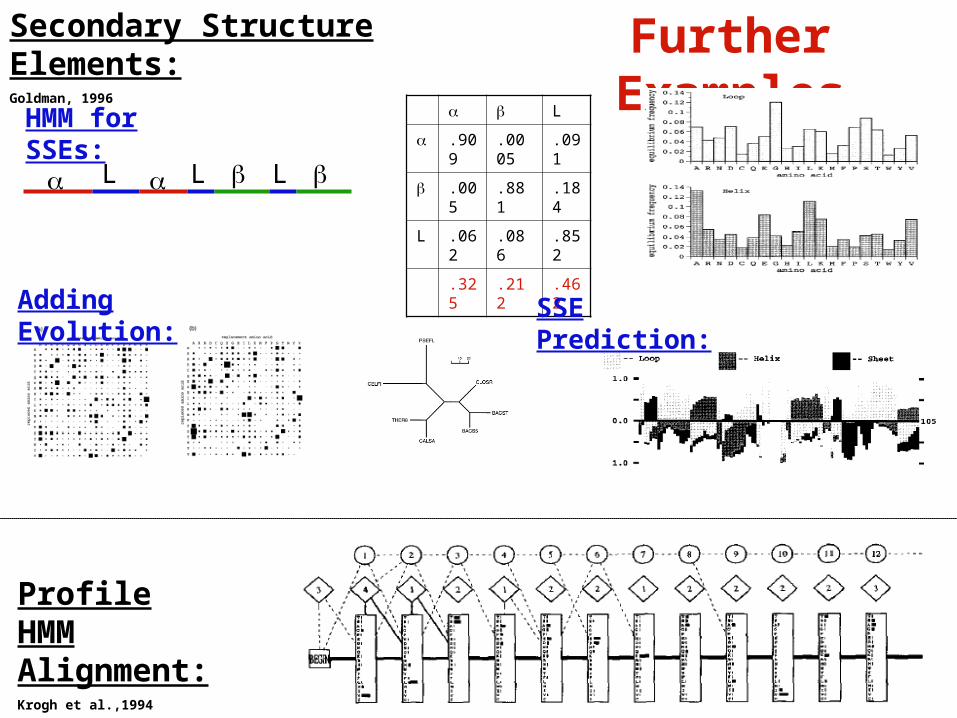
Further ExamplesSecondary Structure Elements:Goldman, 1996
Profile HMM Alignment:Krogh et al.,1994
L
.909
.0005
.091
.005
.881 .184
L .062
.086 .852
.325
.212 .462
L L L
HMM for SSEs:
Adding Evolution: SSE Prediction:
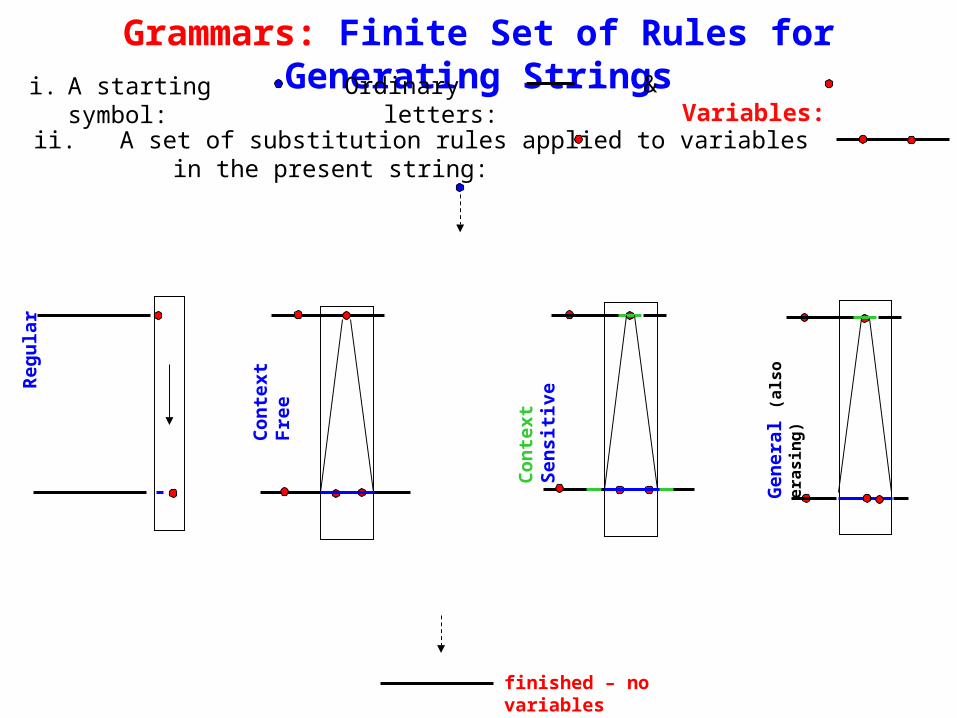
Grammars: Finite Set of Rules for Generating StringsR
egu
lar
finished – no variables
Gen
eral
(a
lso
era
sin
g)
Co
nte
xt F
ree
Co
nte
xt S
ensi
tive
Ordinary letters: & Variables:
i. A starting symbol:
ii. A set of substitution rules applied to variables in the present string:
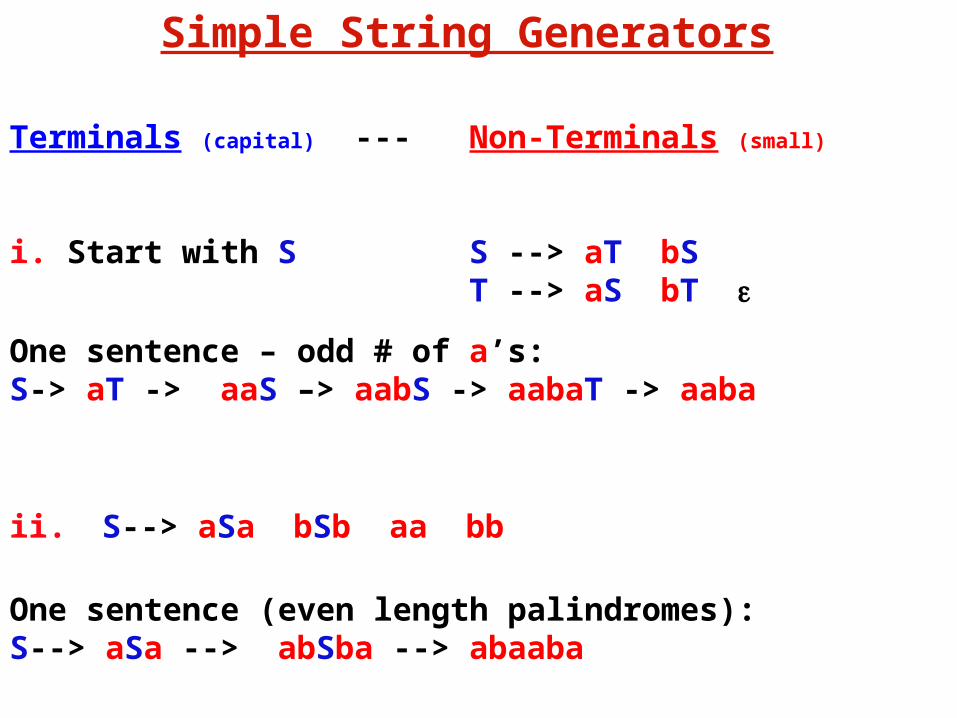
Simple String Generators
Terminals (capital) --- Non-Terminals (small)
i. Start with S S --> aT bS T --> aS bT
One sentence – odd # of a’s:S-> aT -> aaS –> aabS -> aabaT -> aaba
ii. S--> aSa bSb aa bb
One sentence (even length palindromes):S--> aSa --> abSba --> abaaba
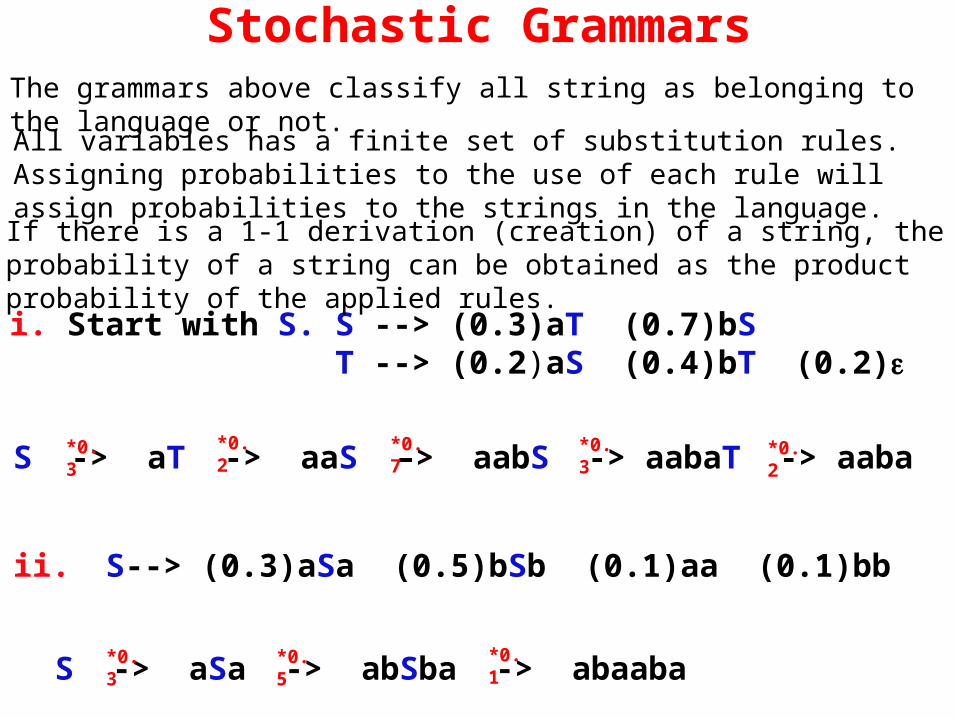
Stochastic GrammarsThe grammars above classify all string as belonging to the language or not.
All variables has a finite set of substitution rules. Assigning probabilities to the use of each rule will assign probabilities to the strings in the language.
S -> aSa -> abSba -> abaaba
i. Start with S. S --> (0.3)aT (0.7)bS T --> (0.2)aS (0.4)bT (0.2)
If there is a 1-1 derivation (creation) of a string, the probability of a string can be obtained as the product probability of the applied rules.
S -> aT -> aaS –> aabS -> aabaT -> aaba
ii. S--> (0.3)aSa (0.5)bSb (0.1)aa (0.1)bb
*0.3
*0.3 *0.2 *0.7 *0.3 *0.2
*0.5 *0.1
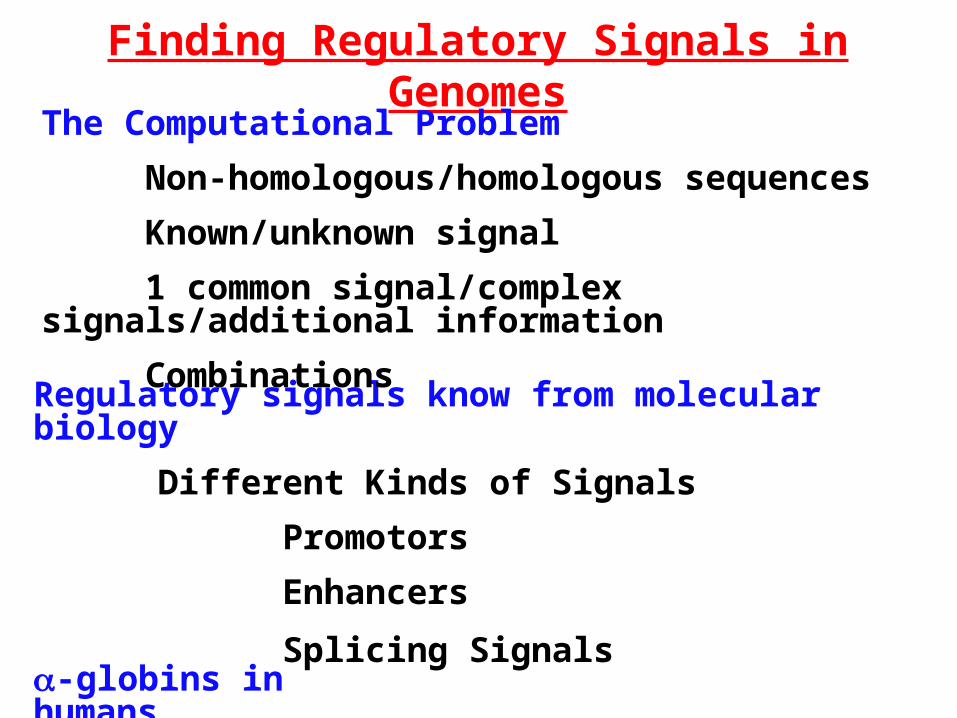
Finding Regulatory Signals in Genomes
Regulatory signals know from molecular biology
Different Kinds of Signals
Promotors
Enhancers
Splicing Signals
The Computational Problem
Non-homologous/homologous sequences
Known/unknown signal
1 common signal/complex signals/additional information
Combinations
-globins in humans
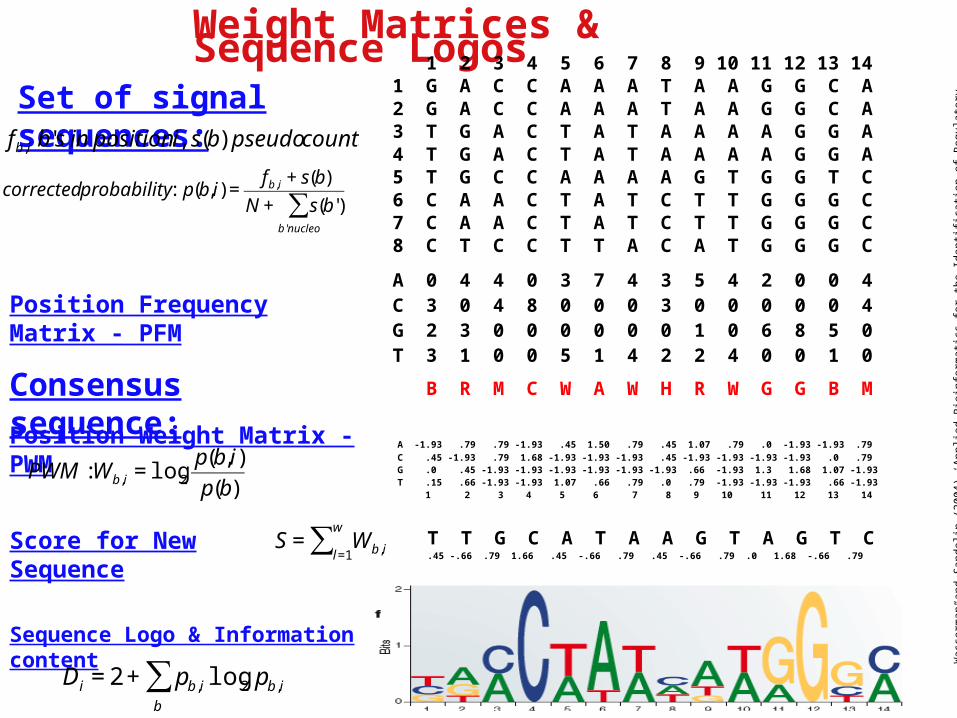
Weight Matrices & Sequence Logos
Was
serm
an a
nd S
ande
lin
(200
4) ‘
App
lied
Bio
info
rmat
ics
for
the
Iden
tifi
cati
on o
f R
egul
ator
y E
lem
ents
” N
atur
e R
evie
w G
enet
ics
5.4.
276
1 2 3 4 5 6 7 8 9 10 11 12 13 141 G A C C A A A T A A G G C A2 G A C C A A A T A A G G C A3 T G A C T A T A A A A G G A4 T G A C T A T A A A A G G A5 T G C C A A A A G T G G T C6 C A A C T A T C T T G G G C7 C A A C T A T C T T G G G C8 C T C C T T A C A T G G G C
Set of signal sequences:
B R M C W A W H R W G G B MConsensus sequence:
A 0 4 4 0 3 7 4 3 5 4 2 0 0 4C 3 0 4 8 0 0 0 3 0 0 0 0 0 4G 2 3 0 0 0 0 0 0 1 0 6 8 5 0T 3 1 0 0 5 1 4 2 2 4 0 0 1 0
Position Frequency Matrix - PFM€
corrected probability : p(b,i) =fb,i + s(b)
N + s(b')b'nucleo
∑€
fb,i b's in position i, s(b) pseudo count.
A -1.93 .79 .79 -1.93 .45 1.50 .79 .45 1.07 .79 .0 -1.93 -1.93 .79C .45 -1.93 .79 1.68 -1.93 -1.93 -1.93 .45 -1.93 -1.93 -1.93 -1.93 .0 .79G .0 .45 -1.93 -1.93 -1.93 -1.93 -1.93 -1.93 .66 -1.93 1.3 1.68 1.07 -1.93T .15 .66 -1.93 -1.93 1.07 .66 .79 .0 .79 -1.93 -1.93 -1.93 .66 -1.93 1 2 3 4 5 6 7 8 9 10 11 12 13 14
Position Weight Matrix - PWM
€
PWM :Wb,i = log2
p(b,i)
p(b)
T T G C A T A A G T A G T C.45 -.66 .79 1.66 .45 -.66 .79 .45 -.66 .79 .0 1.68 -.66 .79
Score for New Sequence
€
S = Wb,il=1
w
∑
Sequence Logo & Information content
€
Di = 2 + pb,i log2 pb,i
b
∑
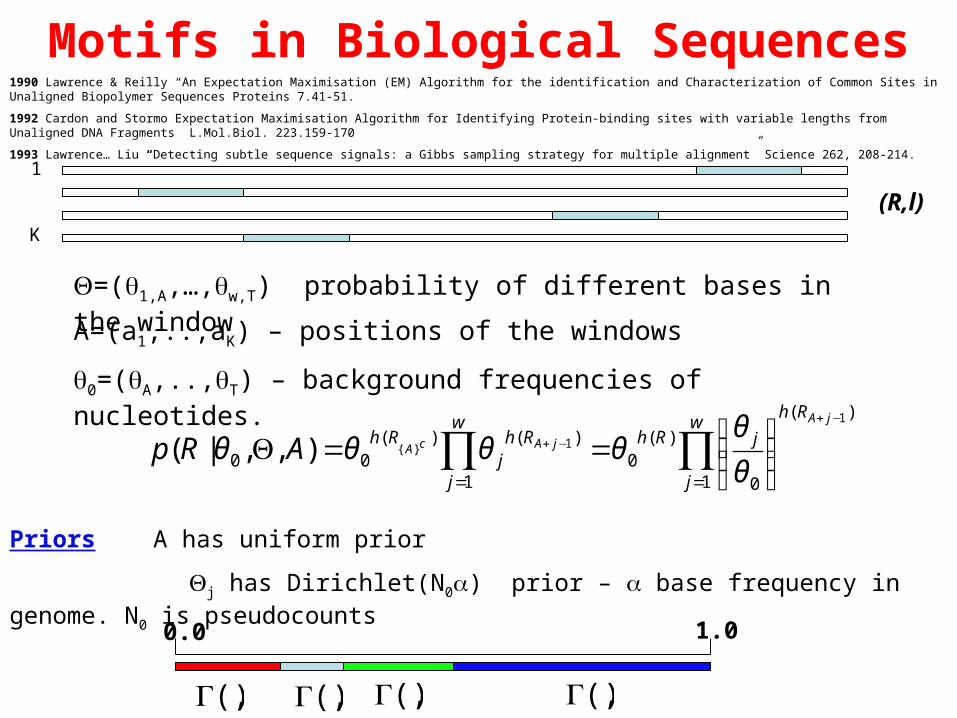
Motifs in Biological Sequences1990 Lawrence & Reilly “An Expectation Maximisation (EM) Algorithm for the identification and Characterization of Common Sites in Unaligned Biopolymer Sequences Proteins 7.41-51.
1992 Cardon and Stormo Expectation Maximisation Algorithm for Identifying Protein-binding sites with variable lengths from Unaligned DNA Fragments L.Mol.Biol. 223.159-170
1993 Lawrence… Liu “Detecting subtle sequence signals: a Gibbs sampling strategy for multiple alignment” Science 262, 208-214.
(R,l)
1
K
A=(a1,..,aK) – positions of the windows
∏∏==
−+
−+
⎟⎟⎠
⎞⎜⎜⎝
⎛==Θ
w
j
Rh
jRhw
j
Rhj
RhjA
jAcAARp1
)(
0
)(0
1
)()(00
1
1}{),,|(θ
θθθθθ
Priors A has uniform prior
Θj has Dirichlet(N0) prior – base frequency in genome. N0 is pseudocounts
0.0 1.0
€
Γ(,)
€
Γ(,)
€
Γ(,)
€
Γ(,)
Θ=(1,A,…,w,T) probability of different bases in the window
0=(A,..,T) – background frequencies of nucleotides.
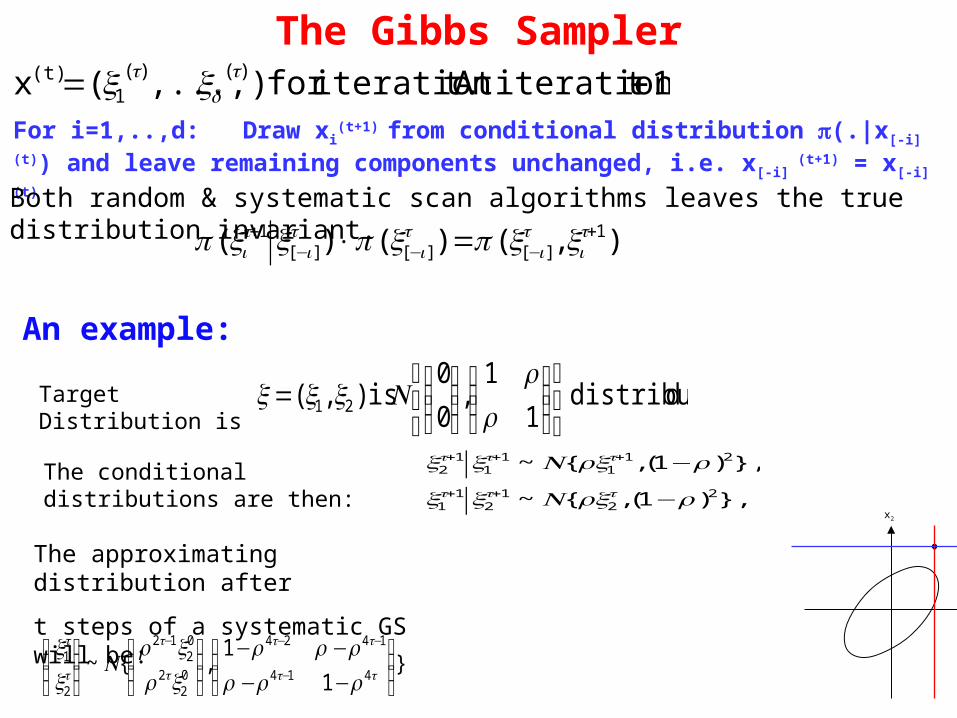
The Gibbs Sampler1 titerationAt t.iterationfor ),...,(x )()(
1(t) += t
dt xx
For i=1,..,d: Draw xi(t+1) from conditional distribution (.|x[-i]
(t)) and leave remaining components unchanged, i.e. x[-i]
(t+1) = x[-i] (t)
),()()( 1][][][
1 +−−−
+ =× ti
ti
ti
ti
ti xxxxx
Both random & systematic scan algorithms leaves the true distribution invariant.
},)1(,{~
},)1(,{~
22
12
11
211
11
12
ρρ
ρρ
−
−++
+++
ttt
ttt
xNxx
xNxxThe conditional distributions are then:
}1
1,{~
414
1424
02
2
02
12
2
1
⎟⎟⎠
⎞⎜⎜⎝
⎛
−−−−
⎟⎟⎠
⎞⎜⎜⎝
⎛⎟⎟⎠
⎞⎜⎜⎝
⎛−
−−−
tt
tt
t
t
t
t
xx
Nxx
ρρρρρρ
ρρ
The approximating distribution after
t steps of a systematic GS will be:
An example:
d.distribute 1
1,
0
0 is ),( 21
⎭⎬⎫
⎩⎨⎧
⎟⎟⎠
⎞⎜⎜⎝
⎛⎟⎟⎠
⎞⎜⎜⎝
⎛=
ρρ
NxxxTarget Distribution is
x2
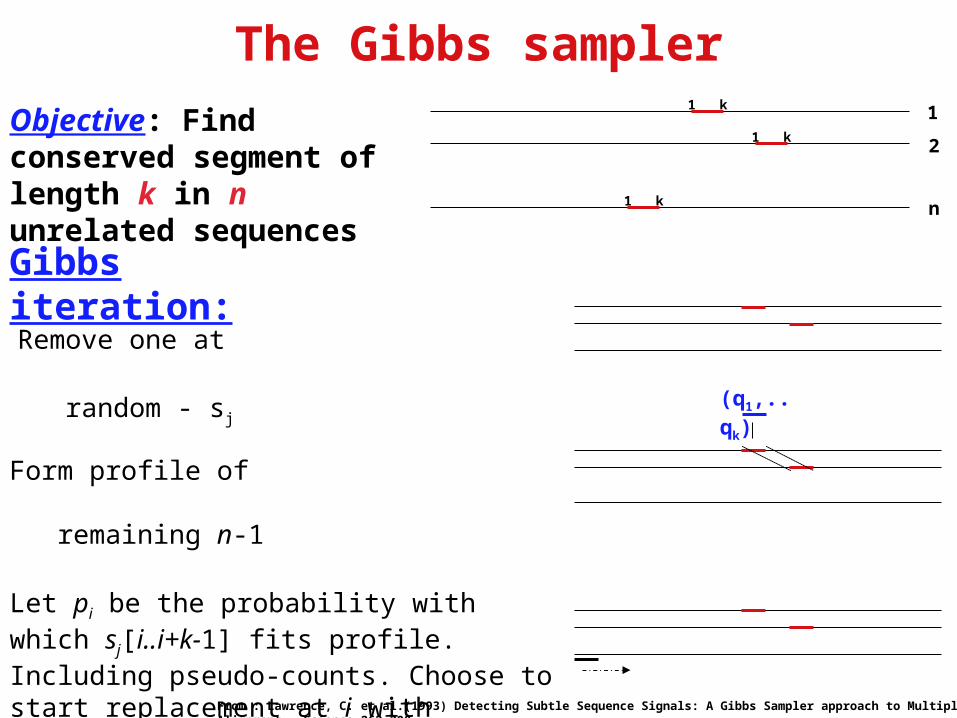
The Gibbs sampler
Objective: Find conserved segment of length k in n unrelated sequences
n
2
1
1 k
1 k
1 k
Gibbs iteration:
Remove one at random - sj
Form profile of remaining n-1
(q1,..qk)
Let pi be the probability with which sj[i..i+k-1] fits profile. Including pseudo-counts. Choose to start replacement at i with probability proportional to pi
From : Lawrence, C. et al.(1993) Detecting Subtle Sequence Signals: A Gibbs Sampler approach to Multiple Alignment. Science 262.208-
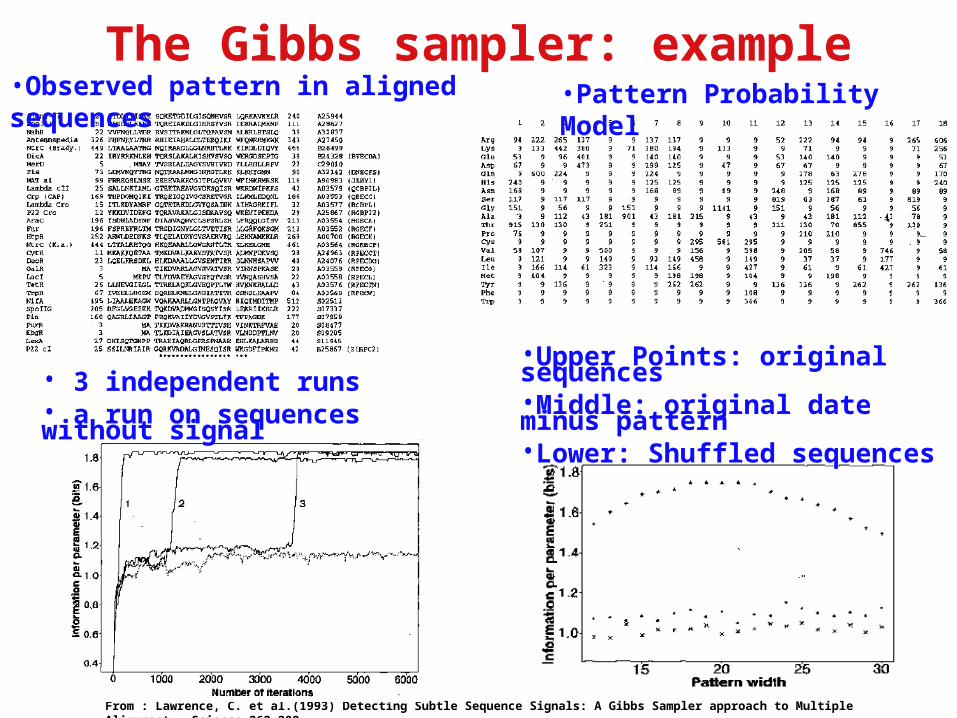
The Gibbs sampler: example
From : Lawrence, C. et al.(1993) Detecting Subtle Sequence Signals: A Gibbs Sampler approach to Multiple Alignment. Science 262.208-
•Observed pattern in aligned sequences •Pattern Probability Model
•Upper Points: original sequences•Middle: original date minus pattern•Lower: Shuffled sequences
• 3 independent runs• a run on sequences without signal
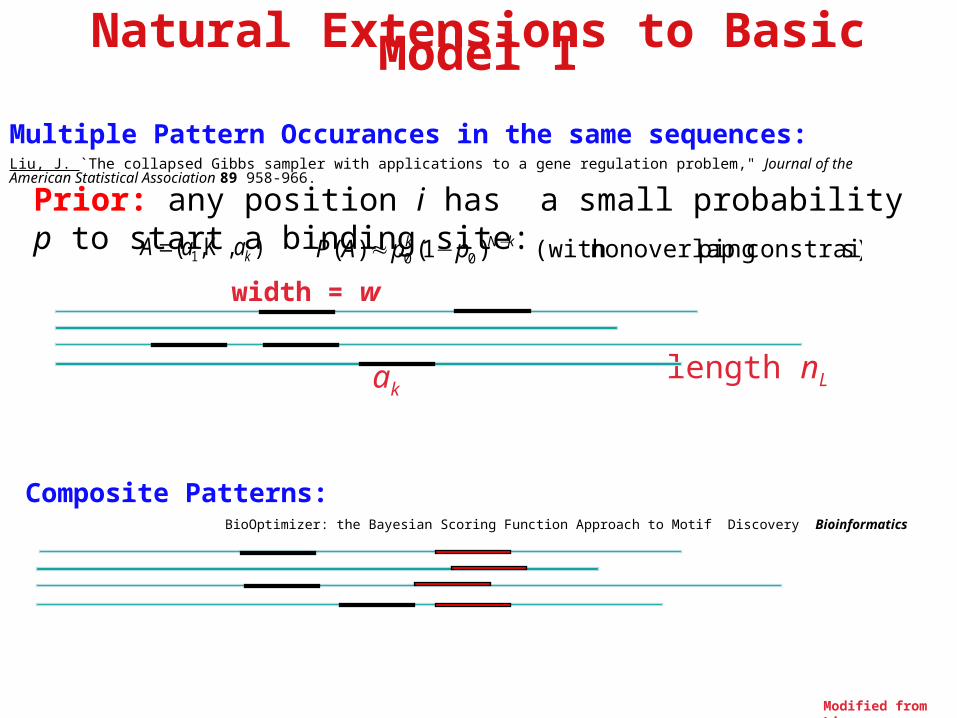
Natural Extensions to Basic Model I
Multiple Pattern Occurances in the same sequences:Liu, J. `The collapsed Gibbs sampler with applications to a gene regulation problem," Journal of the American Statistical Association 89 958-966.
width = w
length nLak
),,( 1 kaaA K= s)constraint pingnonoverlap(with )1()( 00kNk ppAP −−≈
Prior: any position i has a small probability p to start a binding site:
Modified from Liu
Composite Patterns: BioOptimizer: the Bayesian Scoring Function Approach to Motif Discovery Bioinformatics
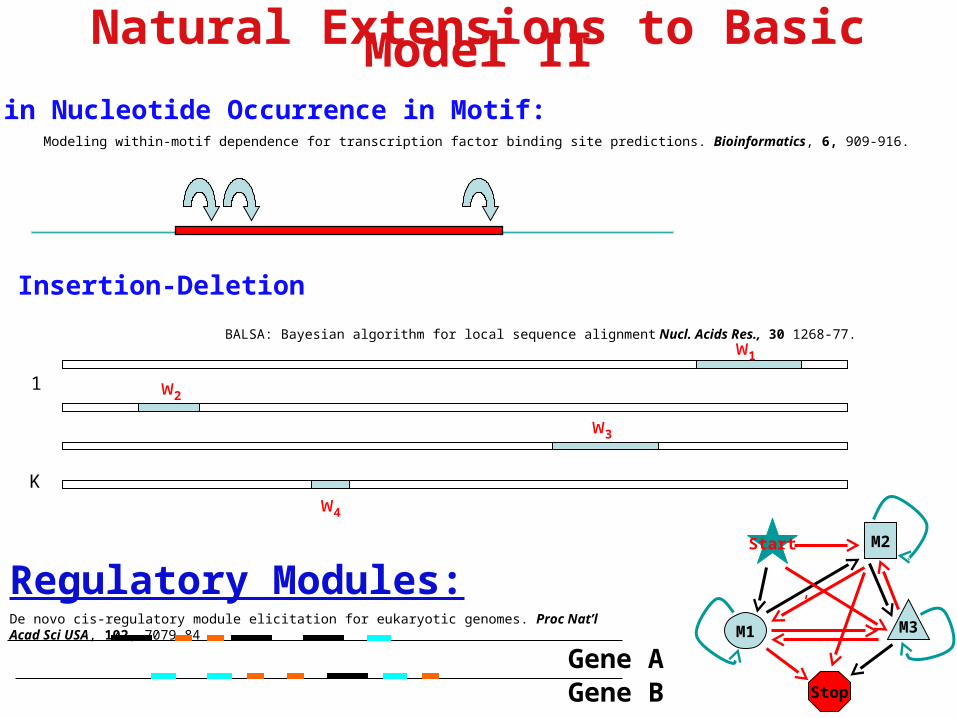
Natural Extensions to Basic Model II
Correlated in Nucleotide Occurrence in Motif: Modeling within-motif dependence for transcription factor binding site predictions. Bioinformatics, 6, 909-916.
Regulatory Modules:De novo cis-regulatory module elicitation for eukaryotic genomes. Proc Nat’l Acad Sci USA, 102, 7079-84
M1
M2
M3
Stop
Start 12p
21p
Gene AGene B
Insertion-Deletion
BALSA: Bayesian algorithm for local sequence alignment Nucl. Acids Res., 30 1268-77.
1
K
w1
w2
w3
w4
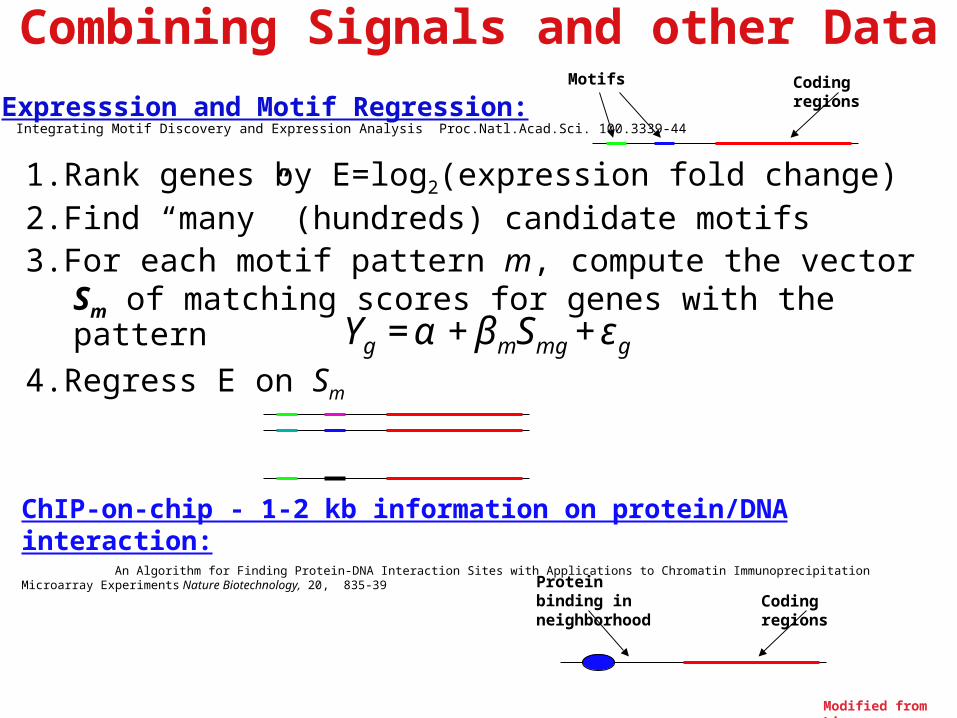
Combining Signals and other Data
Modified from Liu
1.Rank genes by E=log2(expression fold change)2.Find “many” (hundreds) candidate motifs
3.For each motif pattern m, compute the vector Sm of matching scores for genes with the pattern
4.Regress E on Sm
€
Yg = α + βmSmg + εg
Expresssion and Motif Regression: Integrating Motif Discovery and Expression Analysis Proc.Natl.Acad.Sci. 100.3339-44
Motifs Coding regions
ChIP-on-chip - 1-2 kb information on protein/DNA interaction: An Algorithm for Finding Protein-DNA Interaction Sites with Applications to Chromatin Immunoprecipitation Microarray Experiments Nature Biotechnology, 20, 835-39
Protein binding in neighborhood Coding regions
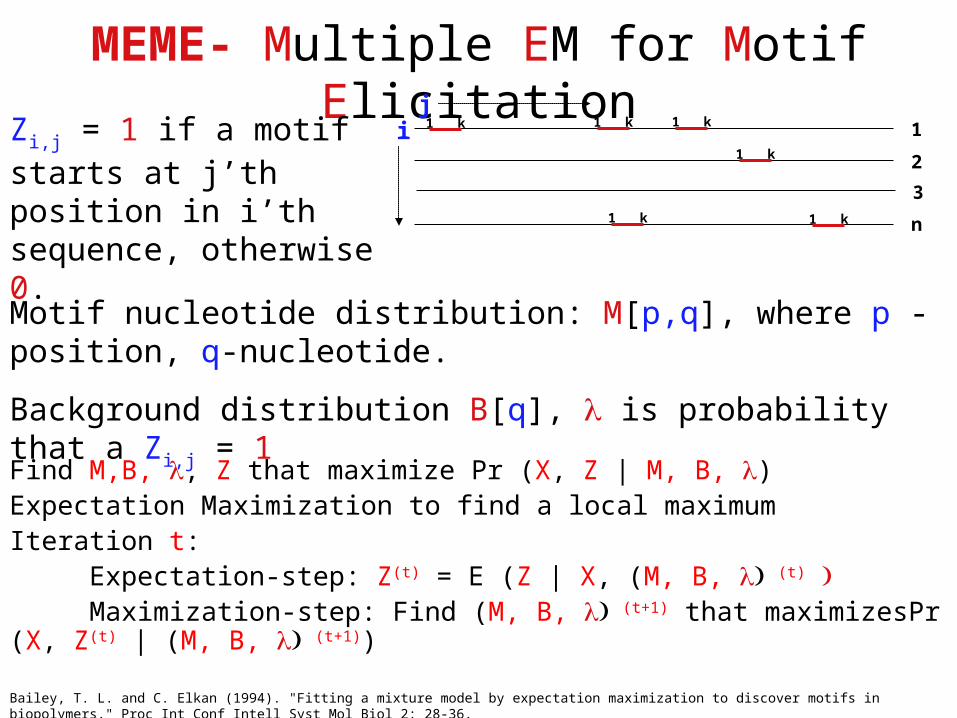
MEME- Multiple EM for Motif Elicitation
n
2
1
1 k
1 k
1 k
1 k
1 k1 k
3
Zi,j = 1 if a motif starts at j’th position in i’th sequence, otherwise 0.
ij
Motif nucleotide distribution: M[p,q], where p - position, q-nucleotide.
Background distribution B[q], is probability that a Zi,j = 1
Find M,B, , Z that maximize Pr (X, Z | M, B, )Expectation Maximization to find a local maximumIteration t: Expectation-step: Z(t) = E (Z | X, (M, B, (t) Maximization-step: Find (M, B, (t+1) that maximizesPr (X, Z(t) | (M, B, (t+1))
Bailey, T. L. and C. Elkan (1994). "Fitting a mixture model by expectation maximization to discover motifs in biopolymers." Proc Int Conf Intell Syst Mol Biol 2: 28-36.
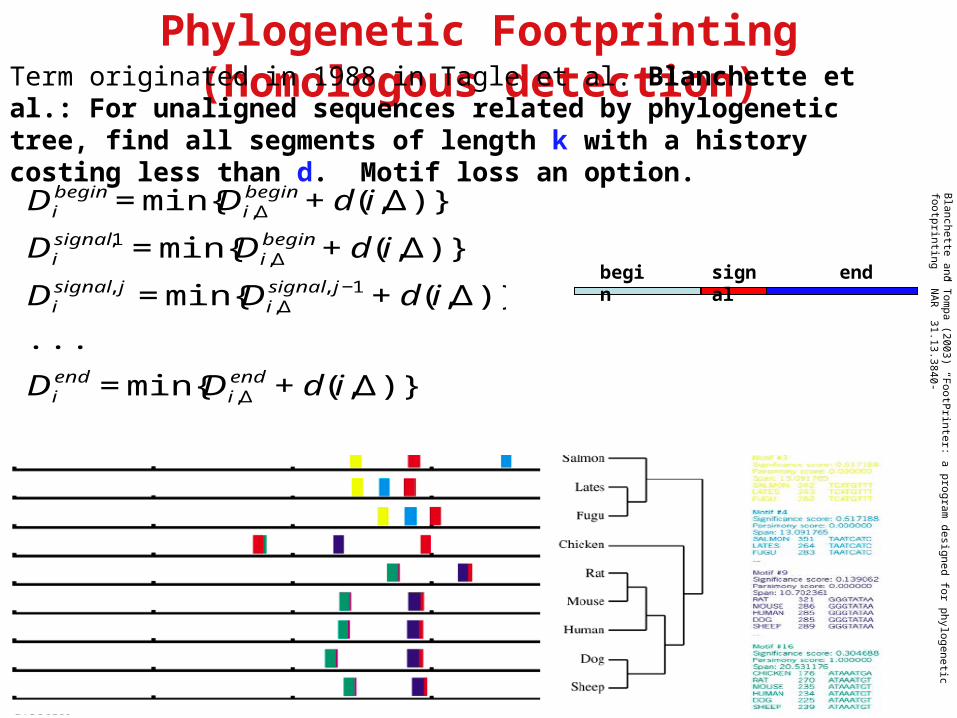
Phylogenetic Footprinting (homologous detection)B
lanchette and Tom
pa (2003) “FootP
rinter: a program designed for phylogenetic footprinting” N
AR
31.13.3840-
€
Dibegin = min{Di,Δ
begin + d(i,Δ)}
Disignal,1 = min{Di,Δ
begin + d(i,Δ)}
Disignal, j = min{Di,Δ
signal, j−1 + d(i,Δ)}
...
Diend = min{Di,Δ
end + d(i,Δ)}
Term originated in 1988 in Tagle et al. Blanchette et al.: For unaligned sequences related by phylogenetic tree, find all segments of length k with a history costing less than d. Motif loss an option.
begin signal end
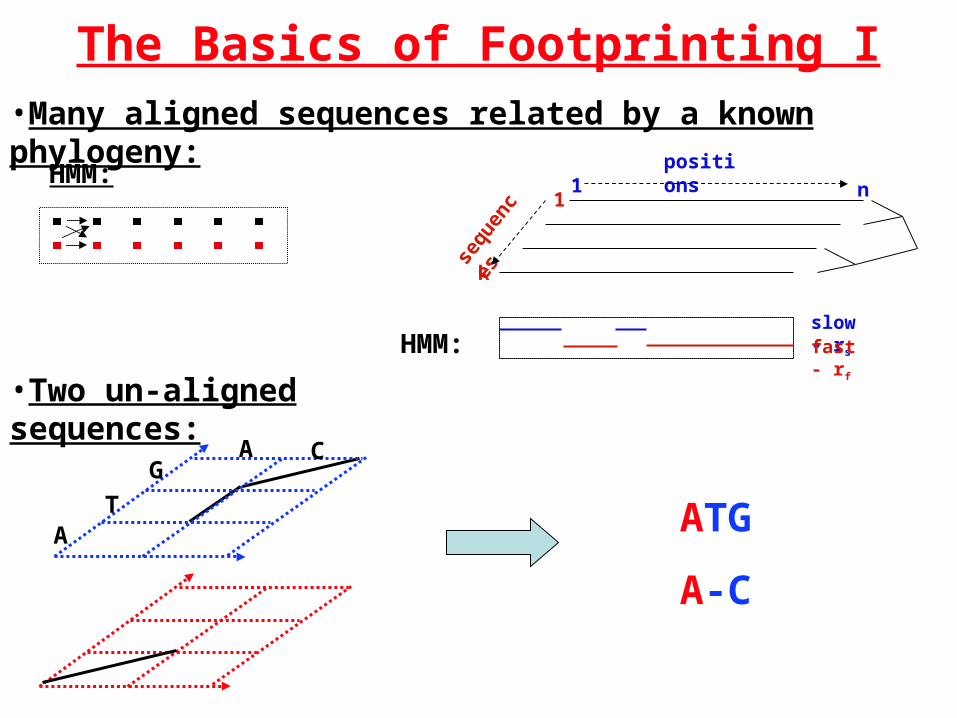
The Basics of Footprinting I•Many aligned sequences related by a known phylogeny:
n1positions
sequ
ence
s
k
1
slow - rs
fast - rfHMM:
•Two un-aligned sequences:
A
A
GC
T ATG
A-C
HMM:
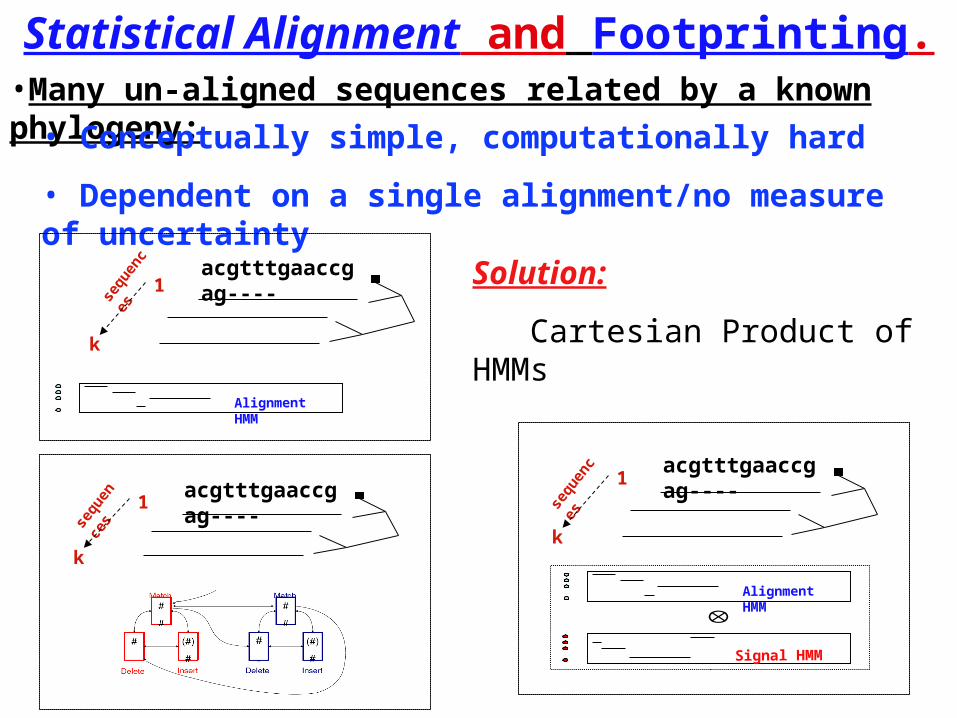
•Many un-aligned sequences related by a known phylogeny:
• Conceptually simple, computationally hard
• Dependent on a single alignment/no measure of uncertainty
sequ
ence
s
k
1
Alignment HMM
acgtttgaaccgag----
€
⊗
Signal HMM
Alignment HMM
sequ
ence
s
k
1acgtttgaaccgag----
Statistical Alignment and Footprinting.se
quen
ces
k
1acgtttgaaccgag----
Solution:
Cartesian Product of HMMs
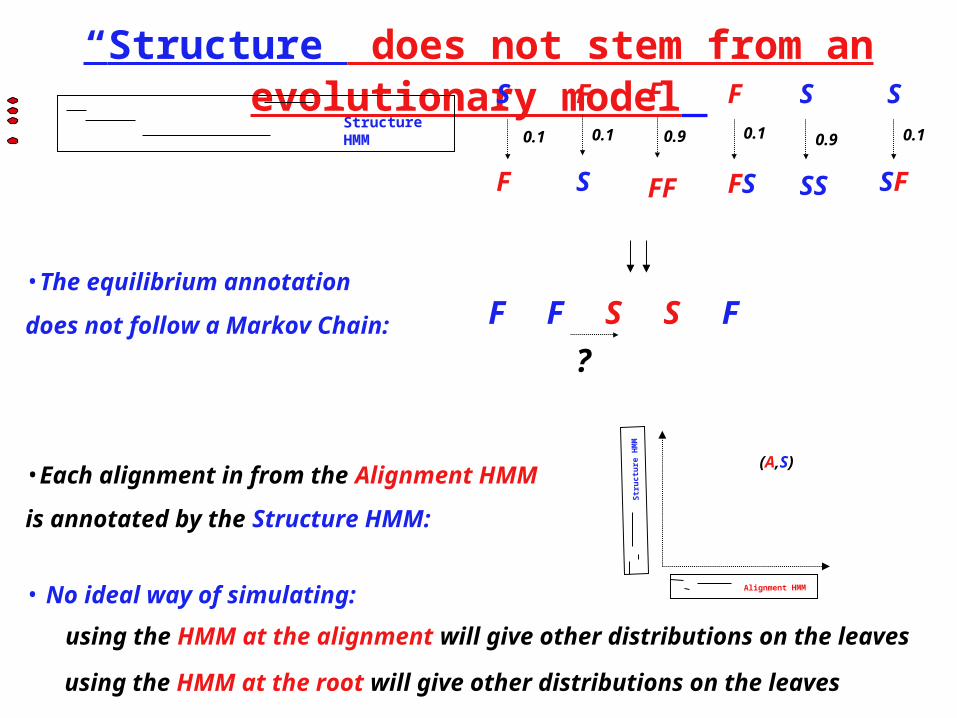
“Structure” does not stem from an evolutionary model
Structure HMM
S
F
0.1
S
F
0.1
F
FF
0.9
F
FS
0.1
S
SS
0.9
S
SF
0.1
•The equilibrium annotation
does not follow a Markov Chain:
?
F F S S F
•Each alignment in from the Alignment HMM
is annotated by the Structure HMM:
using the HMM at the alignment will give other distributions on the leaves
• No ideal way of simulating:
using the HMM at the root will give other distributions on the leaves
Alignment HMM
Str
uct
ure
HM
M
(A,S)
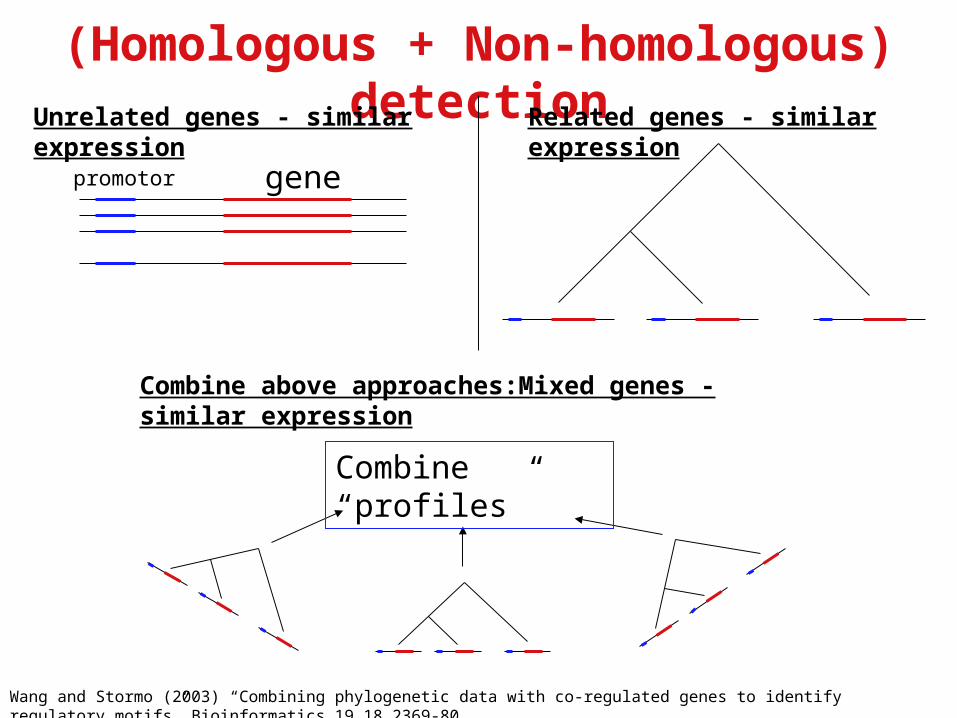
(Homologous + Non-homologous) detection
Wang and Stormo (2003) “Combining phylogenetic data with co-regulated genes to identify regulatory motifs” Bioinformatics 19.18.2369-80
genepromotor
Unrelated genes - similar expression Related genes - similar expression
Combine above approaches:Mixed genes - similar expression
Combine “profiles”
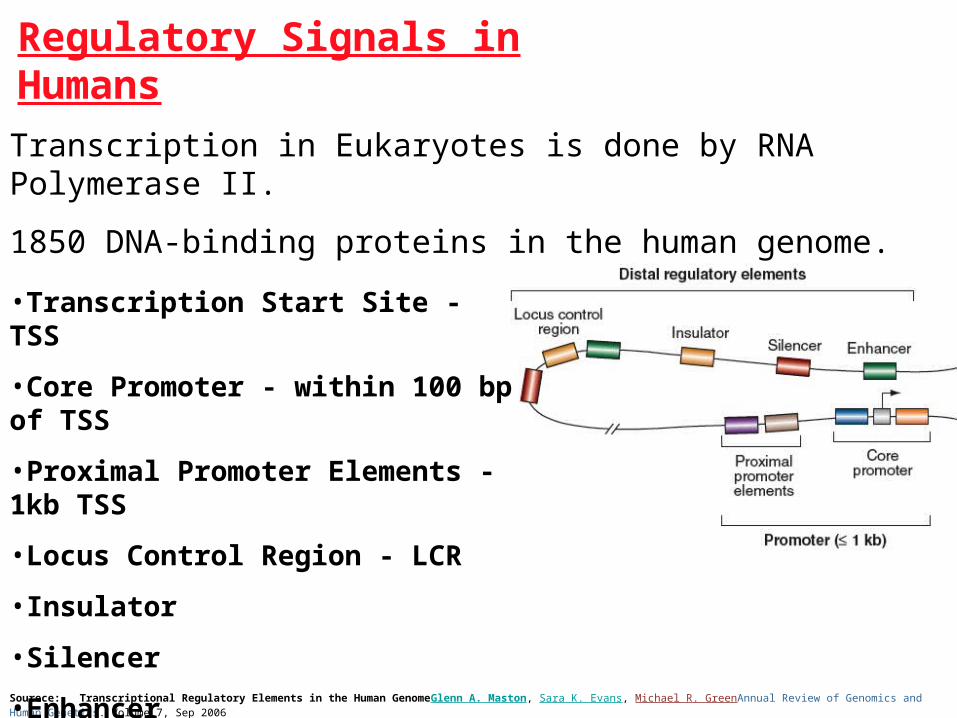
Regulatory Signals in Humans
Sourece: Transcriptional Regulatory Elements in the Human GenomeGlenn A. Maston, Sara K. Evans, Michael R. GreenAnnual Review of Genomics and Human Genetics. Volume 7, Sep 2006
•Transcription Start Site - TSS
•Core Promoter - within 100 bp of TSS
•Proximal Promoter Elements - 1kb TSS
•Locus Control Region - LCR
•Insulator
•Silencer
•Enhancer
Transcription in Eukaryotes is done by RNA Polymerase II.
1850 DNA-binding proteins in the human genome.
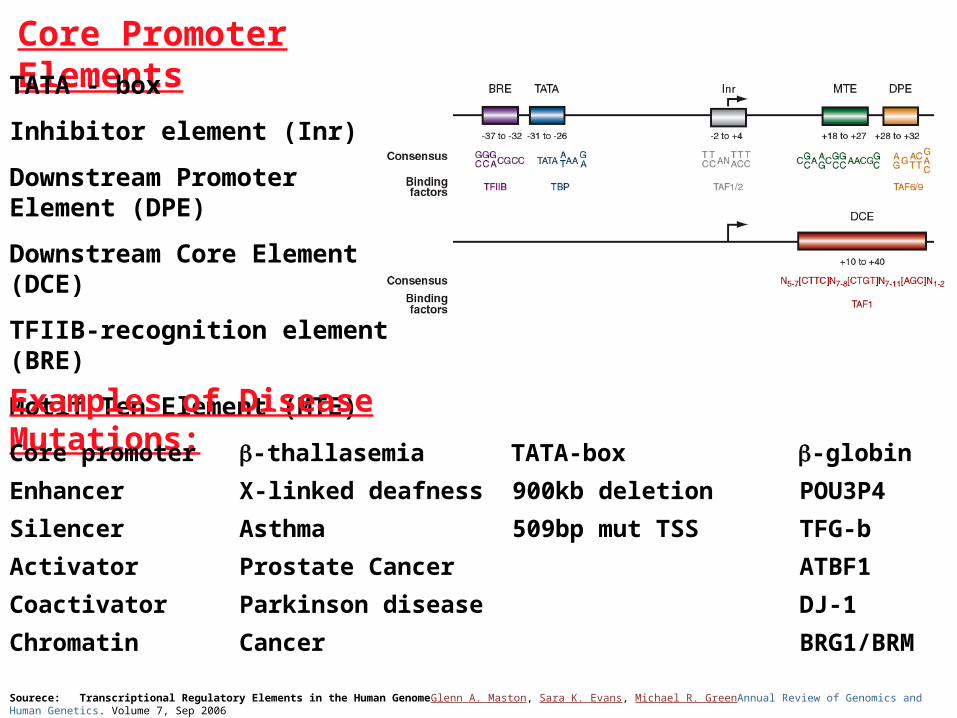
Sourece: Transcriptional Regulatory Elements in the Human GenomeGlenn A. Maston, Sara K. Evans, Michael R. GreenAnnual Review of Genomics and Human Genetics. Volume 7, Sep 2006
Core Promoter Elements
TATA - box
Inhibitor element (Inr)
Downstream Promoter Element (DPE)
Downstream Core Element (DCE)
TFIIB-recognition element (BRE)
Motif Ten Element (MTE)
Examples of Disease Mutations:
Core promoter -thallasemia TATA-box -globin
Enhancer X-linked deafness 900kb deletion POU3P4
Silencer Asthma 509bp mut TSS TFG-b
Activator Prostate Cancer ATBF1
Coactivator Parkinson disease DJ-1
Chromatin Cancer BRG1/BRM
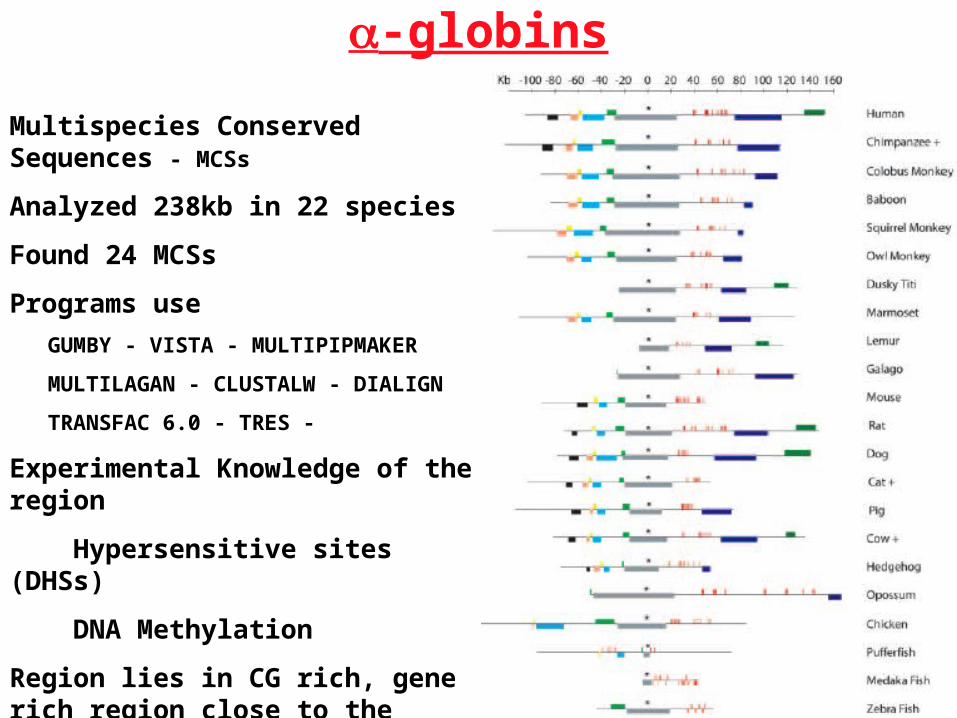
-globins
Multispecies Conserved Sequences - MCSs
Analyzed 238kb in 22 species
Found 24 MCSs
Programs use
GUMBY - VISTA - MULTIPIPMAKER
MULTILAGAN - CLUSTALW - DIALIGN
TRANSFAC 6.0 - TRES -
Experimental Knowledge of the region
Hypersensitive sites (DHSs)
DNA Methylation
Region lies in CG rich, gene rich region close to the telomeres.
It is not easy to align CG-islands.
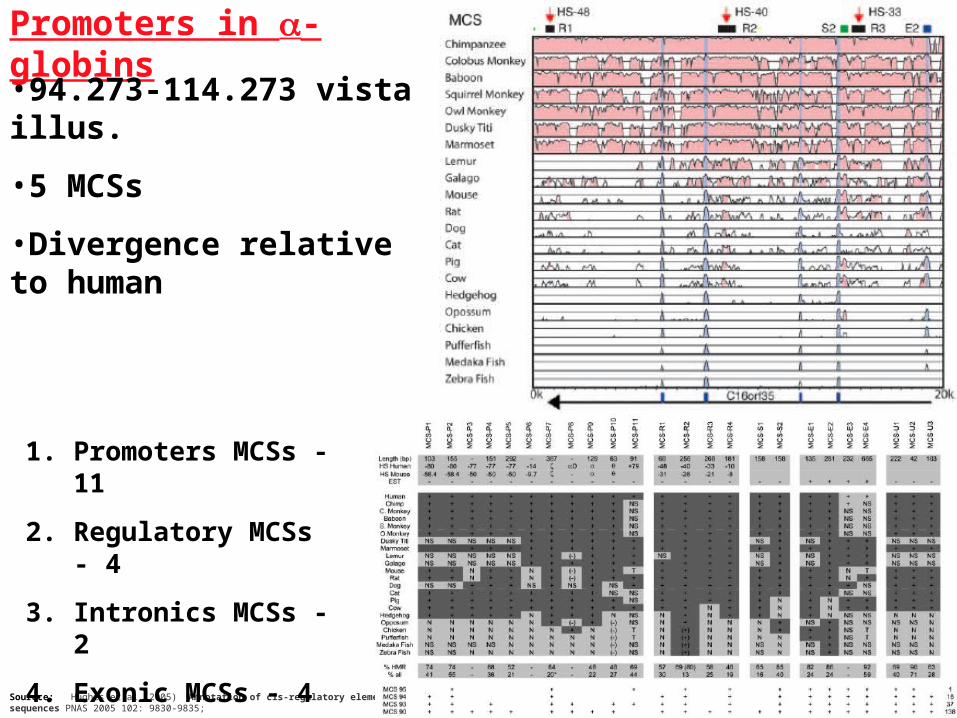
Promoters in -globins
Sourece: Hughes et al.(2005) Annotation of cis-regulatory elements by identification, subclassification, and functional assessment of multispecies conserved sequences PNAS 2005 102: 9830-9835;
•94.273-114.273 vista illus.
•5 MCSs
•Divergence relative to human
1. Promoters MCSs - 11
2. Regulatory MCSs - 4
3. Intronics MCSs - 2
4. Exonic MCSs - 4
5. Unknown - 3
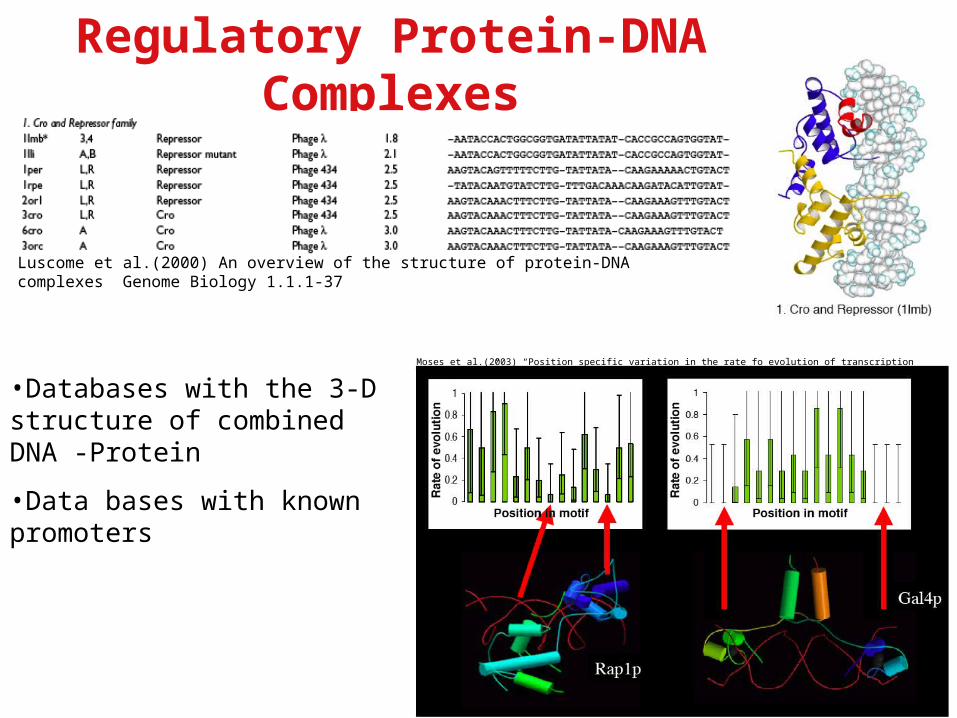
Regulatory Protein-DNA Complexes
Luscome et al.(2000) An overview of the structure of protein-DNA complexes Genome Biology 1.1.1-37
Moses et al.(2003) “Position specific variation in the rate fo evolution of transcription binding sites” BMC Evolutionary Biology 3.19-
•Databases with the 3-D structure of combined DNA -Protein
•Data bases with known promoters

Challenges
Open Problems