Embed Size (px)
Citation preview

Research ArticleOPEN ACCESS Freely available online
doi:10.4172/1948-593X.1000021
JBABM/Vol.2 Issue 2
J Bioanal Biomed ISSN:1948-593X JBABM, an open access journal
Volume 2(2) : 048-054 (2010) - 048
Comparative Bioavailability of a Generic and Two Compounded Naproxen Sodium Suspensions Administered to Rats Lílian Grace da Silva Solon1, Gerlane Bernardo Coelho Guerra2, Aurigena Antunes de Araújo2*, José Mário Barichello3, José Pérez-Urizar4 and Luiz Alberto Lira Soares5
1Department of Pharmacy,Universidade Federal do Rio Grande do Norte. Natal, Brazil 2Department of Biophysics and Pharmacology, Universidade Federal do Rio Grande do Norte. Natal, Brazil 3Department of Medicines, Universidade Federal da Bahia, Salvador, Brazil 4Pharmacology and Physiology Laboratory, Universidad Autónoma de San Luis Potosí, SLP, Mexico5Department of Pharmacy, Universidade Federal de Pernambuco, Recife, Brazil
Keywords: Bioavailability studies; Validation; HPLC; Pharmacoki-netics; Compounded naproxen sodium suspension
IntroductionAccording to Anfarmag (Associacao Nacional de Farmaceuticos
Magistrais) the turnover of compounded medicines is very high in Brazil. In 2008, the sales amounted to R$1.2bil (Redação Anfarmag, 2009). The large consumption of these medicines by the Brazilian population has raised the suspicion of the quality and safety of these drugs, since cases of toxicity and death were reported by the National Agency of Health Vigilance (ANVISA, 2008). Compounded naproxen sodium suspension is highly used by the children in Brazil (Redação Anfarmag, 2009). This over-the-counter (OTC) drug is safety but these compounded medicines have possible risks of variable bioavailability due to differences among formulations. Despite frequent inspections of Brazilian compounding pharmacies, there is not a strict quality control that involves in vivo tests.
Structurally naproxen is a propionic acid derivative related to the arylacetic group of nonsteroidal anti-inflammatory drugs (NSAIDs) (Valentovic, 2008). Member drugs of the NSAID group act by inhibiting prostaglandin biosynthesis and share several adverse effects including gastrointestinal bleeding and ulceration (Boynton et al., 1988; Brodgen et al., 1979; Aronson, 2006; Marta et al, 2007). Several high-performance liquid chromatography (HPLC) methods have been developed for naproxen determination in human or rat plasma for pharmacokinetic studies (Cakrt et al, 2001; Costi et al, 2008; Attia, 2009; Hearan Suh et al., 1995; Farrar et al, 2002; Martin, 1999; Paino et al, 2005; Zakeri-Milani et al, 2005). Nevertheless, there is a need to improve these methods in terms of ease of sample handling and analysis time. Many naproxen products are used in worldwide, but there is no bioavailability data concerning naproxen compounded formulations.
The aim of this study was to determine naproxen concentrations in rat plasma samples and to investigate the pharmacokinetic
parameters of three different oral suspensions of naproxen sodium (one manufactured suspension and two compounded formulations) in order to compare their bioavailability.
Experimental
Chemicals and reagents
The reference material naproxen with a purity 100.3% was purchased from DEG Importação de Produtos Químicos LTDA, Brazil. The internal standard, diclofenac sodium {2-[2-(2, 6-dichlorophenylamino) phenyl] acetic acid} with a purity 99.6% wasobtained from All Chemistry Produtos Naturais & Farmacêuticos,Brazil. All other chemicals were of HPLC grade. Milli-Q water (Millipore Corporation, Bedford, MA) was used for NaH2PO4 buffer preparation.The generic naproxen formulation (25 mg mL-1) was produced bySyntex S.A., Mexico. The two test naproxen sodium oral suspensions,test 1 (suspension A, 25 mg mL-1) and test 2 (suspension B, 25 mg mL-1)were obtained from two different compounding pharmacies, A and Brespectively, in Natal, Brazil.
Equipment and analysis conditions
Analyses were performed with a Varian ProStar HPLC system
*Corresponding authors: Aurigena Antunes de Araújo, Departamento deBiofísica e Farmacologia - Centro de Biociências Av. Senador Salgado Filho, S/N- Lagoa Nova, 59078-900 – Natal - RN, Brazil, Tel: +55 84 32153419; Fax: +55 84 32153402; E-mail: [email protected]
Received March 30, 2010; Accepted April 23, 2010; Published April 23, 2010
Citation: Silva Solon LG, Coelho Guerra GB, Araújo AA, Barichello JM,Pérez-Urizar J, et al. (2010) Comparative Bioavailability of a Generic and TwoCompounded Naproxen Sodium Suspensions Administered to Rats. J BioanalBiomed 2: 048-054. doi:10.4172/1948-593X.1000021
Copyright: © 2010 Silva Solon LG, et al. This is an open-access article distributed under the terms of the Creative Commons Attribution License, which permitsunrestricted use, distribution, and reproduction in any medium, provided theoriginal author and source are credited.
Abstract
The purpose of this study was to determine naproxen concentrations in rat plasma samples by HPLC and to compare the bioavailability of a generic and two compounded naproxen sodium suspensions (test 1 and test 2). Analysis was run at a fl ow rate of 1.2 mL.min-1 with a mobile phase of acetonitrile: NaH2PO4 0.01 M pH 4.00 (50:50, v/v) at 280 nm, using a C18 column (150 mm x 4.6 mm, 5 μm). The calibration curve was linear (R2 = 0.9987) over the range of 0.25 - 200 μg.mL-1. The precision for inter and intra-day analysis ranged from 2.46% to 12.39%. Cmax, Tmax and AUCt were 191.25 ± 11.17 μg.mL-1, 1.00 ± 0.106 h and 2438.16 ± 291.34 μg.h.mL-1 for the reference drug, 188.22 ± 24.78 μg.mL-1, 1.06 ± 0.092 h and 1755.02 ± 228.90 μg.h.mL-1 for test 1, and 160.50 ± 10.58 μg.mL-1, 0.66 ± 0.102 h and 1955.28 ± 142.80 μg.h.mL-1 for test 2. No signifi cant differences were found based on analysis of variance, with mean values and 90% CI of test2/reference ratio (Cmax 83.92% and AUCt 80.19%). For test1/reference ratio, the result was Cmax 98.41% and AUCt 71.98%. Based on these results, it can be concluded that the validated method was successfully applied to this study; the test 1 formulation failed to demonstrate a bioequivalence to the reference drug; however, the test 2 and reference naproxen sodium suspension were bioequivalent in terms of the rate and extent of absorption under these conditions.

Citation: Silva Solon LG, Coelho Guerra GB, Araújo AA, Barichello JM, Pérez-Urizar J, et al. (2010) Comparative Bioavailability of a Generic and Two Compounded Naproxen Sodium Suspensions Administered to Rats. J Bioanal Biomed 2: 048-054. doi:10.4172/1948-593X.1000021
J Bioanal Biomed ISSN:1948-593X JBABM, an open access journal
Volume 2(2) : 048-054 (2010) - 049
(Varian, USA) including a quaternary pump (ProStar 240 model), auto-sampler (ProStar 410 model), variable wavelength PDA detector (ProStar 335 model), a thermostated column compartment and the Varian software Galaxie Chromatography Data System, Version 1.9.302.530.
Chromatographic separations were via an ACE C18 column (150 mm x 4,6 mm, 5 m, ACE, USA) coupled with a ACE RP guard column (4 mm x 4,6 mm, 5 m, ACE, USA) at room temperature. Elution for the analytes were through isocratic flow of acetonitrile: NaH2PO4 0.01 M pH 4.00 (50:50, v/v). The mobile phase was filtered through a 0.45 m filter and degassed before use. The flow rate of the mobile phase was maintained at 1.2 mL min-1. The detection wavelength was set at UV 280 nm and the injection volume was 20 L.
Stock and working standard solutions
The stock solution of naproxen (1 mg mL-1) and the internal standard (1 mg mL-1) were prepared by dissolving the appropriate amount of the pure solid in acetonitrile. Both stock solutions were stored in a – 80ºC freezer. The working standard solutions of naproxen were prepared fresh by step-wise dilutions of the above stock solution with the mobile phase to provide a calibration concentration range of 0.25 – 200 g mL-1 when spiked into drug-free rat plasma. The working internal standard solution was prepared from the stock by dilution with mobile phase to 50 g mL-1.
Four quality control samples (QC), were prepared from the stock solutions by spiking naproxen into drug-free rat plasma to obtain final concentrations of 0.5, 15, 75 and 150 g mL-1. Routine calibration curves consisting of 0.25, 1, 5, 10, 20, 40, 100 and 200 g mL-1 calibrators were generated together with the QC for computation of naproxen concentrations in rat samples using peak area ratios of naproxen and internal standard.
Animals handling and sample collection
Wistar rats weighing 280 – 300 g were obtained from the Bioscience Center of Universidade Federal do Rio Grande do Norte (Natal, Brazil). They were acclimated and housed in cages at a temperature of 25ºC with free access of standard laboratory food and water. Twelve hours before the initiation of experiments, food was withheld, but animals had free access to water. All handling and experimentation were according to protocols approved by the institutional care and use of laboratory animals committee.
Naproxen sodium suspension was orally administered to rats at a dose of 50 mg kg-1. The animals were anesthetized with 15 mg kg-1 of xilazine hydrochloride (20 mg mL-1) and 100 mg kg-1 of ketamina hydrochloride (50 mg mL-1) through an i.p. route. Blood samples were taken from the tails at time intervals of 10, 20, 40, 60 min, 3, 4, 6, 24 and 48 h. At each time point, blood samples were collected from five rats to compute the mean concentration. Since only a maximum of 3 - 4 samples of 500 L each could be sampled from a rat over a short time, three groups of five rats were needed to complete the full sampling intervals. The blood samples were collected into heparin-coated tubes and maintained on ice for a short time before spinning in a microcentrifuge at 4ºC to harvest the plasma samples, which were immediately stored at – 80ºC until analysis.
Clean up of plasma samples
150 L of plasma obtained from dosed animals was mixed with 25 L of internal standard solution, 50 L of NaH2PO4 0.5 M pH 2,2 and NaCl for 1 minute. 250 L of acetonitrile was then added and the
sample vortexed for 3 minutes. For the calibration and quality control samples, 25 L of their respective working standards prepared in acetonitrile : NaH2PO4 0.01 M pH 4.00 (50:50, v/v) were added to each 150 L of free-drug plasma before mixing with internal standard solution. NaCl and acetonitrile in the mixture precipitated the plasma proteins. The mixture was then centrifuged at 10,000 rpm at 4ºC for 5 minutes, and the supernatant containing the extracted naproxen and the internal standard was then filtered through 0.45 m and transferred to the auto-sampler of the HPLC for analyses.
Method validation
The method was validated according to the “Guidance for Industry” under the section of “Bioanalytical Method Validation” by the Food and Drug Administration of USA (FDA, 2001).
Selectivity and linearity
The selectivity of the method was assessed by determining that endogenous substances and the anesthetics present in rat plasma do not co-elute with naproxen and the internal standard in the HPLC method.
Normal and hemolysate plasma samples from at least six untreated rats were used to verify the selectivity of the bioanalytical method.
To evaluate the linearity of the calibration curves, eight calibration standards containing naproxen at nominal concentrations of 0.25, 1, 5, 10, 20, 40, 100 and 200 g mL-1 were prepared as described in section 2.3. The standard calibration curves were constructed using naproxen/internal standard peak-area ratios vs. the nominal concentration by linear regression.
Precision, accuracy and recovery
Assay precision was assessed by determining the coefficients of variation (CV) of the four QC samples (concentrations of 0.5, 15, 75 and 150 g mL-1) within the same analysis (n=5, intra-day precision) and over a series of analyses (n=5, inter-day precision). Both intra-day and inter-day precision were calculated with the following formula:
standard deviationCV % 100
mean
Relative accuracy was determined by calculating the percent accuracy by the equation:
mean measured concentrationAccuracy % 100
nominal concentration
The precision and accuracy of the first calibrator of 0.25 g mL-1, lower limit of quantification (LLOQ) were also evaluated.
The recovery experiments in this study were performed by comparing peak areas of naproxen and internal standard in spiked plasma samples, extracted by the method described in section 2.5. The compounds of interest at concentrations corresponding to 100% recovery were added to similarly post-extracted blank plasma.
Stability
The stability of naproxen in rat plasma was tested in three freeze-thaw cycles with QC samples at four concentration levels. These samples were stored frozen at –20ºC and analyzed on days 0, 1 and 5 to give the evaluations.
Specifically, the long term stability of the samples when stored at

Research ArticleOPEN ACCESS Freely available online
doi:10.4172/1948-593X.1000021
JBABM/Vol.2 Issue 2
J Bioanal Biomed ISSN:1948-593X JBABM, an open access journal
Volume 2(2) : 048-054 (2010) - 050
–80ºC for up to 4 months was analyzed, since this is the temperatureat which the samples were stored before analysis. To assess thestability of the samples between the time of extraction and the HPLCrun, the samples were analyzed at the time of extraction and thevalues were compared to the 10 and 24 h post-extraction values ofthe same samples stored at room temperature. These tests providethe validation for using the auto-sampler when analyzing multiplesamples.
Pharmacokinetic and statistical analyses
Pharmacokinetic analysis of naproxen was carried out according to a standard non-compartmental method using the WinNonlin software (Pharsight Co., CA, Version 2.0). Cmax and Tmax were obtained directly from the observed data. The AUCt was calculated by the trapezoidal method. The AUCinf was calculated as AUCt + Ct/Ke, where Ct was the last quantifiable concentration, Ke was the terminal elimination rate constant and was determined by least-squares regression analysis during the terminal log-linear phase of the concentration-time curve. The T½ was calculated as 0.693/Ke.
Statistical analyses of variance (ANOVA) of AUCt, AUCinf and Cmax
were calculated after transformation of the data to their logarithmic (ln) values. Using the error variance (S2) obtained from the ANOVA, the 90% confidence intervals (CI) were calculated.
[Prostar 335 Absorbance Analog Channel 1 EL07069032]
[Prostar 335 Absorbance Analog Channel 1 EL07069032]
(A)
(B)
80
75
70
65
60
55
50
45
40
35
30
25
20
15
10
5
0
15515014514013513012512011511010510095908580757065605550454035302520151050
-5
0 0.5 1 1.5 2 2.5 3 3.5 4 4.5 5 5.5 6 6.5 7 7.5 8 8.5 9 9.5 10
0 0.5 1 1.5 2 2.5 3 3.5 4 4.5 5 5.5 6 6.5 7 7.5 8 8.5 9 9.5
mAU
mAU
RT[min]
RT[min]
Figure 1: HPLC chromatograms of blank plasma (A), hemolysate plasma (B), QC sample spiked with naproxen at 0.5 μg mL-1 and internal standard (C), a calibrator spiked with naproxen at 100 μg mL-1 and internal standard (D), and plasma sample 1 h after administration of naproxen (E). Peak 1: naproxen at about 4.26 minutes; Peak 2: internal standard at about 8.23 minutes.
mAU
mAU
mAU
[Prostar 335 Absorbance Analog Channel 1 EL07069032]
[Prostar 335 Absorbance Analog Channel 1 EL07069032]
[Prostar 335 Absorbance Analog Channel 1 EL07069032]
(c)
(D)
(E)
2
2
2
1
1
1
RT[min]
RT[min]
RT[min]
343332313029282726252423222120191817161514131211109876543210
-1
44
42
40
38
36
34
32
30
28
26
24
2220
18
16
14
12
10
8
6
4
2
0
-2
6462605856545250484644424038363432302826242220181614121086420
-2
0 0.5 1 1.5 2 2.5 3 3.5 4 4.5 5 5.5 6 6.5 7 7.5 8 8.5 9 9.5 10
0 0.5 1 1.5 2 2.5 3 3.5 4 4.5 5 5.5 6 6.5 7 7.5 8 8.5 9 9.5 10
0 0.5 1 1.5 2 2.5 3 3.5 4 4.5 5 5.5 6 6.5 7 7.5 8 8.5 9 9.5 10

Citation: Silva Solon LG, Coelho Guerra GB, Araújo AA, Barichello JM, Pérez-Urizar J, et al. (2010) Comparative Bioavailability of a Generic and Two Compounded Naproxen Sodium Suspensions Administered to Rats. J Bioanal Biomed 2: 048-054. doi:10.4172/1948-593X.1000021
J Bioanal Biomed ISSN:1948-593X JBABM, an open access journal
Volume 2(2) : 048-054 (2010) - 051
Results
Method validation
Selectivity and linearity: The Figure 1 shows representative HPLC chromatograms. The Figure 1 D shows a steady baseline, the naproxen peak was symmetrical and well separated from the plasma peak. Naproxen and internal standard were well separated using the above described chromatographic condition with retention times of 4.26 and 8.23 min respectively. No interfering peaks from endogenous substances in the control plasma samples of different rat or other reagents were detected under the conditions employed.
The peak area ratio (naproxen/internal standard) as a function of the nominal naproxen concentrations over a wide range of 0.25 - 200 g mL-1 was linear. The regression coefficient R2 was 0.9987. The weighted linear regression equation was: y = 0.014x + 0.0343.
Precision, accuracy and recovery: The intra-day and inter-day precision and accuracy for the plasma naproxen are summarized in Table 1. The intra-day and inter-day variability for the different QC were minimal, ranging from 2.46% to 12.39%, indicating excellent precision. Accuracies using the same QC ranged from 86.7% to 101.1%. All these variabilities were well within acceptable limits. Precision and accuracy for the LLOQ of 0.25 g mL-1 were 17.6% and 98%, respectively.
The recovery from spiked plasma was calculated by comparing
peak areas with QC samples (n=3) at four different concentration levels. The mean recoveries for naproxen in four QC samples (0.5, 15, 75 and 150 g mL-1) were 74.51%, 95.16%, 96.07% and 98.69%, respectively. Recovery of the internal standard was 94.2%. The lower recovery for the 0.5 g mL-1 QC was probably due to the low concentration and loss of naproxen through non-specific binding to precipitated protein.
Stability: The results of stability of naproxen in rat plasma after three freeze-thaw cycles and the long term storage are shown in Table 2. There were no significant changes (-3.37 to +3.36% for freeze-thaw cycles and -2.24 to -10.40% for long term stability). The samples remained within acceptable limits of precision and accuracy. These results indicated that naproxen was stable for least 5 days in rat plasma stored at – 20ºC and for least 4 months when stored at – 80ºC. In addition the extracted samples were stable at room temperature for the periods under which determinations were made, which were 10 and 24 h later (not shown).This is important because samples can be stored in an auto-sampler at room temperature until measurement without compromising the concentration of naproxen.
Pharmacokinetic evaluation
In this study, the pharmacokinetic parameters AUCt, AUCinf and Cmax, Tmax and T½ were used to compare the formulations. The results of Cmax and AUCt were 191.25 ± 11.17 g.mL-1 and 2438.16 ± 291.34g.h.mL-1 for reference drug, 188.22 ± 24.78 g.mL-1 and 1755.02 ± 228.90 g.h.mL-1 for test 1, 160.50 ± 10.58 g.mL-1 and 1955.28 ± 142.80 g.h.mL-1 for test 2 (Table 3).
Mean plasma concentrations versus time profiles of naproxen after administration of two tests and reference formulations in rats (n = 5) are shown in Figure 2. The mean plasma concentration-time curves of the formulations were comparable.
As showed in Table 4, the 90% confidence intervals for geometric mean ratios of test2/reference for AUCt and Cmax were within the acceptable limits (80 – 125%) of bioequivalence which implies that the bioequivalence criteria were met (FDA, 2006). For test1/reference ratio, the result was Cmax 98.41% and AUCt 71.98%.
Discussion
For comparing the bioavailability between formulations, three groups of five animals were used for each administered formulation of naproxen sodium oral suspension. The number of animals was suitable for this pharmacokinetic study (Mathy et al., 2001). Before testing the bioanalytical method was validated to ensure the reliability of results.
The bioanalytical method described above was simple and rapid for the determination of naproxen in rat plasma. A one-step protein precipitation provided a simple, rapid and economic procedure. Other methods described in the literature use sophisticated techniques for the quantification of naproxen in biological matrices, like LC-MS, fluorescence spectroscopy and capillary electrophoresis (Mikami, 2000; Monser and Darghouth, 2003; Murillo Pilgrim and Garcia Borneo, 1998; Sirisuth, 2001; Pai and Liu, 2002; Sultana et al., 2008; Vermeulen and Remon, 2000; Xiong et al., 2008; Hsu et al., 2006). Despite the high sensitivity of these techniques, there is high cost as well as a lot of time spent with clean up and extraction of drug. This HPLC analysis method showed excellent precision, accuracy, stability, specificity and recovery. Therefore, this method was suitable and applied to monitor the concentration of naproxen in rat plasma.
Nominal concentration
(μg mL-1)
Measured concentration
(μg mL-1) ± S.D. Precision (CV%) Accuracy (%)
Intra-day 0.5 0.467 0.024 5.24 93.5 15 12.99 0.750 5.77 86.7 75 73.71 2.238 3.03 98.3 150 151.62 3.730 2.46 101.1
Inter-day 0.5 0.426 0.060 12.30 98.5 15 13.39 1.302 9.71 89.3 75 70.07 8.683 12.39 93.4 150 149.05 4.281 2.87 99.3
Table 1: Intra-day and Inter-day assays precision and accuracy for naproxen in rat plasma (n = 5).
Nominal concentration
(μg mL-1)
Measured concentration (μg mL-1) ± S.D. % Change
Fresh samples Three freeze-thaw cycle 0.5 0.507 ± 0.034 0.501 ± 0.069 - 1.18% 15 14.92 ± 0.85 13.82 ± 0.95 - 7.37% 75 72.57 ± 3.65 75.01 ± 8.29 + 3.36% 150 152.72 ± 6.55 148.29 ± 4.27 - 2.90%
Fresh samples Long term stability 0.5 0.453 ± 0.021 0.417 ± 0.058 - 7.94% 15 14.89 ± 1.44 13.34 ± 1.24 - 10.40% 75 70.23 ± 5.34 68.65 ± 7.96 - 2.24% 150 151.66 ± 9.17 147.58 ± 4.75 - 2.69%
Table 2: Stability of naproxen in rat plasma after three freeze-thaw cycles at – 20ºC and after long term stability at – 80ºC (n = 3).
Pharmacokinetic parameters
Reference suspension
Suspension A (Test 1)
Suspension B (Test 2)
AUCt (μg.h.mL-1) 2438.16 ± 291.34 1755.02 ± 228.90 1955.28 ± 142.80 AUCinf (μg.h.mL-1) 2465.97 ± 291.56 1766.93 ± 229.03 1984.10 ± 133.73 Cmax (μg.mL-1) 191.25 ± 11.17 188.22 ± 24.78 160.50 ± 10.58 Tmax(h) 1.00 ± 0.106 1.06 ± 0.092 0.66 ± 0.102 t1/2 (h) 9.98 ± 1.26 5.49 ± 0.50 8.68 ± 1.05 AUCt/AUCinf (%) 98.86 ± 0.327 99.31 ± 0.141 97.75 ± 0.842
Table 3: Pharmacokinetic parameters of naproxen after oral administration of naproxen sodium suspension in rat, each value represents the mean ± S.D. (n=5).
Research ArticleOPEN ACCESS Freely available online
doi:10.4172/1948-593X.1000021
JBABM/Vol.2 Issue 2
J Bioanal Biomed ISSN:1948-593X JBABM, an open access journal
Volume 2(2) : 048-054 (2010) - 052
1000
100
10
1
1000
100
10
1
Pla
sma
conc
entra
tion
(µg/
mL)
Pla
sma
conc
entra
tion
(µg/
mL)
(A)
(B)
REFERENCE SUSPENSION
SUSPENSION
Time (h)0 5 10 15 20 25 30 35 40 45 50
0 5 10 15 20 25 30 35 40 45 50
REFERENCE SUSPENSION
SUSPENSION
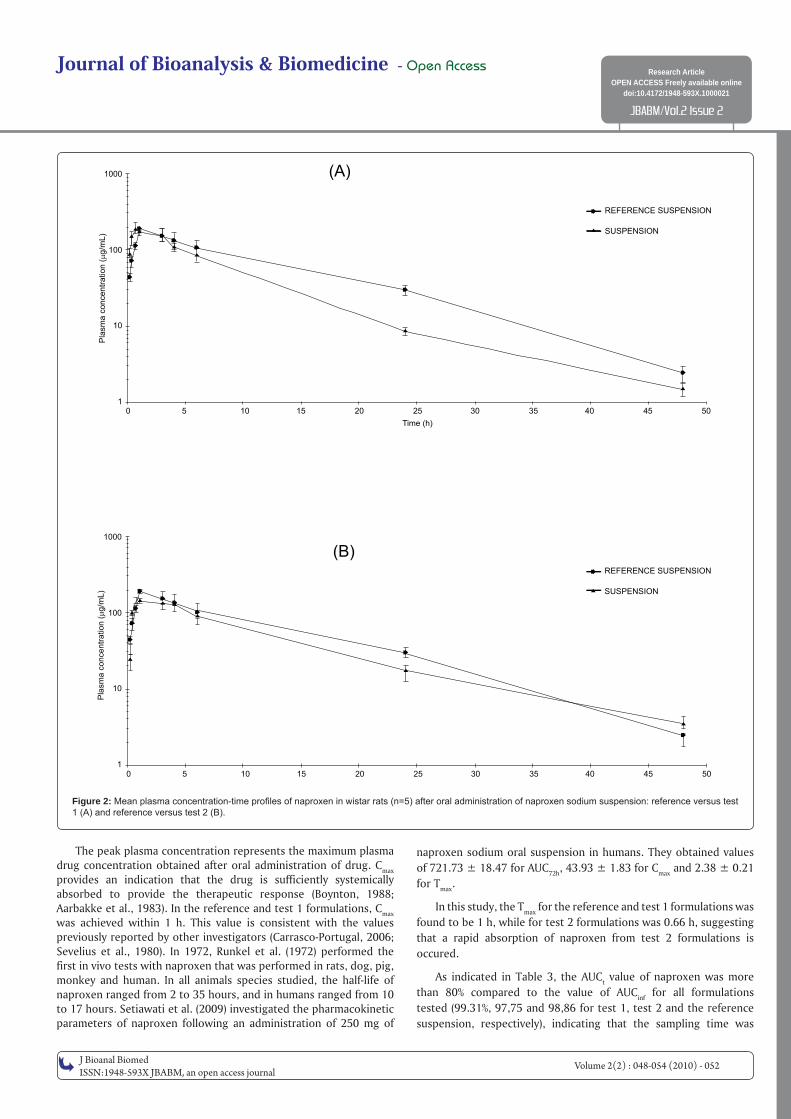
Figure 2: Mean plasma concentration-time profi les of naproxen in wistar rats (n=5) after oral administration of naproxen sodium suspension: reference versus test 1 (A) and reference versus test 2 (B).
The peak plasma concentration represents the maximum plasma drug concentration obtained after oral administration of drug. Cmax
provides an indication that the drug is sufficiently systemically absorbed to provide the therapeutic response (Boynton, 1988; Aarbakke et al., 1983). In the reference and test 1 formulations, Cmax was achieved within 1 h. This value is consistent with the values previously reported by other investigators (Carrasco-Portugal, 2006; Sevelius et al., 1980). In 1972, Runkel et al. (1972) performed the first in vivo tests with naproxen that was performed in rats, dog, pig, monkey and human. In all animals species studied, the half-life of naproxen ranged from 2 to 35 hours, and in humans ranged from 10 to 17 hours. Setiawati et al. (2009) investigated the pharmacokinetic parameters of naproxen following an administration of 250 mg of
naproxen sodium oral suspension in humans. They obtained values of 721.73 ± 18.47 for AUC72h, 43.93 ± 1.83 for Cmax and 2.38 ± 0.21 for Tmax.
In this study, the Tmax for the reference and test 1 formulations was found to be 1 h, while for test 2 formulations was 0.66 h, suggesting that a rapid absorption of naproxen from test 2 formulations is occured.
As indicated in Table 3, the AUCt value of naproxen was more than 80% compared to the value of AUCinf for all formulations tested (99.31%, 97,75 and 98,86 for test 1, test 2 and the reference suspension, respectively), indicating that the sampling time was
Citation: Silva Solon LG, Coelho Guerra GB, Araújo AA, Barichello JM, Pérez-Urizar J, et al. (2010) Comparative Bioavailability of a Generic and Two Compounded Naproxen Sodium Suspensions Administered to Rats. J Bioanal Biomed 2: 048-054. doi:10.4172/1948-593X.1000021
J Bioanal Biomed ISSN:1948-593X JBABM, an open access journal
Volume 2(2) : 048-054 (2010) - 053
sufficiently long to ensure an adequate description of the absorption phase (FDA, 2006).
Since the 90% CI for AUCt and Cmax ratio for reference and test 1 formulation were not inside the 80-125% interval proposed by the US Food and Drug Administration Agency, it suggests that naproxen formulation elaborated by the compounding pharmacy A was not considered bioequivalent to the reference formulation. Nevertheless, the test 2 and reference naproxen sodium oral suspension were bioequivalent in terms of the rate and extent of absorption in these conditions. When two formulations of the same drug are bioequivalent in rate and extent of absorption, it is assumed that they are therapeutically equivalent (FDA, 2006).
It is important to point out that the reference suspension was a powder for reconstitution and the compounded products presented syrup form. As shown in the results, these different formulations influenced the bioavailability of these drugs. It suggests that the therapeutic response of the test 1 formulation may be compromised.
Conclusions The test 1 formulation failed to demonstrate a bioequivalence to
the reference drug; this result indicates the need of a hard inspection of the Brazilian compounding pharmacies beyond the need of standardization of formulations by pharmacies.
The test 2 and reference naproxen sodium suspension were bioequivalent in terms of the rate and extent of absorption under these conditions. It be concluded that the quality of compounded medicines should always be associated with the Good Handling Practices, following operational procedures in order to ensure the patient safety and the quality of these products.
Acknowledgment
This work was supported by Brazilian government research grants (CAPES and CNPq).
References
1. Aarbakke J, Gadeholt G, Høylandskjaer A (1983) Pharmacokinetics of naproxen after oral administration of two tablet formulations in healthy volunteers. Int J Clin Pharmacol Ther Toxicol 6: 281-283. » CrossRef » PubMed » Google Scholar
2. ANVISA (2008) Fármacos manipulados têm sido consumidos cada vez mais. Available at http://www.anvisa.gov.br/divulga/artigos/farmacos.htm. » CrossRef
» PubMed » Google Scholar
3. Aronson JK (2006) Meyler’s Side Effects of Drugs: The International Encyclopedia of Adverse Drug Reactions and Interactions. 2426-2429. » CrossRef
» PubMed » Google Scholar
4. Attia DA (2009) In vitro and in vivo evaluation of transdermal absorption of naproxen sodium. Australian Journal of Basic and Applied Sciences 3: 2154-2165. » CrossRef » PubMed » Google Scholar
5. Boynton CS, Dick CF, Mayor GH (1988) NSAID: An overview. J Clin Pharmacol 28: 512-517. » CrossRef » PubMed » Google Scholar
6. Brogden RN, Heel RC, Speight TM, Avery GS (1979) Naproxen up to date: a review of its pharmacological properties and therapeutic effi cacy and use
Naproxen sodium oral suspension 25 mg mL-1
Pharmacokinetic parameter
Test 1/Reference (%) (90% CI)
Test 2/Reference (%) (90% CI)
Cmax (μg.mL-1) 98.41 (85.63 – 111.19)
83.92 (74.30 – 83.98)
AUCt (μg.h.mL-1) 71.98 (56.13 – 70.82)
80.19 (66.22 – 92.93)
Table 4: The ratio of log-transformed values of Cmax and AUCt and the correspond-ing CI 90%.
in rheumatic diseases and pain states. Drugs 18: 241-277. » CrossRef » PubMed
» Google Scholar
7. Cakrt M, Hercegová A, Lesko J, Polonský J, Sádecká J, et al. (2001)Isotachophoretic determination of naproxen in the presence of its metabolite in human serum. J Chromatogr A 916: 207-214. » CrossRef » PubMed » Google Scholar
8. Carrasco-Portugal MC, Herrera JE, Reyes-García G, Medina-Santillán R,Flores-Murrieta FJ (2006) Comparative bioavailability of two oral suspensions of naproxen sodium. Arzneimittelforschung 8: 589-592. » CrossRef » PubMed » Google
Scholar
9. Costi EM, Goryacheva I, Sicilia MD, Rubio S, Pérez-Bendito D (2008) Supra-molecular solid-phase extraction of ibuprofen and naproxen from sewage based on the formation of mixed supramolecular aggregates prior to their liquid chromatographic/photometric determination. J Chromatogr A 1: 1-7. » CrossRef
» PubMed » Google Scholar
10. Farrar H, Letzig L, Gill M (2002) Validation of a liquid chromatographic method for the determination of ibuprofen in human plasma. J Chromatogr B Analyt Technol Biomed Life Sci 780: 341-348. » CrossRef » PubMed » Google Scholar
11. FDA (2001) Center of Drug Evaluation and Research, Guidance for Industry: Bioanalytical Method Validation. Available at http://www.fda.gov/cder/ guidance/4252fnl.pdf. » CrossRef » PubMed » Google Scholar
12. FDA (2006) Center of Drug Evaluation and Research, Guidance for Industry: Bioequivalence Guidance. http://www.fda.gov/downloads/AnimalVeterinary/GuidanceComplianceEnforcement/GuidanceforIndustry/ucm052363.pdf. » CrossRef » PubMed » Google Scholar
13. Hsu YH, Liou YB, Lee JA, Chen CY, Wu AB (2006) Assay of naproxen by high-performance liquid chromatography and identifi cation of its photoproducts by LC-ESI MS. Biomed Chromatogr 20: 787-793. » CrossRef » PubMed » Google Scholar
14. Mathy FX, Preat V, Verbeeck RK (2001) Validation of subcutaneous microdia-lysis sampling for pharmacokinetic studies of fl urbiprofen in the rat. J Pharm Sci 11: 1897-1906. » CrossRef » PubMed » Google Scholar
15. Marta LC, Tacconelli S, Sciulli MG, Anzellotti P, Francesco LD, et al. (2007) Human pharmacology of naproxen sodium. J Pharmacol Exp Ther 2: 453-460. » CrossRef » PubMed » Google Scholar
16. Martı́ n MJ, Pablos F, González AG (1999) Simultaneous determination of caffeine and non-steroidal anti-infl ammatory drugs in pharmaceutical formula-tions and blood plasma by reversed-phase HPLC from linear gradient elution. Talanta 49: 453-459. » CrossRef » PubMed » Google Scholar
17. Mikami K (2000) Simultaneous analysis of naproxen, nabumetone and its ma-jor metabolite 6-methoxy-2-naphtylacetic acid in pharmaceuticals and human urine by high-performance liquid chromatography. J Pharm Biomed Anal 23: 917-525. » CrossRef » PubMed » Google Scholar
18. Monser L, Darghouth F (2003) Simultaneous determination of naproxen and related compounds by HPLC using porous graphitic carbon column. J Pharm Biomed Anal 4-5: 1087-1092. » CrossRef » PubMed » Google Scholar
19. Murillo Pilgrim A, Garcia Borneo LFG (1998) First derivative non-linearvariable-angle synchronous fl uorescence spectroscopy for the simultaneous determination of salicylamide, salisilate and naproxen in serum and urine. Analytica Chimica Acta 373: 119-129. » CrossRef » PubMed » Google Scholar
20. Paino IM, Ximenes VF, Fonseca LM, Kanegae MP, Khalil NM, et al. (2005) Effect of therapeutic plasma concentrations of non-steroidal anti-infl ammatory drugs on the production of reactive oxygen species by activated rat neutrophils. Brazilian Journal of Medical and Biological Research. 38: 543-551. » CrossRef
» PubMed » Google Scholar
21. Pai YF, Liu CY (2002) Capillary electrochromatographic separation of non-steroidal anti-infl ammatory drugs with a histidine bonded phase. J Chromatogr A 2: 293-301. » CrossRef » PubMed » Google Scholar
22. Redação Anfarmag (2009) Available at http://www.anfarmag.org.br/integra. php. » CrossRef » PubMed » Google Scholar
23. Runkel R, Chaplin M, Boost G, Segre E, Forchielli E (1972) Absorption, distribution, metabolism, and excretion of naproxen in various laboratory animals and human subjects. J Pharm Sci 5: 703-708. » CrossRef » PubMed » Google
Scholar
24. Setiawati E, Deniati SH, Yunaidi DA, Handayani LR, Harinanto G, et al. (2009) Bioequivalence study with two naproxen sodium tablet formulations in healthy
subjects. J Bioequiv Availab 1: 28-33. » CrossRef » PubMed » Google Scholar

Research ArticleOPEN ACCESS Freely available online
doi:10.4172/1948-593X.1000021
JBABM/Vol.2 Issue 2
J Bioanal Biomed ISSN:1948-593X JBABM, an open access journal
Volume 2(2) : 048-054 (2010) - 054
25. Sevelius H, Runkel R, Segre E, Bloomfi eld SS (1980) Bioavailability of naproxen sodium and its relationship to clinical analgesic effects. Br J Clin Pharmacol 6:259-263. » CrossRef » PubMed » Google Scholar
26. Sirisuth N (2001) Systematic method for the development and validation ofan IVIVC metoprolol and naproxen drug examples. International Journal ofGeneric Drugs. IVIVC Series Part III: 250-258. » CrossRef » PubMed » Google Scholar
27. Suh H, Jun HW, Lu GW (1995) Fluorometric high performance liquidchromatography for quantitation of naproxen in serum. Journal of LiquidChromatography & Related Technologies 15: 3105-3115. » CrossRef » PubMed
» Google Scholar
28. Sultana N, Arayne MS, Iftikhar B (2008) Simultaneous determination ofatenolol, rosuvastatin, spironolactone, glibenclamide and naproxen sodium inpharmaceutical formulations and human plasma by RP-HPLC. Journal of theChinese Chemical Society 5: 1022-1029. » CrossRef » PubMed » Google Scholar
29. Valentovic M (2008) xPharm: The Comprehensive Pharmacology Reference.1-6. » CrossRef » PubMed » Google Scholar
30. Vermeulen B, Remon JP (2000) Validation of a high-performance liquidchromatographic method for the determination of ibuprofen enantiomersin plasma of broiler chickens. J Chromatogr B Biomed Sci Appl 2: 243-251.» CrossRef » PubMed » Google Scholar
31. Xiong X, Zhang Q, Xiong F, Tang Y (2008) Determination of threenonsteroidal anti-infl ammatory drugs in human plasma by LC coupled withchemiluminescence detection. Chromatographia 11-12: 929-934. » CrossRef
» PubMed » Google Scholar
32. Zakeri-Milani P, Barzegar-Jalali M, Tajerzadeh H, Azarmi Y, Valizadeh H (2005) Simultaneous determination of naproxen, ketoprofen and phenol red in samples from rat intestinal permeability studies: HPLC method development andvalidation. J Pharm Biomed Anal 3-4: 624-630. » CrossRef » PubMed » Google Scholar


![NANOSUSPENSION: BIOAVAILABILITY ENHANCING NOVEL … · or previous GI surgery (e.g. bariatric surgery) can also affect drug bioavailability [23]. Improvement of bioavailability: The](https://img.pdfslide.us/doc/110x75/5eb46ef2a9b685351d4067b1/nanosuspension-bioavailability-enhancing-novel-or-previous-gi-surgery-eg-bariatric.jpg)