Embed Size (px)
Citation preview
Advances in Environmental Research, Vol. 9, No. 3 (2020) 151-160
DOI: https://doi.org/10.12989/aer.2020.9.3.151 151
Copyright © 2020 Techno-Press, Ltd.
http://www.techno-press.org/?journal=aer&subpage=7 ISSN: 2234-1722 (Print), 2234-1730 (Online)
Comparative assessment of surface and ground water quality using geoinformatics
Giridhar M.V.S.S.a, Shyama Mohan* and D. Ajay Kumarb
Centre for Water Resources, Institute of Science and Technology, Jawaharlal Nehru Technological University Hyderabad (JNTUH), Kukatpally, Hyderabad, Telangana (500085), India
(Received April 1, 2020, Revised July 13, 2020, Accepted July 14, 2020)
Abstract. Water quality demonstrates physical, chemical and biological characteristics of water. The quality
of surface and groundwater is currently an important concern with population growth and industrialization.
Over exploitation of water resources due to demand is causing the deterioration of surface water and ground
water. Periodic water quality testing must be carried out to protect our water resources. The present research
analyses the spatial variation of surface water and groundwater in and around the lakes of Hyderabad.
Twenty-Seven lakes and their neighboring bore water samples are obtained for water quality monitoring.
Samples are evaluated for specific physico-chemical parameters such as pH, Total Dissolved Solids (TDS),
Cl, SO4, Na, K, Ca, Mg, and Total Hardness (TH). The spatial variation of water quality parameters for the
27 lakes and groundwater were analysed. Correlation and multiple regression analysis were carried out to
determine comparative study of lake and ground water. The study found that most of the lakes were polluted
and this had an impact on surrounding ground water.
Keywords: water quality; physico-chemical parameters; surface water; ground water; urbanization
1. Introduction
Water is significant element and most important source for our life. Earth surface contains 70%
of water. In maintaining human health water plays a major role, because our body contains two
third of water. Among all natural resources water is most important one. On earth water occurs in
three physical states of matter i.e., liquid, solid and gas. Water presents mostly in liquid state, next
comes gases and at last solids. From total earth’s water 0.3% is usable by humans and 99.7% by
oceans, soils and icecaps. From 0.3% usable water lake contains 87%, swamps contain 11% and
2% in rivers. To maintain a significant role in natural heritage, lake and river water plays a major
role. Human beings depend on water for variety of purposes like agriculture use, industrial use and
for domestic purposes. In the past few decades ground water and lakes have been polluted owing
to disposal of waste without treatment and overexploitation. The problems of groundwater quality
Corresponding author, Ph.D., E-mail: [email protected] aProfessor, E-mail: [email protected] bPh.D. Student, E-mail: [email protected]
Giridhar M.V.S.S., Shyama Mohan and D. Ajay Kumar
are much more acute in the areas which are densely populated, thickly industrialized, excess use of
pesticides and fertilizers in rural area and shallow ground water tablets (Magroliya and Monika
2018). The use of pesticides is increasing which contaminates the groundwater, and these should
also be analyzed continuously. It is only by multidisciplinary approach that environmental
problems can be assessed. Required tools and techniques should be developed for an effective
environmental decision (Manuel et al. 2008). Research on water quality on groundwater and
surface water has been widely recognized method.
Obi (2017) carried out a comparative analysis on surface and groundwater quality research in
Nigeria. This study was very significant because disease vector was prevalent and thrive well in
water. So, analysis has been performed for quality status of Otamiri River and water boreholes
located in Owerri west, Nigeria. Bacteriological, physical and chemical analyses were carried out.
The results showed the surface water was heavily polluted and unsafe for drinking. Spatial and
statistical studies have been more effective in understanding the assessment of groundwater and
lake water analysis. Application of correlation coefficients and regression analysis were
implemented for better understanding of relationship between parameters (Rehman et al. 2018).
Statistical analysis such as discriminant analysis (DA) and principal component analysis (PCA) are
widely used in the qualitative and statistical analysis and evaluation of environmental data sets,
especially where flux data are absent (Shamsuddin et al. 2015). The groundwater impact on
surface water quality can be explored through spatial variability and statistical analysis (Liang Yu
et al. 2018). Nnadi and Fulkerson (2002) have carried out the assessment of groundwater under
direct influence of surface water. The study explored the risk of groundwater contamination due to
the geology and land use. Through Microscopic Particulate Analysis, the risk of groundwater
contamination to surface water is assessed. The results showed majority of high risk index of wells
near the geologic formations. Andrew et al. (2014) performed a multivariate study of the
hydrochemical properties of groundwater, in particular nitrate pollution. The study has shown that
statistical analysis can be used to interpret the complex physicochemical characteristics of
groundwater.
Brindha et al. (2014) identified the surface water and groundwater interactions in Chennai,
India. Research was conducted in the densely populated city to establish the suitability of
groundwater for drinking and irrigation purposes. High concentrations of EC, Na–Cl and Ca–Mg–
Cl were observed in both groundwater and surface water. The results concluded that The
groundwater quality of this region is affected by the contaminated surface water. Samuel et al
(2019) has analysed the surface water and groundwater sources using the water quality index.
Different sources of peri-urban town in the Southwest region of Nigeria were analysed. A Flame
Atomic Absorption spectrophotometer was used to determine the concentrations of Ca, Mg, Cu,
Cr, and Pb in the water samples. Most of the water resources were found to be contaminated with
faecal coliform. The study recommended Microbial water quality parameters to be included in all
Water Quality Index (WQI) analyses in order to give the true status of the quality of a water
resource. Effective ground water and surface water management can be carried out by
investigation the surface and groundwater assessment. Omoleomo et al. (2008) investigated the
chemistry of surface and groundwater. A total of 137 surface and groundwater samples were
collected between 2003 and 2007 during the rainy and dry seasons, from 15 sites and analysed for
their physico-chemical constituents. Principal Component Analysis (PCA)/Factor Analysis (FA)
and Hierarchic Cluster Analysis (HCA) were carried out for chemical data sets. The statistical
method was used to analyse spatial similarity among the sampling sites. The results indicated five
dominant processes for surface water that explained 77.11% of the variance in the data set whereas
152
Comparative assessment of surface and ground water quality using geoinformatics
in groundwater, the factors account for 80.55% of the total variance. The study concluded the oil
producing region have an effect on surface water and groundwater resource management.
The primary objective of the research was to identify the adverse effect of surface water on
groundwater quality in the selected surface water bodies of Hyderabad city, Telangana. The
majority of potable water is extracted from the groundwater through borewells. 27 lakes and
surrounding borewells in Hyderabad have been identified and analyzed for specific physico-
chemical parameters. The statistical and spatial variation analysis has provided an insight on
groundwater and surface water characteristics.
2. Study area
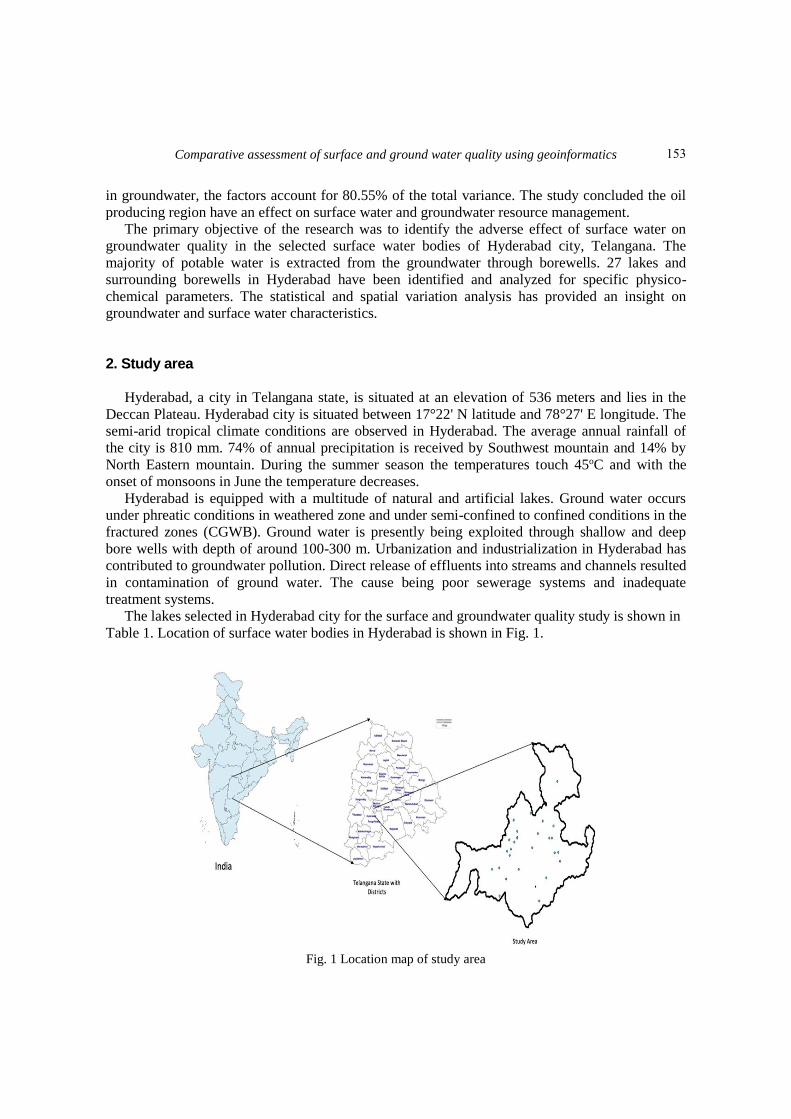
Hyderabad, a city in Telangana state, is situated at an elevation of 536 meters and lies in the
Deccan Plateau. Hyderabad city is situated between 17°22' N latitude and 78°27' E longitude. The
semi-arid tropical climate conditions are observed in Hyderabad. The average annual rainfall of
the city is 810 mm. 74% of annual precipitation is received by Southwest mountain and 14% by
North Eastern mountain. During the summer season the temperatures touch 45oC and with the
onset of monsoons in June the temperature decreases.
Hyderabad is equipped with a multitude of natural and artificial lakes. Ground water occurs
under phreatic conditions in weathered zone and under semi-confined to confined conditions in the
fractured zones (CGWB). Ground water is presently being exploited through shallow and deep
bore wells with depth of around 100-300 m. Urbanization and industrialization in Hyderabad has
contributed to groundwater pollution. Direct release of effluents into streams and channels resulted
in contamination of ground water. The cause being poor sewerage systems and inadequate
treatment systems.
The lakes selected in Hyderabad city for the surface and groundwater quality study is shown in
Table 1. Location of surface water bodies in Hyderabad is shown in Fig. 1.
Fig. 1 Location map of study area
153
Giridhar M.V.S.S., Shyama Mohan and D. Ajay Kumar
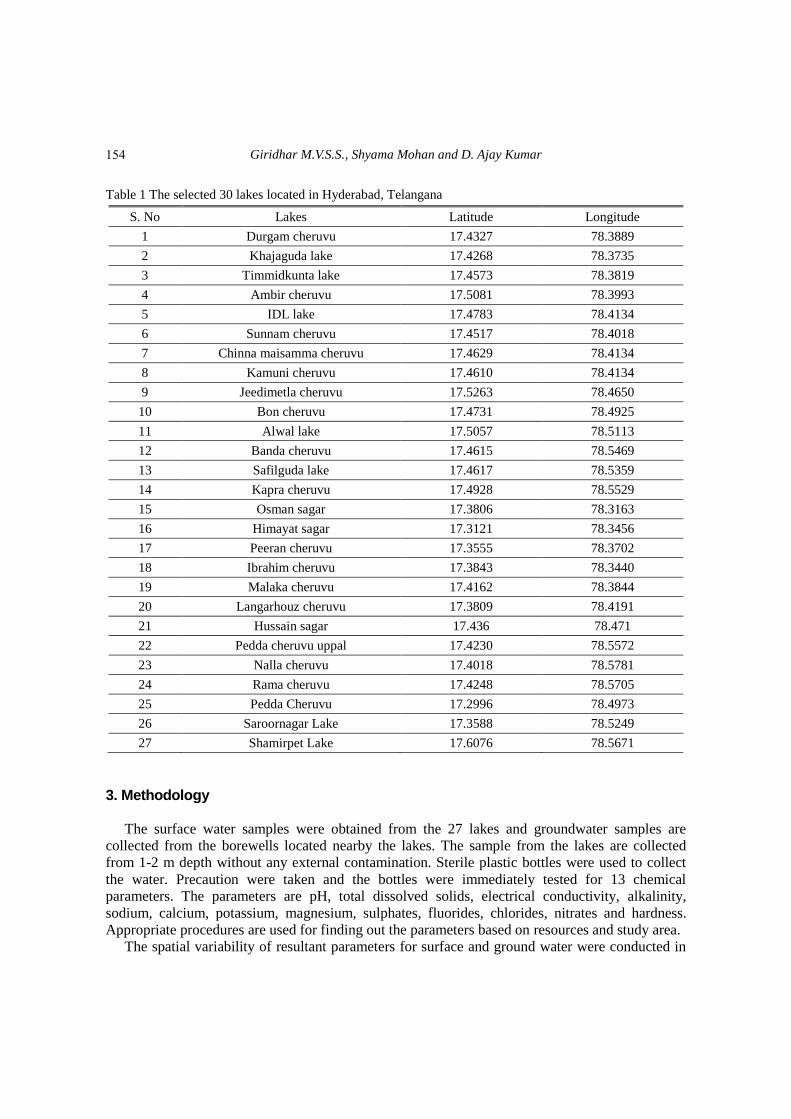
Table 1 The selected 30 lakes located in Hyderabad, Telangana
S. No Lakes Latitude Longitude
1 Durgam cheruvu 17.4327 78.3889
2 Khajaguda lake 17.4268 78.3735
3 Timmidkunta lake 17.4573 78.3819
4 Ambir cheruvu 17.5081 78.3993
5 IDL lake 17.4783 78.4134
6 Sunnam cheruvu 17.4517 78.4018
7 Chinna maisamma cheruvu 17.4629 78.4134
8 Kamuni cheruvu 17.4610 78.4134
9 Jeedimetla cheruvu 17.5263 78.4650
10 Bon cheruvu 17.4731 78.4925
11 Alwal lake 17.5057 78.5113
12 Banda cheruvu 17.4615 78.5469
13 Safilguda lake 17.4617 78.5359
14 Kapra cheruvu 17.4928 78.5529
15 Osman sagar 17.3806 78.3163
16 Himayat sagar 17.3121 78.3456
17 Peeran cheruvu 17.3555 78.3702
18 Ibrahim cheruvu 17.3843 78.3440
19 Malaka cheruvu 17.4162 78.3844
20 Langarhouz cheruvu 17.3809 78.4191
21 Hussain sagar 17.436 78.471
22 Pedda cheruvu uppal 17.4230 78.5572
23 Nalla cheruvu 17.4018 78.5781
24 Rama cheruvu 17.4248 78.5705
25 Pedda Cheruvu 17.2996 78.4973
26 Saroornagar Lake 17.3588 78.5249
27 Shamirpet Lake 17.6076 78.5671
3. Methodology
The surface water samples were obtained from the 27 lakes and groundwater samples are
collected from the borewells located nearby the lakes. The sample from the lakes are collected
from 1-2 m depth without any external contamination. Sterile plastic bottles were used to collect
the water. Precaution were taken and the bottles were immediately tested for 13 chemical
parameters. The parameters are pH, total dissolved solids, electrical conductivity, alkalinity,
sodium, calcium, potassium, magnesium, sulphates, fluorides, chlorides, nitrates and hardness.
Appropriate procedures are used for finding out the parameters based on resources and study area.
The spatial variability of resultant parameters for surface and ground water were conducted in
154
Comparative assessment of surface and ground water quality using geoinformatics
GIS. The sampling locations were integrated with data obtained from water quality testing and
spatial maps were generated using inverse weighted distance. Each parameter was analysed for the
spatial variation across the study area for both surface and groundwater. The impact of surface
water on ground water quality is done through statistical analysis. Correlation coefficient and
multiple regression analysis were carried out to obtain the influence of lakes on groundwater
quality. The parameters of surface water were correlated with groundwater quality and correlation
matrix was obtained to find the significant relation between the two. A linear regression equation
is obtained for each parameter.
4. Results and discussions
Specific parameters were analyzed spatially and statistically for lake and ground water. The
various parameters determined were pH, TDS, electrical conductivity, chlorides, calcium, sodium,
potassium, magnesium, alkalinity, nitrates, sulphates, fluorides, and total hardness shown in Figs.
2(a)-2(j).
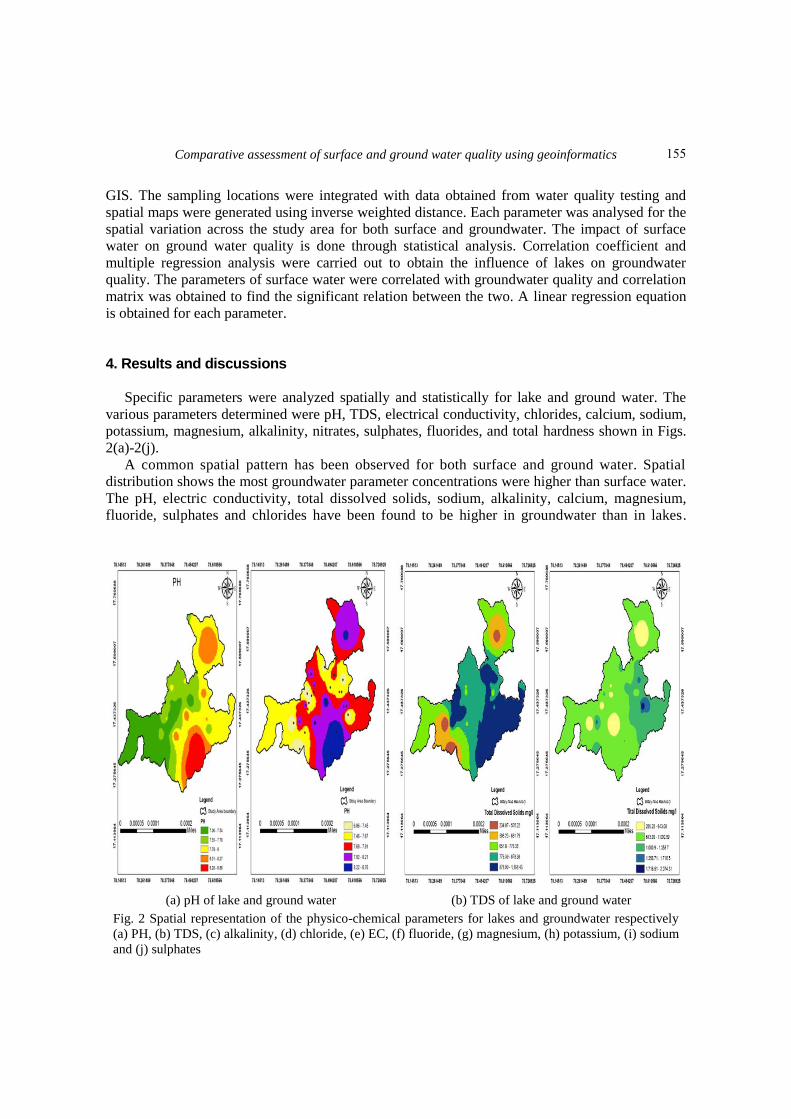
A common spatial pattern has been observed for both surface and ground water. Spatial
distribution shows the most groundwater parameter concentrations were higher than surface water.
The pH, electric conductivity, total dissolved solids, sodium, alkalinity, calcium, magnesium,
fluoride, sulphates and chlorides have been found to be higher in groundwater than in lakes.
(a) pH of lake and ground water (b) TDS of lake and ground water
Fig. 2 Spatial representation of the physico-chemical parameters for lakes and groundwater respectively
(a) PH, (b) TDS, (c) alkalinity, (d) chloride, (e) EC, (f) fluoride, (g) magnesium, (h) potassium, (i) sodium
and (j) sulphates
155
Giridhar M.V.S.S., Shyama Mohan and D. Ajay Kumar
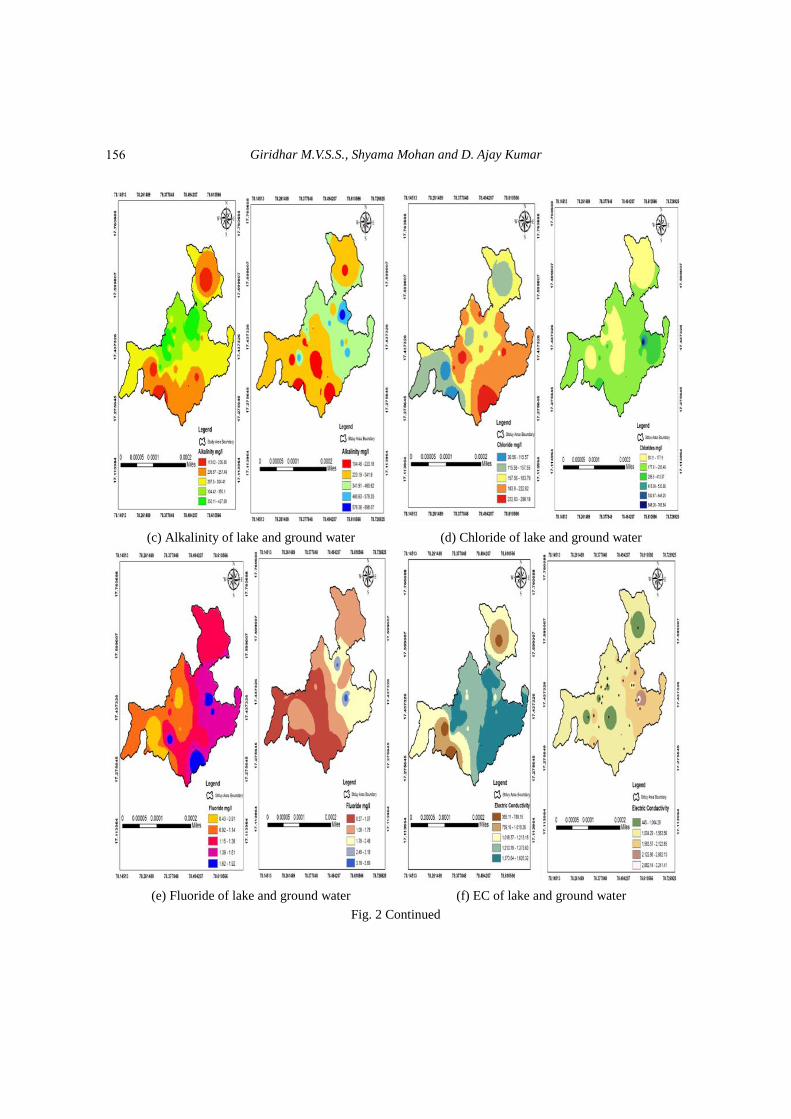
(c) Alkalinity of lake and ground water (d) Chloride of lake and ground water
(e) Fluoride of lake and ground water (f) EC of lake and ground water
Fig. 2 Continued
156
Comparative assessment of surface and ground water quality using geoinformatics
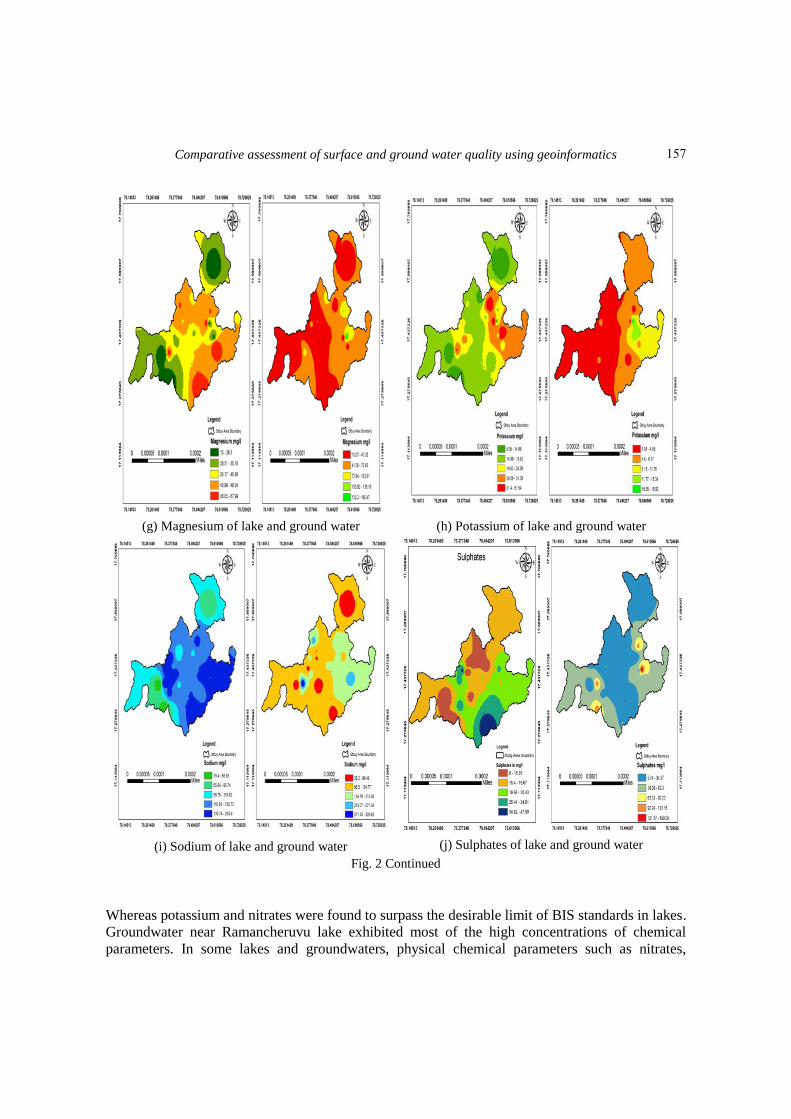
(g) Magnesium of lake and ground water (h) Potassium of lake and ground water
(i) Sodium of lake and ground water (j) Sulphates of lake and ground water
Fig. 2 Continued
Whereas potassium and nitrates were found to surpass the desirable limit of BIS standards in lakes.
Groundwater near Ramancheruvu lake exhibited most of the high concentrations of chemical
parameters. In some lakes and groundwaters, physical chemical parameters such as nitrates,
157
Giridhar M.V.S.S., Shyama Mohan and D. Ajay Kumar
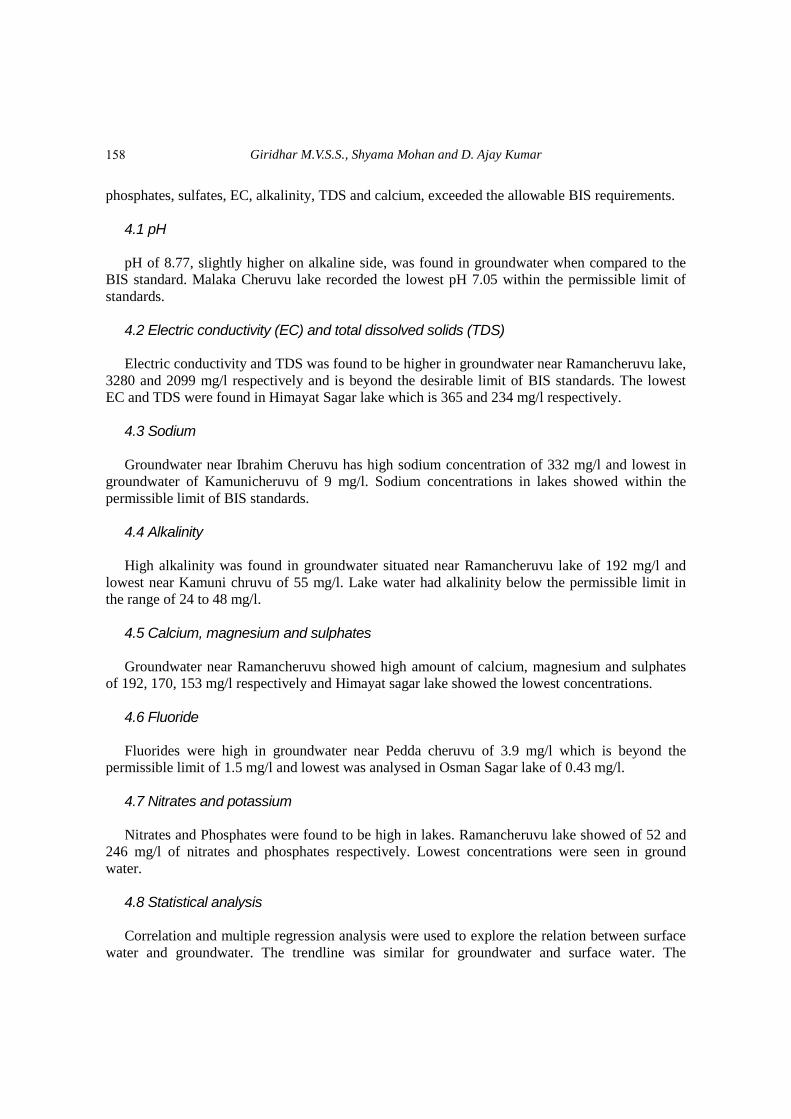
phosphates, sulfates, EC, alkalinity, TDS and calcium, exceeded the allowable BIS requirements.
4.1 pH pH of 8.77, slightly higher on alkaline side, was found in groundwater when compared to the
BIS standard. Malaka Cheruvu lake recorded the lowest pH 7.05 within the permissible limit of
standards.
4.2 Electric conductivity (EC) and total dissolved solids (TDS)
Electric conductivity and TDS was found to be higher in groundwater near Ramancheruvu lake,
3280 and 2099 mg/l respectively and is beyond the desirable limit of BIS standards. The lowest
EC and TDS were found in Himayat Sagar lake which is 365 and 234 mg/l respectively.
4.3 Sodium
Groundwater near Ibrahim Cheruvu has high sodium concentration of 332 mg/l and lowest in
groundwater of Kamunicheruvu of 9 mg/l. Sodium concentrations in lakes showed within the
permissible limit of BIS standards.
4.4 Alkalinity High alkalinity was found in groundwater situated near Ramancheruvu lake of 192 mg/l and
lowest near Kamuni chruvu of 55 mg/l. Lake water had alkalinity below the permissible limit in
the range of 24 to 48 mg/l.
4.5 Calcium, magnesium and sulphates
Groundwater near Ramancheruvu showed high amount of calcium, magnesium and sulphates
of 192, 170, 153 mg/l respectively and Himayat sagar lake showed the lowest concentrations.
4.6 Fluoride
Fluorides were high in groundwater near Pedda cheruvu of 3.9 mg/l which is beyond the
permissible limit of 1.5 mg/l and lowest was analysed in Osman Sagar lake of 0.43 mg/l.
4.7 Nitrates and potassium
Nitrates and Phosphates were found to be high in lakes. Ramancheruvu lake showed of 52 and
246 mg/l of nitrates and phosphates respectively. Lowest concentrations were seen in ground
water.
4.8 Statistical analysis
Correlation and multiple regression analysis were used to explore the relation between surface
water and groundwater. The trendline was similar for groundwater and surface water. The
158
Comparative assessment of surface and ground water quality using geoinformatics
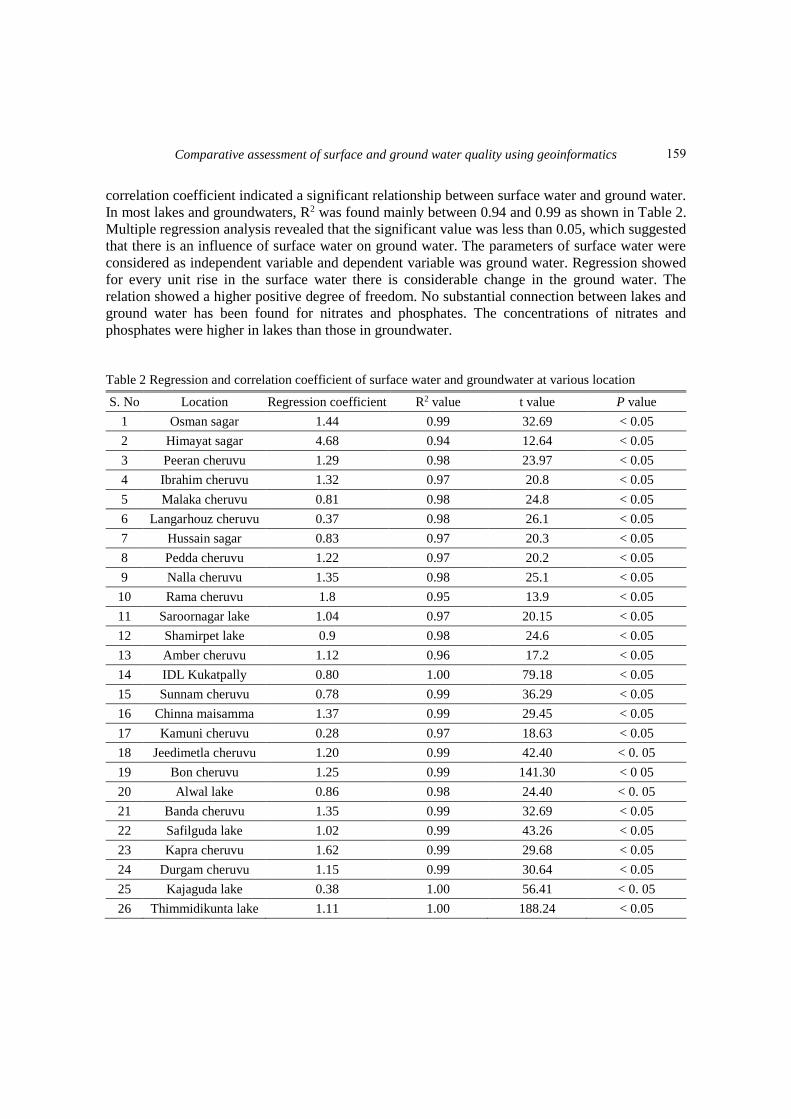
correlation coefficient indicated a significant relationship between surface water and ground water.
In most lakes and groundwaters, R2 was found mainly between 0.94 and 0.99 as shown in Table 2.
Multiple regression analysis revealed that the significant value was less than 0.05, which suggested
that there is an influence of surface water on ground water. The parameters of surface water were
considered as independent variable and dependent variable was ground water. Regression showed
for every unit rise in the surface water there is considerable change in the ground water. The
relation showed a higher positive degree of freedom. No substantial connection between lakes and
ground water has been found for nitrates and phosphates. The concentrations of nitrates and
phosphates were higher in lakes than those in groundwater.
Table 2 Regression and correlation coefficient of surface water and groundwater at various location
S. No Location Regression coefficient R2 value t value P value
1 Osman sagar 1.44 0.99 32.69 < 0.05
2 Himayat sagar 4.68 0.94 12.64 < 0.05
3 Peeran cheruvu 1.29 0.98 23.97 < 0.05
4 Ibrahim cheruvu 1.32 0.97 20.8 < 0.05
5 Malaka cheruvu 0.81 0.98 24.8 < 0.05
6 Langarhouz cheruvu 0.37 0.98 26.1 < 0.05
7 Hussain sagar 0.83 0.97 20.3 < 0.05
8 Pedda cheruvu 1.22 0.97 20.2 < 0.05
9 Nalla cheruvu 1.35 0.98 25.1 < 0.05
10 Rama cheruvu 1.8 0.95 13.9 < 0.05
11 Saroornagar lake 1.04 0.97 20.15 < 0.05
12 Shamirpet lake 0.9 0.98 24.6 < 0.05
13 Amber cheruvu 1.12 0.96 17.2 < 0.05
14 IDL Kukatpally 0.80 1.00 79.18 < 0.05
15 Sunnam cheruvu 0.78 0.99 36.29 < 0.05
16 Chinna maisamma 1.37 0.99 29.45 < 0.05
17 Kamuni cheruvu 0.28 0.97 18.63 < 0.05
18 Jeedimetla cheruvu 1.20 0.99 42.40 < 0. 05
19 Bon cheruvu 1.25 0.99 141.30 < 0 05
20 Alwal lake 0.86 0.98 24.40 < 0. 05
21 Banda cheruvu 1.35 0.99 32.69 < 0.05
22 Safilguda lake 1.02 0.99 43.26 < 0.05
23 Kapra cheruvu 1.62 0.99 29.68 < 0.05
24 Durgam cheruvu 1.15 0.99 30.64 < 0.05
25 Kajaguda lake 0.38 1.00 56.41 < 0. 05
26 Thimmidikunta lake 1.11 1.00 188.24 < 0.05
159
Giridhar M.V.S.S., Shyama Mohan and D. Ajay Kumar
5. Conclusions
A clear surface water impact was identified on groundwater. Multiple correlation indicated a
significant value of less than 0.005, rejecting null hypothesis and concluding a significant
relationship between lake and groundwater. The approach presented contributes to efficient water
quality monitoring and is useful in regulation of water management in surface and ground water.
The correlation between groundwater and surface water is mainly considered for urban area but
other anthropogenic activities like leaking and overflowing of sewers also affect the quality of
both lake and ground water.
References Ako, A.A., Eyong, G.E.T., Shimada, J., Koike, K., Hosono, T., Ichiyanagi, K., Richard, A., Tandia, B.K.,
Nkeng, G.E. and Roger, N.N. (2014), “Nitrate contamination of groundwater in two areas of the
Cameroon volcanic line (banana plain and mount Cameroon area)”, Appl. Water Sci., 4(2), 99-113.
https://doi.org/10.1007/s13201-013-0134-x.
Arias-Estévez, M., López-Periago, E., Martínez-Carballo, E., Simal-Gándara, J., Mejuto, J.C. and García-
Río, L. (2008), “The mobility and degradation of pesticides in soils and the pollution of groundwater
resources”, Agric. Ecosyst. Environ., 123(4), 247-260. https://doi.org/10.1016/j.agee.2007.07.011.
Brindha, K., Vaman, K.N., Srinivasan, K., Babu, M.S. and Elango, L. (2014), “Identification of surface
water-groundwater interaction by hydrogeochemical indicators and assessing its suitability for drinking
and irrigational purposes in Chennai, southern India”, Appl. Water Sci., 4(2), 159-174.
https://doi.org/10.1007/s13201-013-0138-6.
Lawrence, O.E. (2017), “Comparative quality analysis between surface water and groundwater: A case study
of Otamiri river and water boreholes in owerri west, Imo state Nigeria”, Int. J. Adv. Technol. Eng.
Explor., 4(36), 2394-5443. http://doi.org/10.19101/IJATEE.2017.436001.
Magroliya, V. and Trivedi, M. (2018), “Statistical correlation and seasonal comparative study of
groundwater samples of Jaipur”, Environ. Risk Assess Remediat., 2(4), 1-5.
Nnadi F.N. and Fulkerson, M. (2002), “Assessment of groundwater under direct influence of surface water”,
J. Environ. Sci. Health A, 37(7),1209-1222. https://doi.org/10.1081/ese-120005981.
Olasoji, S.O., Oyewole, N.O., Abiola, B. and Edokpayi, J.N. (2019), “Water quality assessment of surface
and groundwater sources using a water quality index method: A case study of a peri-urban town in
southwest, Nigeria”, Environments, 6(2), 23. https://doi.org/10.3390/environments6020023.
Omo-Irabor, O.O., Olobaniyi, S.B., Oduyemi, K. and Akunna, J (2008), “Surface and groundwater water
quality assessment using multivariate analytical methods: A case study of the western niger delta,
Nigeria”, Phys. Chem. Earth, 33(8-13), 2008, 666-673. https://doi.org/10.1016/j.pce.2008.06.019.
Rehman, F., Cheema, T., Lisa, M., Azeem, T., Ali Naseem, A., Khan, Z., Rehman, F. and Rehman, S.
(2018), “Statistical analysis tools for the assessment of groundwater chemical variations in wadi bani
malik area, Saudi Arabia”, Global NEST, 20(2), 355-362.
Shamsuddin, M.K.N., Suratman, S., Ramli, M.F., Sulaiman, W.N.A. and Sefie, A. (2015), “Hydrochemical
assessment of surfacewater and groundwater quality at bank infiltration site”, Proceedings of the Soft Soil
Engineering International Conference 2015 (SEIC2015), Langkawi, Malaysia, October.
Yu, L., Rozemeijer, J., Van Breukelen, B.M., Ouboter, M., Van Der Vlugt, C. and Broers, H.P. (2018),
“Groundwater impacts on surface water quality and nutrient loads in lowland polder catchments:
Monitoring the greater Amsterdam area”, Hydrol. Earth Syst. Sci., 22(1), 487-508.
https://doi.org/10.5194/hess-22-487-2018.
CC
160