Embed Size (px)
Citation preview
3 Egypt. J. Microbiol. 43, pp .37-52 (2008)
P
Comparative Assessment of Pullulan Production
by Aureobasidium pullulans under Fed-Batch and
Continuous Fermentation
A. M. Abdel Hafez, Hemmat M. Abdelhady, M. S. Sharaf
and T. S. El-Tayeb
Department of Agricultural Microbiology, Fac. of Agric., Ain
Shams University, Shoubra El-Kheima, Cairo, Egypt.
ULLULAN production was studied in bioreactor under fed-batch
….. and continuous cultures conditions by Aureobasidium pullulans
ATCC 42023. In fed batch culture, sugar feeding according to
consumption rate was the best strategy for pullulan production where
it recorded higher pullulan yield than pulsed and continuous sugar
feeding. The maximum amount of pullulan concentration was
obtained by using sugar feeding according to sugar consumption rate
being 88.8 gl-1, after 144 h followed by continuous culture technique
at 0.03 h-1 dilution rate, being 86.16 gl-1 after 96 h of incubation at
28ºC. Continuous culture at 0.03 h-1 dilution rate, 5.5 pH controlled,
aeration rate of 1.0 vvm air and agitation rate of 700 rpm, attained the
highest productivity of pullulan being 0.896 gl-1h-1. Therefore,
continuous culture technique with the dilution rate 0.03 h-1 was the
most efficient for pullulan production as it increased pullulan
formation by 1.5 fold compared with fed-batch culture. There was no
remarkable difference between using different solvents for pullulan
precipitation on the final concentrations. Produced pullulan gave close
physical properties to standard pullulan.
Keywords: A. pullulans ATCC 42023, Pullulan production,
Bioreactor, Fed-batch culture, Continuous culture
Pullulan is a microbial exopolysaccharide commercially produced by the yeast-
like fungus Aureobasidium pullulans. The pullulan polysaccharide is a linear
homopolysaccharide composed of polymerized glucopyranose units [linked by α
(1→4) glucosidic bonds] into maltotriose units [which are joined by α (1→6)
glucosidic bonds] (Szymanska & Galas, 1993). Due to its excellent properties,
pullulan is used as a low-calorie food ingredient, gelling agent, coating and
packaging material for food and drugs, binder for fertilizers and as an oxidation-
prevention agent for tablets. Other applications include contact lenses
manufacturing, biodegradable foil, plywood, water-solubility enhancer and for
enhanced oil recovery (Schuster et al., 1993; Israilides et al., 1998 and Leathers,
2003). Pullulan production has been the subject of numerous studies conducted
under batch (Szymanska & Galas, 1993; Madi et al., 1997; Roukas, 1999;
A. M. ABDEL HAFEZ et al.
Egypt. J. Microbiol. 43 (2008)
38
Szymanska et al., 1999; Barnett et al., 1999 and Lazaridou et al., 2002), fed-
batch (Ronen et al., 2002) and continuous fermentations (McNeil et al., 1989;
McNeil & Kristiansen, 1990; Reeslev et al., 1993; Simon et al., 1993; Audet
et al., 1996; Gibbs, 1996; Gibbs & Seviour, 1996 and Audet et al., 1998). Lebrun
et al. (1994) achieved a maximum pullulan concentration of 35 gl-1
after 120 h of
batch fermentation using a synthetic medium and a 5 l mechanically stirred tank
reactor. Gibbs (1996) found that in all impeller systems examined, the increase
in agitation rate resulted in a marked and reproducible decrease in
exopolysaccharide production by A. pullulans under batch conditions in a 10 l
stirred tank reactor. McNeil & Kristiansen (1990) studied the influence of
temperature on pullulan formation, cell growth and morphology of A. pullulans
in continuous cultures at 20-36°C on 20 kg/m
3 sucrose using bioreactor. Reeslev
et al. (1993) studied the yeast-mycelium dimorphism of A. pullulans in
continuous culture using a defined medium at a constant dilution rate (0.08 h-1
).
They reported that morphological status of the culture could be controlled by the
input concentration of Zn2+
. Schuster et al. (1993) carried out both batch-wise
and continuous fermentations in a stirred vessel fermentor. In batch
fermentation, about 45% of glucose was converted into pullulan at maximum
formation rate of 0.16 gl-1
h-1
using standard medium and the yield of pullulan
was maintained at 45% in continuous cultures. At a dilution rate of 0.05 h-1
, the
formation rate of pullulan increased up to 0.35 gl-1
h-1
. Ronen et al. (2002)
designed a feeding strategy dependent on the culture cellular composition to
keep the yeast-like cell concentration high. Feeding was actuated when the yeast-
like cell concentration decreased below a threefold. The proposed control
strategy improved pullulan production by increasing both productivity and yield
of the cells by 67% and 80%, correspondingly.
Many publications are concerned with the control of pullulan synthesis by
controlling pullulan fermentation and culture conditions. Overall, this literature
is confusing and seemingly contradictory. In part, this could be attributed
multiple factors which interact in regulation of pullulan biosynthesis. In this
investigation, a comparison between techniques applied for pullulan
fermentation, i.e., fed-batch and continuous cultures using bioreactor was
thought to optimize pullulan production and identify some factors affecting
fermentation processes.
Materials and Methods
Fungal strain
Aureobasidium pullulans ATCC 42023 was obtained from American Type
Culture Collection, subcultured monthly on malt agar slants at 30°C, and
maintained at 4°C.
Media
Malt agar medium (Atlas, 1997) was used for propagation and preservation
of aureobasidium culture. The modified Reeslev & Jensen medium (20%
sucrose), (Eltayeb et al., 2005), was used for pullulan production after
replacement of its nitrogen source with 7% corn steep liquor.
COMPARATIVE ASSESSMENT OF PULLULAN PRODUCTION …
Egypt. J. Microbiol. 43 (2008)
39
Standard inoculum
Standard inoculum was prepared by transferring a loop of the tested culture
into 250 ml conical flasks containing 50 ml of modified Reeslev & Jensen
medium. The inoculated flask was incubated on a rotary shaker at 210 rpm for
48 hr at 30°C. The content of this flask was used as a standard inoculum (1 ml
contained 6.0–7.0 x 10⁵ viable cells). The inoculum was then prepared by
centrifugation at 12000 x g for 15 min, and cells were washed twice with sterile
distilled water and harvested to inoculate productive medium as the method
described by Shabtai & Mukmenev (1995).
Fermentation process and cultural conditions
Fermentation was carried out using a 3 l dished bottom bioreactor Z 6110 /
coob (Cole–Parmer Instruments), which consisted of 3 l vessel equipped with
lipseal stirrer assembly, automatic pH controller, automatic dissolved O2,
automatic temperature controller, multi–channel peristaltic pump (for feeding)
and all the accessories for continuous cultivation. Temperature of pullulan
production was controlled at 28°C (Eltayeb et al., 2005). pH of all productive
cultures was maintained at 5.5 through cultivation, by the automatic addition of
2 N NaOH. In all experiments, aeration and agitation rates were adjusted at 1
vvm, 700 rpm, respectively.
Fed-batch culture
Three sucrose feeding strategies were conducted to determine the more
suitable for high pullulan production.
Continuous and pulsed sugar feeding: The amount of sugar added in both
fermentations was equivalent to 200 gl-1
. In continuous feeding, sugar solutions
(40% sucrose) were fed continuously during the first two, three and four days of
incubation at addition rates of 4.15, 2.75 and 2.08 gl-1
h-1
, respectively. In pulsed
feeding, four additions of sugar solution were carried out at 24 h intervals during
the first 72 h of cultivation period. The pH was controlled at 5.5 with 2 N NaOH
solution during the fermentation. The final working volume in the bioreactor was
2 l at the end of feeding period in all cases.
Sugar feeding according to consumption rate: In this feeding strategy, the
sugar solution (175 gl-1
sucrose) was fed according to consumption rate of sugar
obtained from previous study. Thus, addition rate was changed every 24 h
incubation period. Applied feeding rates were 0.93, 2.1, 2.0, 1.53, 0.7 and 0.004
gl-1
h-1
, at 24, 48, 72, 96, 120 and 144 h of incubation period, respectively.
Continuous culture
Continuous culture was carried out using 1800 ml of medium. After
sterilization, the medium was inoculated by HCDI (approx. 2.5 gl-1
dry cells) to
accommodate 2 l final working volume. The culture in the vessel was aerated at
1.0 vvm, agitated at 700 rpm and allowed to grow up as a batch culture for 72 hr.
After this period, fresh medium was pumped into the culture at different flow
A. M. ABDEL HAFEZ et al.
Egypt. J. Microbiol. 43 (2008)
40
rates of 20, 40, 60 and 80 ml h-1
to give 0.01, 0.02, 0.03 and 0.04 h-1
dilution
rates, respectively. Cultivation of each dilution rate was kept for at least 5 days
intervals. Samples were taken aseptically at each steady state to determine the
biomass, pullulan production and consumed sugars.
Pullulan recovery
The effects of different organic solvents for pullulan recovery were evaluated
to select the best solvent for high recovery. Methanol, ethanol, isopropanol
(95 %) and recycled-ethanol were used in this study. A rotary evaporator
adjusted at 70°C was used for the distillation of the recycled-ethanol collected
from various precipitations.
Pullulan determination
Pullulan was precipitated in the culture supernatant with 2 volumes of
ethanol 99%, at 4°C for 1 hr. The precipitate was centrifuged at 4000 x g for
10 min followed by drying at 80°C overnight and was then weighed (GÖksungur
et al., 2004).
Chemical determinations
Total residual sugars were determined in the fermented liquor according to
the method described by Flood & Priestly (1973). Total nitrogen of pullulan was
determined using Kjeldahel method as described by Jackson (1973). Organic
carbon of pullulan was determined according to the method shown by Jackson
(1973). Ash content was determined using the method of Herbert et al. (1971).
Parameters related to pullulan production
Yield factor (%), pullulan yield coefficient relative to biomass (Yp/x),
conversion coefficient (%), pullulan yield (%) and productivity (P) were
calculated according to Gamal et al. (1991).
Results and Discussion
Comparative assessment of pullulan production efficiency under fed-batch and
continuous culture conditions Fed-batch culture
In fermentation processes where cell growth and/or product formation may
be inhibited by high substrate concentration, the substrate was intermittently fed
to the culture system in order to maintain a substrate concentration that enhances
the biological and metabolic activity. Empirical feeding policies were adopted to
get high pullulan productive culture including pulsed and continuous feeding as
well as feeding corresponding to sugar consumption rate. Continuous sugar feeding: Data presented in Tables 1, 2 & 3 show the
biological activities of A. pullulans ATCC 42023 grown in modified Reeslev &
Jensen medium as a fed-batch culture using continuous sucrose feeding rates
4.15, 2.75 and 2.08 gl-1
h-1
during the first 2, 3 and 4 days of fermentation. Data
clearly show that cell dry weight, pullulan concentration and consumed sugar
COMPARATIVE ASSESSMENT OF PULLULAN PRODUCTION …
Egypt. J. Microbiol. 43 (2008)
41
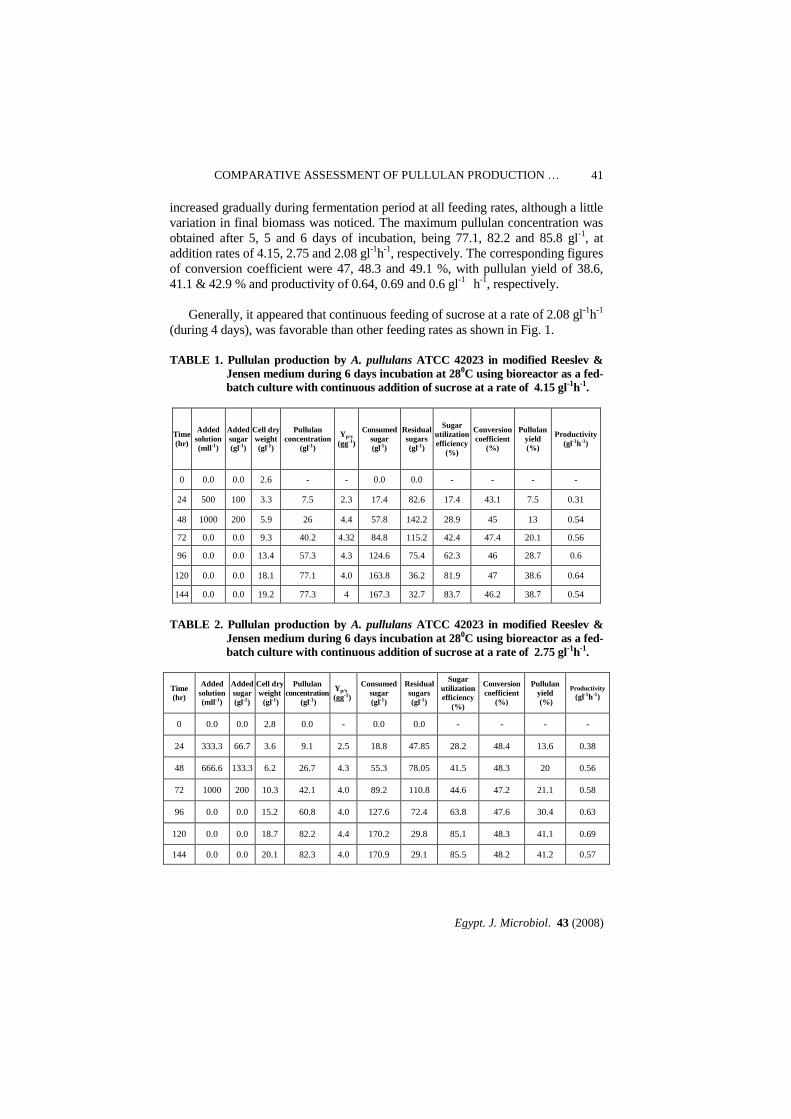
increased gradually during fermentation period at all feeding rates, although a little
variation in final biomass was noticed. The maximum pullulan concentration was
obtained after 5, 5 and 6 days of incubation, being 77.1, 82.2 and 85.8 gl-1
, at
addition rates of 4.15, 2.75 and 2.08 gl-1
h-1
, respectively. The corresponding figures
of conversion coefficient were 47, 48.3 and 49.1 %, with pullulan yield of 38.6,
41.1 & 42.9 % and productivity of 0.64, 0.69 and 0.6 gl-1
h-1
, respectively.
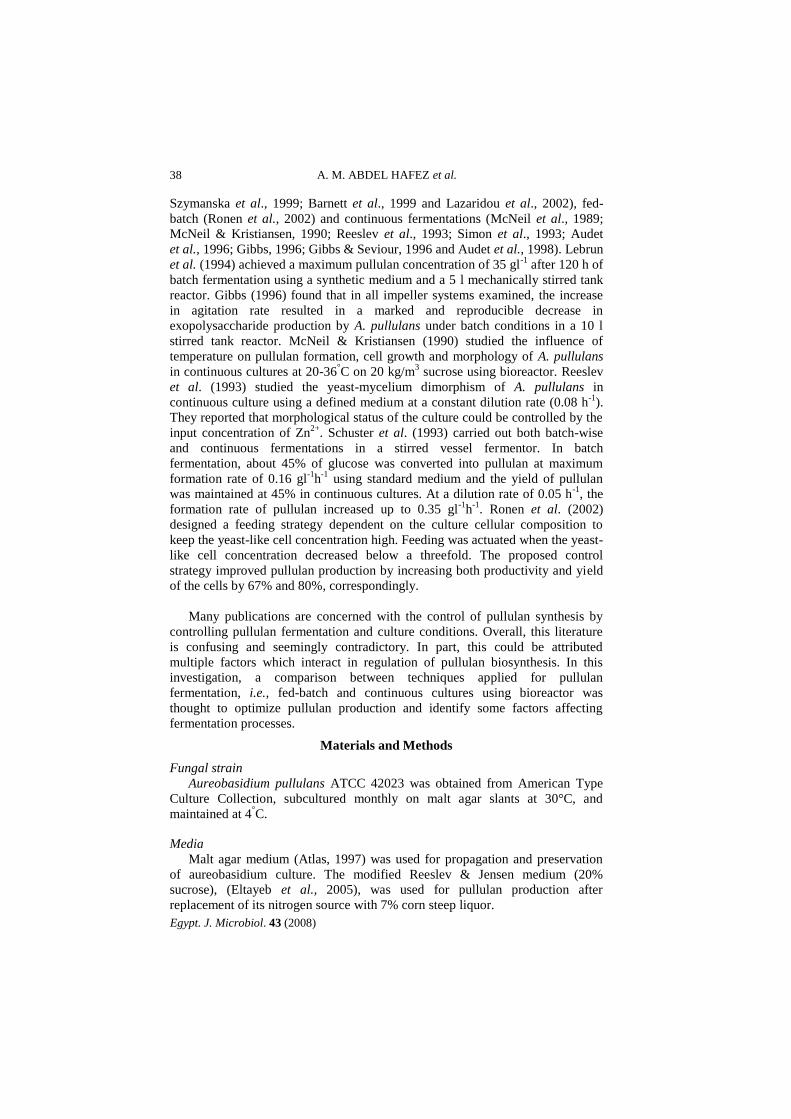
Generally, it appeared that continuous feeding of sucrose at a rate of 2.08 gl-1
h-1
(during 4 days), was favorable than other feeding rates as shown in Fig. 1.
TABLE 1. Pullulan production by A. pullulans ATCC 42023 in modified Reeslev &
Jensen medium during 6 days incubation at 280C using bioreactor as a fed-
batch culture with continuous addition of sucrose at a rate of 4.15 gl-1h-1.
Time
(hr)
Added
solution
(mll-1)
Added
sugar
(gl-1)
Cell dry
weight
(gl-1)
Pullulan
concentration
(gl-1)
Yp/x
(gg-1)
Consumed
sugar
(gl-1)
Residual
sugars
(gl-1)
Sugar
utilization
efficiency
(%)
Conversion
coefficient
(%)
Pullulan
yield
(%)
Productivity
(gl-1h-1)
0 0.0 0.0 2.6 - - 0.0 0.0 - - - -
24 500 100 3.3 7.5 2.3 17.4 82.6 17.4 43.1 7.5 0.31
48 1000 200 5.9 26 4.4 57.8 142.2 28.9 45 13 0.54
72 0.0 0.0 9.3 40.2 4.32 84.8 115.2 42.4 47.4 20.1 0.56
96 0.0 0.0 13.4 57.3 4.3 124.6 75.4 62.3 46 28.7 0.6
120 0.0 0.0 18.1 77.1 4.0 163.8 36.2 81.9 47 38.6 0.64
144 0.0 0.0 19.2 77.3 4 167.3 32.7 83.7 46.2 38.7 0.54
TABLE 2. Pullulan production by A. pullulans ATCC 42023 in modified Reeslev &
Jensen medium during 6 days incubation at 280C using bioreactor as a fed-
batch culture with continuous addition of sucrose at a rate of 2.75 gl-1h-1.
Time
(hr)
Added
solution
(mll-1)
Added
sugar
(gl-1)
Cell dry
weight
(gl-1)
Pullulan
concentration
(gl-1)
Yp/x
(gg-1)
Consumed
sugar
(gl-1)
Residual
sugars
(gl-1)
Sugar
utilization
efficiency
(%)
Conversion
coefficient
(%)
Pullulan
yield
(%)
Productivity
(gl-1h-1)
0 0.0 0.0 2.8 0.0 - 0.0 0.0 - - - -
24 333.3 66.7 3.6 9.1 2.5 18.8 47.85 28.2 48.4 13.6 0.38
48 666.6 133.3 6.2 26.7 4.3 55.3 78.05 41.5 48.3 20 0.56
72 1000 200 10.3 42.1 4.0 89.2 110.8 44.6 47.2 21.1 0.58
96 0.0 0.0 15.2 60.8 4.0 127.6 72.4 63.8 47.6 30.4 0.63
120 0.0 0.0 18.7 82.2 4.4 170.2 29.8 85.1 48.3 41.1 0.69
144 0.0 0.0 20.1 82.3 4.0 170.9 29.1 85.5 48.2 41.2 0.57
A. M. ABDEL HAFEZ et al.
Egypt. J. Microbiol. 43 (2008)
42
TABLE 3. Pullulan production by A. pullulans ATCC 42023 in modified Reeslev &
Jensen medium during 6 days incubation at 280C using bioreactor as a
fed-batch culture with continuous addition of sucrose at a rate of
2.08 gl-1h-1.
Time
(h)
Added
solution
(mll-1)
Added
sugar
(gl-1)
Cell dry
weight
(gl-1)
Pullulan
concentration
(gl-1)
Yp/x
(gg-1)
Consumed
sugar
(gl-1)
Residual
sugars
(gl-1)
Sugar
utilization
efficiency
(%)
Conversion
coefficient
(%)
Pullulan
yield
(%)
Productivity
(gl-1h-1)
0 0.0 0.0 2.75 0.0 - - - - - - -
24 250 50 3.1 10.2 3.3 22.4 27.6 44.8 45.5 20.4 0.425
48 500 100 5.5 33.3 6 73.2 26.8 73.2 45.5 33.3 0.69
72 750 150 8.4 56 6.7 121 29 80.7 46.3 37.3 0.78
96 1000 200 12.7 75.3 5.9 157.9 42.1 78.95 47.7 37.7 0.78
120 0.0 0.0 19.3 85.2 4.4 174.6 25.4 87.3 48.8 42.6 0.71
144 0.0 0.0 19.5 85.8 4.4 174.7 25.3 87.35 49.1 42.9 0.6
0
20
40
60
80
100
120
140
160
180
Cell dry weight(gl-1) Yp/x Conversion coefficient(%) Productivity (gl-1h-1) X 10
(gl-1
) -
(%)
4.15 2.75
2.08
Related parameters of pullulan fermentation
Fig. 1. Pullulan production related parameters as affected by different continuous
sugar feeding rates in modified Reeslev & Jensen medium after 5 days of
incubation at 28°C using bioreactor as a fed-batch culture.
Cell dry weight (g1-1) Yplx Conversion coefficient (%) Productivity (g-1h-1)x10
COMPARATIVE ASSESSMENT OF PULLULAN PRODUCTION …
Egypt. J. Microbiol. 43 (2008)
43
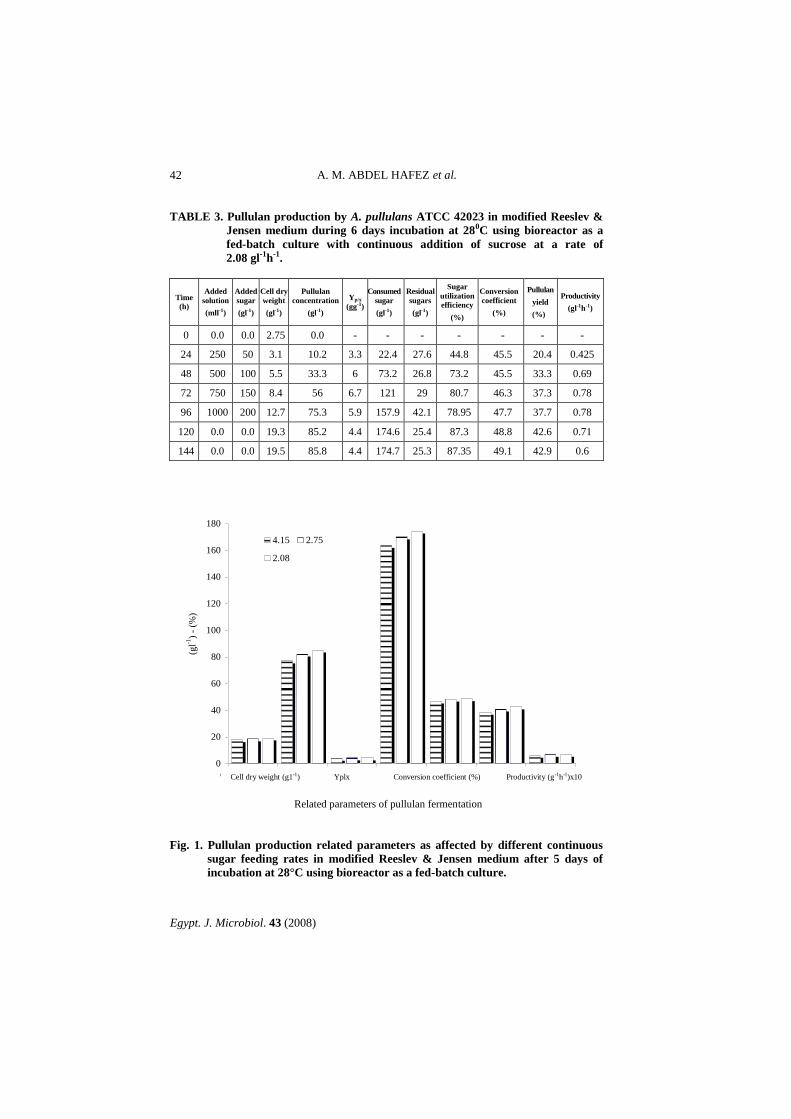
Pulsed sugar feeding: Pulsed addition of sucrose was carried out every 24 h of
incubation during the first 4 days of fermentation, to avoid some problems occurred
by continuous addition due to tubes damage, squeezing and blocking with fungal
attacks. Data in Table 4 show the effect of pulsed sucrose solution addition at specific
addition rate of 0.019 gh-1
on growth and pullulan production by A. pullulans ATCC
42023. At the end of fermentation period (6 days), the highest figures of cell dry
weight, pullulan concentration, sugar utilization efficiency and pullulan yield were
obtained being 18.5 gl-1, 77.8 gl
-1, 81 % and 38.9 %, respectively. Whereas, the
highest productivity was recorded after 5 days being 0.65 gl-1
h-1
.
TABLE 4. Pullulan production by A. pullulans ATCC 42023 in modified Reeslev &
Jensen medium during 6 days incubation at 280C using bioreactor as a
fed-batch culture with pulsed addition of sucrose at specific addition rate
of 0.019 gh-1.
Time
(hr)
Added
solution
(mll-1)
Added
sugar
(gl-1)
Cell dry
weight
(gl-1)
Pullulan
conc.
(gl-1)
Yp/x
(gg-1)
Consumed
sugar
(gl-1)
Residual
sugars
(gl-1)
Sugar
utilization
efficiency
(%)
Conversion
coefficient
(%)
Pullulan
yield
(%)
Productivity
(gl-1h-1)
0 250 50 3.1 0.0 - - 50 - - - -
24 500 100 5.1 7.2 1.41 16.8 33.2 33.6 42.9 14.4 0.3
48 750 150 7.2 24.4 3.39 54.6 45.4 54.6 44.7 24.4 0.5
72 1000 200 9.3 38.3 4.11 87.4 62.6 58.3 43.8 25.5 0.53
96 0.0 0.0 12.7 55.8 4.39 119.3 80.8 59.7 46.7 27.9 0.58
120 0.0 0.0 18.3 77.6 4.24 161.5 38.5 80.75 48 38.8 0.65
144 0.0 0.0 18.5 77.8 4.21 162 38 81 48 38.9 0.54
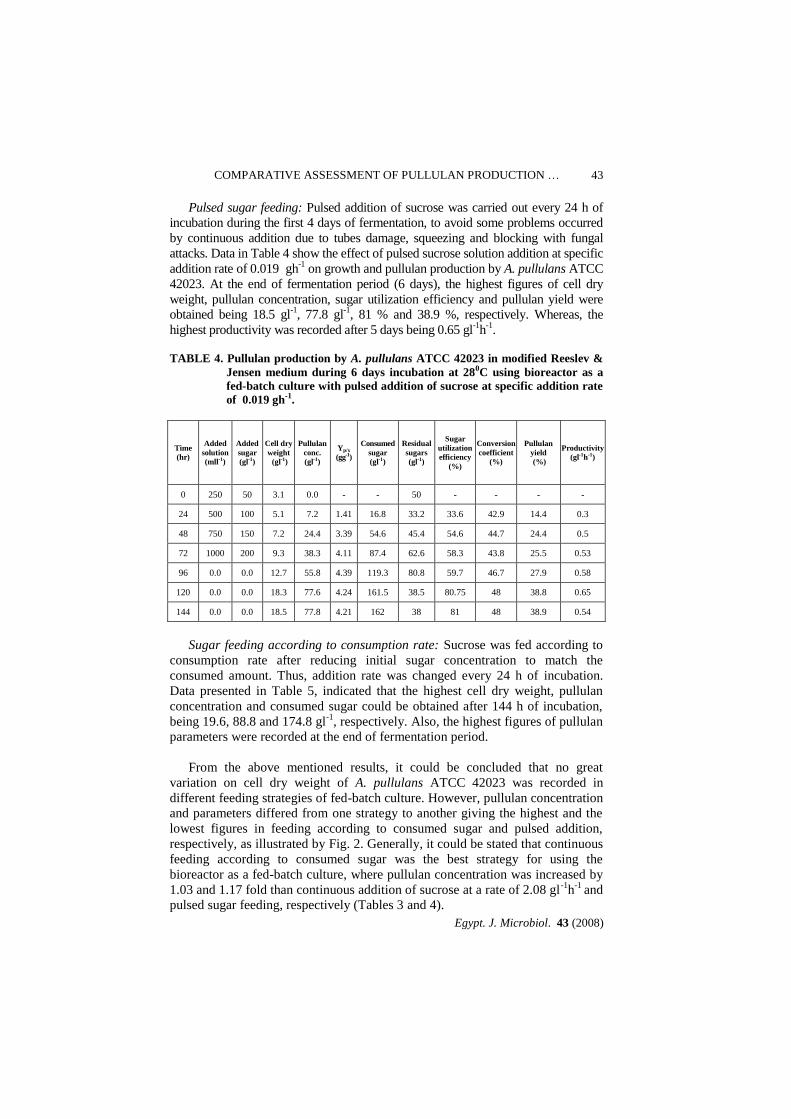
Sugar feeding according to consumption rate: Sucrose was fed according to
consumption rate after reducing initial sugar concentration to match the
consumed amount. Thus, addition rate was changed every 24 h of incubation.
Data presented in Table 5, indicated that the highest cell dry weight, pullulan
concentration and consumed sugar could be obtained after 144 h of incubation,
being 19.6, 88.8 and 174.8 gl-1
, respectively. Also, the highest figures of pullulan
parameters were recorded at the end of fermentation period.
From the above mentioned results, it could be concluded that no great
variation on cell dry weight of A. pullulans ATCC 42023 was recorded in
different feeding strategies of fed-batch culture. However, pullulan concentration
and parameters differed from one strategy to another giving the highest and the
lowest figures in feeding according to consumed sugar and pulsed addition,
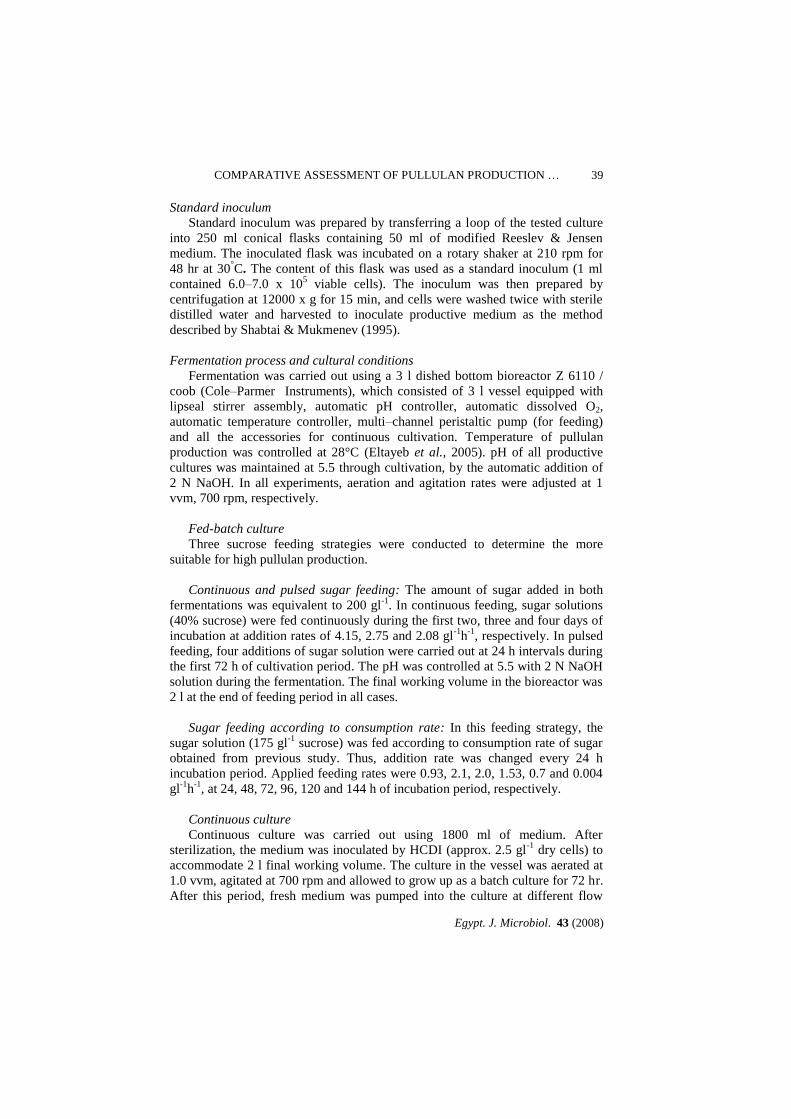
respectively, as illustrated by Fig. 2. Generally, it could be stated that continuous
feeding according to consumed sugar was the best strategy for using the
bioreactor as a fed-batch culture, where pullulan concentration was increased by
1.03 and 1.17 fold than continuous addition of sucrose at a rate of 2.08 gl-1
h-1
and
pulsed sugar feeding, respectively (Tables 3 and 4).
A. M. ABDEL HAFEZ et al.
Egypt. J. Microbiol. 43 (2008)
44
TABLE 5. Pullulan production by A. pullulans ATCC 42023 in modified Reeslev &
Jensen medium during 6 days incubation at 280C using bioreactor as a
fed-batch culture with different sucrose addition rates according to
consumed sugar.
Time
(h-1)
Added
solution
(mll-1)
Total
added
sugar
(gl-1)
Added
sugar
(gl-1)
Sugar
addition
rate
(gl-1h-1)
Celldry
weight
(gl-1)
Pullulan
conc.
(gl-1)
Yp/x
(gg-1)
Consumed
sugar
(gl-1)
Residual
sugars
(gl-1)
Sugar
utilization
efficiency
(%)
Conversion
coefficient
(%)
Productivity
(gl-1h-1)
0 0.0 0.0 0.0 0.0 2.77 0.0 0.0 0.0 0.0 0.0 0.0 0.0
24 128 22.5 22.5 0.93 3.3 13.3 4 22.5 0.0 100 59.1 0.55
48 290.2 73.3 50.8 2.1 5.3 40.8 7.7 73.3 0.0 100 55.7 0.85
72 273.1 121 47.9 2 8.6 57.5 6.7 120.6 0.4 99.6 47.7 0.8
96 210.9 157.9 36.9 1.53 13.1 77.3 5.9 157.4 0.5 99.7 49.1 0.81
120 96.4 174.6 16.8 0.7 19.4 84.2 4.3 174.3 0.3 99.8 48.3 0.7
144 1.0 175 0.1 0.004 19.6 88.8 4.5 174.8 0.2 99.9 50.8 0.62
0
20
40
60
80
100
(gl-1
) -
(%)
Cell dry weight (gl-
1)
Pullulan
concentration (gl-1)
Sugar utilization
efficiency (%)
Conversion
coefficent (%)
Pullulan yield (%) Productivity (gl-
1h-1) X 10
Related parameters of pullulan fermentation
Pulsed addition at 0.019 g/h
Continuous sugar feeding at 2.08 g/l/h
Sugar feeding at consumption rate
Fig. 2. Pullulan production parameters by A. pullulans ATCC 42023 as affected by
different sugar feeding strategies in modified Reeslev & Jensen medium after
6 days of incubation at 28°C using bioreactor as a fed-batch culture.
Continuous culture
The biological activity of A. pullulans ATCC 42023 on modified Reeslev &
Jensen medium was studied in continuous culture at different dilution rates
(different steady states). Pullulan production, consumed sugar, biomass dry
Cell dry weight (g1-1) Pullulan Sugar utilization Conversion Pullulan yield (%) Productivity (g1-1h-1)
concentration (g 1-1) efficiency (%) coefficient (%) x10
COMPARATIVE ASSESSMENT OF PULLULAN PRODUCTION …
Egypt. J. Microbiol. 43 (2008)
45
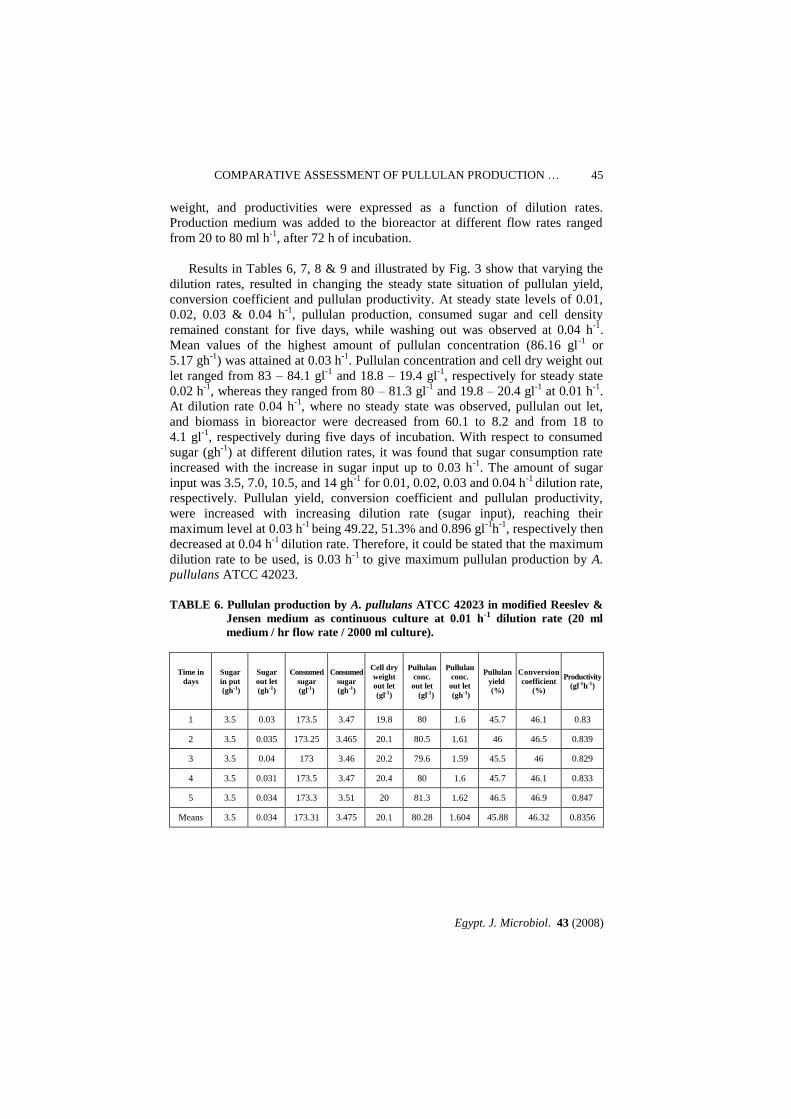
weight, and productivities were expressed as a function of dilution rates.
Production medium was added to the bioreactor at different flow rates ranged
from 20 to 80 ml h-1
, after 72 h of incubation.
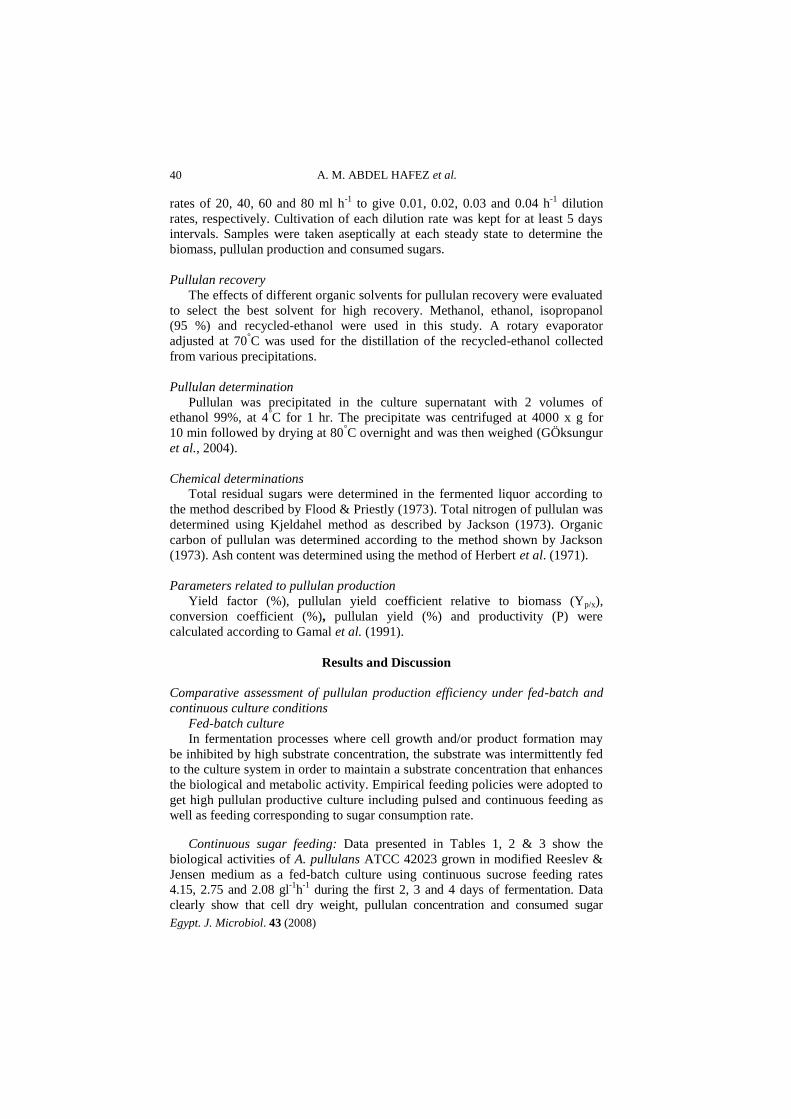
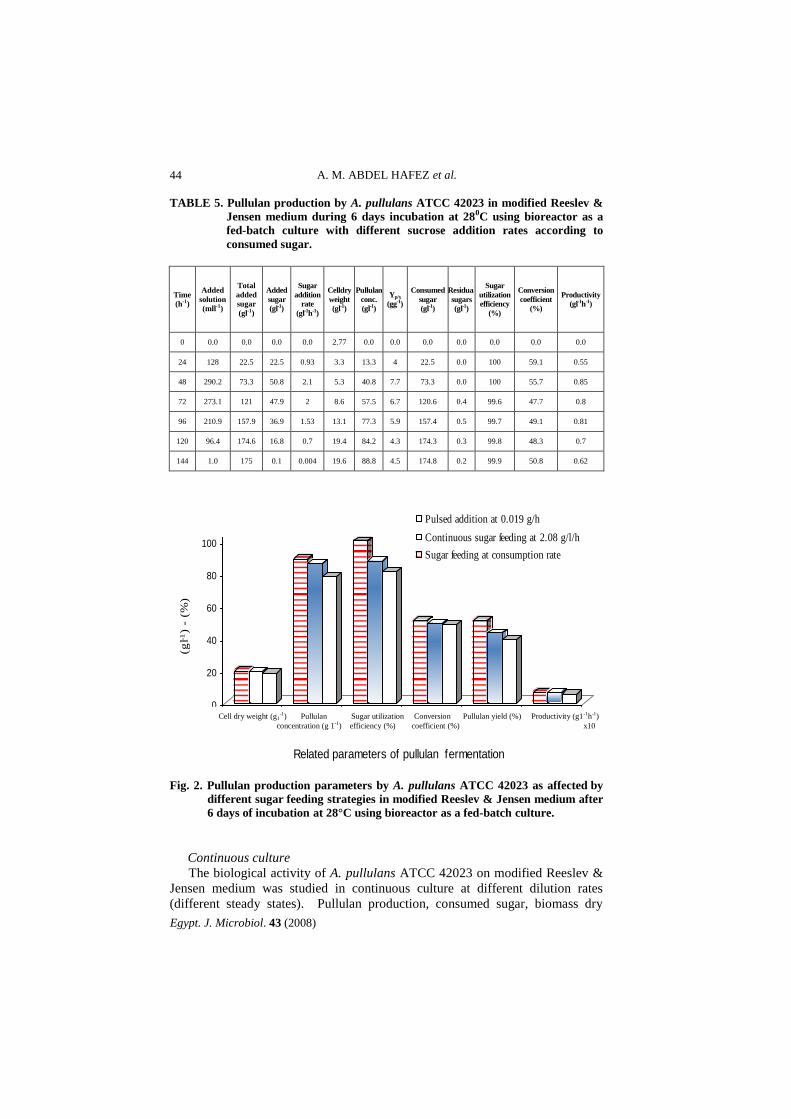
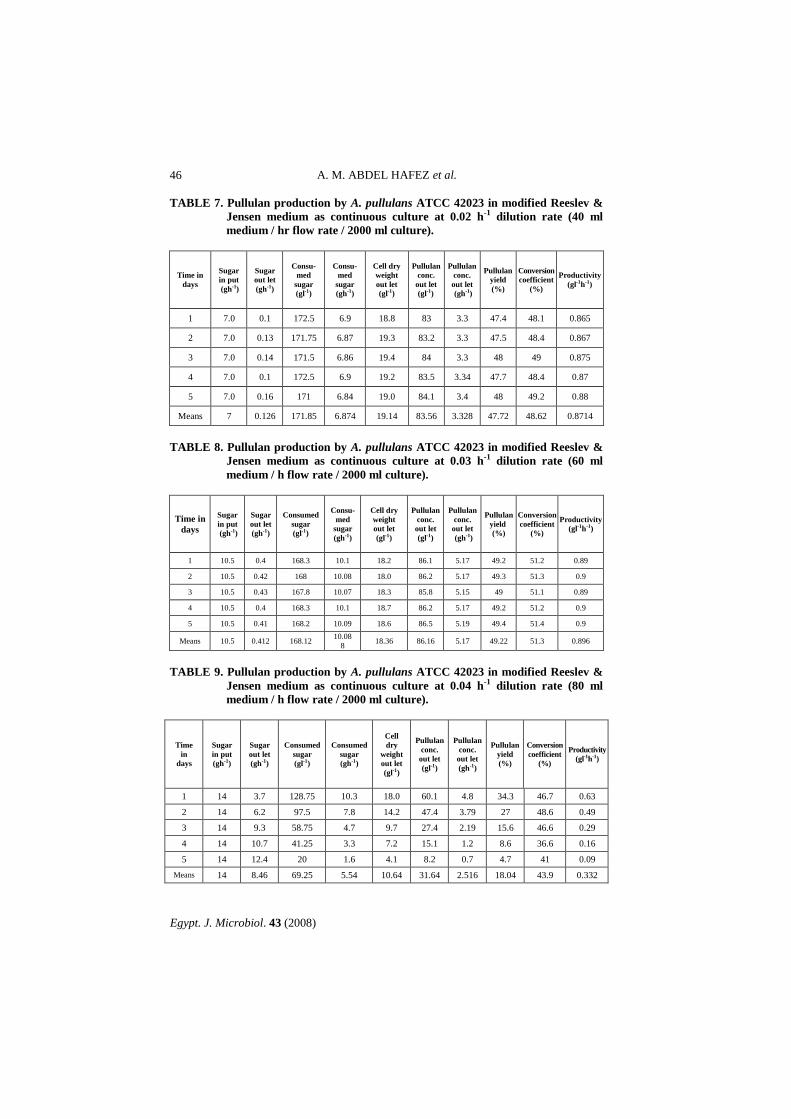
Results in Tables 6, 7, 8 & 9 and illustrated by Fig. 3 show that varying the
dilution rates, resulted in changing the steady state situation of pullulan yield,
conversion coefficient and pullulan productivity. At steady state levels of 0.01,
0.02, 0.03 & 0.04 h-1
, pullulan production, consumed sugar and cell density
remained constant for five days, while washing out was observed at 0.04 h-1
.
Mean values of the highest amount of pullulan concentration (86.16 gl-1
or
5.17 gh-1
) was attained at 0.03 h-1
. Pullulan concentration and cell dry weight out
let ranged from 83 – 84.1 gl-1
and 18.8 – 19.4 gl-1
, respectively for steady state
0.02 h-1
, whereas they ranged from 80 – 81.3 gl-1
and 19.8 – 20.4 gl-1
at 0.01 h-1
.
At dilution rate 0.04 h-1
, where no steady state was observed, pullulan out let,
and biomass in bioreactor were decreased from 60.1 to 8.2 and from 18 to
4.1 gl-1
, respectively during five days of incubation. With respect to consumed
sugar (gh-1
) at different dilution rates, it was found that sugar consumption rate
increased with the increase in sugar input up to 0.03 h-1
. The amount of sugar
input was 3.5, 7.0, 10.5, and 14 gh-1
for 0.01, 0.02, 0.03 and 0.04 h-1
dilution rate,
respectively. Pullulan yield, conversion coefficient and pullulan productivity,
were increased with increasing dilution rate (sugar input), reaching their
maximum level at 0.03 h-1
being 49.22, 51.3% and 0.896 gl-1
h-1
, respectively then
decreased at 0.04 h-1
dilution rate. Therefore, it could be stated that the maximum
dilution rate to be used, is 0.03 h-1
to give maximum pullulan production by A.
pullulans ATCC 42023.
TABLE 6. Pullulan production by A. pullulans ATCC 42023 in modified Reeslev &
Jensen medium as continuous culture at 0.01 h-1 dilution rate (20 ml
medium / hr flow rate / 2000 ml culture).
Time in
days
Sugar
in put
(gh-1)
Sugar
out let
(gh-1)
Consumed
sugar
(gl-1)
Consumed
sugar (gh-1)
Cell dry
weight
out let
(gl-1)
Pullulan
conc.
out let
(gl-1)
Pullulan
conc.
out let
(gh-1)
Pullulan
yield
(%)
Conversion
coefficient
(%)
Productivity
(gl-1h-1)
1 3.5 0.03 173.5 3.47 19.8 80 1.6 45.7 46.1 0.83
2 3.5 0.035 173.25 3.465 20.1 80.5 1.61 46 46.5 0.839
3 3.5 0.04 173 3.46 20.2 79.6 1.59 45.5 46 0.829
4 3.5 0.031 173.5 3.47 20.4 80 1.6 45.7 46.1 0.833
5 3.5 0.034 173.3 3.51 20 81.3 1.62 46.5 46.9 0.847
Means 3.5 0.034 173.31 3.475 20.1 80.28 1.604 45.88 46.32 0.8356
A. M. ABDEL HAFEZ et al.
Egypt. J. Microbiol. 43 (2008)
46
TABLE 7. Pullulan production by A. pullulans ATCC 42023 in modified Reeslev &
Jensen medium as continuous culture at 0.02 h-1 dilution rate (40 ml
medium / hr flow rate / 2000 ml culture).
Time in
days
Sugar
in put
(gh-1)
Sugar
out let
(gh-1)
Consu-
med
sugar
(gl-1)
Consu-
med
sugar
(gh-1)
Cell dry
weight
out let
(gl-1)
Pullulan
conc.
out let
(gl-1)
Pullulan
conc.
out let
(gh-1)
Pullulan
yield
(%)
Conversion
coefficient
(%)
Productivity
(gl-1h-1)
1 7.0 0.1 172.5 6.9 18.8 83 3.3 47.4 48.1 0.865
2 7.0 0.13 171.75 6.87 19.3 83.2 3.3 47.5 48.4 0.867
3 7.0 0.14 171.5 6.86 19.4 84 3.3 48 49 0.875
4 7.0 0.1 172.5 6.9 19.2 83.5 3.34 47.7 48.4 0.87
5 7.0 0.16 171 6.84 19.0 84.1 3.4 48 49.2 0.88
Means 7 0.126 171.85 6.874 19.14 83.56 3.328 47.72 48.62 0.8714
TABLE 8. Pullulan production by A. pullulans ATCC 42023 in modified Reeslev &
Jensen medium as continuous culture at 0.03 h-1 dilution rate (60 ml
medium / h flow rate / 2000 ml culture).
Time in
days
Sugar
in put
(gh-1)
Sugar
out let
(gh-1)
Consumed
sugar
(gl-1)
Consu-
med
sugar
(gh-1)
Cell dry
weight
out let
(gl-1)
Pullulan
conc.
out let
(gl-1)
Pullulan
conc.
out let
(gh-1)
Pullulan
yield
(%)
Conversion
coefficient
(%)
Productivity
(gl-1h-1)
1 10.5 0.4 168.3 10.1 18.2 86.1 5.17 49.2 51.2 0.89
2 10.5 0.42 168 10.08 18.0 86.2 5.17 49.3 51.3 0.9
3 10.5 0.43 167.8 10.07 18.3 85.8 5.15 49 51.1 0.89
4 10.5 0.4 168.3 10.1 18.7 86.2 5.17 49.2 51.2 0.9
5 10.5 0.41 168.2 10.09 18.6 86.5 5.19 49.4 51.4 0.9
Means 10.5 0.412 168.12 10.08
8 18.36 86.16 5.17 49.22 51.3 0.896
TABLE 9. Pullulan production by A. pullulans ATCC 42023 in modified Reeslev &
Jensen medium as continuous culture at 0.04 h-1 dilution rate (80 ml
medium / h flow rate / 2000 ml culture).
Time
in
days
Sugar
in put
(gh-1)
Sugar
out let
(gh-1)
Consumed
sugar
(gl-1)
Consumed
sugar
(gh-1)
Cell
dry
weight
out let
(gl-1)
Pullulan
conc.
out let
(gl-1)
Pullulan
conc.
out let
(gh-1)
Pullulan
yield
(%)
Conversion
coefficient
(%)
Productivity
(gl-1h-1)
1 14 3.7 128.75 10.3 18.0 60.1 4.8 34.3 46.7 0.63
2 14 6.2 97.5 7.8 14.2 47.4 3.79 27 48.6 0.49
3 14 9.3 58.75 4.7 9.7 27.4 2.19 15.6 46.6 0.29
4 14 10.7 41.25 3.3 7.2 15.1 1.2 8.6 36.6 0.16
5 14 12.4 20 1.6 4.1 8.2 0.7 4.7 41 0.09
Means 14 8.46 69.25 5.54 10.64 31.64 2.516 18.04 43.9 0.332
COMPARATIVE ASSESSMENT OF PULLULAN PRODUCTION …
Egypt. J. Microbiol. 43 (2008)
47
0
0.2
0.4
0.6
0.8
1
Pro
du
cti
vit
y
(gl-1
h-1
)
0.01 0.02 0.03 0.04
Dilution rate (h-1
)
020
4060
80100
Pu
llu
lan
con
cen
trat
ion
(g
l-1)
0.01 0.02 0.03 0.04
Dilution rate (h-1
)
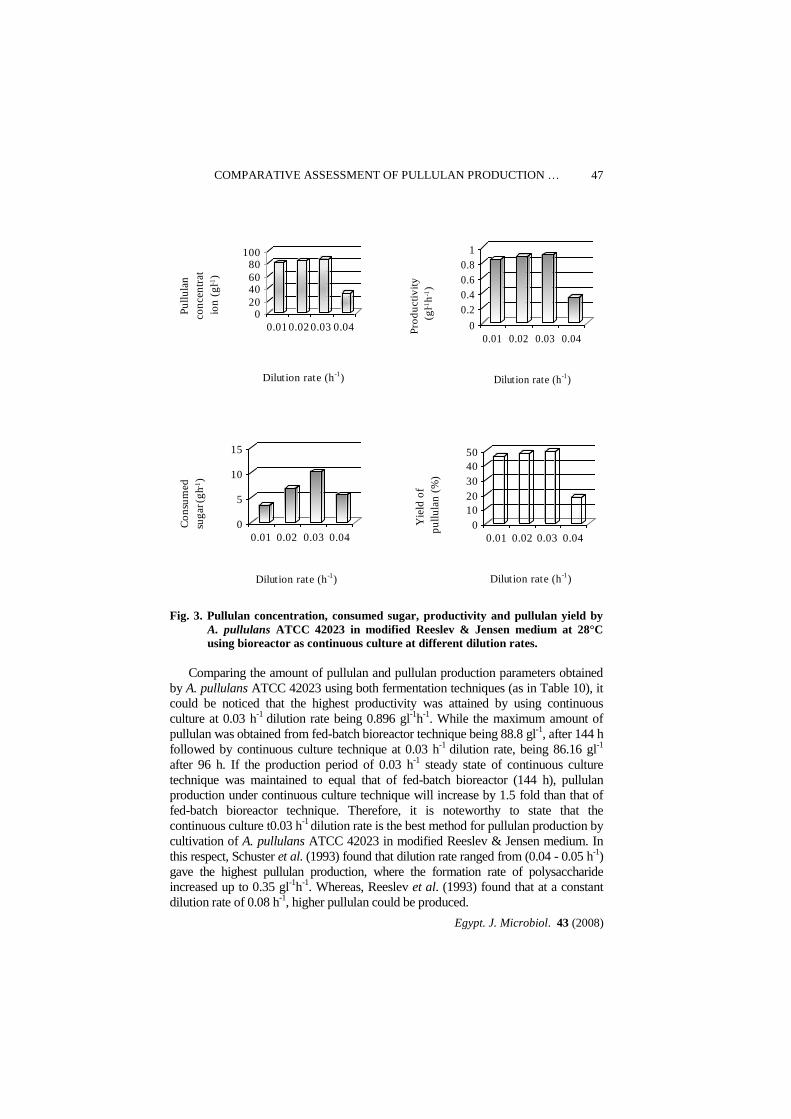
Fig. 3. Pullulan concentration, consumed sugar, productivity and pullulan yield by
A. pullulans ATCC 42023 in modified Reeslev & Jensen medium at 28°C
using bioreactor as continuous culture at different dilution rates.
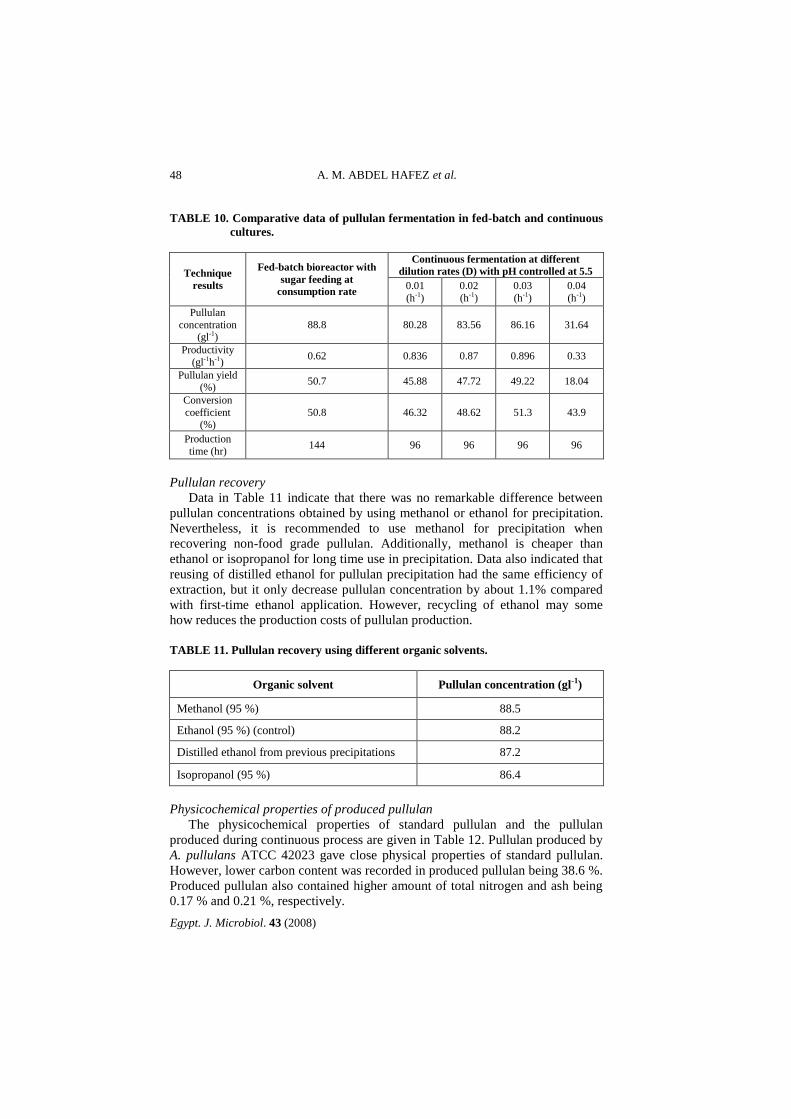
Comparing the amount of pullulan and pullulan production parameters obtained
by A. pullulans ATCC 42023 using both fermentation techniques (as in Table 10), it
could be noticed that the highest productivity was attained by using continuous
culture at 0.03 h-1
dilution rate being 0.896 gl-1
h-1. While the maximum amount of
pullulan was obtained from fed-batch bioreactor technique being 88.8 gl-1
, after 144 h
followed by continuous culture technique at 0.03 h-1
dilution rate, being 86.16 gl-1
after 96 h. If the production period of 0.03 h-1
steady state of continuous culture
technique was maintained to equal that of fed-batch bioreactor (144 h), pullulan
production under continuous culture technique will increase by 1.5 fold than that of
fed-batch bioreactor technique. Therefore, it is noteworthy to state that the
continuous culture t0.03 h-1
dilution rate is the best method for pullulan production by
cultivation of A. pullulans ATCC 42023 in modified Reeslev & Jensen medium. In
this respect, Schuster et al. (1993) found that dilution rate ranged from (0.04 - 0.05 h-1)
gave the highest pullulan production, where the formation rate of polysaccharide
increased up to 0.35 gl-1
h-1. Whereas, Reeslev et al. (1993) found that at a constant
dilution rate of 0.08 h-1, higher pullulan could be produced.
0
5
10
15
Co
nsu
med
sug
ar (g
h-1
)
0.01 0.02 0.03 0.04
Dilution rate (h-1
)
0
10
20
30
40
50
Yie
ld o
f
pu
llu
lan
(%
)
0.01 0.02 0.03 0.04
Dilution rate (h-1
)
A. M. ABDEL HAFEZ et al.
Egypt. J. Microbiol. 43 (2008)
48
TABLE 10. Comparative data of pullulan fermentation in fed-batch and continuous
cultures.
Technique
results
Fed-batch bioreactor with
sugar feeding at
consumption rate
Continuous fermentation at different
dilution rates (D) with pH controlled at 5.5
0.01
(h-1)
0.02
(h-1)
0.03
(h-1)
0.04
(h-1)
Pullulan
concentration (gl-1)
88.8 80.28 83.56 86.16 31.64
Productivity
(gl-1h-1) 0.62 0.836 0.87 0.896 0.33
Pullulan yield (%)
50.7 45.88 47.72 49.22 18.04
Conversion
coefficient (%)
50.8 46.32 48.62 51.3 43.9
Production
time (hr) 144 96 96 96 96
Pullulan recovery
Data in Table 11 indicate that there was no remarkable difference between
pullulan concentrations obtained by using methanol or ethanol for precipitation.
Nevertheless, it is recommended to use methanol for precipitation when
recovering non-food grade pullulan. Additionally, methanol is cheaper than
ethanol or isopropanol for long time use in precipitation. Data also indicated that
reusing of distilled ethanol for pullulan precipitation had the same efficiency of
extraction, but it only decrease pullulan concentration by about 1.1% compared
with first-time ethanol application. However, recycling of ethanol may some
how reduces the production costs of pullulan production.
TABLE 11. Pullulan recovery using different organic solvents.
Organic solvent Pullulan concentration (gl-1)
Methanol (95 %) 88.5
Ethanol (95 %) (control) 88.2
Distilled ethanol from previous precipitations 87.2
Isopropanol (95 %) 86.4
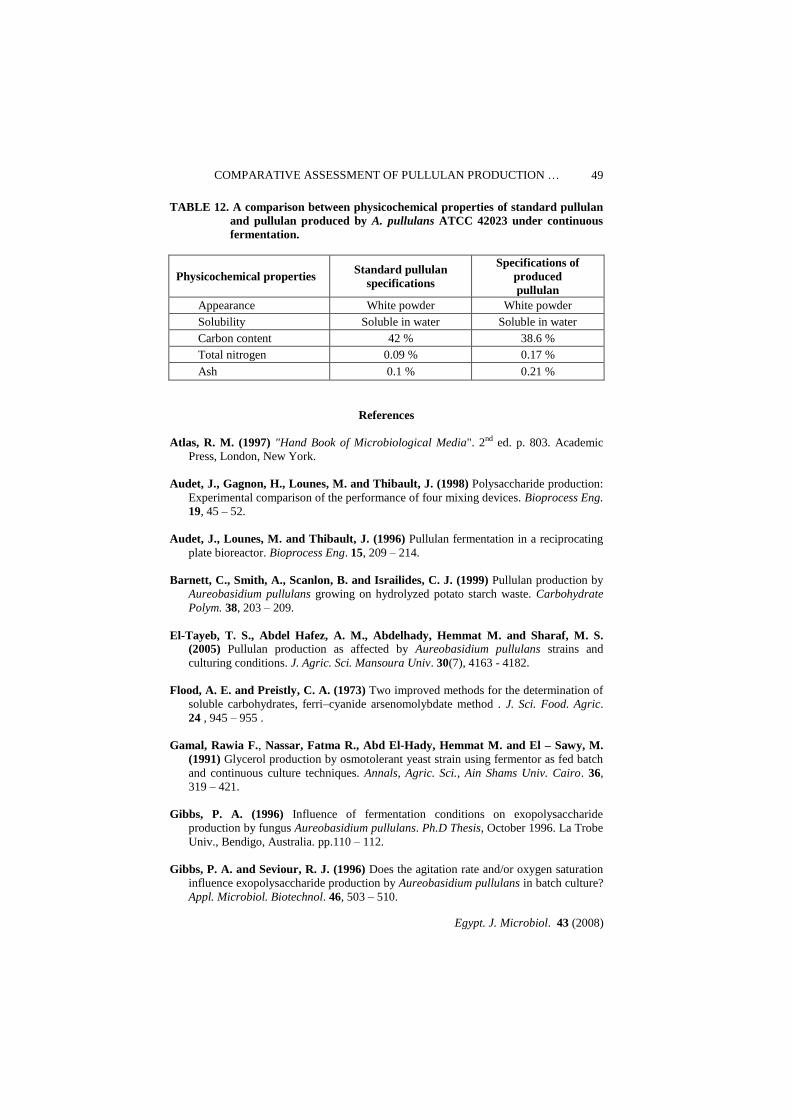
Physicochemical properties of produced pullulan
The physicochemical properties of standard pullulan and the pullulan
produced during continuous process are given in Table 12. Pullulan produced by
A. pullulans ATCC 42023 gave close physical properties of standard pullulan.
However, lower carbon content was recorded in produced pullulan being 38.6 %.
Produced pullulan also contained higher amount of total nitrogen and ash being
0.17 % and 0.21 %, respectively.
COMPARATIVE ASSESSMENT OF PULLULAN PRODUCTION …
Egypt. J. Microbiol. 43 (2008)
49
TABLE 12. A comparison between physicochemical properties of standard pullulan
and pullulan produced by A. pullulans ATCC 42023 under continuous
fermentation.
Physicochemical properties Standard pullulan
specifications
Specifications of
produced
pullulan
Appearance White powder White powder
Solubility Soluble in water Soluble in water
Carbon content 42 % 38.6 %
Total nitrogen 0.09 % 0.17 %
Ash 0.1 % 0.21 %
References
Atlas, R. M. (1997) "Hand Book of Microbiological Media". 2nd ed. p. 803. Academic
Press, London, New York.
Audet, J., Gagnon, H., Lounes, M. and Thibault, J. (1998) Polysaccharide production:
Experimental comparison of the performance of four mixing devices. Bioprocess Eng.
19, 45 – 52.
Audet, J., Lounes, M. and Thibault, J. (1996) Pullulan fermentation in a reciprocating
plate bioreactor. Bioprocess Eng. 15, 209 – 214.
Barnett, C., Smith, A., Scanlon, B. and Israilides, C. J. (1999) Pullulan production by
Aureobasidium pullulans growing on hydrolyzed potato starch waste. Carbohydrate
Polym. 38, 203 – 209.
El-Tayeb, T. S., Abdel Hafez, A. M., Abdelhady, Hemmat M. and Sharaf, M. S.
(2005) Pullulan production as affected by Aureobasidium pullulans strains and
culturing conditions. J. Agric. Sci. Mansoura Univ. 30(7), 4163 - 4182.
Flood, A. E. and Preistly, C. A. (1973) Two improved methods for the determination of
soluble carbohydrates, ferri–cyanide arsenomolybdate method . J. Sci. Food. Agric.
24 , 945 – 955 .
Gamal, Rawia F., Nassar, Fatma R., Abd El-Hady, Hemmat M. and El – Sawy, M.
(1991) Glycerol production by osmotolerant yeast strain using fermentor as fed batch
and continuous culture techniques. Annals, Agric. Sci., Ain Shams Univ. Cairo. 36,
319 – 421.
Gibbs, P. A. (1996) Influence of fermentation conditions on exopolysaccharide
production by fungus Aureobasidium pullulans. Ph.D Thesis, October 1996. La Trobe
Univ., Bendigo, Australia. pp.110 – 112.
Gibbs, P. A. and Seviour, R. J. (1996) Does the agitation rate and/or oxygen saturation
influence exopolysaccharide production by Aureobasidium pullulans in batch culture?
Appl. Microbiol. Biotechnol. 46, 503 – 510.
A. M. ABDEL HAFEZ et al.
Egypt. J. Microbiol. 43 (2008)
50
GÖksungur, Y., UÇan, A. and Ulgar GÜvenÇ (2004) Production of pullulan from beet
molasses and synthetic medium by Aureobasidium pullulans. Turk J. Biol. 28, 23-30.
Herbert, D., Phipps, P. J. and Strange, R. E. (1971) Chemical analysis of microbial
cells. In: "Methods in Microbiology". Norris J. R. and Ribbons, D. W. (Ed.), pp. 309 –
344. Academic Press, London, New York.
Israilides, C. J., Smith, A., Harthill, J. E., Barnett, C., Bambalov, G. and Scanlon, B.
(1998) Pullulan content of the ethanol precipitate from fermented agro-industrial
wastes. Appl. Microbiol. Biotechnol. 49, 613 – 617.
Jackson, M. L. (1973) "Soil Chemical Analysis" ,pp. 183 – 192, Prentice Hall of India.
Private, New Delhi.
Lazaridou, A., Biliaderis, C. G., Roukas, T. and Izydorczk, M. (2002) Production and
characterization of pullulan from beet molasses using a nonpigmented strain of
Aureobasidium pullulans in batch culture. Appl. Biochem. Biotechnol. 9, 1 – 22.
Leathers, T. D. (2003) Biotechnological production and applications of pullulan. Appl.
Microbiol. Biotechnol. 12, 25 – 32.
Lebrun, L., Juter, G. A., Jouenne, T. and Mignot, L. (1994) Exopolysaccharide
production by free and immobilized microbial cultures. Enzyme Microb. Technol. 16,
1048 – 1054.
Madi, N., McNeil, B. and Harvey, L. M. (1997) Effect of exogenous calcium on
morphological development and biopolymer synthesis in the fungus Aureobasidium
pullulans. Enzyme Microb. Technol. 21, 102 – 107.
McNeil, B. and Kristiansen, B. (1990) Temperature effects on polysaccharide formation
by Aureobasidium pullulans in stirred tanks. Enzyme Microb. Technol. 12, 521 – 526.
McNeil, B., Kristiansen, B. and Seviour, R. J. (1989) Polysaccaride production and
morphology of Aureobasidium pullulans in continuous culture. Biotechnol. Bioeng.
33, 1210 – 1212.
Reeslev, M., Jorgensen, B. B. and Jorgensen, O. B. (1993) Influence of Zn2+ on yeast-
mycelium dimorphism and exopolysaccharide production by the fungus
Aureobasidium pullulans grown in a defined medium in continuous culture. J. Gen.
Microbiol. 139, 3069 – 3070.
Ronen, M., Guterman, H. and Shabatai, Y. (2002) Monitoring and control of pullulan
production using vision sensor. J. Biochem. Biophys. Meth. 31, 243 – 249.
Roukas, T. (1999) Pullulan production from deproteinized whey by Aureobasidium
pullulans. J. Indust. Microbiol. Biotechnol. 22, 617 – 621.
Schuster, R., Wrenzig, E. and Mersmann, A. (1993) Production of the fungal
exopolysaccharide pullulan by batch-wise and continuous fermentation. Appl.
Microbiol. Biotechnol. 39, 155 – 158.
COMPARATIVE ASSESSMENT OF PULLULAN PRODUCTION …
Egypt. J. Microbiol. 43 (2008)
51
Shabtai, Y. and Mukmenev, I. (1995) Enhanced production of pigment-free pullulan by
a morphogenetically arrested Aureobasidium pullulans (ATCC 42023) in a two-stage
fermentation with shift from soy bean oil to sucrose. Appl. Microbiol. Biotechnol. 43,
595 – 603.
Simon, L., Caye-Vaugien, C. and Bouchonneau, M. (1993) Relation between pullulan
production, morphological state and growth conditions in Aureobasidium pullulans:
new observations. J. Gen. Microbiol. 139, 979 – 985.
Szymanska, L. T. and Galas, E. (1993) Two step mutagenesis of Pullularia pullulans
leading to clones producing pure pullulan with high yield. Enzyme Microb. Technol.
15, 317 – 320.
Szymanska, L. T., Galas, E. and Pankiewiewicz, T. (1999) Optimization of
productivity of pullulan by means of multivariable linear regression analysis. Enzyme
Microb. Technol. 24, 276 – 282.
(Received 17/9/2007;
accepted 26/5/2008)
A. M. ABDEL HAFEZ et al.
Egypt. J. Microbiol. 43 (2008)
52
Aureobasidiumالبوليوالن بواسطة فطر إلنتاجالتقييم المقارن
pullulans و المزرعة التنمية بالدفعة الواحدة المغذاه نظاميتحت
المستمرة
محمد سعيد شرف ، ىالهادهمت محمد عبد ، الحافظعبد الوهاب محمد عبد
طارق سعيد الطيبو
شبرا –عين شمس جامعة –عة الزرا كلية –قسم الميكروبيولوجيا الزراعية
.مصر –القاهرة –الخيمة
Aureobasidiumالبوليوالن بواسطة الساللة نتاجإأجرى هذا البحث لدراسة
pullulans ATCC 42023 بنظام الدفعة الواحدة المغذاه المخمر فيبتنميتها
الكه كانت السكر تبعاً لمعدل استه إضافةحيث وجد أن نظام المزرعة المستمرة.و
أفضل طريقة للتنمية بنظام الدفعة الواحدة المغذاه , نظراً لزيادة محصول البوليوالن
مقارنة بالتنمية بنظام الدفعة الواحدة المغذاه المستمرة أو المتقطعة. و تم الحصول
تبعاً على أعلى تركيز للبوليوالن الناتج عند التنمية بنظام الدفعة الواحدة المغذاه
ساعة من التحضين, متبوعاً 144جم/لتر( بعد 88.8 ستهالك السكر )لمعدل ا
جم/لتر( 86.16/ ساعة ) 0.03بالتنمية بنظام المزرعة المستمرة عند معدل تخفيف
28من التحضين على درجة حرارة ساعة 96بعد °
أعلى إلىبينما تم الوصول م.
نظام في/ ساعة 0.03ف جم/لتر/ساعة( عند معدل تخفي0.896للبوليوالن ) إنتاجية
معدل تهوية مقداره، 5.5التنمية بالمزرعة المستمرة وعند حموضة ثابتة مقدارها
1.0 vvm و تعتبر التنمية بنظام المزرعة ق. لفة/ 700معدل تقليب مقداره و
المختبرة اإلنتاجاألنسب من بين طرق هي/ساعة 0.03المستمرة بمعدل تخفيف
ضعفاً مقارنة بنظام التنمية 1.5لى زيادة انتاج البوليوالن إاألخرى حيث أنها أدت
كمية فيال يوجد اختالف كبير ذات الدفعة الواحدة المغذاه .كما لوحظ أنه
البوليوالن الناتج عند الترسيب بالمذيبات العضوية المختلفة. و يتميز البوليوالن
. القياسيبة من البوليوالن الناتج بنظام المزرعة المستمرة بصفاته الفيزيائية القري