Embed Size (px)
Citation preview
Comparative Assessment of Energy Options and Strategies until 2025 Mexican Study Team
COMPARATIVE ASSESSMENT OF COMPARATIVE ASSESSMENT OF ENERGY OPTIONS AND ENERGY OPTIONS AND
STRATEGIES UNTIL 2025STRATEGIES UNTIL 2025OVERVIEW AND RESULTSOVERVIEW AND RESULTS
Analysis Conducted by a Team of Analysts from:Analysis Conducted by a Team of Analysts from:
SENERSENERUNAMUNAM
CONAECONAEIMPIMPIIEIIEINEINE
PEMEXPEMEXCFECFE
Work Sponsored byWork Sponsored byIAEA, USDOSIAEA, USDOS
Presented at SENER on February 28, 2003Presented at SENER on February 28, 2003
Comparative Assessment of Energy Options and Strategies until 2025 Mexican Study Team
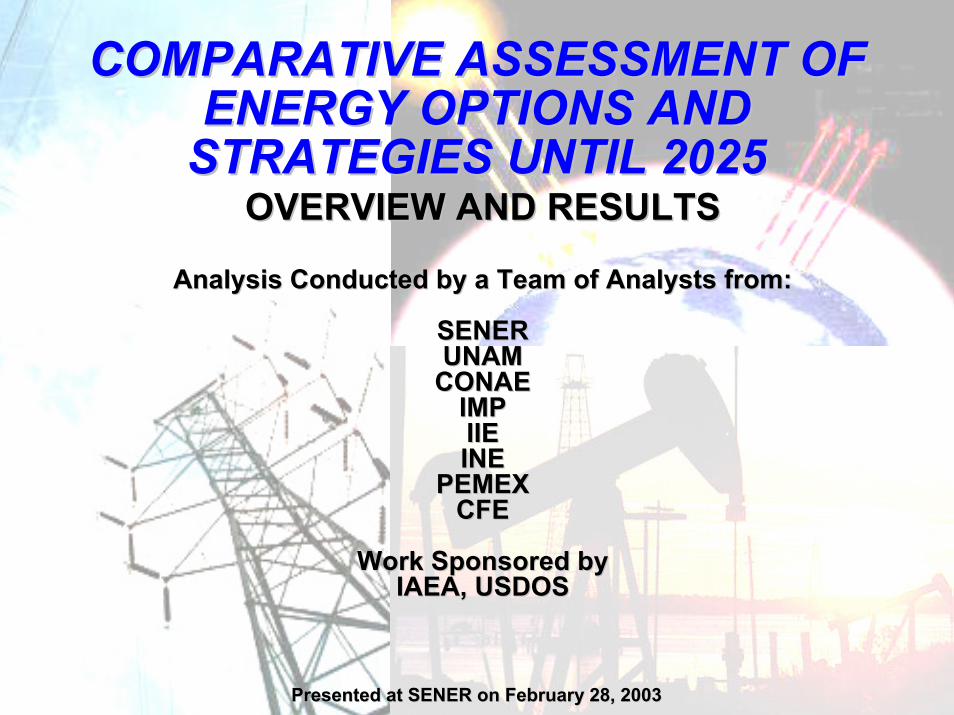
The Study Team Used a Set of Analytical Tools to The Study Team Used a Set of Analytical Tools to Conduct the AnalysisConduct the Analysis
MODEMAMODEMAEnergy/ElectricityEnergy/ElectricityDemand ForecastsDemand Forecasts
MODEMA to develop the energy demand projections based on the underlying macroeconomic growth assumptions
PCPC--VALORAGUAVALORAGUA
Detailed HydroDetailed HydroPower AnalysisPower Analysis
PC-VALORAGUA for detailed analysis of Mexico’shydropower resources
DECADESDECADES--WASPWASP
Power SystemPower SystemExpansion AnalysisExpansion Analysis
DECADES-WASP to analyze power sector expansionissues
– This analysis was part of Phase 1 of the project– Under this phase, the team analyzed a total of 14 alternative
expansion scenarios
BALANCEBALANCEOverall EnergyOverall Energy
System AnalysisSystem Analysis
ENPEP-BALANCE to study total energy systemissues including all fuels and all sectors
Comparative Assessment of Energy Options and Strategies until 2025 Mexican Study Team
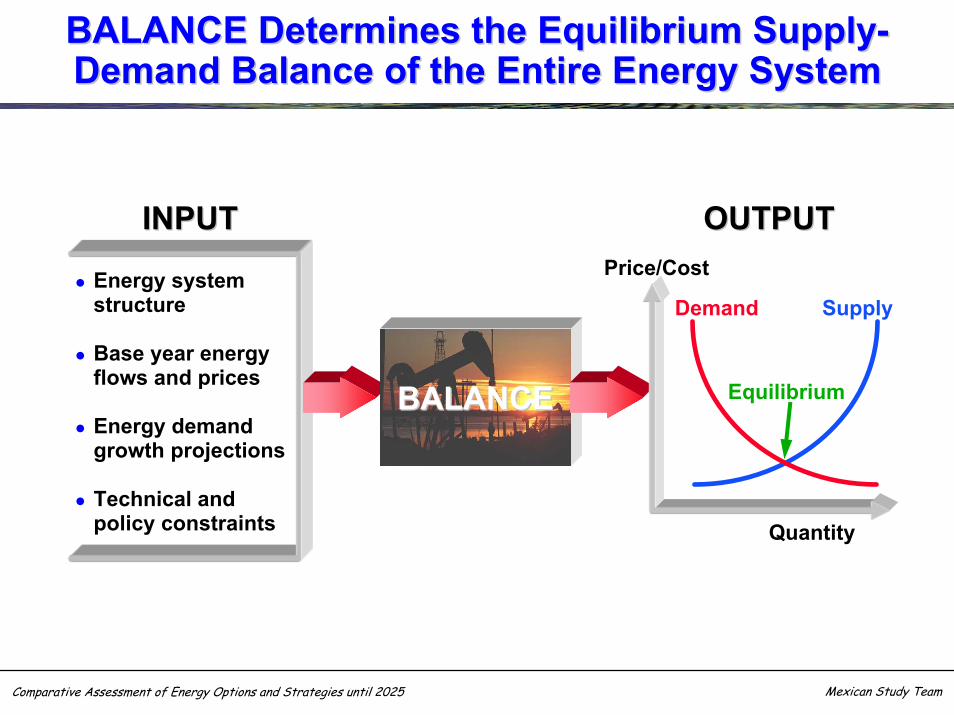
INPUTINPUT
Energy systemstructure
Base year energyflows and prices
Energy demandgrowth projections
Technical andpolicy constraints
BALANCEBALANCE
SupplyDemand
Equilibrium
OUTPUTOUTPUT
Quantity
Price/Cost
BALANCE Determines the Equilibrium SupplyBALANCE Determines the Equilibrium Supply--Demand Balance of the Entire Energy SystemDemand Balance of the Entire Energy System
Comparative Assessment of Energy Options and Strategies until 2025 Mexican Study Team
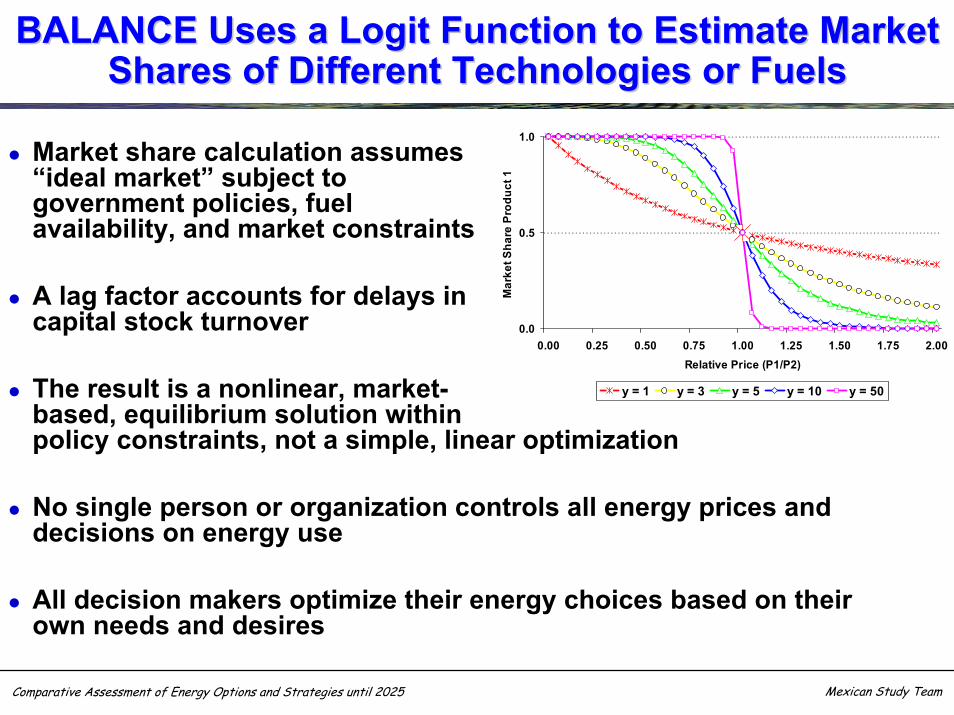
BALANCE Uses a BALANCE Uses a LogitLogit Function to Estimate Market Function to Estimate Market Shares of Different Technologies or FuelsShares of Different Technologies or Fuels
Market share calculation assumes“ideal market” subject togovernment policies, fuelavailability, and market constraints
A lag factor accounts for delays incapital stock turnover
The result is a nonlinear, market-based, equilibrium solution withinpolicy constraints, not a simple, linear optimization
No single person or organization controls all energy prices and decisions on energy use
All decision makers optimize their energy choices based on theirown needs and desires
0.0
0.5
1.0
0.00 0.25 0.50 0.75 1.00 1.25 1.50 1.75 2.00Relative Price (P1/P2)
Mar
ket S
hare
Pro
duct
1
y = 1 y = 3 y = 5 y = 10 y = 50
Comparative Assessment of Energy Options and Strategies until 2025 Mexican Study Team
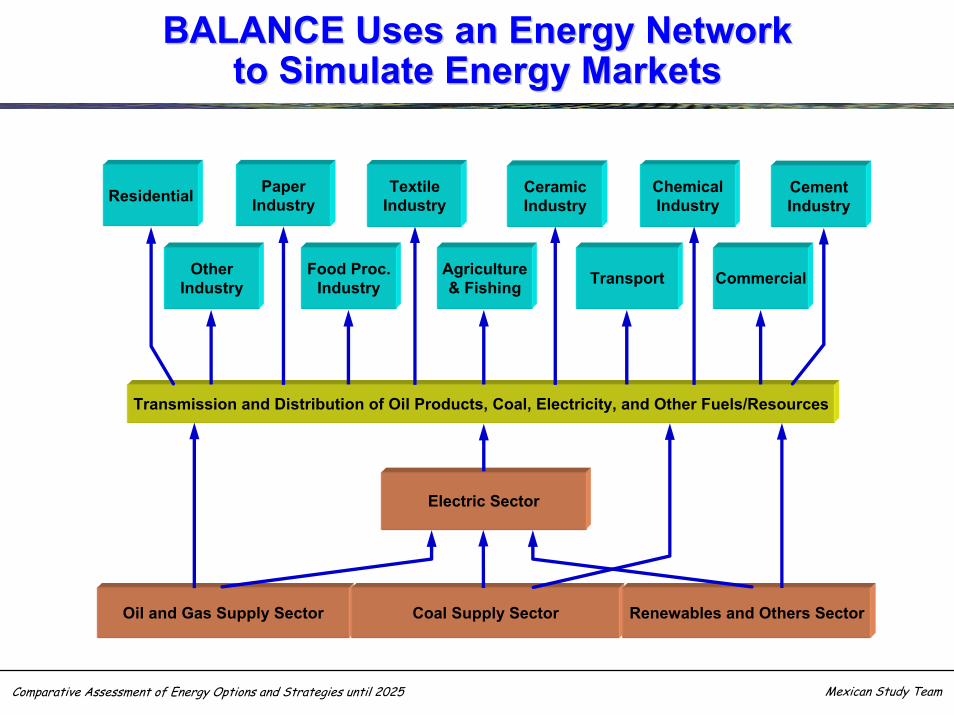
BALANCE Uses an Energy NetworkBALANCE Uses an Energy Networkto Simulate Energy Marketsto Simulate Energy Markets
Transmission and Distribution of Oil Products, Coal, Electricity, and Other Fuels/Resources
Residential PaperIndustry
OtherIndustry
Food Proc.Industry
Agriculture& Fishing Transport Commercial
CementIndustry
ChemicalIndustry
CeramicIndustry
TextileIndustry
Electric Sector
Oil and Gas Supply Sector Coal Supply Sector Renewables and Others Sector
Comparative Assessment of Energy Options and Strategies until 2025 Mexican Study Team
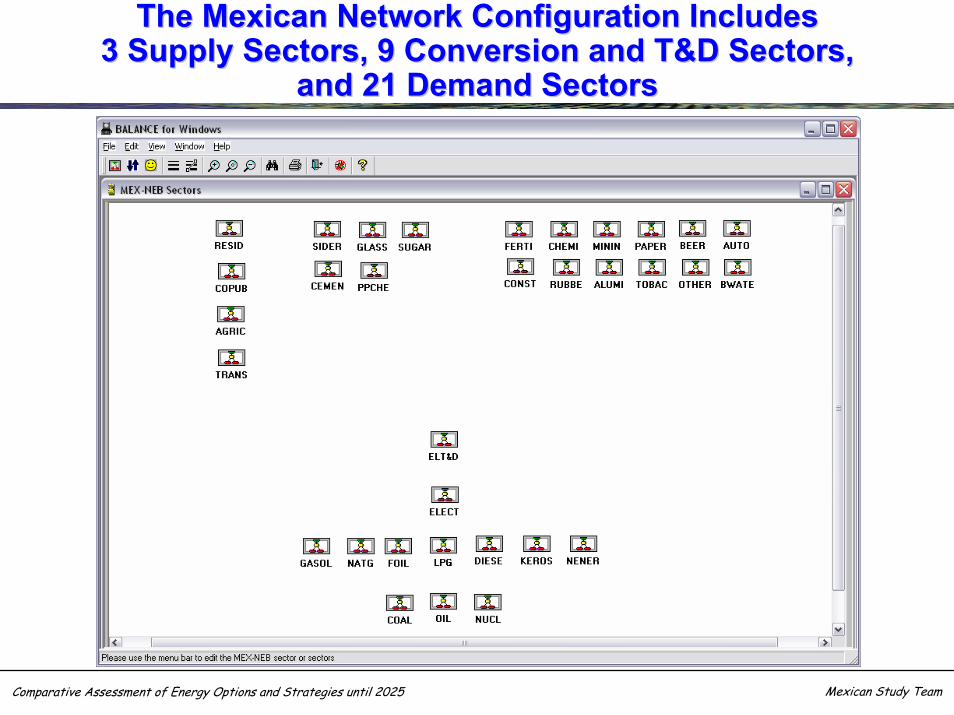
The Mexican Network Configuration IncludesThe Mexican Network Configuration Includes3 Supply Sectors, 9 Conversion and T&D Sectors,3 Supply Sectors, 9 Conversion and T&D Sectors,
and 21 Demand Sectorsand 21 Demand Sectors
Comparative Assessment of Energy Options and Strategies until 2025 Mexican Study Team
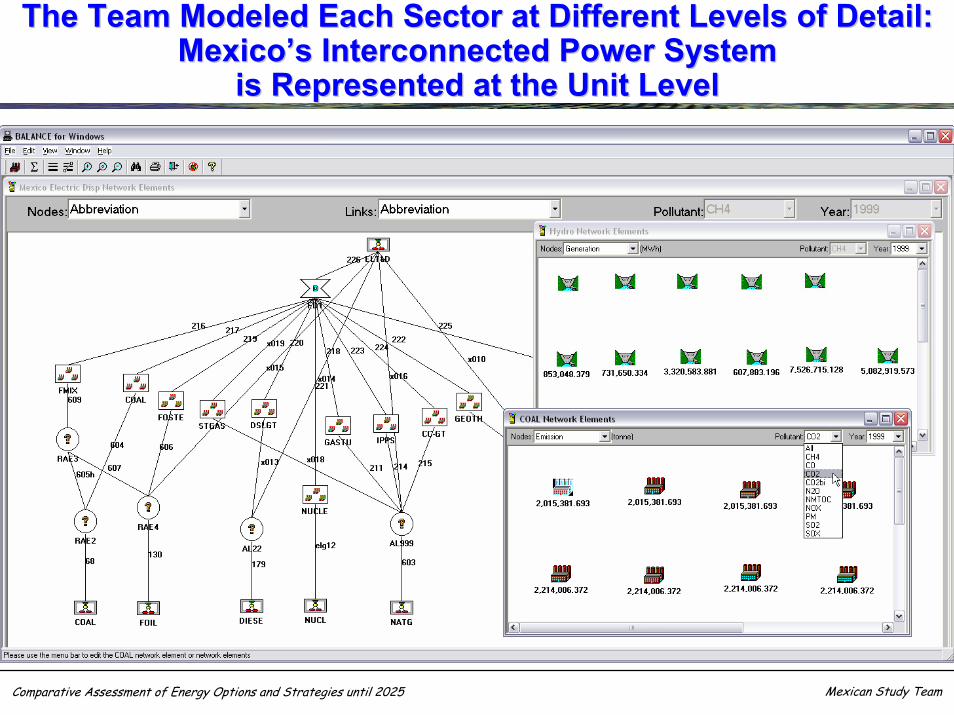
The Team Modeled Each Sector at Different Levels of Detail: The Team Modeled Each Sector at Different Levels of Detail: MexicoMexico’’s Interconnected Power Systems Interconnected Power System
is Represented at the Unit Levelis Represented at the Unit Level
Comparative Assessment of Energy Options and Strategies until 2025 Mexican Study Team
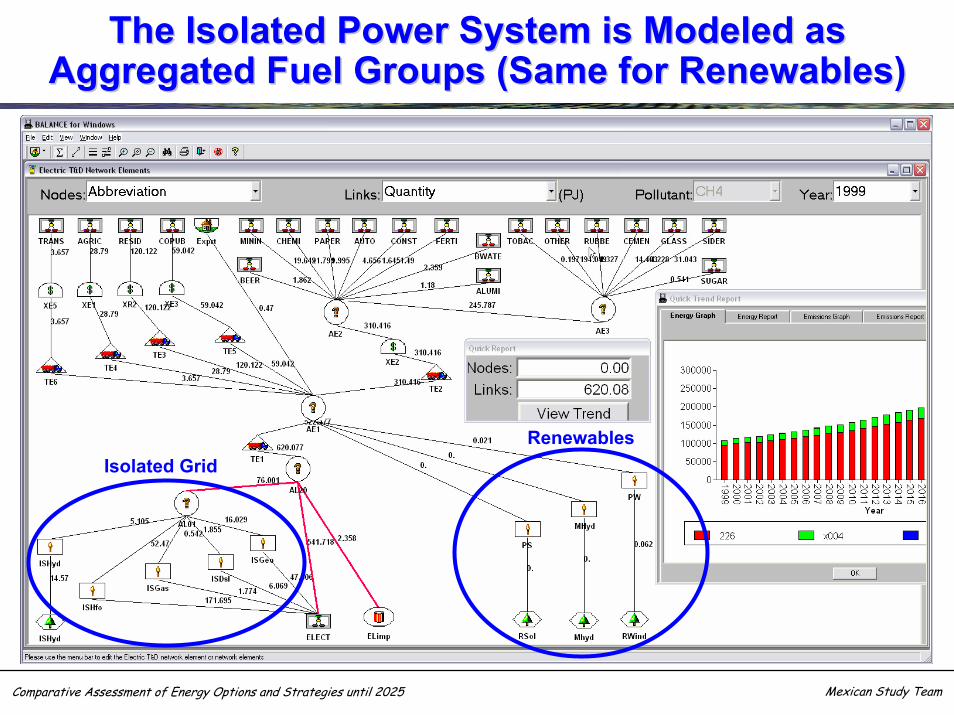
The Isolated Power System is Modeled asThe Isolated Power System is Modeled asAggregated Fuel Groups (Same for Renewables)Aggregated Fuel Groups (Same for Renewables)
Isolated GridRenewables
Comparative Assessment of Energy Options and Strategies until 2025 Mexican Study Team
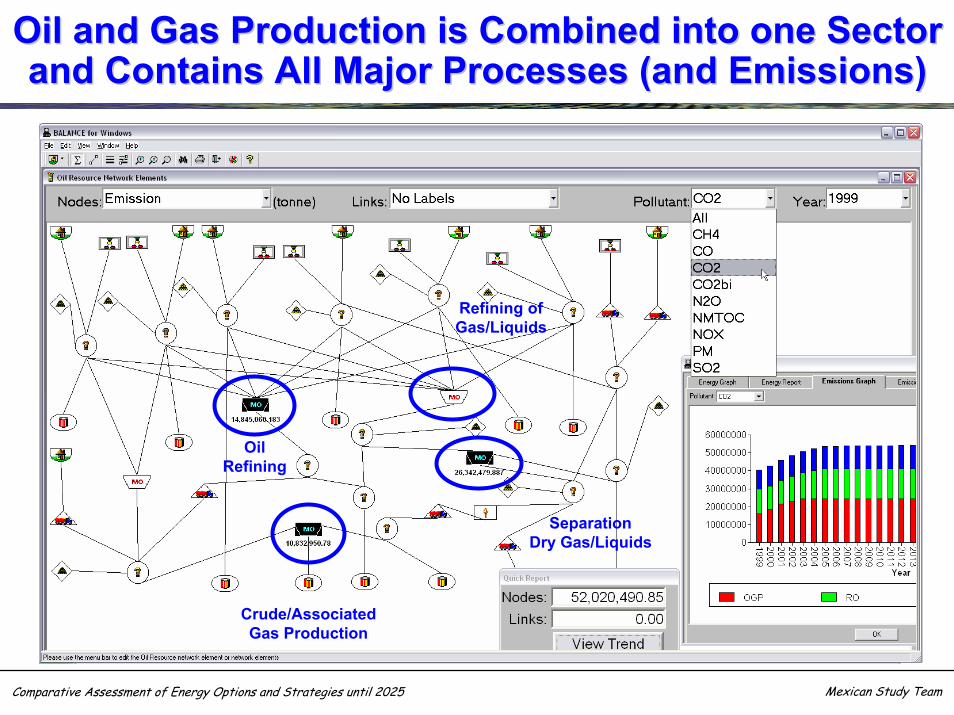
Oil and Gas Production is Combined into one Sector Oil and Gas Production is Combined into one Sector and Contains All Major Processes (and Emissions) and Contains All Major Processes (and Emissions)
OilRefining
Crude/AssociatedGas Production
SeparationDry Gas/Liquids
Refining ofGas/Liquids
Comparative Assessment of Energy Options and Strategies until 2025 Mexican Study Team
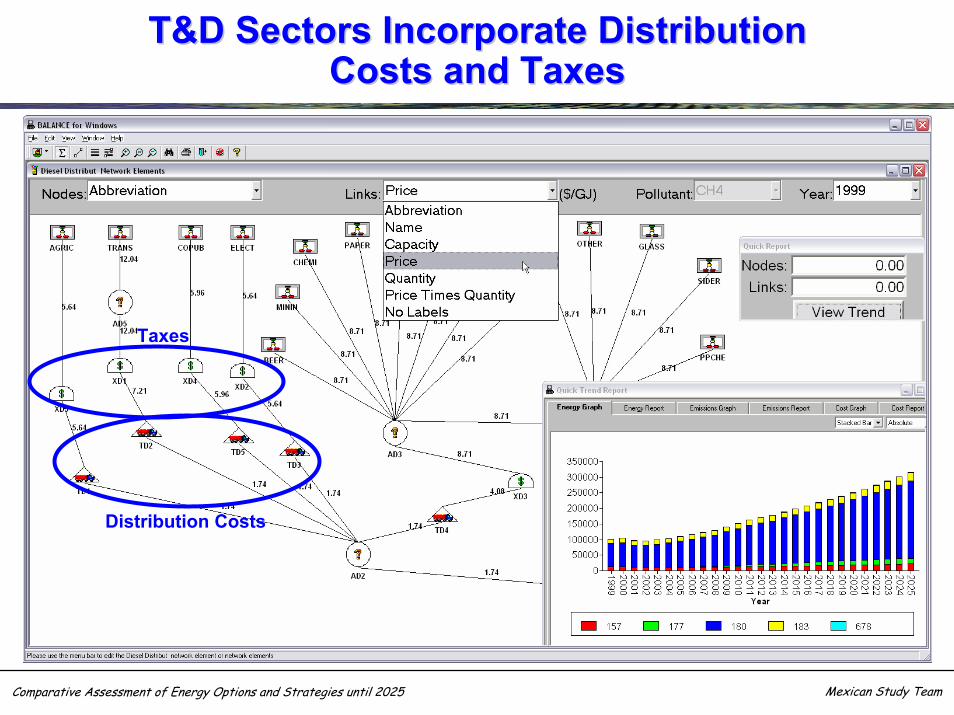
T&D Sectors Incorporate DistributionT&D Sectors Incorporate DistributionCosts and TaxesCosts and Taxes
Taxes
Distribution Costs
Comparative Assessment of Energy Options and Strategies until 2025 Mexican Study Team
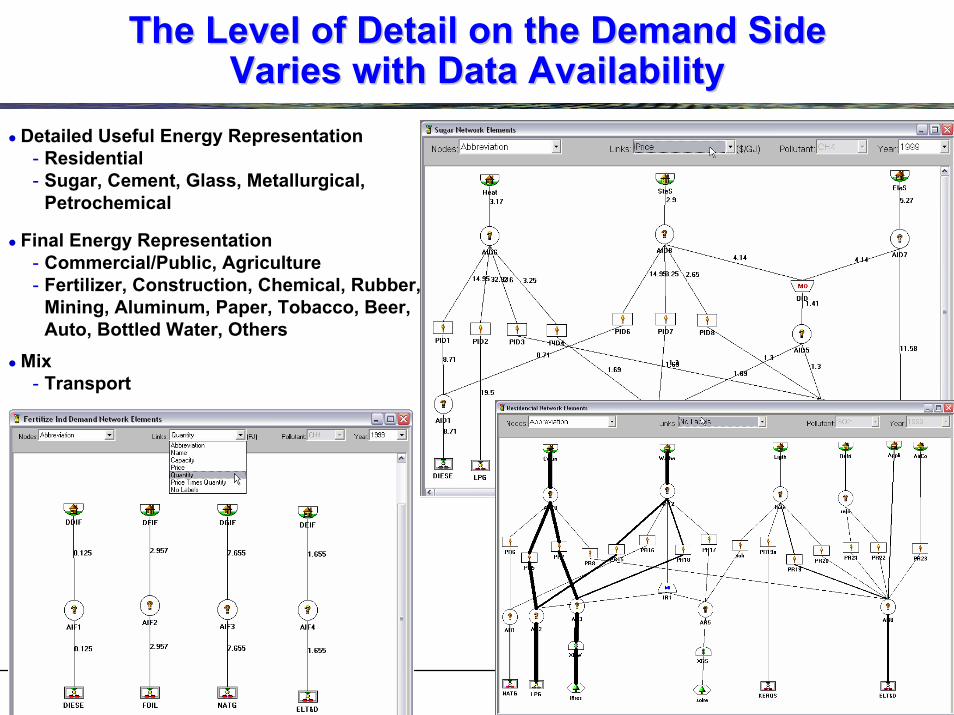
The Level of Detail on the Demand SideThe Level of Detail on the Demand SideVaries with Data AvailabilityVaries with Data Availability
Detailed Useful Energy Representation- Residential- Sugar, Cement, Glass, Metallurgical,
Petrochemical
Final Energy Representation- Commercial/Public, Agriculture- Fertilizer, Construction, Chemical, Rubber,
Mining, Aluminum, Paper, Tobacco, Beer,Auto, Bottled Water, Others
Mix- Transport
Comparative Assessment of Energy Options and Strategies until 2025 Mexican Study Team
Data Availability and Data QualityData Availability and Data Quality
Supply side information is extensive, well documented, and of good quality– Power sector information available from CFE
Generation and fuel consumption data from annual report “Informe de Operacion”Unit characteristics directly from CFE’s Investment Planning and Expansion Analysis Departments
– Oil and gas sectorNational energy balance “Balance Nacional de Energia 2001”; price statistics from SENER/IEAAnnual forecasts for different products: “Prospectiva Gas Natural”, “Prospectiva LPG”, “Prospectiva Petroliferos”Cost data less reliable; some information available from PEMEX
– Other supply sectorsNational energy balance from SENERInformation from UNAM
Demand side information is more limited– Detailed industrial energy data available for 5 branches (UNAM and SENER)– Information for residential, transport, commercial/public, and agriculture came from IMP, INE,
and CONAE– No cost data available; used information from international literature– SENER is in the process of collecting regional demand data
Comparative Assessment of Energy Options and Strategies until 2025 Mexican Study Team
For the Power Sector, the Team AnalyzedFor the Power Sector, the Team Analyzeda Total of 14 Scenariosa Total of 14 Scenarios
Base caseHigh-load growth case (6.5% instead of 5% per year)Variations on fossil fuel prices– Natural gas increases to 4.0 instead of 2.9 $/tcf– Natural gas peaks at $12.0/tcf and then declines to $4.0/tcf by 2025
Nuclear scenario– One forced nuclear unit– Reduction in nuclear capital costs by 48%
Limitations on natural gas supply– Limit on annual additions of combined cycle units– Limit on power sector gas supply (supply constant after 2010)
Variations on discount rate (8% to 12%; 10% under Base Case)Variations on target system reliability– Increased reliability (loss of load probability of 1 day per year instead of 3 days)– Decreased reliability (LOLP of 5 days)– Decrease in system reserve margin
Comparative Assessment of Energy Options and Strategies until 2025 Mexican Study Team
For the Entire Energy System, The Team AnalyzedFor the Entire Energy System, The Team Analyzed4 Scenarios using the Following Main Assumptions4 Scenarios using the Following Main AssumptionsReference Case
– Study period is 1999 to 2025– No limitation on gas supply– Power sector expansion options include nuclear, combined Cycle, gas turbine, imported coal,
and hydro– GDP grows at 4.5% (2002-2011) and 3.5% until 2025; Population growth rate drops from
1.33% (2000-2010) to 1.02% (2011-2020) to 0.82% until 2025Limited Gas Supply Scenario
– Gas supply is limited starting in 2009– Limit applies to power sector only and allows a maximum of 3 CCGT units per year
Renewables Scenario– Renewables implemented in power sector only– Includes 50 MW wind farms and 5 MW solar photovoltaic stations– Cost assumptions include “experience curve” that leads to a reduction in costs as the
installed capacity increases (wind from $1154/kW in 1999 to $536/kW in 2019)Nuclear Scenario
– Assumes one additional nuclear unit to come on-line in 2012– Capital cost is $2485/kW; Capacity is 1314 MW
Comparative Assessment of Energy Options and Strategies until 2025 Mexican Study Team
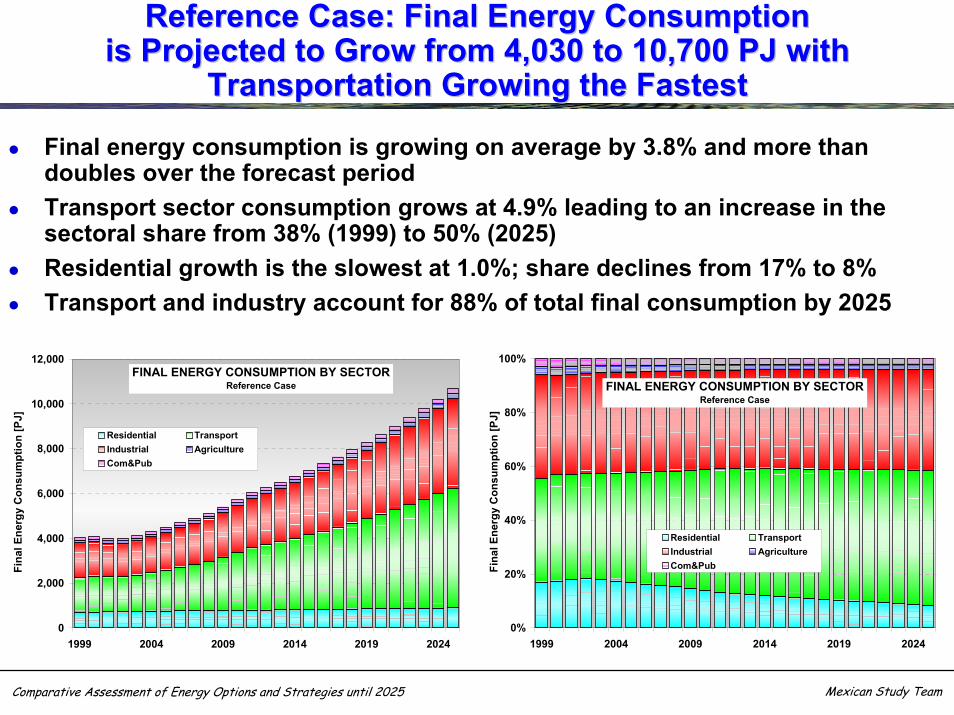
Reference Case: Final Energy ConsumptionReference Case: Final Energy Consumptionis Projected to Grow from 4,030 to 10,700 PJ with is Projected to Grow from 4,030 to 10,700 PJ with
Transportation Growing the FastestTransportation Growing the Fastest
Final energy consumption is growing on average by 3.8% and more than doubles over the forecast periodTransport sector consumption grows at 4.9% leading to an increase in the sectoral share from 38% (1999) to 50% (2025)Residential growth is the slowest at 1.0%; share declines from 17% to 8%Transport and industry account for 88% of total final consumption by 2025
0
2,000
4,000
6,000
8,000
10,000
12,000
1999 2004 2009 2014 2019 2024
Fina
l Ene
rgy
Con
sum
ptio
n [P
J]
Residential TransportIndustrial AgricultureCom&Pub
FINAL ENERGY CONSUMPTION BY SECTORReference Case
0%
20%
40%
60%
80%
100%
1999 2004 2009 2014 2019 2024
Fina
l Ene
rgy
Con
sum
ptio
n [P
J]
Residential TransportIndustrial AgricultureCom&Pub
FINAL ENERGY CONSUMPTION BY SECTORReference Case
Comparative Assessment of Energy Options and Strategies until 2025 Mexican Study Team
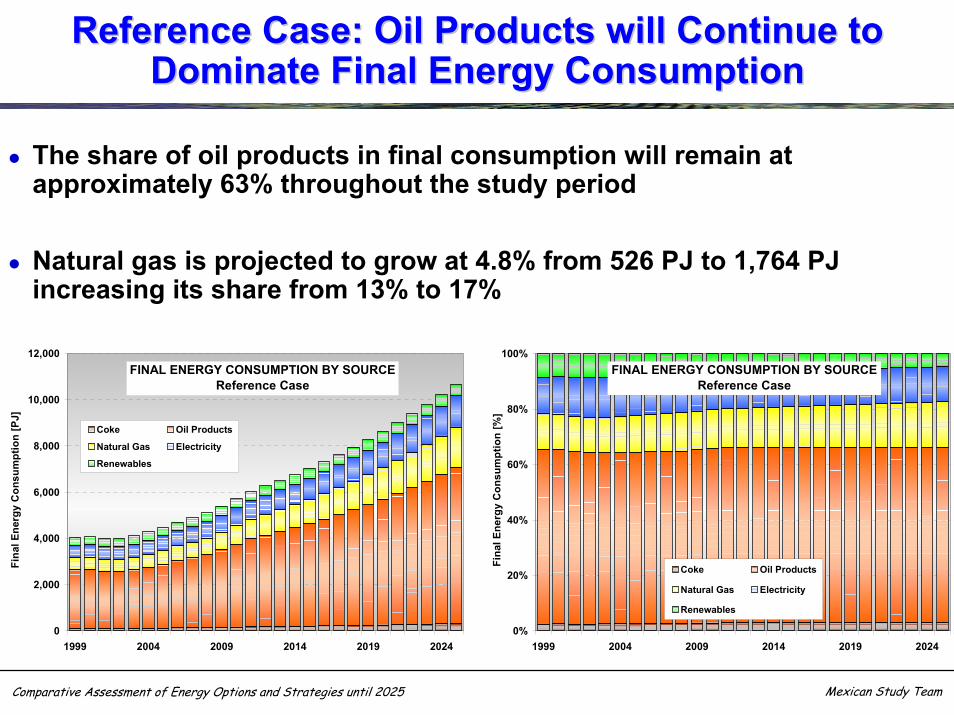
Reference Case: Oil Products will Continue to Reference Case: Oil Products will Continue to Dominate Final Energy ConsumptionDominate Final Energy Consumption
The share of oil products in final consumption will remain at approximately 63% throughout the study period
Natural gas is projected to grow at 4.8% from 526 PJ to 1,764 PJincreasing its share from 13% to 17%
0
2,000
4,000
6,000
8,000
10,000
12,000
1999 2004 2009 2014 2019 2024
Fina
l Ene
rgy
Con
sum
ptio
n [P
J]
Coke Oil Products
Natural Gas Electricity
Renewables
FINAL ENERGY CONSUMPTION BY SOURCEReference Case
0%
20%
40%
60%
80%
100%
1999 2004 2009 2014 2019 2024
Fina
l Ene
rgy
Con
sum
ptio
n [%
]
Coke Oil Products
Natural Gas Electricity
Renewables
FINAL ENERGY CONSUMPTION BY SOURCEReference Case
Comparative Assessment of Energy Options and Strategies until 2025 Mexican Study Team
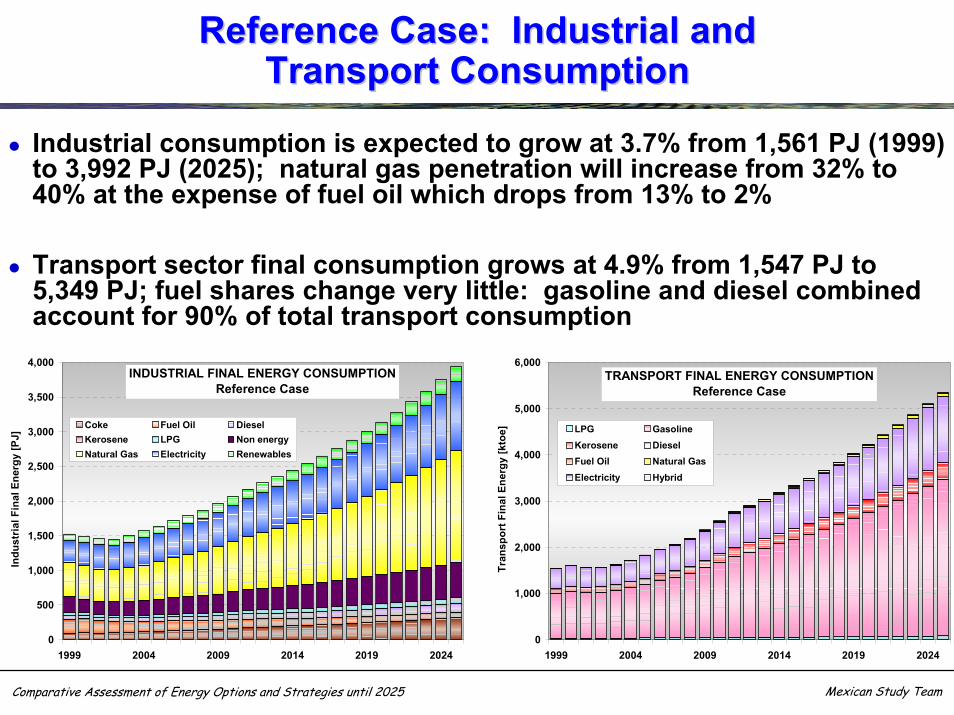
Reference Case: Industrial andReference Case: Industrial andTransport ConsumptionTransport Consumption
Industrial consumption is expected to grow at 3.7% from 1,561 PJ (1999) to 3,992 PJ (2025); natural gas penetration will increase from 32% to 40% at the expense of fuel oil which drops from 13% to 2%
Transport sector final consumption grows at 4.9% from 1,547 PJ to 5,349 PJ; fuel shares change very little: gasoline and diesel combined account for 90% of total transport consumption
0
500
1,000
1,500
2,000
2,500
3,000
3,500
4,000
1999 2004 2009 2014 2019 2024
Indu
stria
l Fin
al E
nerg
y [P
J]
Coke Fuel Oil DieselKerosene LPG Non energyNatural Gas Electricity Renewables
INDUSTRIAL FINAL ENERGY CONSUMPTIONReference Case
0
1,000
2,000
3,000
4,000
5,000
6,000
1999 2004 2009 2014 2019 2024
Tran
spor
t Fin
al E
nerg
y [k
toe] LPG Gasoline
Kerosene DieselFuel Oil Natural GasElectricity Hybrid
TRANSPORT FINAL ENERGY CONSUMPTIONReference Case
Comparative Assessment of Energy Options and Strategies until 2025 Mexican Study Team
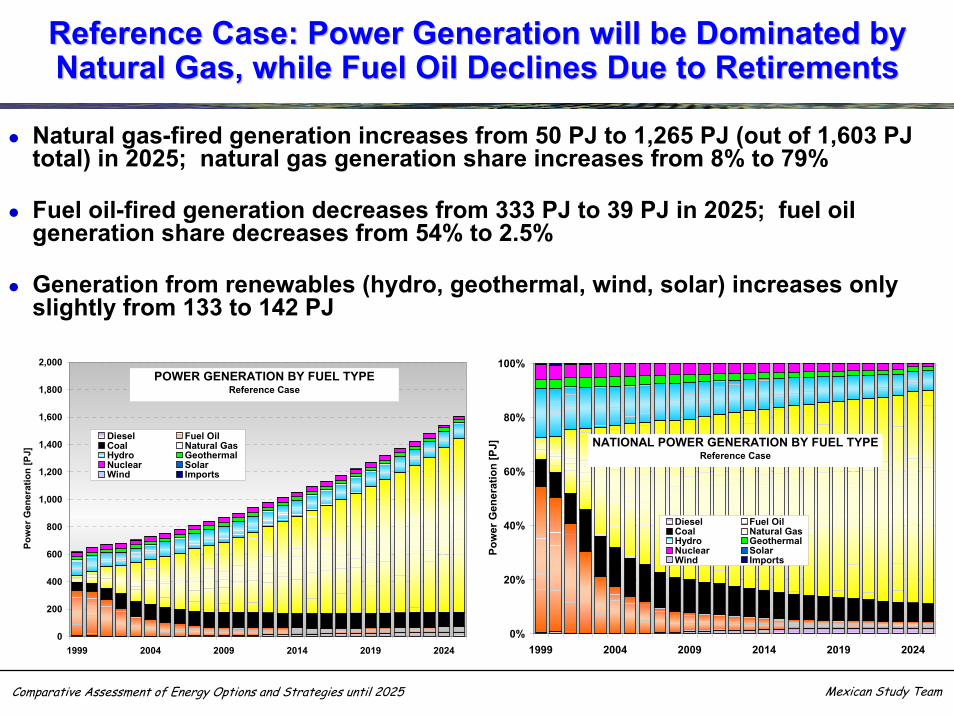
Reference Case: Power Generation will be Dominated by Reference Case: Power Generation will be Dominated by Natural Gas, while Fuel Oil Declines Due to RetirementsNatural Gas, while Fuel Oil Declines Due to Retirements
Natural gas-fired generation increases from 50 PJ to 1,265 PJ (out of 1,603 PJ total) in 2025; natural gas generation share increases from 8% to 79%
Fuel oil-fired generation decreases from 333 PJ to 39 PJ in 2025; fuel oil generation share decreases from 54% to 2.5%
Generation from renewables (hydro, geothermal, wind, solar) increases only slightly from 133 to 142 PJ
0
200
400
600
800
1,000
1,200
1,400
1,600
1,800
2,000
1999 2004 2009 2014 2019 2024
Pow
er G
ener
atio
n [P
J]
Diesel Fuel OilCoal Natural GasHydro GeothermalNuclear SolarWind Imports
POWER GENERATION BY FUEL TYPEReference Case
0%
20%
40%
60%
80%
100%
1999 2004 2009 2014 2019 2024
Pow
er G
ener
atio
n [P
J]
Diesel Fuel OilCoal Natural GasHydro GeothermalNuclear SolarWind Imports
NATIONAL POWER GENERATION BY FUEL TYPEReference Case
Comparative Assessment of Energy Options and Strategies until 2025 Mexican Study Team
Reference Case: Natural Gas Consumption is Primarily Reference Case: Natural Gas Consumption is Primarily Driven by Power Generation leading to a NearDriven by Power Generation leading to a Near--Term and Term and
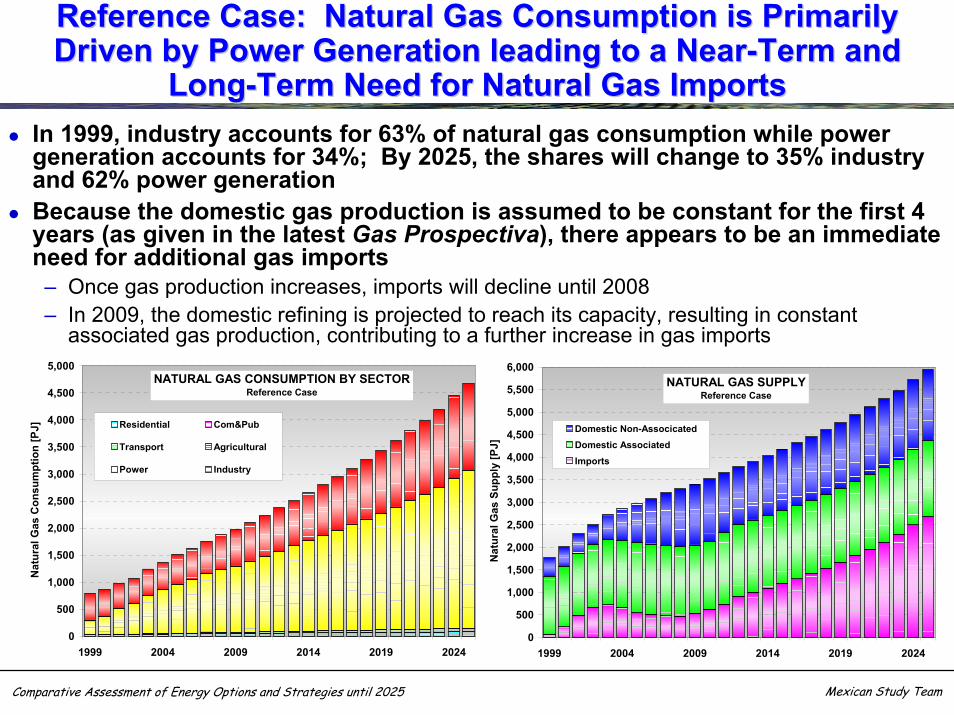
LongLong--Term Need for Natural Gas ImportsTerm Need for Natural Gas ImportsIn 1999, industry accounts for 63% of natural gas consumption while power generation accounts for 34%; By 2025, the shares will change to 35% industry and 62% power generationBecause the domestic gas production is assumed to be constant for the first 4 years (as given in the latest Gas Prospectiva), there appears to be an immediate need for additional gas imports
– Once gas production increases, imports will decline until 2008– In 2009, the domestic refining is projected to reach its capacity, resulting in constant
associated gas production, contributing to a further increase in gas imports
0
500
1,000
1,500
2,000
2,500
3,000
3,500
4,000
4,500
5,000
1999 2004 2009 2014 2019 2024
Nat
ural
Gas
Con
sum
ptio
n [P
J] Residential Com&Pub
Transport Agricultural
Power Industry
NATURAL GAS CONSUMPTION BY SECTORReference Case
0
500
1,000
1,500
2,000
2,500
3,000
3,500
4,000
4,500
5,000
5,500
6,000
1999 2004 2009 2014 2019 2024
Nat
ural
Gas
Sup
ply
[PJ]
Domestic Non-AssocicatedDomestic AssociatedImports
NATURAL GAS SUPPLYReference Case
Comparative Assessment of Energy Options and Strategies until 2025 Mexican Study Team
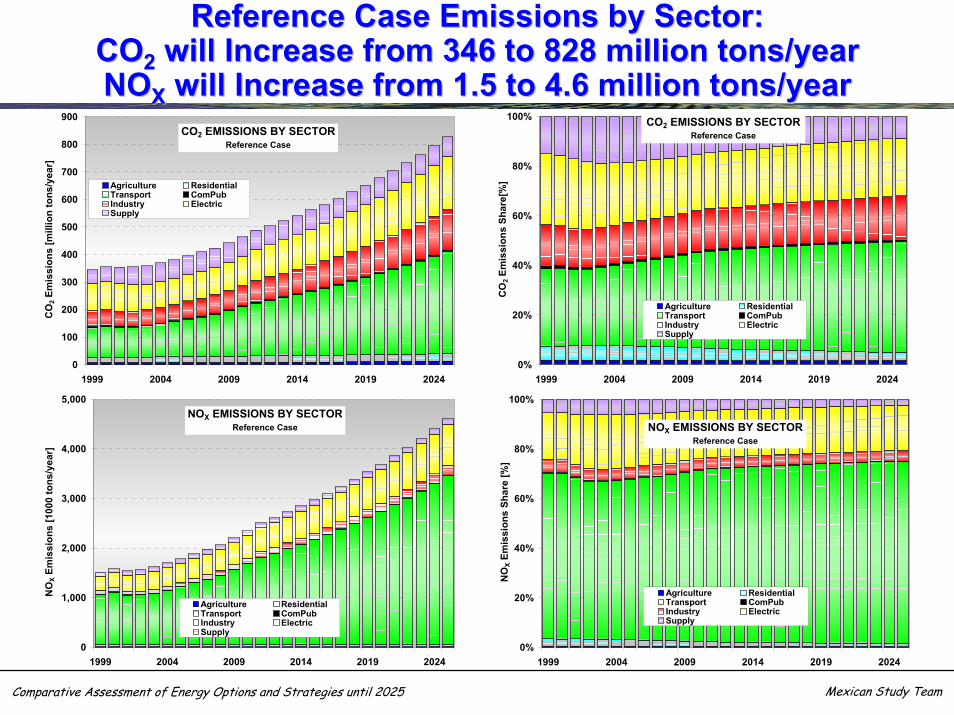
Reference Case Emissions by Sector:Reference Case Emissions by Sector:COCO22 will Increase from 346 to 828 million tons/yearwill Increase from 346 to 828 million tons/yearNONOXX will Increase from 1.5 to 4.6 million tons/yearwill Increase from 1.5 to 4.6 million tons/year
0%
20%
40%
60%
80%
100%
1999 2004 2009 2014 2019 2024
CO
2 Em
issi
ons
Shar
e[%
]
Agriculture ResidentialTransport ComPubIndustry ElectricSupply
CO2 EMISSIONS BY SECTORReference Case
0
100
200
300
400
500
600
700
800
900
1999 2004 2009 2014 2019 2024
CO
2 Em
issi
ons
[mill
ion
tons
/yea
r]
Agriculture ResidentialTransport ComPubIndustry ElectricSupply
CO2 EMISSIONS BY SECTORReference Case
0
1,000
2,000
3,000
4,000
5,000
1999 2004 2009 2014 2019 2024
NO
X Em
issi
ons
[100
0 to
ns/y
ear]
Agriculture ResidentialTransport ComPubIndustry ElectricSupply
NOX EMISSIONS BY SECTORReference Case
0%
20%
40%
60%
80%
100%
1999 2004 2009 2014 2019 2024
NO
X Em
issi
ons
Shar
e [%
]
Agriculture ResidentialTransport ComPubIndustry ElectricSupply
NOX EMISSIONS BY SECTORReference Case
Comparative Assessment of Energy Options and Strategies until 2025 Mexican Study Team
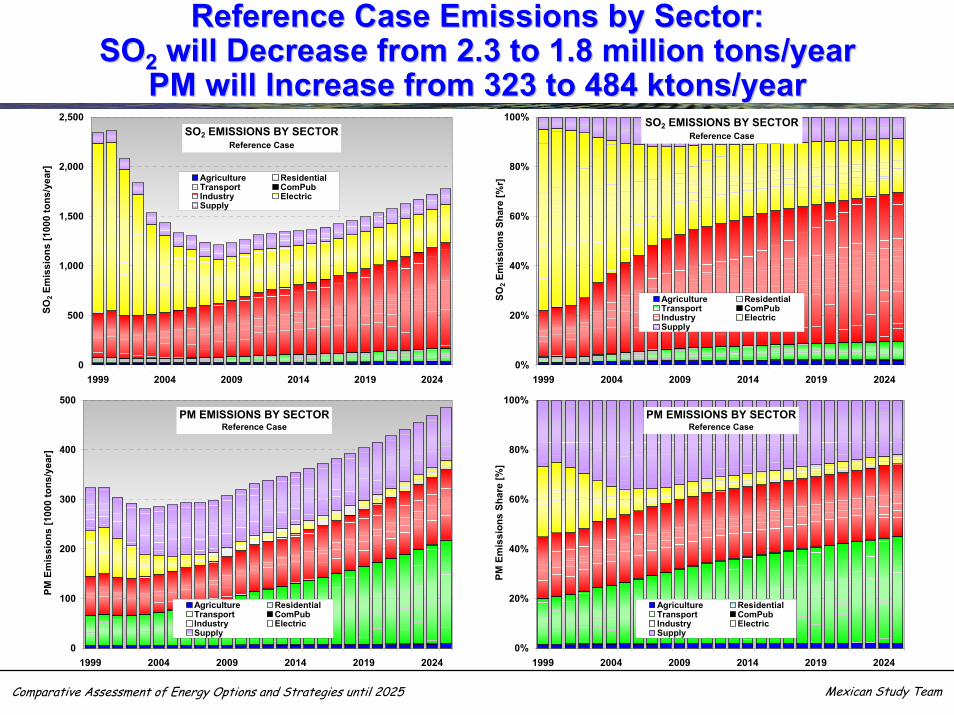
Reference Case Emissions by Sector:Reference Case Emissions by Sector:SOSO22 will Decrease from 2.3 to 1.8 million tons/yearwill Decrease from 2.3 to 1.8 million tons/year
PM will Increase from 323 to 484 ktons/yearPM will Increase from 323 to 484 ktons/year
0
500
1,000
1,500
2,000
2,500
1999 2004 2009 2014 2019 2024
SO2 E
mis
sion
s [1
000
tons
/yea
r]
Agriculture ResidentialTransport ComPubIndustry ElectricSupply
SO2 EMISSIONS BY SECTORReference Case
0%
20%
40%
60%
80%
100%
1999 2004 2009 2014 2019 2024
SO2 E
mis
sion
s Sh
are
[%r]
Agriculture ResidentialTransport ComPubIndustry ElectricSupply
SO2 EMISSIONS BY SECTORReference Case
0
100
200
300
400
500
1999 2004 2009 2014 2019 2024
PM E
mis
sion
s [1
000
tons
/yea
r]
Agriculture ResidentialTransport ComPubIndustry ElectricSupply
PM EMISSIONS BY SECTORReference Case
0%
20%
40%
60%
80%
100%
1999 2004 2009 2014 2019 2024
PM E
mis
sion
s Sh
are
[%]
Agriculture ResidentialTransport ComPubIndustry ElectricSupply
PM EMISSIONS BY SECTORReference Case
Comparative Assessment of Energy Options and Strategies until 2025 Mexican Study Team
Limited Gas Scenario: Imported Coal Replaces Limited Gas Scenario: Imported Coal Replaces Natural Gas for Power Generation Natural Gas for Power Generation
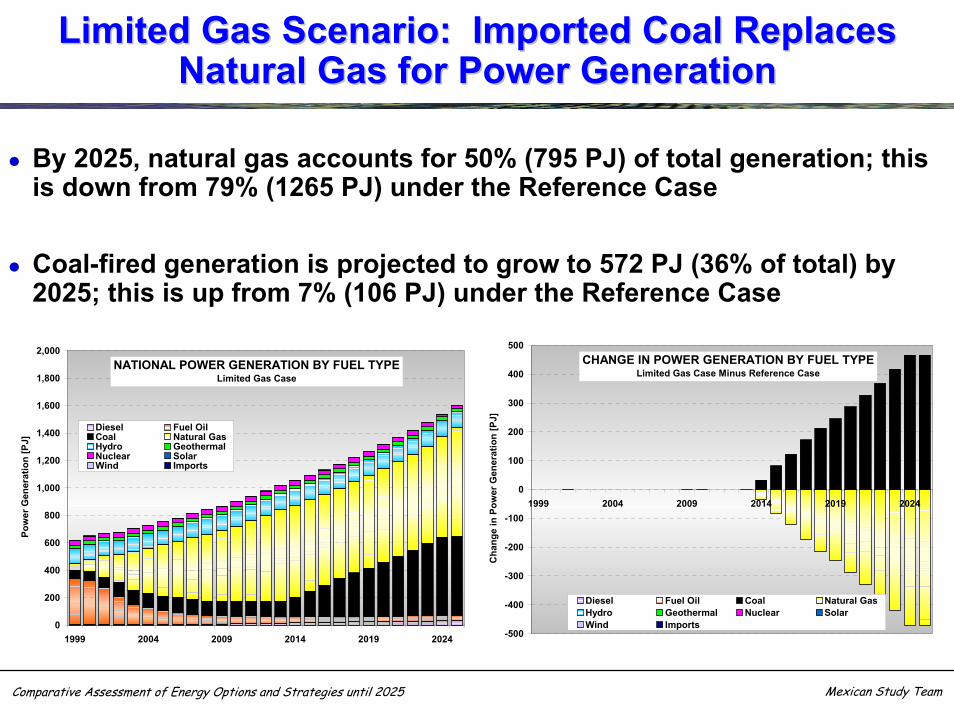
By 2025, natural gas accounts for 50% (795 PJ) of total generation; this is down from 79% (1265 PJ) under the Reference Case
Coal-fired generation is projected to grow to 572 PJ (36% of total) by 2025; this is up from 7% (106 PJ) under the Reference Case
0
200
400
600
800
1,000
1,200
1,400
1,600
1,800
2,000
1999 2004 2009 2014 2019 2024
Pow
er G
ener
atio
n [P
J]
Diesel Fuel OilCoal Natural GasHydro GeothermalNuclear SolarWind Imports
NATIONAL POWER GENERATION BY FUEL TYPELimited Gas Case
-500
-400
-300
-200
-100
0
100
200
300
400
500
1999 2004 2009 2014 2019 2024C
hang
e in
Pow
er G
ener
atio
n [P
J]
Diesel Fuel Oil Coal Natural GasHydro Geothermal Nuclear SolarWind Imports
CHANGE IN POWER GENERATION BY FUEL TYPELimited Gas Case Minus Reference Case
Comparative Assessment of Energy Options and Strategies until 2025 Mexican Study Team
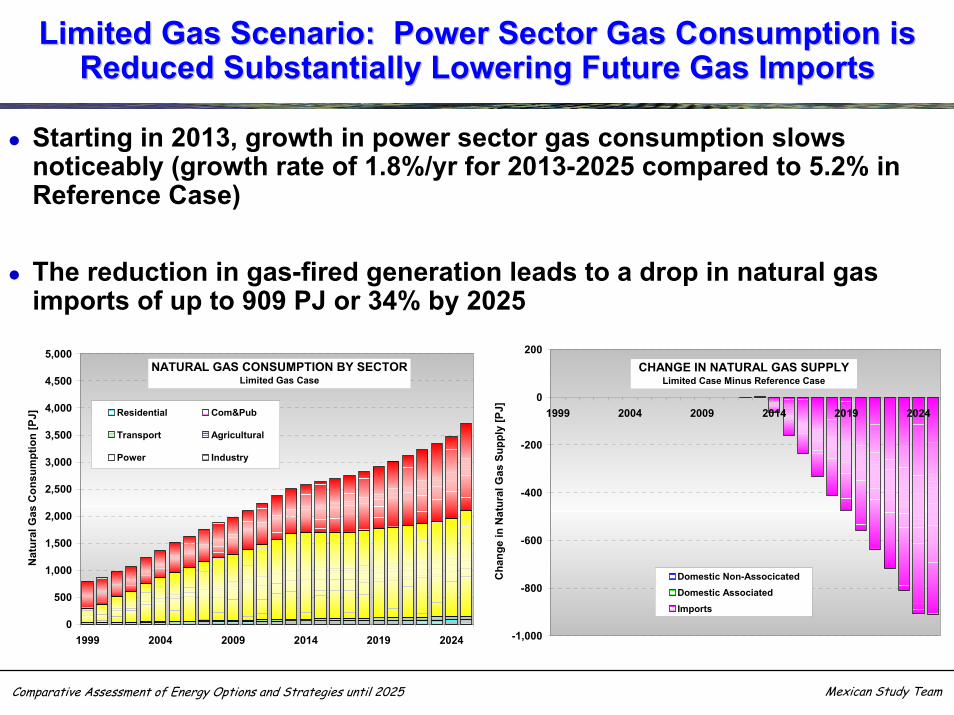
Limited Gas Scenario: Power Sector Gas Consumption is Limited Gas Scenario: Power Sector Gas Consumption is Reduced Substantially Lowering Future Gas ImportsReduced Substantially Lowering Future Gas Imports
Starting in 2013, growth in power sector gas consumption slows noticeably (growth rate of 1.8%/yr for 2013-2025 compared to 5.2% in Reference Case)
The reduction in gas-fired generation leads to a drop in natural gas imports of up to 909 PJ or 34% by 2025
-1,000
-800
-600
-400
-200
0
200
1999 2004 2009 2014 2019 2024
Cha
nge
in N
atur
al G
as S
uppl
y [P
J]
Domestic Non-AssocicatedDomestic AssociatedImports
CHANGE IN NATURAL GAS SUPPLYLimited Case Minus Reference Case
0
500
1,000
1,500
2,000
2,500
3,000
3,500
4,000
4,500
5,000
1999 2004 2009 2014 2019 2024
Nat
ural
Gas
Con
sum
ptio
n [P
J] Residential Com&Pub
Transport Agricultural
Power Industry
NATURAL GAS CONSUMPTION BY SECTORLimited Gas Case
Comparative Assessment of Energy Options and Strategies until 2025 Mexican Study Team
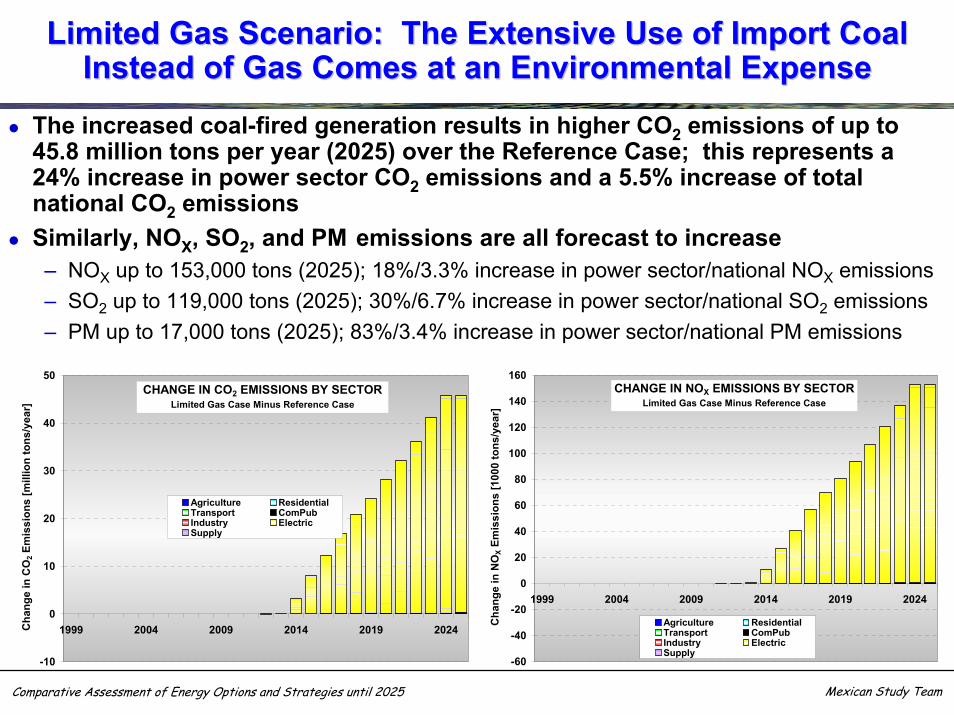
Limited Gas Scenario: The Extensive Use of Import Coal Limited Gas Scenario: The Extensive Use of Import Coal Instead of Gas Comes at an Environmental ExpenseInstead of Gas Comes at an Environmental Expense
The increased coal-fired generation results in higher CO2 emissions of up to 45.8 million tons per year (2025) over the Reference Case; this represents a 24% increase in power sector CO2 emissions and a 5.5% increase of total national CO2 emissionsSimilarly, NOX, SO2, and PM emissions are all forecast to increase
– NOX up to 153,000 tons (2025); 18%/3.3% increase in power sector/national NOX emissions– SO2 up to 119,000 tons (2025); 30%/6.7% increase in power sector/national SO2 emissions– PM up to 17,000 tons (2025); 83%/3.4% increase in power sector/national PM emissions
-10
0
10
20
30
40
50
1999 2004 2009 2014 2019 2024Cha
nge
in C
O2 E
mis
sion
s [m
illio
n to
ns/y
ear]
Agriculture ResidentialTransport ComPubIndustry ElectricSupply
CHANGE IN CO2 EMISSIONS BY SECTORLimited Gas Case Minus Reference Case
-60
-40
-20
0
20
40
60
80
100
120
140
160
1999 2004 2009 2014 2019 2024
Cha
nge
in N
OX
Emis
sion
s [1
000
tons
/yea
r]
Agriculture ResidentialTransport ComPubIndustry ElectricSupply
CHANGE IN NOX EMISSIONS BY SECTORLimited Gas Case Minus Reference Case
Comparative Assessment of Energy Options and Strategies until 2025 Mexican Study Team
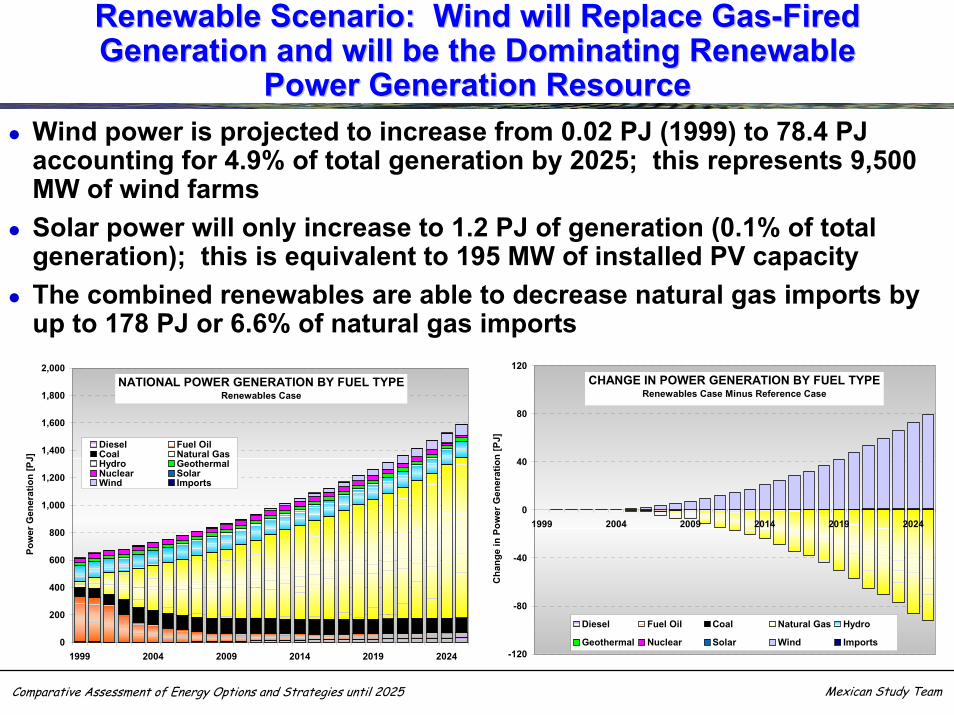
Renewable Scenario: Wind will Replace GasRenewable Scenario: Wind will Replace Gas--Fired Fired Generation and will be the Dominating RenewableGeneration and will be the Dominating Renewable
Power Generation ResourcePower Generation ResourceWind power is projected to increase from 0.02 PJ (1999) to 78.4 PJ accounting for 4.9% of total generation by 2025; this represents 9,500 MW of wind farmsSolar power will only increase to 1.2 PJ of generation (0.1% of total generation); this is equivalent to 195 MW of installed PV capacityThe combined renewables are able to decrease natural gas imports by up to 178 PJ or 6.6% of natural gas imports
-120
-80
-40
0
40
80
120
1999 2004 2009 2014 2019 2024
Cha
nge
in P
ower
Gen
erat
ion
[PJ]
Diesel Fuel Oil Coal Natural Gas Hydro
Geothermal Nuclear Solar Wind Imports
CHANGE IN POWER GENERATION BY FUEL TYPERenewables Case Minus Reference Case
0
200
400
600
800
1,000
1,200
1,400
1,600
1,800
2,000
1999 2004 2009 2014 2019 2024
Pow
er G
ener
atio
n [P
J]
Diesel Fuel OilCoal Natural GasHydro GeothermalNuclear SolarWind Imports
NATIONAL POWER GENERATION BY FUEL TYPERenewables Case
Comparative Assessment of Energy Options and Strategies until 2025 Mexican Study Team
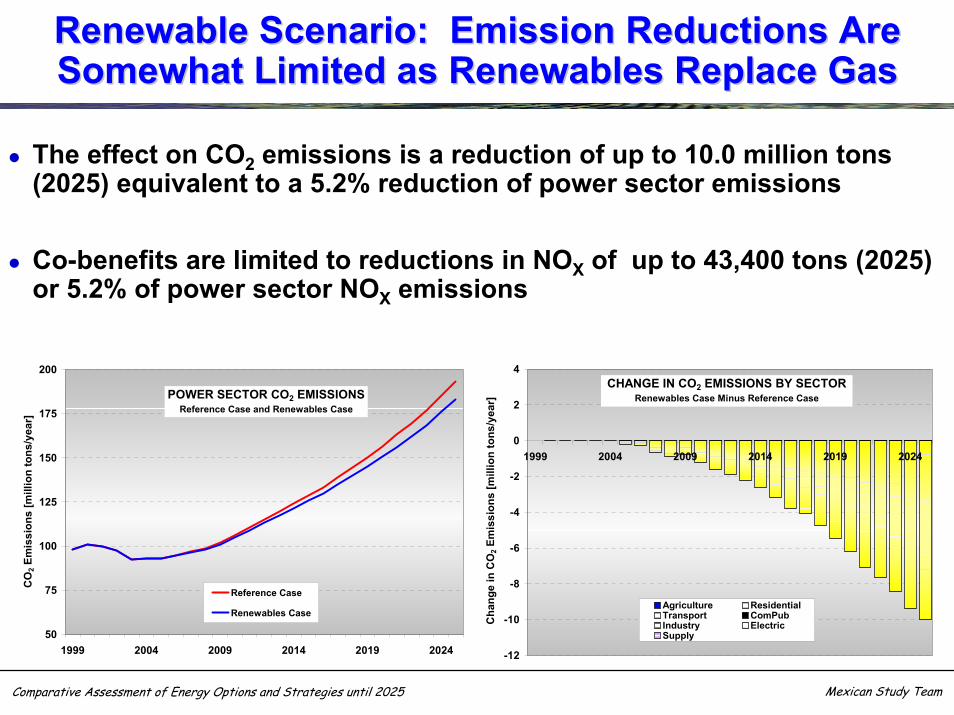
Renewable Scenario: Emission Reductions Are Renewable Scenario: Emission Reductions Are Somewhat Limited as Renewables Replace GasSomewhat Limited as Renewables Replace Gas
The effect on CO2 emissions is a reduction of up to 10.0 million tons (2025) equivalent to a 5.2% reduction of power sector emissions
Co-benefits are limited to reductions in NOX of up to 43,400 tons (2025) or 5.2% of power sector NOX emissions
-12
-10
-8
-6
-4
-2
0
2
4
1999 2004 2009 2014 2019 2024
Cha
nge
in C
O2 E
mis
sion
s [m
illio
n to
ns/y
ear]
Agriculture ResidentialTransport ComPubIndustry ElectricSupply
CHANGE IN CO2 EMISSIONS BY SECTORRenewables Case Minus Reference Case
50
75
100
125
150
175
200
1999 2004 2009 2014 2019 2024
CO
2 Em
issi
ons
[mill
ion
tons
/yea
r]
Reference Case
Renewables Case
POWER SECTOR CO2 EMISSIONSReference Case and Renewables Case
Comparative Assessment of Energy Options and Strategies until 2025 Mexican Study Team
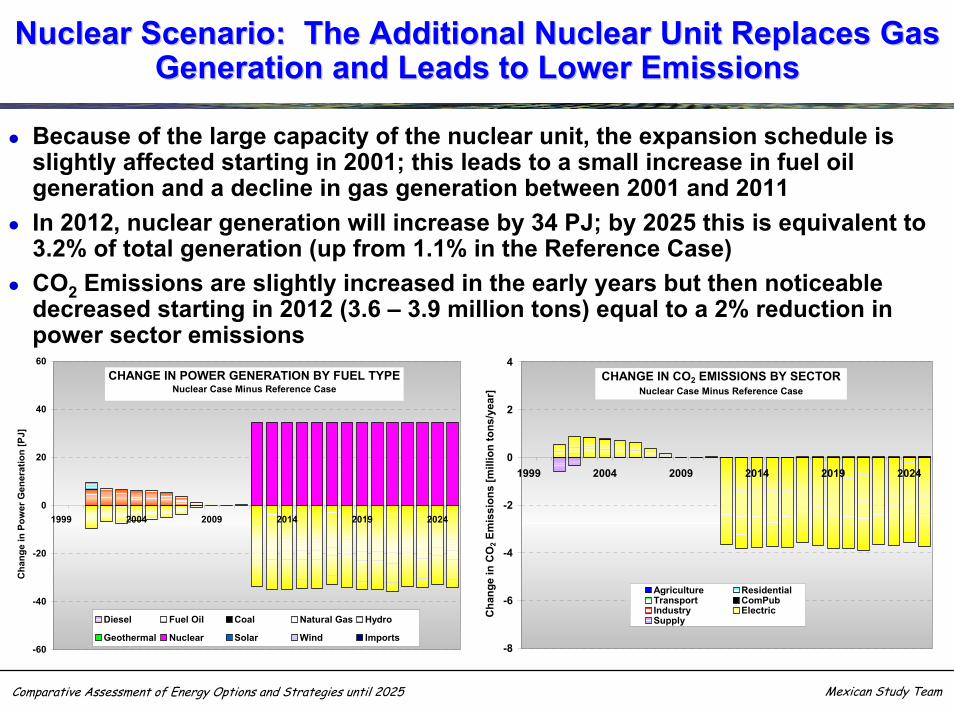
Nuclear Scenario: The Additional Nuclear Unit Replaces Gas Nuclear Scenario: The Additional Nuclear Unit Replaces Gas Generation and Leads to Lower EmissionsGeneration and Leads to Lower Emissions
Because of the large capacity of the nuclear unit, the expansion schedule is slightly affected starting in 2001; this leads to a small increase in fuel oil generation and a decline in gas generation between 2001 and 2011In 2012, nuclear generation will increase by 34 PJ; by 2025 this is equivalent to 3.2% of total generation (up from 1.1% in the Reference Case)CO2 Emissions are slightly increased in the early years but then noticeable decreased starting in 2012 (3.6 – 3.9 million tons) equal to a 2% reduction in power sector emissions
-60
-40
-20
0
20
40
60
1999 2004 2009 2014 2019 2024
Cha
nge
in P
ower
Gen
erat
ion
[PJ]
Diesel Fuel Oil Coal Natural Gas Hydro
Geothermal Nuclear Solar Wind Imports
CHANGE IN POWER GENERATION BY FUEL TYPENuclear Case Minus Reference Case
-8
-6
-4
-2
0
2
4
1999 2004 2009 2014 2019 2024C
hang
e in
CO
2 Em
issi
ons
[mill
ion
tons
/yea
r]
Agriculture ResidentialTransport ComPubIndustry ElectricSupply
CHANGE IN CO2 EMISSIONS BY SECTORNuclear Case Minus Reference Case
Comparative Assessment of Energy Options and Strategies until 2025 Mexican Study Team
Summary of ResultsSummary of Results
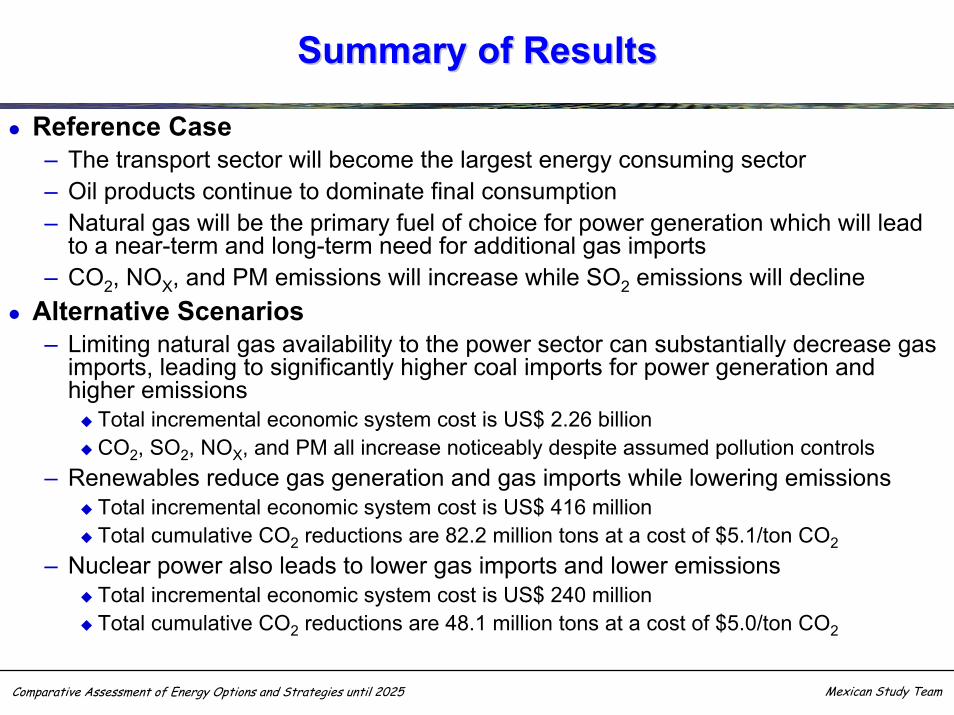
Reference Case– The transport sector will become the largest energy consuming sector– Oil products continue to dominate final consumption– Natural gas will be the primary fuel of choice for power generation which will lead
to a near-term and long-term need for additional gas imports– CO2, NOX, and PM emissions will increase while SO2 emissions will decline
Alternative Scenarios– Limiting natural gas availability to the power sector can substantially decrease gas
imports, leading to significantly higher coal imports for power generation and higher emissions
Total incremental economic system cost is US$ 2.26 billionCO2, SO2, NOX, and PM all increase noticeably despite assumed pollution controls
– Renewables reduce gas generation and gas imports while lowering emissionsTotal incremental economic system cost is US$ 416 millionTotal cumulative CO2 reductions are 82.2 million tons at a cost of $5.1/ton CO2
– Nuclear power also leads to lower gas imports and lower emissionsTotal incremental economic system cost is US$ 240 millionTotal cumulative CO2 reductions are 48.1 million tons at a cost of $5.0/ton CO2