Embed Size (px)
Citation preview
ISSN 0104-6632
Printed in Brazil
www.abeq.org.br/bjche
Vol. 25, No. 04, pp. 683 - 696, October - December, 2008
*To whom correspondence should be addressed
Brazilian Journal
of Chemical
Engineering
COMPARATIVE ASSESSMENT OF AMBIENT AIR
QUALITY IN TWO URBAN AREAS ADJACENT TO
PETROLEUM DOWNSTREAM/UPSTREAM
FACILITIES IN KUWAIT
S. M. Al-Salem1*
and A R. Khan2
1Petrochemical Processes Program Element, Petroleum Research and Studies Center,
Phone: +(965) 9677200, Fax +(965) 3987673, Kuwait Institute for Scientific Research,
P.O. Box: 24885, Safat 13109, State of Kuwait.
E-mail: [email protected]
E-mail: [email protected] and Air Pollution Department, Environment and Urban Development Division,
Kuwait Institute for Scientific Research, P.O. Box: 24885, Safat 13109, State of Kuwait.
(Received: January 6, 2008 ; Accepted: April 27, 2008)
Abstract - Air quality data (ground level ozone (O3), NO, NOx, SO2, CO, H2S and NH3) of two Kuwaiti
urban areas adjacent to petroleum processing facilities, Fahaheel and Al-Riqa, were analyzed and compared to
evaluate: (1) the exceedances of the Kuwait Environment Public Authority (KUEPA) air quality limits, (2)
primary air pollution sources and their contribution to the ambient load, (3) diurnal patterns of air pollutants
and (4) the “weekend effect” on O3 levels. High O3 levels, above the threshold limit for human health, were
observed in both urban areas. CO, NOx and NO levels in Fahaheel were higher than in Al-Riqa. Combustion
sources (which exist close to Fahaheel) drive both NOx and NO diurnal patterns in both areas. Emissions
from downstream facilities and the activity of Fahaheel highway affect the CO levels in the areas.
Concentration roses were plotted for annual durations to examine the primary dominant sources of air
pollution in both study areas. By establishing a Chemical Mass Balance (CMB) model around the two
receptor points in both areas, it was revealed that the downstream facilities sector was the main contributor of
air pollutants in Fahaheel. CMB model gave a 70% average contribution of the sector to the Fahaheel receptor
point. However, 70% of the total contribution of the studied sources in Al-Riqa urban area was from the
traffic and line sources side. The examination of the rate of O3 accumulation, during the high O3 period in
Kuwait (April-October), revealed the occurrence of two phases, a fast and a slow one, with different durations
in each urban area. Regression equations were used to study the midweek effect of O3 levels. This study
supports the hypothesis that O3 weekend variation is due to an NOx emission difference between weekends
and weekdays and VOCs sensitivity.
Keywords: O3, NO, CO, SO2; Weekend effect; Chemical Mass Balance; Concentration roses.
INTRODUCTION
Since the establishment of new rules and
regulations governing all environment-affecting
industries emerged in the state of Kuwait back in
2001 (KUEPA, 2001), there has been a growing
concern about air quality in urban areas. To improve
urban air quality, policy makers express widespread
interest in controlling major airborne pollutants such
as ground level ozone (O3), CO, NO, NO2, SO2, H2S,
NH3, Volatile Organic Compounds (VOCs) and
Polycyclic Aromatic Hydrocarbons (PAHs).

684 S. M. Al-Salem and A R. Khan
Brazilian Journal of Chemical
Deleterious effects on human health (Brunekreef and
Holgate, 2002), injury to plants (Saitanis et al., 2001)
and reduction of crop yield (Nali et al., 2002) are
known to be caused by increased levels of these
pollutants. Besides, elevated levels of VOCs and
ground level O3, measured across regional airsheds
are known to affect human health (Seinfeld and
Pandis, 1998; Al-Salem and Bouhamrah, 2006; Al-
Salem and Al-Fadhlee, 2007). In many countries
across Asia, North America and Europe, the air
quality has been improved over the last two decades.
However, it is estimated that in 2010 the European
urban population will still be exposed to high
concentrations of air pollutants (EEA, 2003).
The number of reactions involved in air pollutant
formation is very large, and has kept scientists
occupied for many years. The oxidation of SO2 and
NO2 and their conversion to particulate sulfate
( 24SO- ) and gaseous and particulate nitrates ( 3NO- )
are important characteristics of urban air
photochemistry (Monn and Shaeppi, 1993;
Matsumoto et al., 1998). NO2 is oxidized to nitric
acid (HNO3) in the atmosphere, which in turn forms
3NO- particles. The effects of these secondary
pollutants (including O3) are associated with
acidification of precipitation, visibility reduction and
effects on human health (Riga-Karadinos and
Saitanis, 2005). Many attempts have been made by
scientists to monitor and control such gaseous
pollutants. Khan and Al-Salem (2007a) have studied
airborne pollutants in an urban area in Kuwait in
order to assess the ambient air quality and its
suitability for urban living development. With data
collected for three years it was discovered that
hydrogen sulfide (H2S) was the pollutant with the
major annual increase due to the abundant sources
surrounding the area under investigation. Major
violations against the KUEPA were recorded in that
study. A strict strategy was proposed to monitor
urban area air quality in Kuwait, with constant
monitoring tools and methods.
Seasonal variation effects on gaseous pollutants
are of great significance to the life span and cycle of
any pollutant in the lower atmosphere. Ozeki et al.
(2006) characterized seasonal and regional variations
of gaseous pollutants in transportation. Precipitation
samples were collected from nine areas in Japan
(2000 and 2001) to profile the pollutants in each of
the four seasons of the year. Khan and Al-Salem
(2007b) have selected three pollutants (methane (n-
CH4), benzene (C6H6) and NOx) to be seasonally
monitored and studied for a period of three years in
an urban estate in Kuwait. The elevated temperatures
and strong winds of the summer seasons over the
study period affected methane levels drastically due
to the increase of dust levels in the summer periods
in Kuwait. Dust adsorption effect and break down of
methane particles all resulted in low levels of
methane gas in the summer seasons.
The objective of this work was to investigate the
air pollution of two urban areas in Kuwait, namely
Fahaheel and Al-Riqa. The two areas are in the
vicinity of many industrial sites, petroleum
downstream/upstream facilities (including Kuwait’s
three refineries belt, petrochemical complexes, crude
oil production points …etc) and many small industries.
For this purpose we explore the air pollution levels in
these areas, with emphasis paid to O3, NO, NOx, CO,
H2S and NH3. The exceedances of the air quality
limits of the KUEPA were calculated and the sources
were detected around each area and their significance
and contribution to the total load of air pollution were
determined using concentration rose plotting and a
Chemical Mass Balance (CMB) model established
around each area at a chosen receptor point. The
diurnal patterns and seasonal variations of these
gaseous pollutants were studied and the relationships
between them were explored. In addition, the rate of
O3 accumulation and the so called “weekend effect”,
concerning the variation of O3 levels between
weekdays and weekends, were investigated. The
metrological parameters (ambient temperature,
relative humidity and wind speed and direction) and
their influence on the air quality were also considered
in the discussion of the results.
STUDY AREAS
Both urban areas (Al-Ahmadi governorate, state
of Kuwait) are characterized by prolonged sunny hot
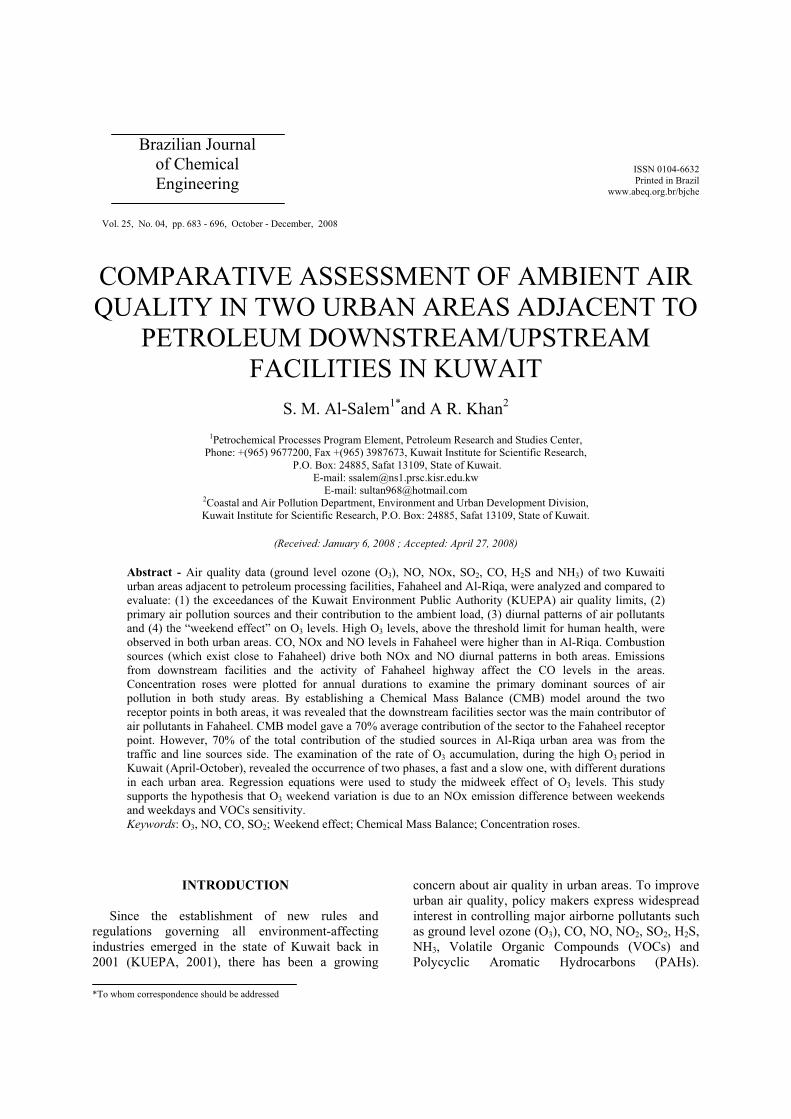
periods from late spring to autumn. Fig.1 shows both
study areas with respect to the coastline of Kuwait
and southern downstream facilities and the upstream
facilities of the greater Burgan area (second largest
oil filed in the world). The image also shows
Fahaheel highway, which is considered one of the
two busiest highways in Kuwait, used by work
commuters and travelers to other Gulf Council
Countries (GCC). The highway is also used by Al-
Ahmadi governorate residents to commute to their
work places or Kuwait city. Fahaheel highway
passes through both study areas.
Comparative Assessment of Ambient Air Quality in Two Urban Areas Adjacent to Petroleum Downstream/Upstream 685
Brazilian Journal of Chemical Engineering Vol. 25, No. 04, pp. 683 - 696, October - December,
MA
A R
efi
nery
Fah
ah
ee
l
Al-
Riq
a
Up
str
ea
m
Fa
cil
itie
s
Al-
Ah
ma
di a
rea
Fah
ah
ee
l
Hig
hw
ay
N S
Fig
ure
1:
Sat
elli
te i
mag
e sh
ow
ing b
oth
are
as u
nd
er i
nv
esti
gat
ion
(F
ahah
eel
and
Al-
Riq
a) w
ith
res
pec
t to
the
mai
n p
etro
leu
m d
ow
nst
ream
,
nam
ely M
AA
ref
iner
y a
nd
up
stre
am f
acil
itie
s in
th
e st
ate
of
Ku
wai
t. S
ou
rce:
im
age
adap
ted f
rom
KIS
R s
atel
lite
arc
hiv
es (
Ku
wai
t).
686 S. M. Al-Salem and A R. Khan
Brazilian Journal of Chemical Engineering
The Fahaheel area (inhabited by about 100,000
residents) is considered to be one of five major areas
in the state of Kuwait. It is located on the south of
the coastal urban development of Kuwait city. The
location of the area makes it a major point for work
commuting and real estate ventures. The overly
populated Fahaheel is adjacent to the highest
capacity oil refinery in the state (Mina Al-Ahamdi -
MAA- refinery). All the refineries, including MAA
(three refineries belt), are located on the south side of
the main Fahaheel shopping area (downtown).
Petrochemical industries such as ammonia, urea,
polyethylene and polypropylene plants, as well as the
newly proposed polystyrene (proposed year of
commissioning 2008), aromatics (proposed year of
commissioning 2009) and Olefins II projects
(proposed year of commissioning 2008) and other
private small cottage industries also exist on the
south side of the area. Background concentrations
are associated with the second largest oil field in the
world (The Greater Burgan Field) located somewhat
on the west end of Fahaheel. By comparison, Al-
Riqa area (inhabited by about 40,000 inhabitants) is
less populated than Fahaheel. The residential area of
Al-Riqa concentrates Kuwaiti residents of the middle
and working classes. It is situated to the north side of
Fahaheel and is dominated by inner roads that lead to
the downtown of the area. To the south of Al-Riqa
are the three refineries belt and Fahaheel area and the
northeastern part is occupied by the downtown area
of Al-Riqa. The polyclinics of Fahaheel and Al-Riqa
were chosen to be the receptor points of both study
areas, serving as the data collection point and the
best location surrounded by the main air pollution
sources.
DATA AND METHODS
The data used in this study were provided by the
Air Pollution Monitoring Division, Kuwait
Environment Public Authority (KUEPA) from both
Fahaheel and Al-Riqa monitoring stations (15 and
7.5 m above ground level, respectively). The
available data concern both five minute interval
original data points and hourly averages of
continuous measurements of the concentrations of
the pollutants O3 (ppb), NO (ppb), NO2 (ppb), NOx
(ppb), CO (ppm), H2S (ppb) and NH3 (ppb), total
methane hydrocarbons (ppm), CH4 (ppm), (not all
used in this study) and of the metrological
parameters of ambient temperature (0C), relative
humidity (%) and wind speed (m/s-1) and direction.
The ambient air samples were drawn from a fixed
probe (Group Tek. Model, 3-5 m, fixed photolytic
converter, Environment SA and Thermo Models)
located on the top of the polyclinics and were
analyzed by using different primary pollutant and
secondary precursor analyzers (Whatman 41, Air
sample Grasbey-Anderson Ltd., 1% tolerance,
weather station), all connected with a central online
data acquisition system managed and controlled by
EnviDAS software. For both urban areas, the data set
covered the period from 1st January, 2004 to 31st
December, 2005. Data points were filtered by
discarding span check points, NULL and mechanical
error sequences. The recovered data points were 97%
of the original magnitude.
From those data the average diurnal pattern
profiles were constructed for each pollutant and the
exceedances of the limits/threshold values, over
which they were considered injurious for human
health, were calculated. Two receptor points (i.e.
polyclinics in both urban areas) were chosen to
establish a Chemical Mass Balance (CMB) model, to
determine the percent contribution of the primary
sources of air pollution around each urban area. The
rates of the O3 accumulation, as described by both
Fuijita et al. (2003) and Riga-Karadinos and Saitanis
(2005) were discussed for the high O3 months in
Kuwait (i.e. April-October). The NO and O3
concentrations were further analyzed to reveal any
differences between midweek and weekends.
The source allocation was ascertained by
analyzing the data points collected and by
observing the wind directions of peak pollutant
concentration values. Many researchers in their
investigations have used CMB models to identify
the predominant sources with respect to wind
direction and their impact on the ambient air quality
(Christensen and Gunst, 2004 and Christensen
2004). Various major airborne pollutants were
present in the current pool of data. Sectors around
each data collection point (receptor point) were
divided to ease the analysis part of the constructed
CMB model. Al-Riqa sectors were as follows: 1)
downtown area, 2) refineries, petroleum and
petrochemical industries, 3) traffic line sources
(Fahaheel highway), gas stations, and sports clubs.
Table 1 shows the distribution of these three sectors
with respect to the data collection point in Al-Riqa
(Polyclinic). As for Fahaheel the primary pollution
sources and each corresponding sector is shown in
Table 2 (Al-Salem and Khan, 2006).
Comparative Assessment of Ambient Air Quality in Two Urban Areas Adjacent to Petroleum Downstream/Upstream 687
Brazilian Journal of Chemical Engineering Vol. 25, No. 04, pp. 683 - 696, October - December, 2008
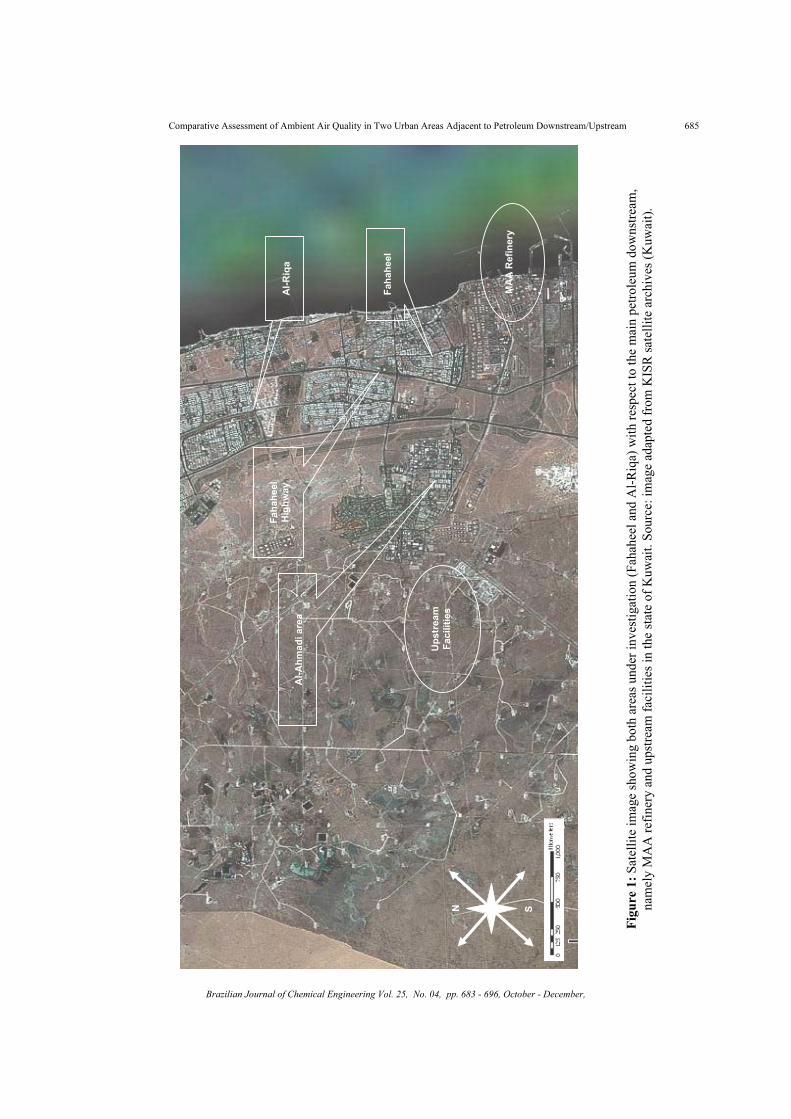
Table 1: Position distribution around the outdoor data collection point in Al-Riqa urban area.
Position in degrees Potential Air Pollution Source
300-130 Downtown area
131-260 Refineries, petroleum and petrochemical industries
261-299 Traffic line sources (Highway), gas stations, and sports clubs
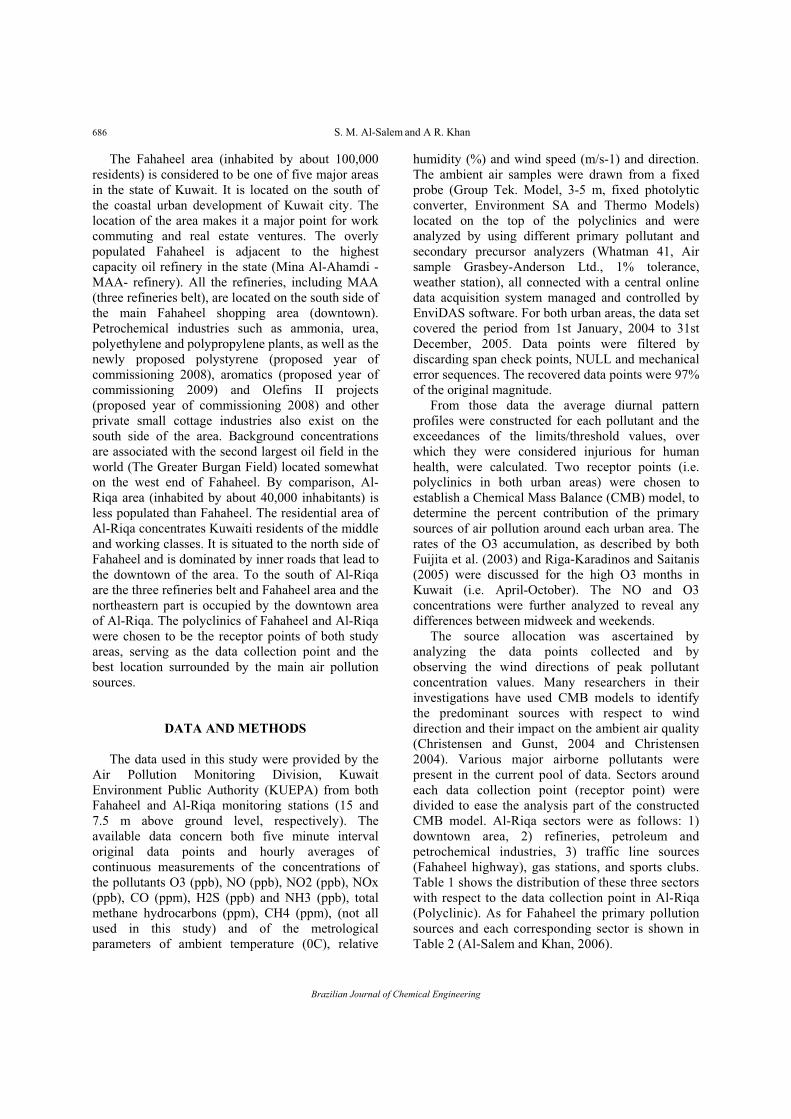
Table 2: Position distribution around the outdoor data collection point in the
Fahaheel urban area, Source: Al-Salem and Khan, 2006.
Position in degrees Source
0-135 Downtown area
136-255 Refineries, petroleum and petrochemical industries
256-300 Oil production facilities (Burgan)
301-360 Traffic line sources (Highway), gas stations, and sports clubs
The above distribution of sectors (i.e. primary air
pollution sources) will be identified in the CMB
Modelling step as to how they affect the receptor
points of the area. It was assumed that the sources
were in the following directions, corresponding to
the closest degree of each sector, in the case of Al-
Riqa urban area, downtown area [00-1350], refineries
[1360-2700] and line sources [2710-3600].
Based on the initial analysis and collected data,
the CMB model was setup in Microsoft Office 2003
in an EXCEL program. Non-methane Hydrocarbons
(nm-HC), methane, carbon monoxide (CO), total
hydrocarbons (HCT) and O3 concentrations were
also used in the execution of CMB model. The
standard approach was applied for apportioning
observed pollutant concentrations to their sources.
The model implements a least squares solution to a
set of linear equations, expressing each source as a
linear sum product of the source percent contribution
with predominant wind sector.
The CMB equations were based on the
assumption that the observed ambient quantity of a
chemical species is the simple sum of the product of
pollutant contributions affecting the airshed and
fraction of the wind sector. The CMB model uses the
chemical and physical characteristics of the gases
and particulates at a given receptor point to identify
the presence of and/or quantify source contributions.
Chemical degradation is excluded from the CMB
analysis since NO and ozone convert
photochemically very fast. Equation 1 is the basic
relation corresponding to the selected receptor point.
This equation expresses the relation between the
concentrations of the chemical speicies measured at
the receptor point (Main health center of Al-Riqa)
and the chemicals emitted from the source.
i ij iC = F - SD ä (1)
Where DCi is the difference in concentration of a
chemical compound i at the receptor point, Fij is the
fraction of concentration of the species i starting
from the source j and Si is the concentration of
pollutant i at the receptor point.
The total wind speed contribution must be
calculated in order to get the percent wind speed
contribution with respect to the desired range of
wind directions, i.e., the source. Equation 2 was used
to calculate the wind speed contribution with respect
to each source.
j j%WS = (k / K) x 10 (2)
Where %WSj is the percent contribution of wind
speed with respect to source j, kj is the summation of
wind speed points collected with respect to source j
in ( m/s) and K is the total summation of wind speed
points in (m/s) excluding calm period.
In order to match the concentrations at the
receptor point, predefined linear functions were
solved with an objective function. The objective
function, defined as the sum of squares of
differences between measured and fractional
concentrations of different sources chemical
fingerprints including the influence of wind sector, is
minimized The chemical fingerprints were average
readings of concentrations reflecting the recorded
inventories of the sources (Al-Bassam and Khan,
2004, Al-Hajraf et al., 2005). Equation 3 was used to
solve for the least linear square root. The linear
function was introduced for the four major sources
studied as well as the receptor point, which represent
the total cummulative concentration of the pollutant
to be matched.
m n n
i j j i j j
j 1 i 1 i 1
LF C .WS .SC C .WS .SC
= = =
å õ= -æ öæ ö
ç ÷ä ä ä (3)
688 S. M. Al-Salem and A R. Khan
Brazilian Journal of Chemical Engineering
L.F. is the linear function set to match the percent contribution of each source, Ci is the concentration of airborne chemical i at a certain source or receptor point, %WSj is the percent wind speed contribution at a certain wind direction range for source j, %SCj is the percent source contribution for a source j, where i represent pollutants and j sources.
RESULTS AND DISCUSSION
Exceedances of Air Quality Limits/Threshold Values
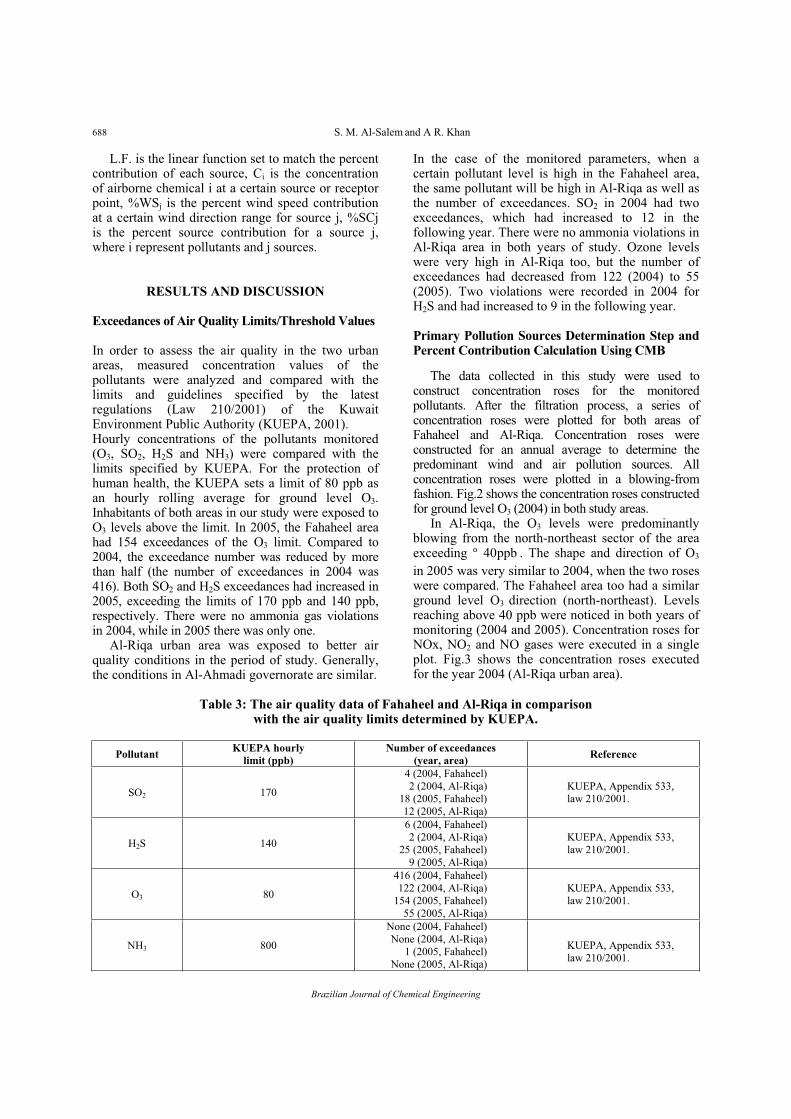
In order to assess the air quality in the two urban areas, measured concentration values of the pollutants were analyzed and compared with the limits and guidelines specified by the latest regulations (Law 210/2001) of the Kuwait Environment Public Authority (KUEPA, 2001). Hourly concentrations of the pollutants monitored (O3, SO2, H2S and NH3) were compared with the limits specified by KUEPA. For the protection of human health, the KUEPA sets a limit of 80 ppb as an hourly rolling average for ground level O3.Inhabitants of both areas in our study were exposed to O3 levels above the limit. In 2005, the Fahaheel area had 154 exceedances of the O3 limit. Compared to 2004, the exceedance number was reduced by more than half (the number of exceedances in 2004 was 416). Both SO2 and H2S exceedances had increased in 2005, exceeding the limits of 170 ppb and 140 ppb, respectively. There were no ammonia gas violations in 2004, while in 2005 there was only one.
Al-Riqa urban area was exposed to better air quality conditions in the period of study. Generally, the conditions in Al-Ahmadi governorate are similar.
In the case of the monitored parameters, when a certain pollutant level is high in the Fahaheel area, the same pollutant will be high in Al-Riqa as well as the number of exceedances. SO2 in 2004 had two exceedances, which had increased to 12 in the following year. There were no ammonia violations in Al-Riqa area in both years of study. Ozone levels were very high in Al-Riqa too, but the number of exceedances had decreased from 122 (2004) to 55 (2005). Two violations were recorded in 2004 for H2S and had increased to 9 in the following year.
Primary Pollution Sources Determination Step and Percent Contribution Calculation Using CMB
The data collected in this study were used to construct concentration roses for the monitored pollutants. After the filtration process, a series of concentration roses were plotted for both areas of Fahaheel and Al-Riqa. Concentration roses were constructed for an annual average to determine the predominant wind and air pollution sources. All concentration roses were plotted in a blowing-from fashion. Fig.2 shows the concentration roses constructed for ground level O3 (2004) in both study areas.
In Al-Riqa, the O3 levels were predominantly blowing from the north-northeast sector of the area exceeding 40ppbº . The shape and direction of O3
in 2005 was very similar to 2004, when the two roses were compared. The Fahaheel area too had a similar ground level O3 direction (north-northeast). Levels reaching above 40 ppb were noticed in both years of monitoring (2004 and 2005). Concentration roses for NOx, NO2 and NO gases were executed in a single plot. Fig.3 shows the concentration roses executed for the year 2004 (Al-Riqa urban area).
Table 3: The air quality data of Fahaheel and Al-Riqa in comparison with the air quality limits determined by KUEPA.
Pollutant KUEPA hourly
limit (ppb)
Number of exceedances
(year, area) Reference
SO2 170
4 (2004, Fahaheel)
2 (2004, Al-Riqa)
18 (2005, Fahaheel)
12 (2005, Al-Riqa)
KUEPA, Appendix 533,
law 210/2001.
H2S 140
6 (2004, Fahaheel)
2 (2004, Al-Riqa)
25 (2005, Fahaheel)
9 (2005, Al-Riqa)
KUEPA, Appendix 533,
law 210/2001.
O3 80
416 (2004, Fahaheel)
122 (2004, Al-Riqa)
154 (2005, Fahaheel)
55 (2005, Al-Riqa)
KUEPA, Appendix 533,
law 210/2001.
NH3 800
None (2004, Fahaheel)
None (2004, Al-Riqa)
1 (2005, Fahaheel)
None (2005, Al-Riqa)
KUEPA, Appendix 533,
law 210/2001.

Comparative Assessment of Ambient Air Quality in Two Urban Areas Adjacent to Petroleum Downstream/Upstream 689
Brazilian Journal of Chemical Engineering Vol. 25, No. 04, pp. 683 - 696, October - December, 2008
0
10
20
30
40
500
45
90
135
180
225
270
315
Al-Riqa
Fahaheel
Figure 2: Annual O3 (ppb) accumulated concentration rose executed for the year 2004
for Al-Riqa and Fahaheel urban areas (Al-Ahmadi Governorate-Kuwait).
0
50
100
150
200
2500
45
90
135
180
225
270
315
NOX (ppb)NO2 (ppb)NO (ppb)
Figure 3: Annual NOx, NO2 and NO (ppb) accumulated concentration rose executed
for the year 2004 for Al-Riqa urban area (Al-Ahmadi Governorate-Kuwait).
Observed ozone levels from the north-northeast
wind sector were high due to the fact that it is nearly
undisturbed by man-made emissions, which makes
NOx minimal in the same sector (Fig.3). In both
areas, NOx (NO+NO2) were mainly blowing from
the petroleum downstream facilities side, i.e.,
Kuwait’s three refineries belt. In Al-Riqa, NOx
levels were blowing from the mentioned sector,
exceeding 200 ppb on an annual mean basis. The
Fahaheel area experienced a similar NOx behavior.
The main NOx blowing sector is the southern one,
which is occupied by the petroleum downstream
facilities. Adding to the background concentrations
resulting from the inner roads, heavy vehicle
emissions and power station emissions, the sector
emits NOx regularly from combustion sources in the
three refineries adjacent to Fahaheel. As for the other
pollutants (SO2, CO, H2S and NH3), the same
mentioned sector was the main contributor to the
bulk of the concentration rose in both years of the
study. SO2 levels detected by the concentration roses
plotted for 2004 and 2005 had reached 30 ppb from
the above mentioned sector in Fahaheel. However,
Al-Riqa concentration roses showed levels of 28 ppb
(2004) and 29 ppb (2005) from the downstream
facilities. Sulfur based components in the chemical
processes (from stacks in refineries) and
hydrodesulphurization processes and sulfur recovery
units are considered to be the main contributors from
that sector. Overworking conditions in the three
refineries of the state of Kuwait resulting from
continuous shutdowns of the smallest refinery (Al-
Shuibah refinery) because of the fourth refinery
project taking place at the moment resulted in the
above violations and sector dominance on the plotted
concentration roses. CO in Al-Riqa reached the level
of almost 1.2 ppm (2004 and 2005) and in Fahaheel
it exceeded 1.5 in 2004 and reached 1.7 in 2005.
Incomplete combustion in flaring as well as the
upstream facilities emissions (southern ones) all
result in such accumulation of CO in the ambient air.
H2S levels in 2004 and 2005 exceeded 4 ppb in
690 S. M. Al-Salem and A R. Khan
Brazilian Journal of Chemical Engineering
Fahaheel. Al-Riqa showed similar values for H2S
(3.5 in 2004 and 3.8 in 2005). NH3 exceeded 60 ppb
in both areas, resulting from the downstream
facilities sector (in both years of the study). Prilling
processes (currently replaced) were in operation at
that time (2004). With the replacement of urea
prilling, the ammonia levels were produced from the
bypass lines of the ammonia processing plant of the
Petrochemicals Industries Company (Kuwait, P.I.C.).
The CMB model developed in this study was
based on the values obtained in the months of
January and July; since both months recorded
variations of many airborne pollutants and had many
maximum readings of the concentrations of major
pollutants arising from the sources under study.
These two months were chosen to represent the two
longest seasons in Kuwait; summer and winter for
being the most severe in their meterological
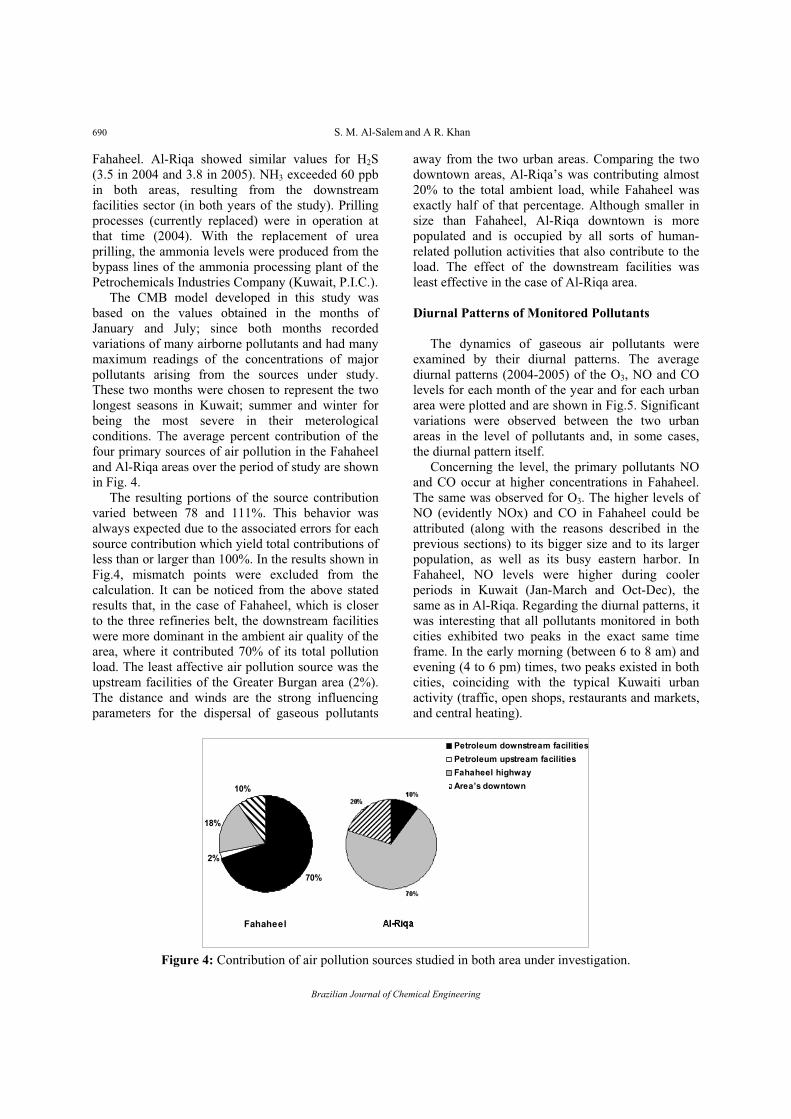
conditions. The average percent contribution of the
four primary sources of air pollution in the Fahaheel
and Al-Riqa areas over the period of study are shown
in Fig. 4.
The resulting portions of the source contribution
varied between 78 and 111%. This behavior was
always expected due to the associated errors for each
source contribution which yield total contributions of
less than or larger than 100%. In the results shown in
Fig.4, mismatch points were excluded from the
calculation. It can be noticed from the above stated
results that, in the case of Fahaheel, which is closer
to the three refineries belt, the downstream facilities
were more dominant in the ambient air quality of the
area, where it contributed 70% of its total pollution
load. The least affective air pollution source was the
upstream facilities of the Greater Burgan area (2%).
The distance and winds are the strong influencing
parameters for the dispersal of gaseous pollutants
away from the two urban areas. Comparing the two
downtown areas, Al-Riqa’s was contributing almost
20% to the total ambient load, while Fahaheel was
exactly half of that percentage. Although smaller in
size than Fahaheel, Al-Riqa downtown is more
populated and is occupied by all sorts of human-
related pollution activities that also contribute to the
load. The effect of the downstream facilities was
least effective in the case of Al-Riqa area.
Diurnal Patterns of Monitored Pollutants
The dynamics of gaseous air pollutants were
examined by their diurnal patterns. The average
diurnal patterns (2004-2005) of the O3, NO and CO
levels for each month of the year and for each urban
area were plotted and are shown in Fig.5. Significant
variations were observed between the two urban
areas in the level of pollutants and, in some cases,
the diurnal pattern itself.
Concerning the level, the primary pollutants NO
and CO occur at higher concentrations in Fahaheel.
The same was observed for O3. The higher levels of
NO (evidently NOx) and CO in Fahaheel could be
attributed (along with the reasons described in the
previous sections) to its bigger size and to its larger
population, as well as its busy eastern harbor. In
Fahaheel, NO levels were higher during cooler
periods in Kuwait (Jan-March and Oct-Dec), the
same as in Al-Riqa. Regarding the diurnal patterns, it
was interesting that all pollutants monitored in both
cities exhibited two peaks in the exact same time
frame. In the early morning (between 6 to 8 am) and
evening (4 to 6 pm) times, two peaks existed in both
cities, coinciding with the typical Kuwaiti urban
activity (traffic, open shops, restaurants and markets,
and central heating).
Fahaheel
70%
2%
18%
10%
Petroleum downstream facilities
Petroleum upstream facilities
Fahaheel highway
Area’s downtown
Figure 4: Contribution of air pollution sources studied in both area under investigation.
Comparative Assessment of Ambient Air Quality in Two Urban Areas Adjacent to Petroleum Downstream/Upstream 691
Brazilian Journal of Chemical Engineering Vol. 25, No. 04, pp. 683 - 696, October - December, 2008
Fahaheel
0
10
20
30
40
50
0 2 4 6 8 10 12 14 16 18 20 22 24Hour
Oz
on
e (
pp
b)
Al-Riqa
5
25
45
65
85
105
0 2 4 6 8 10 12 14 16 18 20 22 24
Hour
Oz
on
e (
pp
b)
0
20
40
60
80
100
120
140
160
180
200
0 2 4 6 8 10 12 14 16 18 20 22 24
Hour
NO
(p
pb
)
Jan Feb Mar
Apr May Jun
July Aug Sep
Oct Nov Dec
0
20
40
60
80
100
0 3 6 9 12 15 18 21 24Hour
NO
(p
pb
)
0
1
2
3
4
5
6
7
0 2 4 6 8 10 12 14 16 18 20 22 24
Hour
CO
(p
pm
)
0.20
0.30
0.40
0.50
0.60
0.70
0 2 4 6 8 10 12 14 16 18 20 22 24
Hour
CO
(p
pm
)
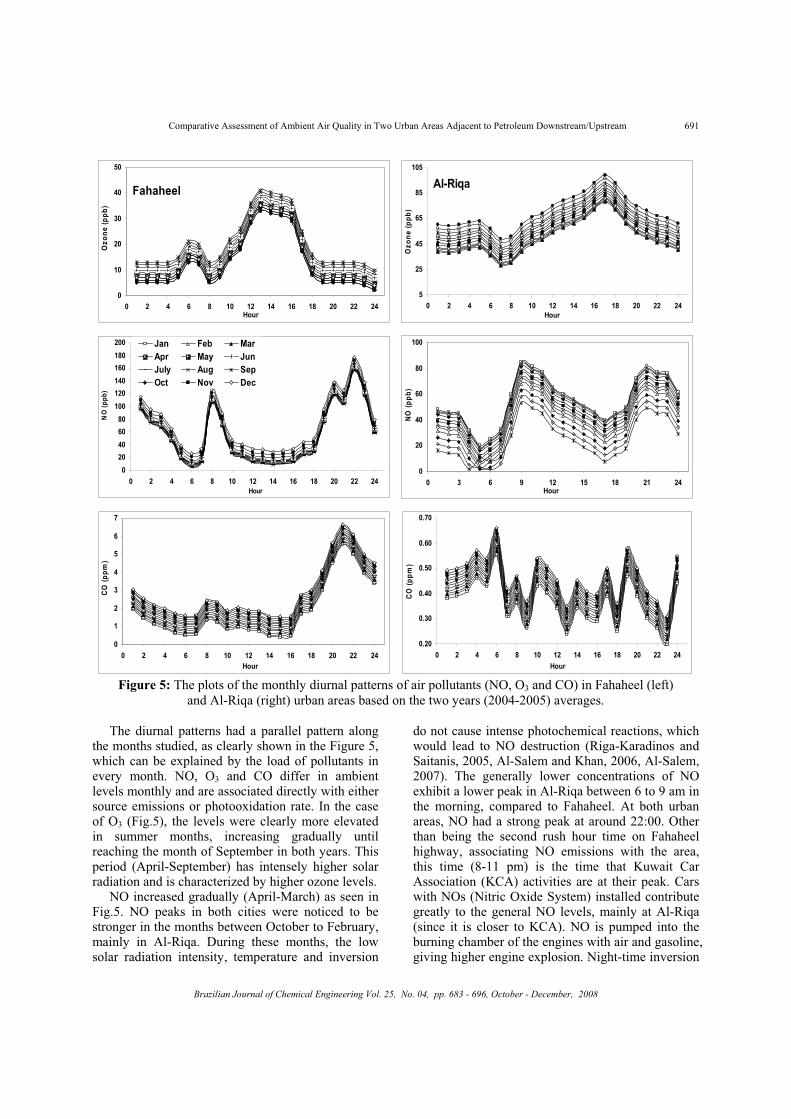
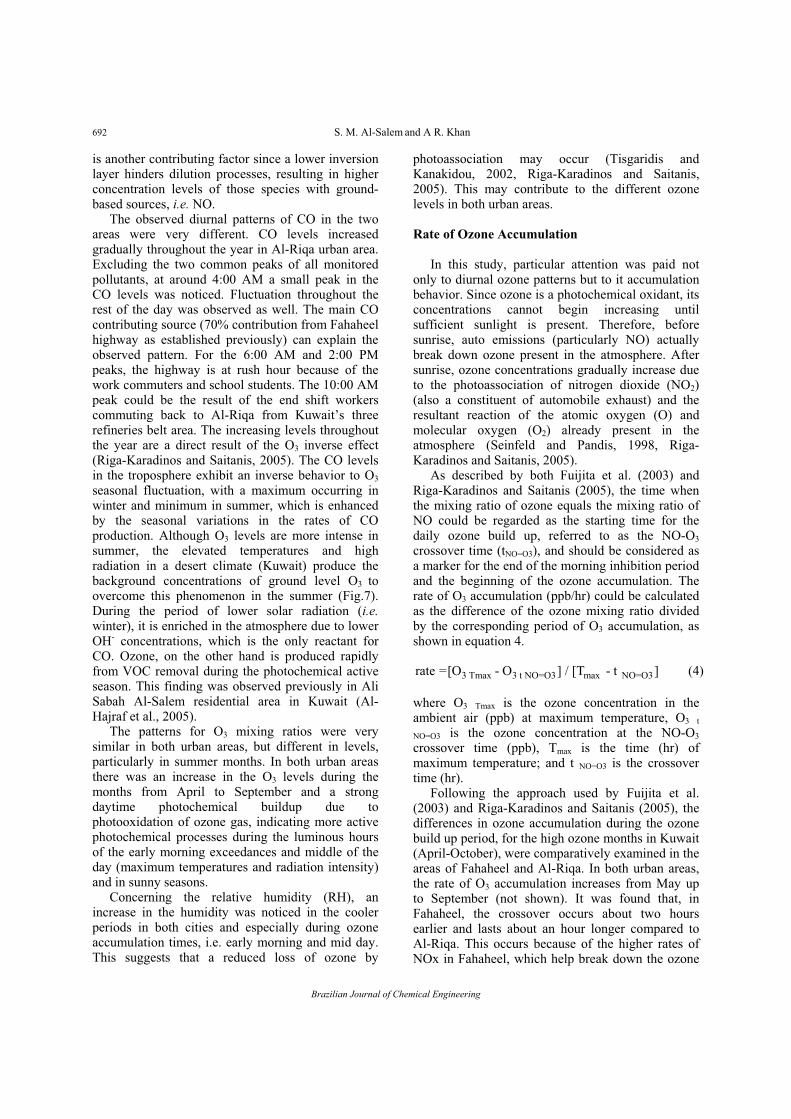
Figure 5: The plots of the monthly diurnal patterns of air pollutants (NO, O3 and CO) in Fahaheel (left)
and Al-Riqa (right) urban areas based on the two years (2004-2005) averages.
The diurnal patterns had a parallel pattern along the months studied, as clearly shown in the Figure 5, which can be explained by the load of pollutants in every month. NO, O3 and CO differ in ambient levels monthly and are associated directly with either source emissions or photooxidation rate. In the case of O3 (Fig.5), the levels were clearly more elevated in summer months, increasing gradually until reaching the month of September in both years. This period (April-September) has intensely higher solar radiation and is characterized by higher ozone levels.
NO increased gradually (April-March) as seen in Fig.5. NO peaks in both cities were noticed to be stronger in the months between October to February, mainly in Al-Riqa. During these months, the low solar radiation intensity, temperature and inversion
do not cause intense photochemical reactions, which would lead to NO destruction (Riga-Karadinos and Saitanis, 2005, Al-Salem and Khan, 2006, Al-Salem, 2007). The generally lower concentrations of NO exhibit a lower peak in Al-Riqa between 6 to 9 am in the morning, compared to Fahaheel. At both urban areas, NO had a strong peak at around 22:00. Other than being the second rush hour time on Fahaheel highway, associating NO emissions with the area, this time (8-11 pm) is the time that Kuwait Car Association (KCA) activities are at their peak. Cars with NOs (Nitric Oxide System) installed contribute greatly to the general NO levels, mainly at Al-Riqa (since it is closer to KCA). NO is pumped into the burning chamber of the engines with air and gasoline, giving higher engine explosion. Night-time inversion
692 S. M. Al-Salem and A R. Khan
Brazilian Journal of Chemical Engineering
is another contributing factor since a lower inversion layer hinders dilution processes, resulting in higher concentration levels of those species with ground-based sources, i.e. NO.
The observed diurnal patterns of CO in the two areas were very different. CO levels increased gradually throughout the year in Al-Riqa urban area. Excluding the two common peaks of all monitored pollutants, at around 4:00 AM a small peak in the CO levels was noticed. Fluctuation throughout the rest of the day was observed as well. The main CO contributing source (70% contribution from Fahaheel highway as established previously) can explain the observed pattern. For the 6:00 AM and 2:00 PM peaks, the highway is at rush hour because of the work commuters and school students. The 10:00 AM peak could be the result of the end shift workers commuting back to Al-Riqa from Kuwait’s three refineries belt area. The increasing levels throughout the year are a direct result of the O3 inverse effect (Riga-Karadinos and Saitanis, 2005). The CO levels in the troposphere exhibit an inverse behavior to O3
seasonal fluctuation, with a maximum occurring in winter and minimum in summer, which is enhanced by the seasonal variations in the rates of CO production. Although O3 levels are more intense in summer, the elevated temperatures and high radiation in a desert climate (Kuwait) produce the background concentrations of ground level O3 toovercome this phenomenon in the summer (Fig.7). During the period of lower solar radiation (i.e.winter), it is enriched in the atmosphere due to lower OH- concentrations, which is the only reactant for CO. Ozone, on the other hand is produced rapidly from VOC removal during the photochemical active season. This finding was observed previously in Ali Sabah Al-Salem residential area in Kuwait (Al-Hajraf et al., 2005).
The patterns for O3 mixing ratios were very similar in both urban areas, but different in levels, particularly in summer months. In both urban areas there was an increase in the O3 levels during the months from April to September and a strong daytime photochemical buildup due to photooxidation of ozone gas, indicating more active photochemical processes during the luminous hours of the early morning exceedances and middle of the day (maximum temperatures and radiation intensity) and in sunny seasons.
Concerning the relative humidity (RH), an increase in the humidity was noticed in the cooler periods in both cities and especially during ozone accumulation times, i.e. early morning and mid day. This suggests that a reduced loss of ozone by
photoassociation may occur (Tisgaridis and Kanakidou, 2002, Riga-Karadinos and Saitanis, 2005). This may contribute to the different ozone levels in both urban areas.
Rate of Ozone Accumulation
In this study, particular attention was paid not only to diurnal ozone patterns but to it accumulation behavior. Since ozone is a photochemical oxidant, its concentrations cannot begin increasing until sufficient sunlight is present. Therefore, before sunrise, auto emissions (particularly NO) actually break down ozone present in the atmosphere. After sunrise, ozone concentrations gradually increase due to the photoassociation of nitrogen dioxide (NO2)(also a constituent of automobile exhaust) and the resultant reaction of the atomic oxygen (O) and molecular oxygen (O2) already present in the atmosphere (Seinfeld and Pandis, 1998, Riga-Karadinos and Saitanis, 2005).
As described by both Fuijita et al. (2003) and Riga-Karadinos and Saitanis (2005), the time when the mixing ratio of ozone equals the mixing ratio of NO could be regarded as the starting time for the daily ozone build up, referred to as the NO-O3
crossover time (tNO=O3), and should be considered as a marker for the end of the morning inhibition period and the beginning of the ozone accumulation. The rate of O3 accumulation (ppb/hr) could be calculated as the difference of the ozone mixing ratio divided by the corresponding period of O3 accumulation, as shown in equation 4.
3 Tmax 3 t NO=O3 max NO=O3rate =[O - O ] / [T - t ] (4)
where O3 Tmax is the ozone concentration in the ambient air (ppb) at maximum temperature, O3 t
NO=O3 is the ozone concentration at the NO-O3
crossover time (ppb), Tmax is the time (hr) of maximum temperature; and t NO=O3 is the crossover time (hr).
Following the approach used by Fuijita et al. (2003) and Riga-Karadinos and Saitanis (2005), the differences in ozone accumulation during the ozone build up period, for the high ozone months in Kuwait (April-October), were comparatively examined in the areas of Fahaheel and Al-Riqa. In both urban areas, the rate of O3 accumulation increases from May up to September (not shown). It was found that, in Fahaheel, the crossover occurs about two hours earlier and lasts about an hour longer compared to Al-Riqa. This occurs because of the higher rates of NOx in Fahaheel, which help break down the ozone
Comparative Assessment of Ambient Air Quality in Two Urban Areas Adjacent to Petroleum Downstream/Upstream 693
Brazilian Journal of Chemical Engineering Vol. 25, No. 04, pp. 683 - 696, October - December, 2008
at ground level but still cannot lower its levels to those of Al-Riqa because of the initial high ozone levels existing in the area’s lower atmosphere.
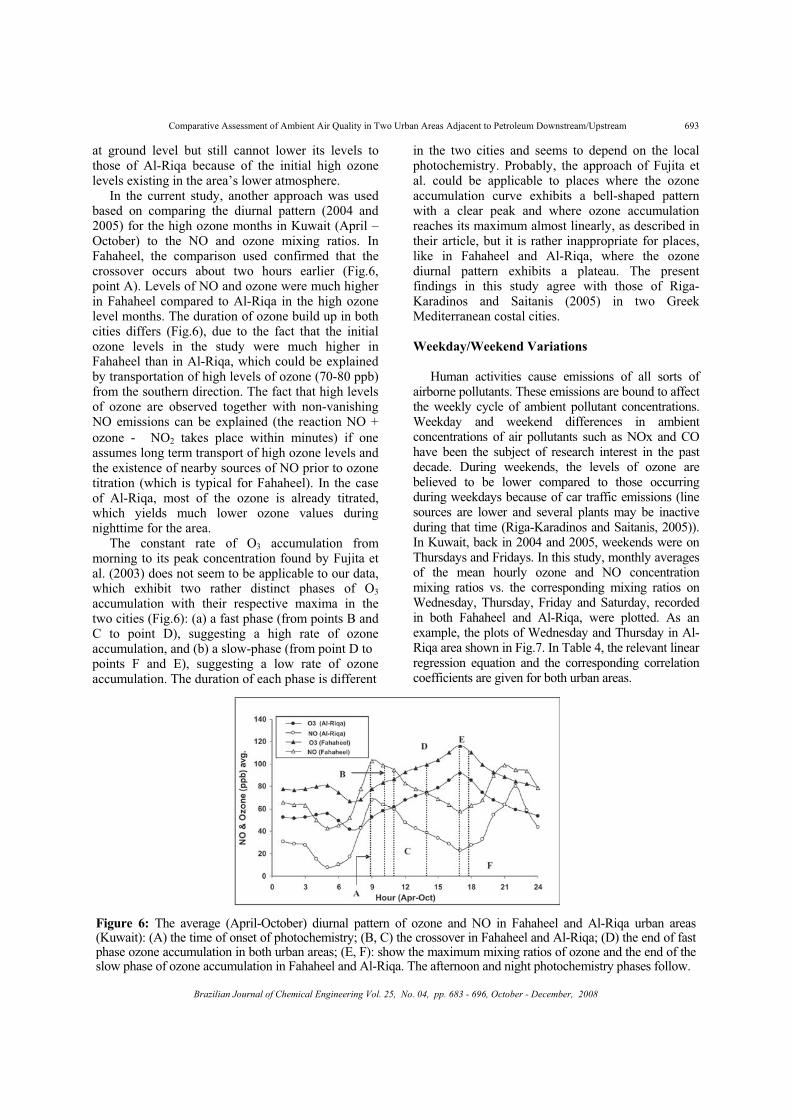
In the current study, another approach was used based on comparing the diurnal pattern (2004 and 2005) for the high ozone months in Kuwait (April – October) to the NO and ozone mixing ratios. In Fahaheel, the comparison used confirmed that the crossover occurs about two hours earlier (Fig.6, point A). Levels of NO and ozone were much higher in Fahaheel compared to Al-Riqa in the high ozone level months. The duration of ozone build up in both cities differs (Fig.6), due to the fact that the initial ozone levels in the study were much higher in Fahaheel than in Al-Riqa, which could be explained by transportation of high levels of ozone (70-80 ppb) from the southern direction. The fact that high levels of ozone are observed together with non-vanishing NO emissions can be explained (the reaction NO +
ozone NO2 takes place within minutes) if one assumes long term transport of high ozone levels and the existence of nearby sources of NO prior to ozone titration (which is typical for Fahaheel). In the case of Al-Riqa, most of the ozone is already titrated, which yields much lower ozone values during nighttime for the area.
The constant rate of O3 accumulation from morning to its peak concentration found by Fujita et al. (2003) does not seem to be applicable to our data, which exhibit two rather distinct phases of O3
accumulation with their respective maxima in the two cities (Fig.6): (a) a fast phase (from points B and C to point D), suggesting a high rate of ozone accumulation, and (b) a slow-phase (from point D to points F and E), suggesting a low rate of ozone accumulation. The duration of each phase is different
in the two cities and seems to depend on the local photochemistry. Probably, the approach of Fujita et al. could be applicable to places where the ozone accumulation curve exhibits a bell-shaped pattern with a clear peak and where ozone accumulation reaches its maximum almost linearly, as described in their article, but it is rather inappropriate for places, like in Fahaheel and Al-Riqa, where the ozone diurnal pattern exhibits a plateau. The present findings in this study agree with those of Riga-Karadinos and Saitanis (2005) in two Greek Mediterranean costal cities.
Weekday/Weekend Variations
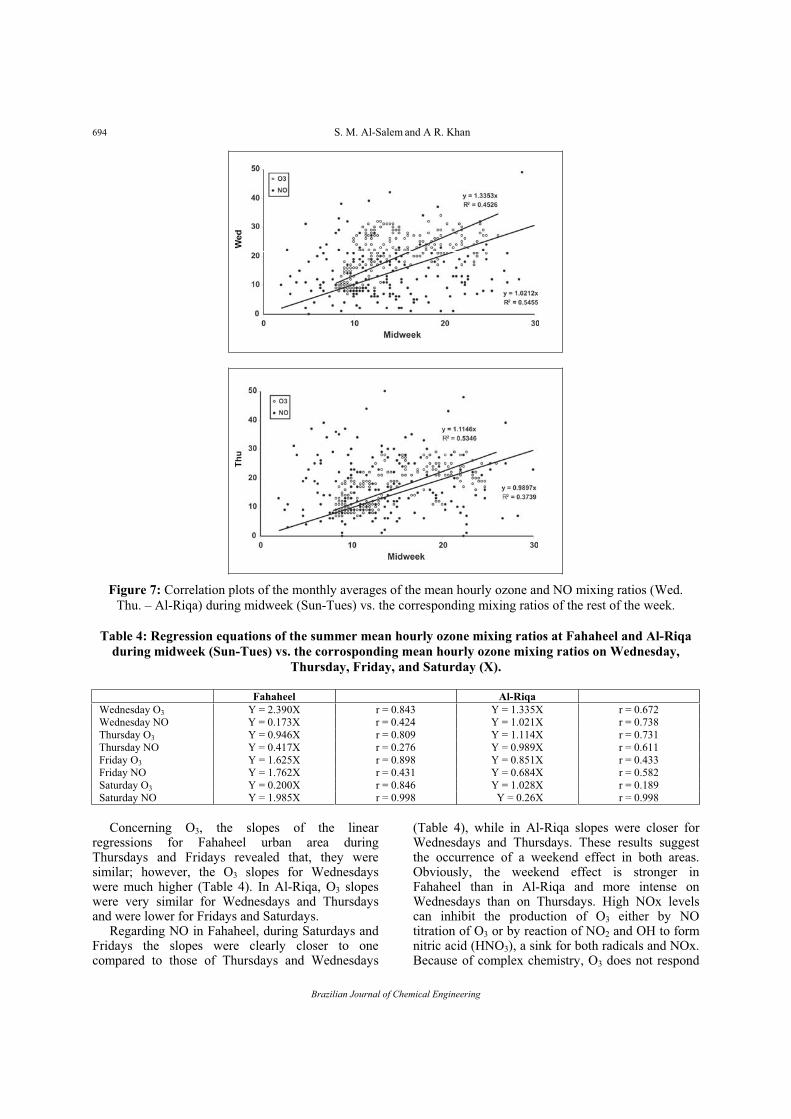
Human activities cause emissions of all sorts of airborne pollutants. These emissions are bound to affect the weekly cycle of ambient pollutant concentrations. Weekday and weekend differences in ambient concentrations of air pollutants such as NOx and CO have been the subject of research interest in the past decade. During weekends, the levels of ozone are believed to be lower compared to those occurring during weekdays because of car traffic emissions (line sources are lower and several plants may be inactive during that time (Riga-Karadinos and Saitanis, 2005)). In Kuwait, back in 2004 and 2005, weekends were on Thursdays and Fridays. In this study, monthly averages of the mean hourly ozone and NO concentration mixing ratios vs. the corresponding mixing ratios on Wednesday, Thursday, Friday and Saturday, recorded in both Fahaheel and Al-Riqa, were plotted. As an example, the plots of Wednesday and Thursday in Al-Riqa area shown in Fig.7. In Table 4, the relevant linear regression equation and the corresponding correlation coefficients are given for both urban areas.
Figure 6: The average (April-October) diurnal pattern of ozone and NO in Fahaheel and Al-Riqa urban areas (Kuwait): (A) the time of onset of photochemistry; (B, C) the crossover in Fahaheel and Al-Riqa; (D) the end of fast phase ozone accumulation in both urban areas; (E, F): show the maximum mixing ratios of ozone and the end of the slow phase of ozone accumulation in Fahaheel and Al-Riqa. The afternoon and night photochemistry phases follow.
694 S. M. Al-Salem and A R. Khan
Brazilian Journal of Chemical Engineering
Figure 7: Correlation plots of the monthly averages of the mean hourly ozone and NO mixing ratios (Wed.
Thu. – Al-Riqa) during midweek (Sun-Tues) vs. the corresponding mixing ratios of the rest of the week.
Table 4: Regression equations of the summer mean hourly ozone mixing ratios at Fahaheel and Al-Riqa
during midweek (Sun-Tues) vs. the corrosponding mean hourly ozone mixing ratios on Wednesday,
Thursday, Friday, and Saturday (X).
Fahaheel Al-Riqa
Wednesday O3 Y = 2.390X r = 0.843 Y = 1.335X r = 0.672
Wednesday NO Y = 0.173X r = 0.424 Y = 1.021X r = 0.738
Thursday O3 Y = 0.946X r = 0.809 Y = 1.114X r = 0.731
Thursday NO Y = 0.417X r = 0.276 Y = 0.989X r = 0.611
Friday O3 Y = 1.625X r = 0.898 Y = 0.851X r = 0.433
Friday NO Y = 1.762X r = 0.431 Y = 0.684X r = 0.582
Saturday O3 Y = 0.200X r = 0.846 Y = 1.028X r = 0.189
Saturday NO Y = 1.985X r = 0.998 Y = 0.26X r = 0.998
Concerning O3, the slopes of the linear regressions for Fahaheel urban area during Thursdays and Fridays revealed that, they were similar; however, the O3 slopes for Wednesdays were much higher (Table 4). In Al-Riqa, O3 slopes were very similar for Wednesdays and Thursdays and were lower for Fridays and Saturdays.
Regarding NO in Fahaheel, during Saturdays and Fridays the slopes were clearly closer to one compared to those of Thursdays and Wednesdays
(Table 4), while in Al-Riqa slopes were closer for Wednesdays and Thursdays. These results suggest the occurrence of a weekend effect in both areas. Obviously, the weekend effect is stronger in Fahaheel than in Al-Riqa and more intense on Wednesdays than on Thursdays. High NOx levels can inhibit the production of O3 either by NO titration of O3 or by reaction of NO2 and OH to form nitric acid (HNO3), a sink for both radicals and NOx. Because of complex chemistry, O3 does not respond
Comparative Assessment of Ambient Air Quality in Two Urban Areas Adjacent to Petroleum Downstream/Upstream 695
Brazilian Journal of Chemical Engineering Vol. 25, No. 04, pp. 683 - 696, October - December, 2008
linearly to the levels of precursors. In NOx sensitive regions (i.e. abundant VOCs relative to NOx), O3
decreases more rapidly with reductions in NOx emissions than with reductions in VOCs. In VOCs-sensitive regions (i.e. abundant NOx relative to VOCs) a decrease in NOx emissions may cause an increase in O3 because of reduced titration or reduced formation of HNO3. Locations where ozone increases during weekends, but NOx emissions are significantly lower, should be considered VOCs-limited (Blanchard and Tanenbaum, 2003, Riga-Karadinos and Saitanis, 2005). Thus, the increase of O3 levels during weekends in both urban areas suggests that both cities may be VOCs-sensitive. The reduction of anthropogenic emissions during weekends is expected to reduce proportionately equally anthropogenic VOCs (AVOCs)
In addition to the above-discussed role of VOCs in the ‘‘weekend effect’’, it is the low early morning rush-hour traffic on weekends that allows ozone concentrations to begin rising from a significantly higher concentration and therefore reaching higher overall weekend concentrations. Different studies demonstrate a wide range in the weekday/weekend O3 behavior: a little variation among weekdays, but Saturdays and Sundays (which corresponded to Thursdays and Fridays in Kuwait at that time) having higher O3, with Sundays having the highest levels in and around major cities such as Los Angeles and San Francisco (US), or Paratas and Volos (Greece). On the other hand, in many other sites the weekday and weekend O3 concentrations are approximately equal (Fujita et al., 2003; Heuss et al.,2003). Marr and Harley (2002) suggest that NOx concentrations are consistently lower on weekends relative to weekdays by approximately 30–40%, while VOC changes are less pronounced (<10%). The explanation of weekday/weekend variation, due to NOx reduction, is supported by a wide range of analyses of ambient air data and several photochemical studies. Changes in the timing and location of emissions and meteorological factors play smaller roles in weekend O3 behavior (Heuss et al., 2003). Analysis of ambient air quality data and emissions forecasts for weekdays and weekends may improve considerably our understanding of the effects of control strategies and of future changes in emissions on future ambient O3 concentrations.
CONCLUSION
Synoptically, the primary pollutants NO, CO, H2Sand SO2 occurred at higher levels in Fahaheel than in Al-Riqa. Concerning the exceedances of the pollutants monitored, in terms of human health
regulations in Fahaheel and Al-Riqa, the number of exceedances of the gaseous pollutants were much higher in Fahaheel. A Chemical Mass Balance (CMB) model was established around both receptor points, i.e. polyclinics. This model revealed that, in the case of Fahaheel, petroleum downstream facilities were the main contributor to the ambient load, while in Al-Riqa urban area, Fahaheel highway was the main contributor to the ambient load of pollutants. Examination of O3 accumulation rate from April to October revealed two phases: a fast and a slow one, with different durations in each of the two cities due to different levels of precursors and to different local photochemistry. A strong weekend effect was observed in Fahaheel, but less intense in Al-Riqa. Both urban areas seem to be VOCs limited. The causes of the weekend O3 effect were probably the weekend/weekday differences in NOx emissions and the complex non-linear photochemistry of ozone. The relatively lower NO and NO2 concentrations on weekends result in less OH radical loss and more O3 formation. Lower NOx emissions on weekends decrease NO titration of the O3 newly formed at the surface and the ozone transported from aloft. The data of this study would be useful for future comparisons. It is obvious that, for future air quality management strategies, the development of accurate, temporally and spatially resolved day-of-the-week emission inventories, including separate inventories for weekends can promote a better understanding. Regarding the role of local agencies involved in making air quality conditions better in urban living locations, the Kuwait Environment Public Authority (KUEPA) must enforce their rules and regulations of the industrial sectors around urban areas. Emissions from upstream and downstream industries cause a number of problems in the general population regarding human health and welfare. The Kuwait Public Authority of Industry (KUPAI), must monitor the activities of small industries and their role in contributing to the general pollution load around urban areas in the state.
REFERENCES
Al-Bassam, E. and Khan, A., Air pollution and road traffic in Kuwait, In Proc Urban Transport X, Urban Transport and the Environment in the 21st Century, Edited by C. A. Brebbia and L. C. Wadha, WIT Press, Ashurst Lodge, Southampton SO40 7AA, UK, 19th-24th May, Dresden, Germany, 741 (2004).
Al-Hajraf, S, Al-Ajmi, D, Khan, A., Tang, H., Wahner, A., Klemp, D., Air Quality Assessment of Ali
696 S. M. Al-Salem and A R. Khan
Brazilian Journal of Chemical Engineering
Sabah Al-Salem Urban Community, KISR Report no. EC031C (2005).
Al-Salem, S. and Al-Fadhlee, A., Ambient levels of primary and secondary pollutants in a residential area: population risk and hazard index calculation over a three years study period, American Journal of Environmental Sciences, 3, 244 (2007).
Al-Salem, S. M. and Bouhamrah, W. S., Ambient concentrations of benzene and other VOC's At typical industrial sites in Kuwait and their cancer risk assessment, Research Journal of Chemistry and Environment,,10, 42 (2006).
Al-Salem, S. M. and Khan, A. R., Methane dispersion modeling and source determination around urban areas in Kuwait, In Proc 1st
International Conference and Exhibition on Green Industry, Bahrain, 20th – 22nd November(2006).
Al-Salem, S. M. S., Methane dispersion modelling and source determination around Fahaheel urban area, M.Sc. Thesis, Chemical Engineering Program, College of Graduate Studies, Kuwait University (2007).
Blanchard, C. L. and Tanenbaum, S. J., Differences between weekday and weekend air pollutant levels in southern California, Journal of Air and Waste Management Association, 53, 816 (2003).
Brunekreef B. and Holtage S.T., Air pollution and health, The Lancet, 360, 1233 (2002).
Christensen, W. F., Chemical mass balance analysis of air quality data when unknown pollution sources are present, Atmospheric Environment, 38, 4305 (2004).
Christensen, W. F. and Gunst, R.F., Measurement error models in chemical mass balance analysis of air quality data, Atmospheric Environment, 38, 733 (2004).
EEA, 2003. Exposure of population to exceedances of EU air quality standards, Available online at: http://themes.eea.eu.int/indicators/all_indicators_box, (2002).
Fujita, E. M., Stockwell, W. R., Campbell, D.E., Keisler, R.E., Lawson, D.R., Evolution of the magnitude and spatial extent of the weekend ozone effect in California’s south coast air basin, 1981-2000, Journal of Air and Waste Management Association, 53, 802 (2003).
Heuss, J. M., Kahlbaum, D. F., Wol, G. T., Weekday/weekend ozone differences: what can we learn from them? Journal of Air and Waste Management Association, 53, 772 (2003).
Khan, A. and Al-Salem, S., Primary and secondary pollutants monitoring around an urban area in the
state of Kuwait: A three years study, Research Journal of Chemistry and Environment, 11, 77 (2007a).
Khan, A. and Al-Salem, S., Seasonal variation effect on airborne pollutants in an urban area of the state of Kuwait, Journal of Environmental Research and Development, 1, 215 (2007b).
KUEPA rules & regulations, Kuwait Al-Youm Appendix 533, KWT Gov. Press, law 210/2001, (2001).
Marr, L. and Harley, R. A., Spectral analysis of weekday– weekend differences in ambient ozone, nitrogen oxide and non-methane hydrocarbons time series in California. Atmospheric Environment, 36, 2327 (2002).
Matsumoto K., Naggo I., Tanaka H., Miyaji H., Iida K., Ikebe Y., Seasonal characteristics of organic and inorganic species and their size distribution in atmospheric aerosols over the northwest Pacific ocean, Atmospheric Environment, 32, 1931 (1998).
Monn, C. and Shaeppi, G., Concentrations of total suspended particulates, fine particles and their anionic compounds in ambient air and indoor air, Environmental Technology, 14, 869 (1993).
Nali, C., Pucciariello, C., Lorenzini, G., Ozone distribution in central Italy and its effects on crops productivity, Agriculture Ecosystem and the Environment, 90, 277 (2002).
Ozeki, Toru, Ihara Toshihiro and Ogawa Nobuaki, Study of pollutants in precipitation (rain and snow) transported long distance to west coast of Japan islands using oblique rotational factor analysis with partially non-negative constraint, Chemometrics and intelligent laboratory systems,82, 15 (2006).
Riga-Karandinos, A. N. and Saitanis, C., Comparative assessment of ambient air quality in two typical Mediterranean costal cities in Greece, Chemosphere, 59, 1125 (2005).
Saitanis, C. J., Riga-Karandinos A. N., Karandinos M.G., Effects of ozone on chlorophyll and quantum yield of tobacco (Nicotiana tabacum L.) varieties, Chemosphere, 42, 945 (2001).
Seinfeld, J. and Pandis, S., Atmospheric chemistry and physics: From Air Pollution to Climate Change, Wiley Intersciences, 1st edition, New York (1998).
Tisgaridis, K. and Kanakidou, M., Importance of volatile organic compounds photochemistry over a forested area in central Greece, Atmospheric Environment, 36, 3137 (2002).