Embed Size (px)
Citation preview
Comparative Analysis of Two Companies from FMCG Sector
1. Godrej Consumer Products Ltd2. Marico Industries Ltd.
1. Overview of FMCG Sector
2. FMCG – SWOT Analysis
3. Brief Introduction – GCPL
4. Brief Introduction – Marico
5. Capacities, Production and Products – GCPL
6. Capacities, Production and Products – Marico
7. Profit & Loss Analysis – GCPL
8. Profit & Loss Analysis - Marico
9. Balance Sheet Analysis – GCPL
10. Balance Sheet Analysis – Marico
11. Salient Features – GCPL
12. Salient Features - Marico
13. Comparative Ratio Analysis
14. Conclusion
Index
FMCG Sector Overview
• Fourth largest sector in the Indian economy
Principal constituents : Household Care, Personal Care and Food & Beverages.
• Anticipated Growth : Rs1.25 lakh crore in 2008 to Rs 4.5 lakh crore by 2018 ( Source : FICCI )
• 300 million people will move up from rural poor to rural lower middle class by 2025. ( Source : GCPL Annual Report )
• Well established distribution network, low penetration levels, low operating cost & per capita consumption.
• Intense competition between the organized and unorganized segments.
• Growth in the FMCG continues inspite of recession
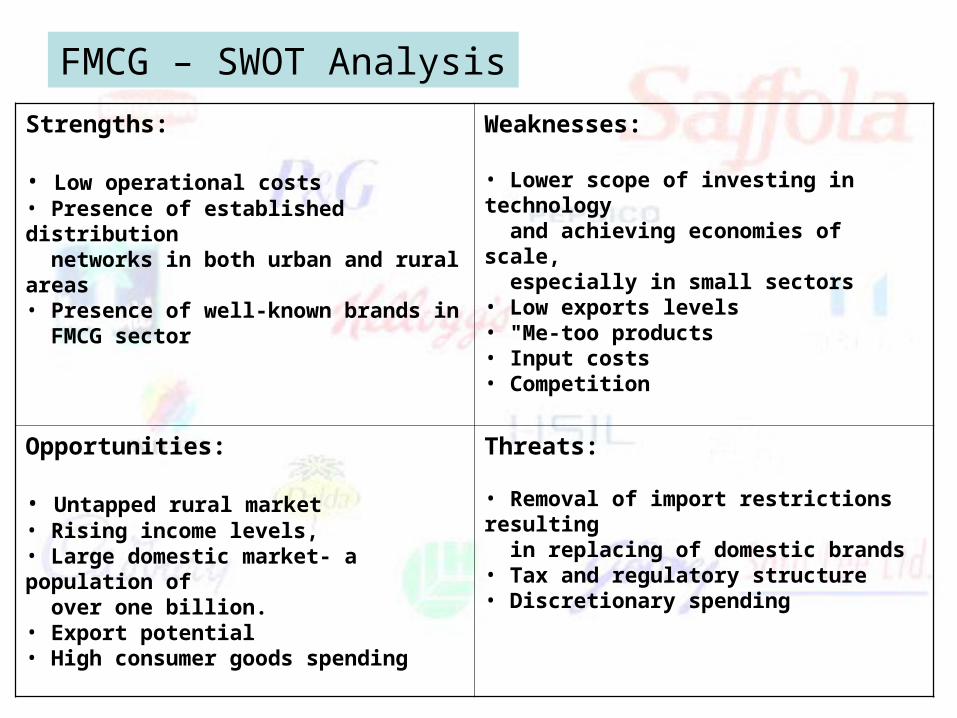
FMCG – SWOT Analysis
Strengths:
• Low operational costs• Presence of established distribution networks in both urban and rural areas• Presence of well-known brands in FMCG sector
Weaknesses:
• Lower scope of investing in technology and achieving economies of scale, especially in small sectors• Low exports levels• "Me-too products• Input costs • Competition
Opportunities:
• Untapped rural market• Rising income levels, • Large domestic market- a population of over one billion.• Export potential• High consumer goods spending
Threats:
• Removal of import restrictions resulting in replacing of domestic brands• Tax and regulatory structure• Discretionary spending
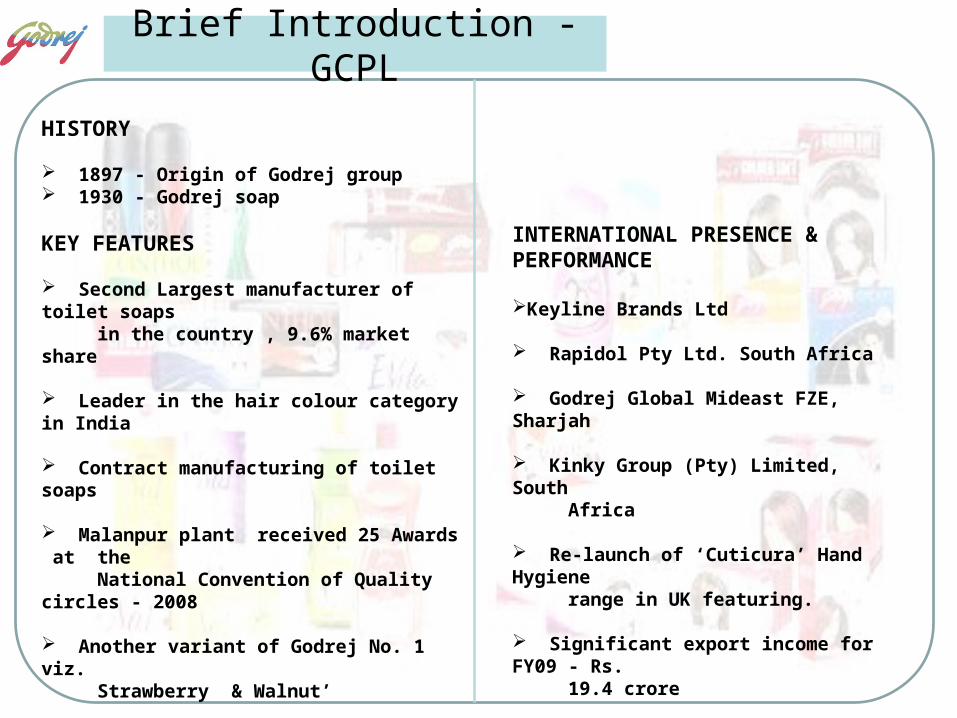
HISTORY
1897 - Origin of Godrej group 1930 - Godrej soap
KEY FEATURES
Second Largest manufacturer of toilet soaps in the country , 9.6% market share
Leader in the hair colour category in India
Contract manufacturing of toilet soaps
Malanpur plant received 25 Awards at the National Convention of Quality circles - 2008
Another variant of Godrej No. 1 viz. Strawberry & Walnut’
Re-launch of Godrej Fair-glow, Cinthol.
INTERNATIONAL PRESENCE & PERFORMANCE
Keyline Brands Ltd
Rapidol Pty Ltd. South Africa
Godrej Global Mideast FZE, Sharjah
Kinky Group (Pty) Limited, South Africa
Re-launch of ‘Cuticura’ Hand Hygiene range in UK featuring. Significant export income for FY09 - Rs. 19.4 crore
Brief Introduction - GCPL
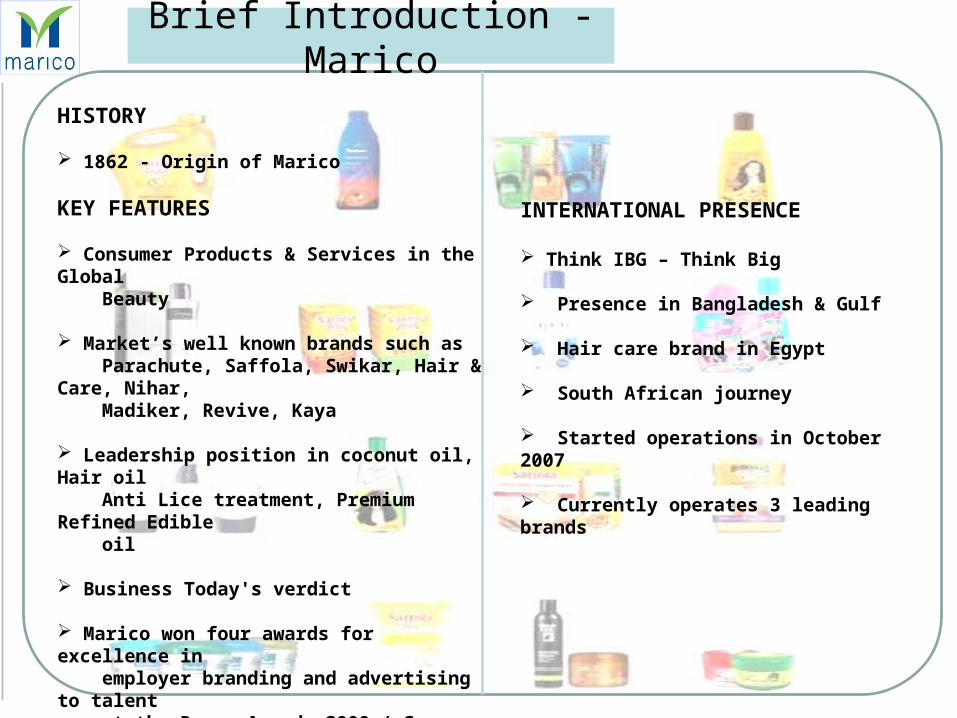
HISTORY
1862 - Origin of Marico
KEY FEATURES
Consumer Products & Services in the Global Beauty
Market’s well known brands such as Parachute, Saffola, Swikar, Hair & Care, Nihar, Madiker, Revive, Kaya
Leadership position in coconut oil, Hair oil Anti Lice treatment, Premium Refined Edible oil
Business Today's verdict
Marico won four awards for excellence in employer branding and advertising to talent at the Remmy Awards 2009 ( Source – Company website )
IMC Ramakrishna Bajaj National Quality Award in the manufacturing category
INTERNATIONAL PRESENCE
Think IBG – Think Big
Presence in Bangladesh & Gulf
Hair care brand in Egypt
South African journey
Started operations in October 2007
Currently operates 3 leading brands
Brief Introduction - Marico
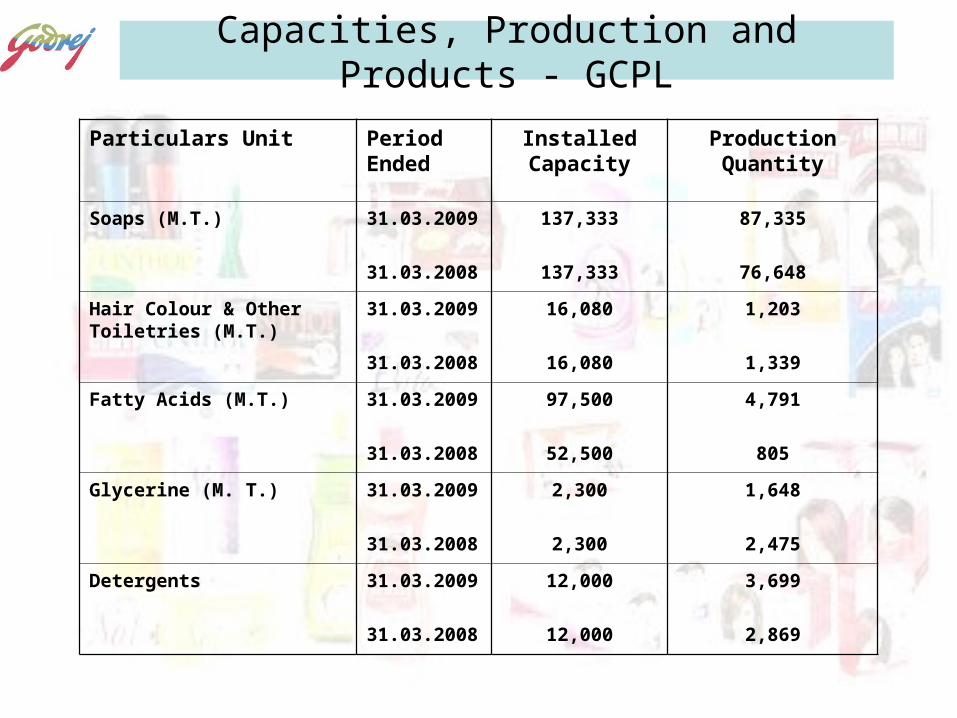
Capacities, Production and Products - GCPL
Particulars Unit Period Ended
Installed Capacity
Production Quantity
Soaps (M.T.) 31.03.2009
31.03.2008
137,333
137,333
87,335
76,648
Hair Colour & Other Toiletries (M.T.)
31.03.2009
31.03.2008
16,080
16,080
1,203
1,339
Fatty Acids (M.T.) 31.03.2009
31.03.2008
97,500
52,500
4,791
805
Glycerine (M. T.) 31.03.2009
31.03.2008
2,300
2,300
1,648
2,475
Detergents 31.03.2009
31.03.2008
12,000
12,000
3,699
2,869
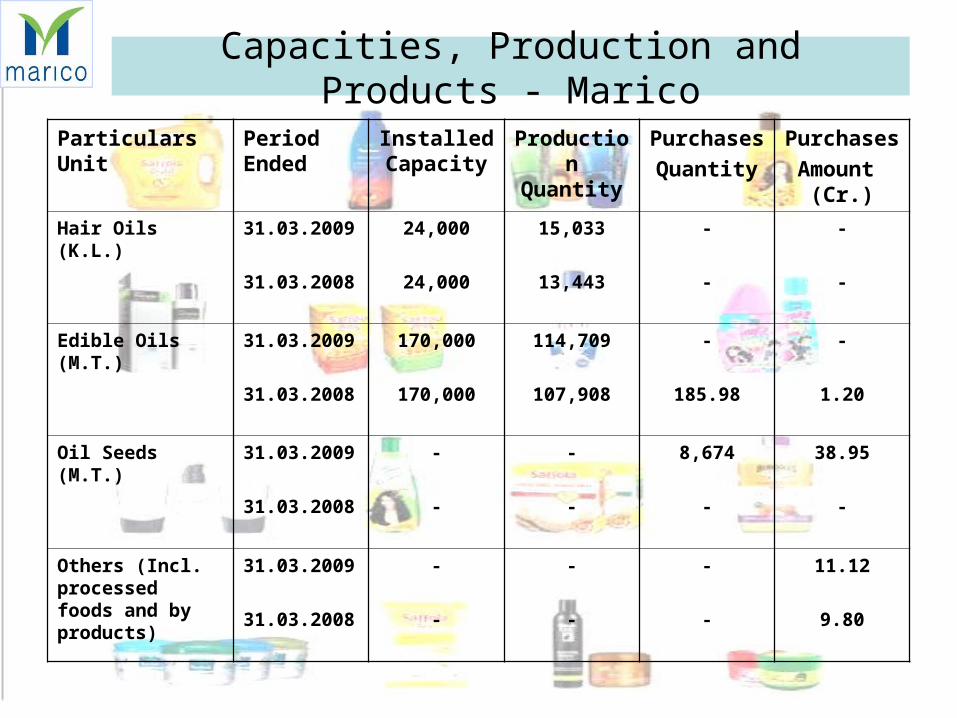
Particulars Unit Period Ended
Installed Capacity
Production Quantity
Purchases
Quantity
Purchases
Amount (Cr.)
Hair Oils (K.L.) 31.03.2009
31.03.2008
24,000
24,000
15,033
13,443
-
-
-
-
Edible Oils (M.T.) 31.03.2009
31.03.2008
170,000
170,000
114,709
107,908
-
185.98
-
1.20
Oil Seeds (M.T.) 31.03.2009
31.03.2008
-
-
-
-
8,674
-
38.95
-
Others (Incl. processed foods and by products)
31.03.2009
31.03.2008
-
-
-
-
-
-
11.12
9.80
Capacities, Production and Products - Marico
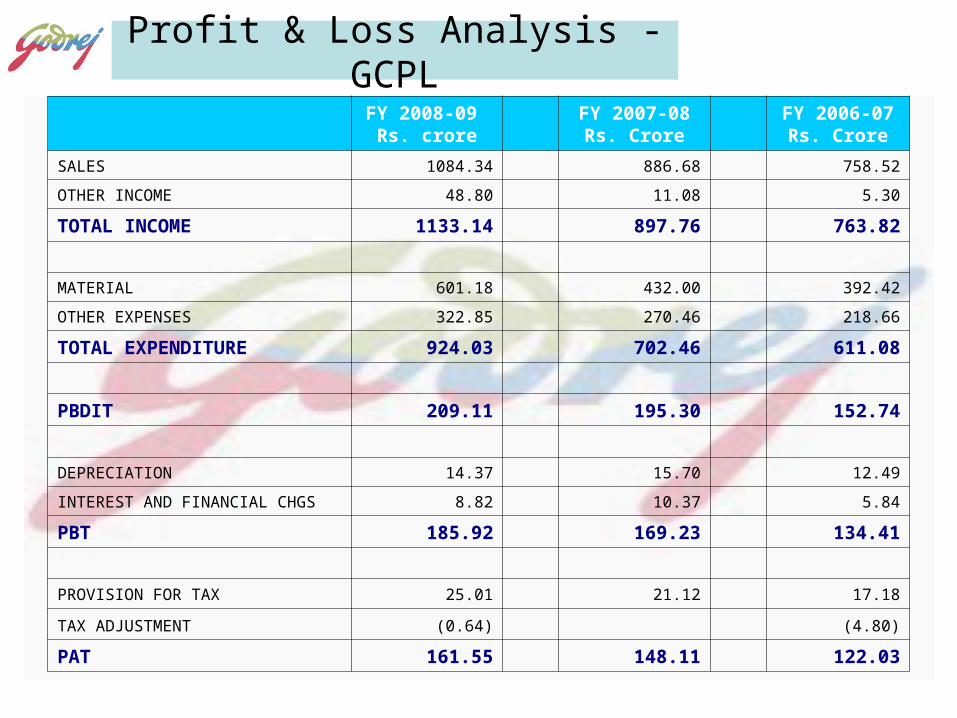
Profit & Loss Analysis - GCPL
FY 2008-09 Rs. crore
FY 2007-08Rs. Crore
FY 2006-07Rs. Crore
SALES 1084.34 886.68 758.52
OTHER INCOME 48.80 11.08 5.30
TOTAL INCOME 1133.14 897.76 763.82
MATERIAL 601.18 432.00 392.42
OTHER EXPENSES 322.85 270.46 218.66
TOTAL EXPENDITURE 924.03 702.46 611.08
PBDIT 209.11 195.30 152.74
DEPRECIATION 14.37 15.70 12.49
INTEREST AND FINANCIAL CHGS 8.82 10.37 5.84
PBT 185.92 169.23 134.41
PROVISION FOR TAX 25.01 21.12 17.18
TAX ADJUSTMENT (0.64) (4.80)
PAT 161.55 148.11 122.03
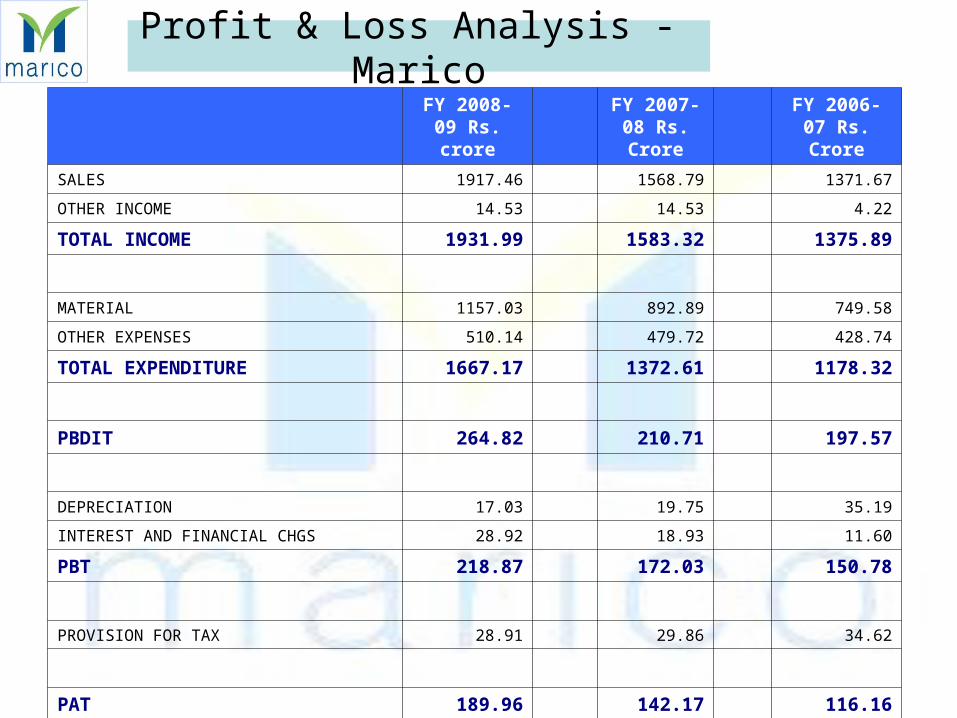
Profit & Loss Analysis - Marico
FY 2008-09 Rs. crore
FY 2007-08 Rs. Crore
FY 2006-07 Rs. Crore
SALES 1917.46 1568.79 1371.67
OTHER INCOME 14.53 14.53 4.22
TOTAL INCOME 1931.99 1583.32 1375.89
MATERIAL 1157.03 892.89 749.58
OTHER EXPENSES 510.14 479.72 428.74
TOTAL EXPENDITURE 1667.17 1372.61 1178.32
PBDIT 264.82 210.71 197.57
DEPRECIATION 17.03 19.75 35.19
INTEREST AND FINANCIAL CHGS 28.92 18.93 11.60
PBT 218.87 172.03 150.78
PROVISION FOR TAX 28.91 29.86 34.62
PAT 189.96 142.17 116.16
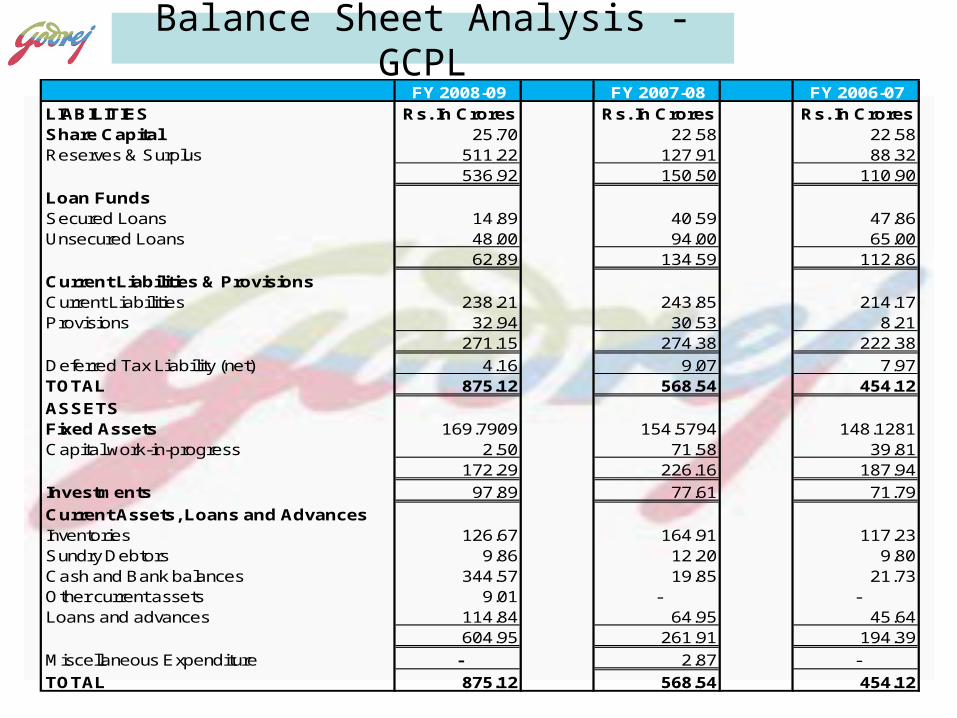
FY 2008-09 FY 2007-08 FY 2006-07LIABILITIES Rs. In Crores Rs. In Crores Rs. In CroresShare Capital 25.70 22.58 22.58Reserves & Surplus 511.22 127.91 88.32
536.92 150.50 110.90
Loan FundsSecured Loans 14.89 40.59 47.86Unsecured Loans 48.00 94.00 65.00
62.89 134.59 112.86
Current Liabilities & ProvisionsCurrent Liabilities 238.21 243.85 214.17Provisions 32.94 30.53 8.21
271.15 274.38 222.38
Deferred Tax Liability (net) 4.16 9.07 7.97TOTAL 875.12 568.54 454.12
ASSETSFixed Assets 169.7909 154.5794 148.1281Capital work-in-progress 2.50 71.58 39.81
172.29 226.16 187.94
Investments 97.89 77.61 71.79
Current Assets, Loans and AdvancesInventories 126.67 164.91 117.23Sundry Debtors 9.86 12.20 9.80Cash and Bank balances 344.57 19.85 21.73Other current assets 9.01 - -Loans and advances 114.84 64.95 45.64
604.95 261.91 194.39
Miscellaneous Expenditure - 2.87 -
TOTAL 875.12 568.54 454.12
Balance Sheet Analysis - GCPL
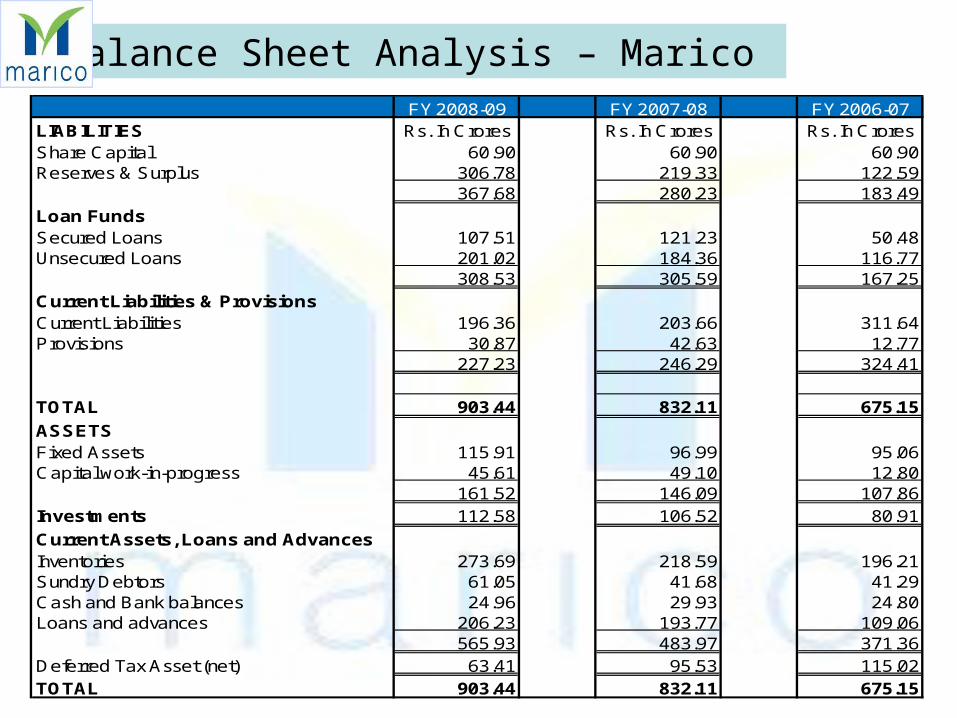
FY 2008-09 FY 2007-08 FY 2006-07LIABILITIES Rs. In Crores Rs. In Crores Rs. In CroresShare Capital 60.90 60.90 60.90Reserves & Surplus 306.78 219.33 122.59
367.68 280.23 183.49Loan FundsSecured Loans 107.51 121.23 50.48Unsecured Loans 201.02 184.36 116.77
308.53 305.59 167.25Current Liabilities & ProvisionsCurrent Liabilities 196.36 203.66 311.64Provisions 30.87 42.63 12.77
227.23 246.29 324.41
TOTAL 903.44 832.11 675.15
ASSETSFixed Assets 115.91 96.99 95.06Capital work-in-progress 45.61 49.10 12.80
161.52 146.09 107.86Investments 112.58 106.52 80.91
Current Assets, Loans and AdvancesInventories 273.69 218.59 196.21Sundry Debtors 61.05 41.68 41.29Cash and Bank balances 24.96 29.93 24.80Loans and advances 206.23 193.77 109.06
565.93 483.97 371.36Deferred Tax Asset (net) 63.41 95.53 115.02TOTAL 903.44 832.11 675.15
Balance Sheet Analysis – Marico
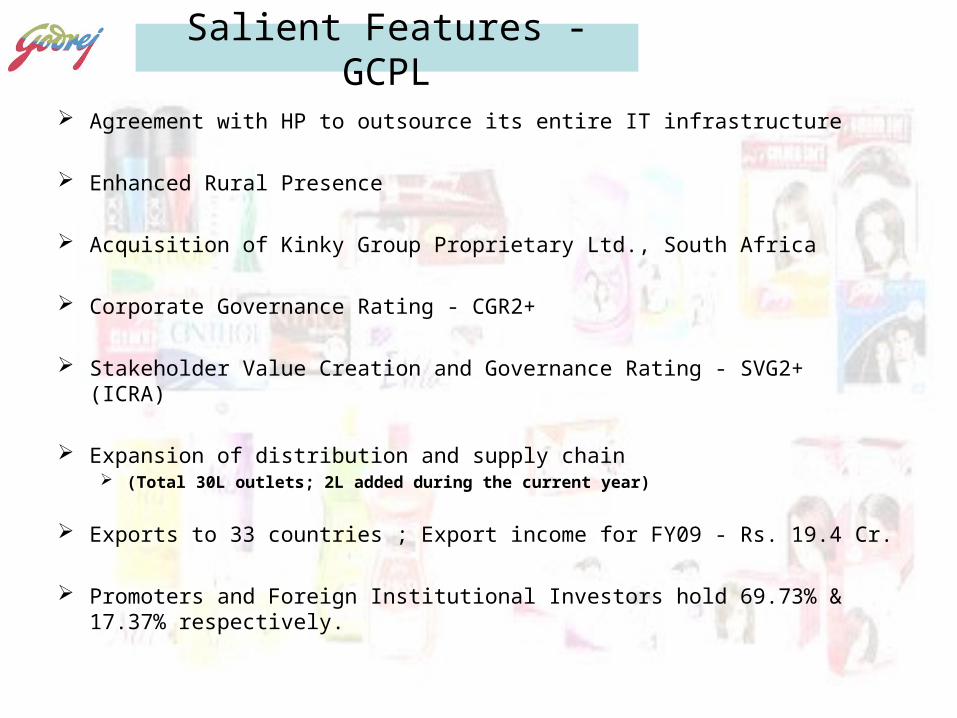
Salient Features - GCPL
Agreement with HP to outsource its entire IT infrastructure
Enhanced Rural Presence
Acquisition of Kinky Group Proprietary Ltd., South Africa
Corporate Governance Rating - CGR2+
Stakeholder Value Creation and Governance Rating - SVG2+ (ICRA)
Expansion of distribution and supply chain (Total 30L outlets; 2L added during the current year)
Exports to 33 countries ; Export income for FY09 - Rs. 19.4 Cr.
Promoters and Foreign Institutional Investors hold 69.73% & 17.37% respectively.
Salient Features - Marico
ROCE - above 25% over the last 10 years.
Parachute - world's largest packaged coconut oil brand.
Kaya - over 80 clinics in India and The Middle East.
Retail outlets – 20L
Consumer packs per month – 70 L.
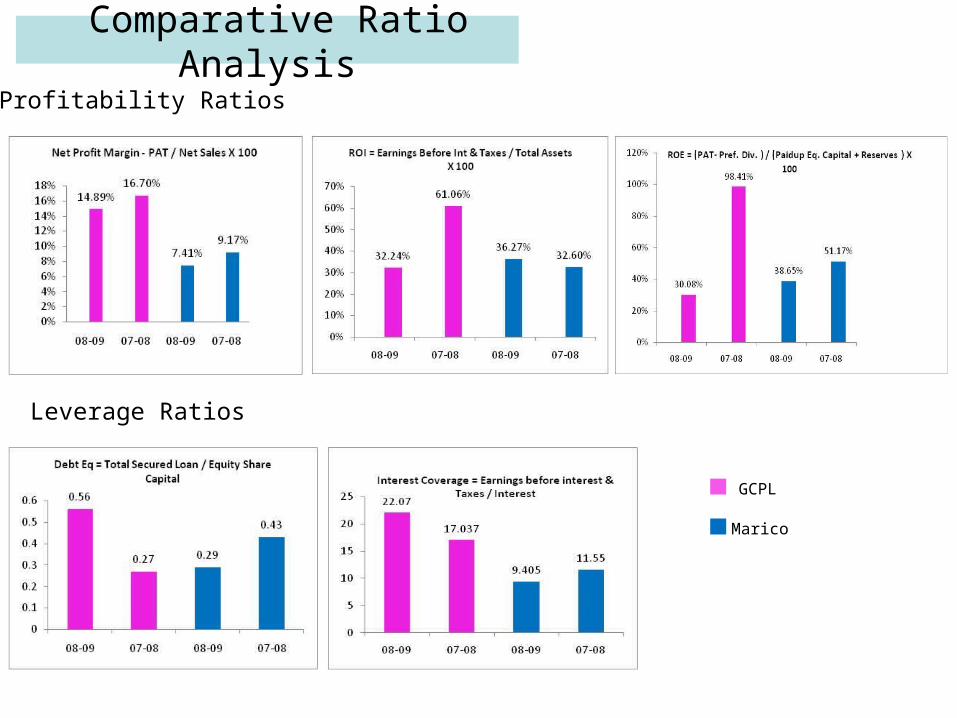
Comparative Ratio Analysis
Profitability Ratios
Leverage Ratios
GCPL
Marico
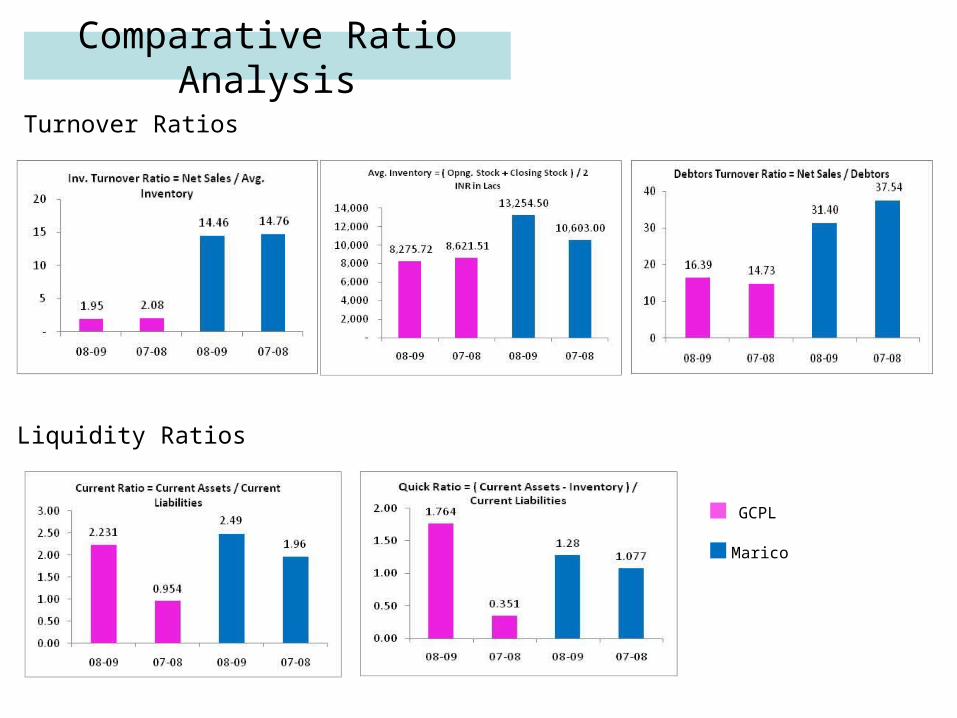
Comparative Ratio Analysis
Turnover Ratios
Liquidity Ratios
GCPL
Marico
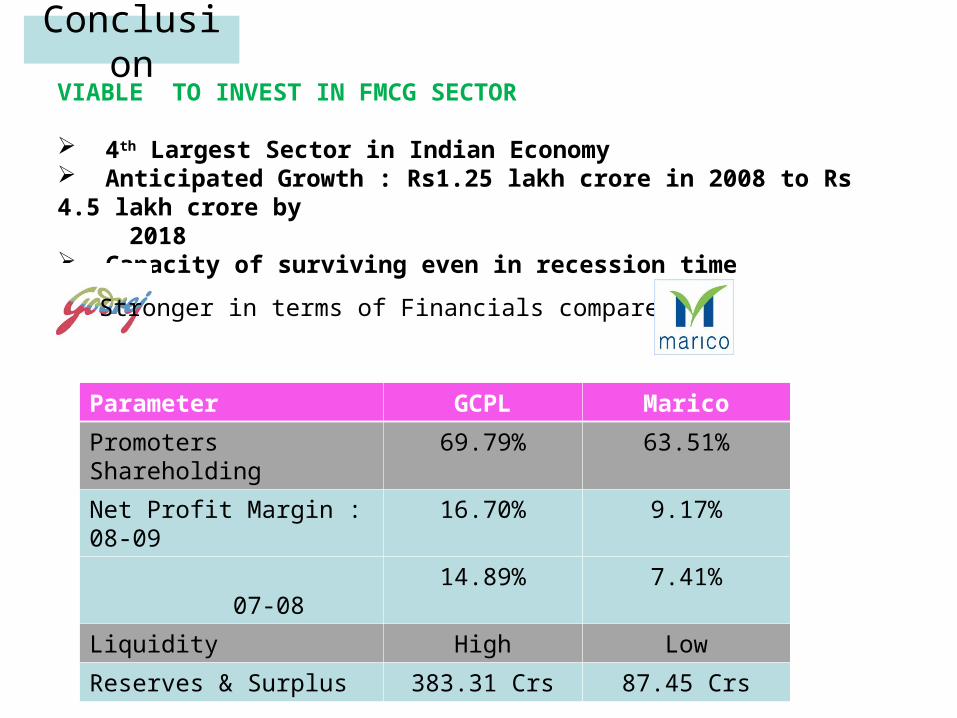
ConclusionVIABLE TO INVEST IN FMCG SECTOR
4th Largest Sector in Indian Economy Anticipated Growth : Rs1.25 lakh crore in 2008 to Rs 4.5 lakh crore by 2018 Capacity of surviving even in recession time
Stronger in terms of Financials compared to
Parameter GCPL Marico
Promoters Shareholding 69.79% 63.51%
Net Profit Margin : 08-09 16.70% 9.17%
07-08 14.89% 7.41%
Liquidity High Low
Reserves & Surplus 383.31 Crs 87.45 Crs