Embed Size (px)
Citation preview
40 Int. J. Higher Education and Sustainability, Vol. 1, No. 1, 2015
Copyright © 2015 Inderscience Enterprises Ltd.
Comparative analysis of sustainable facilities planning and users’ satisfaction in Nigerian universities – a standardised residuals approach
Martins Adenipekun Department of Estate Management and Valuation, Lagos State Polytechnic, Lagos, Nigeria Email: [email protected]
Abayomi Ibiyemi*, Yasmin Mohd Adnan and Md Nasir Daud Department of Estate Management, Faculty of Built Environment, University of Malaya, 50603 Kuala Lumpur, Malaysia Email: [email protected] Email: [email protected] Email: [email protected] *Corresponding author
Abstract: This study explores the influence of facilities planning on users’ satisfaction in the work environment of three South-West Nigeria universities selected randomly based on federal, state, and private ownership structure. It sought answers to questions relating to the relationships between sustainable facilities planning and users’ satisfaction, the strength of the relationships, and the contributive values of the scale for users’ satisfaction in the universities. 186 questionnaires were administered to staff and students, and a response rate of 91.9% achieved. The results of cross tabs, standardised residuals and symmetric measures showed weak statistical association between the two variables across the universities, with response time as a common denominator. The study agrees with Steiss (2005) that a systematic planning effort is vital in decision making about construction and financing of strategic facilities. It was concluded that university administrators optimise operations in capital budgeting, space utilisation, response time, and interconnectivity of facilities by strengthening the association between the two variables. The study contributes to the discussion about student-staff perception of sustainable facilities planning in their universities.
Keywords: facilities planning; sustainability; universities; user needs; satisfaction; workplace; Nigeria.
Reference to this paper should be made as follows: Adenipekun, M., Ibiyemi, A., Adnan, Y.M. and Daud, M.N. (2015) ‘Comparative analysis of sustainable facilities planning and users’ satisfaction in Nigerian universities – a standardised residuals approach’, Int. J. Higher Education and Sustainability, Vol. 1, No. 1, pp.40–65.
Comparative analysis of sustainable facilities planning and users’ satisfaction 41
Biographical notes: Martins Adenipekun is a Senior Lecturer at the Department of Estate Management and Valuation, Lagos State Polytechnic, Lagos, Nigeria. His research interests include facilities management, real estate economics and property appraisal.
Abayomi Ibiyemi is a doctoral student of the Department of Estate Management, Faculty of Built Environment, University of Malaya, Kuala Lumpur, Malaysia. His research interests include real estate valuation, property appraisal, sustainability, facilities and environmental resources management.
Yasmin Mohd Adnan received her PhD in Estate Management from the University of Malaya, Kuala Lumpur, Malaysia. She is currently a Senior Lecturer at the Department of Estate Management, Faculty of Built Environment, University of Malaya, Kuala Lumpur, Malaysia. Her research interests include real estate economics, sustainability, property development, and research methods. She is currently the Chief Editor of the International Journal of Property Science (http://umexpert.um.edu.my/cv_search_page.php).
Md Nasir Daud received his PhD in Estate Management from the University of Newcastle upon Tyne, UK. He is currently an Associate Professor at the Department of Estate Management, Faculty of Built Environment, University of Malaya, Kuala Lumpur, Malaysia. His research interests include econometric modeling, sustainability, housing, real estate finance and economics (http://umexpert.um.edu.my/cv_search_page.php).
1 Introduction
Strategic facilities planning has its origins in the private sector as corporate entities seek to develop a more comprehensive approach to capital budgeting, space planning and operational assessments. The primary objective is to address high priority areas of financial exposure represented by physical facilities and the operating systems that support them (Steiss, 2005). Organisations adopting this approach are interested in creating more cost-effective and long term solutions to their facility need. Major expenses and mistakes in the design and construction of facilities can be avoided by adopting the fundamental steps of sustainable facilities planning (SFP) to ensure that all the right questions are asked.
Many challenges evolve to confront the effectiveness and efficient operation of educational facilities in the university system in recent times. Resultantly, several calls have been made to give more attention to the management of universities in Nigeria for improved qualitative output and enhance productivity. Facilities in some universities are becoming become obsolete, and grossly inadequate to achieve the objectives of those universities and satisfy user needs (Odiete, 1998). Many of the newly established universities operate on temporary campuses that bear no resemblance of the 20th century university expectations. Consequently university social environment is not in consonance with the expected student/teacher/staff relationship. Management of universities real estate assets has become increasingly inefficient, because many institutions do not have facilities management units where the concept of SFP can be utilised in their operations. Common appearances of decays and abandonment of structures within the universities are telltales of inappropriate location of facilities, overuse of the existing ones,
42 M. Adenipekun et al.
maintenance neglect, and lack of functional connection. These have their impacts on users’ satisfaction and the work environment generally. However, current trends indicate the inevitability of SFP in the running of university systems.
The management of university facilities transcends the problem of personnel, janitorial, transportation, or mere sanitation issues, but includes maximisation of efficiency in time savings, space, capital budgeting, staff welfare, teamwork and improvement in general productivity (Dingley, 2008; Shayler, 2010). The common appearance of decays, neglect, underutilisation, overutilisation and abandonment of structures is a clear indication of lack of corporate and strategic FP at the design and construction stages of the university facilities. To achieve university corporate objectives, and users’ satisfaction, a detailed planning of every facet of university facilities is desirable. Literature abounds with evidence to justify the importance of the integration and application FP to the management of facilities and work environment (Marmolejo, 2007; Fareo and Ojo, 2013) the researcher has not been able to identify any that assesses the contributory value of SFP to users’ satisfaction in Nigeria, with focus on student-staff perception. The need to demonstrate and document the value of SFP to public and private universities as part of a broader strategic planning process or a freestanding application underscores the importance of this study.
2 Objectives, and study significance
The aim of this study is to explore the dimensions of STP and users’ satisfaction in the work environment in selected South West Nigeria universities. The following specific objectives were identified to achieve the aim: To examine whether there is association between FP and users’ satisfaction; the strength of the association and; assess the contributory values of identified FP sub-variables to users’ satisfaction for documentation.
This study is of immediate relevance to national educational interests, and an index for decision making on university autonomy in Nigeria.
There are fundamental questions for which answers have to be sought in this study. These are:
1 Is there significant association between SFP and users’ satisfaction in all the universities?
2 What is the strength of association?
3 What are the inherent contributive values to users’ satisfaction in a three-factor, 12-variable SFP scale?
The null hypothesis states that there is no statistical association between SFP and users’ satisfaction.
3 The study area
South-West Nigeria consists of Ogun, Oyo, Ondo, Osun, Lagos and Ekiti states. The choice of Nigeria is informed by the common appearance of decay, neglect, and underutilisation of facilities in its universities. These States share similar educational,
Comparative analysis of sustainable facilities planning and users’ satisfaction 43
socio-cultural, economic and political characteristics. They constitute the fastest growing region in education among the geo-political zones in the country. There are 31 approved universities within the South-West zone (NUC, 2011).
UNILAG is located at Yaba, while the Medical Campus of the College of Medicine is located a few kilometres from the main campus at Idi-Araba, Surulere, on the mainland of Lagos. The university, established in 1962, has residential, office and academic facilities and services for both staff and students. It has 14 academic units comprising a broad range of professional faculties and schools. Most faculties are located on the main campus. LAUTECH was established in 1990. The main campus is at Ogbomosho in Oyo State. The campus is the site of the university's administration, as well as home to five faculties and the post-graduate school. The other campus is located in Osogbo, home to the College of Health Sciences, Faculties of Medicine and Surgery, Medical Laboratory Technology and Nursing. JABU is a private Nigerian university located in Ikeji-Arakeji in Osun State. It was established by the Christ Apostolic Church (CAC) worldwide in 2002. The University is a fully residential institution, with about seven faculties. There are 38,000 registered students in UNILAG, 25,000 in LAUTECH and 15,000 in JABU. Staff populations are 4,000, 3,000, and 2,800, respectively (NUC, 2011).
4 Operational definition of terms
• Facilities: composites of what constitute real estates whether tangible or intangible, services and other benefits real or abstract in form that contribute to the achievement of the corporate objectives of the institution, and users’ satisfaction
• Sustainable facilities planning (SFP): continuous process which takes into consideration, updated appraisal of existing conditions and the review of on-going programs which are necessary for the regular assessment of functional needs of users. FP is an integral part of FM.
5 Review of literature
Facilities management is complex in scope (Paxman, 2007). It integrates the people, process and the place together FM embodies inter-related job responsibilities that includes long-range FP, annual tactical planning, facility financial forecasting and management, real estate acquisition and disposal, interior space planning, work specifications, installation and space management, architectural and engineering planning and design, new construction and/or renovation works, maintenance and operations maintenance of the physical plant, telecommunication integration, security and general administrative services (food services, records management, reprographics, transportation and mail services, health, safety, in and out sourcing (Rondeau et al., 1995) It anchors and integrates all of the job responsibilities together to design a corporate policy objective. It is therefore seen as an emerging field that incorporates many interacting terminologies (Derrick, 2005). FM poses a strong relationship with other disciplines, such as space planning, architecture, interior design, environmental psychology, real estate, systems engineering, human resource management, information systems management, project management, and building service engineering (Odiete, 1998). This relationship
44 M. Adenipekun et al.
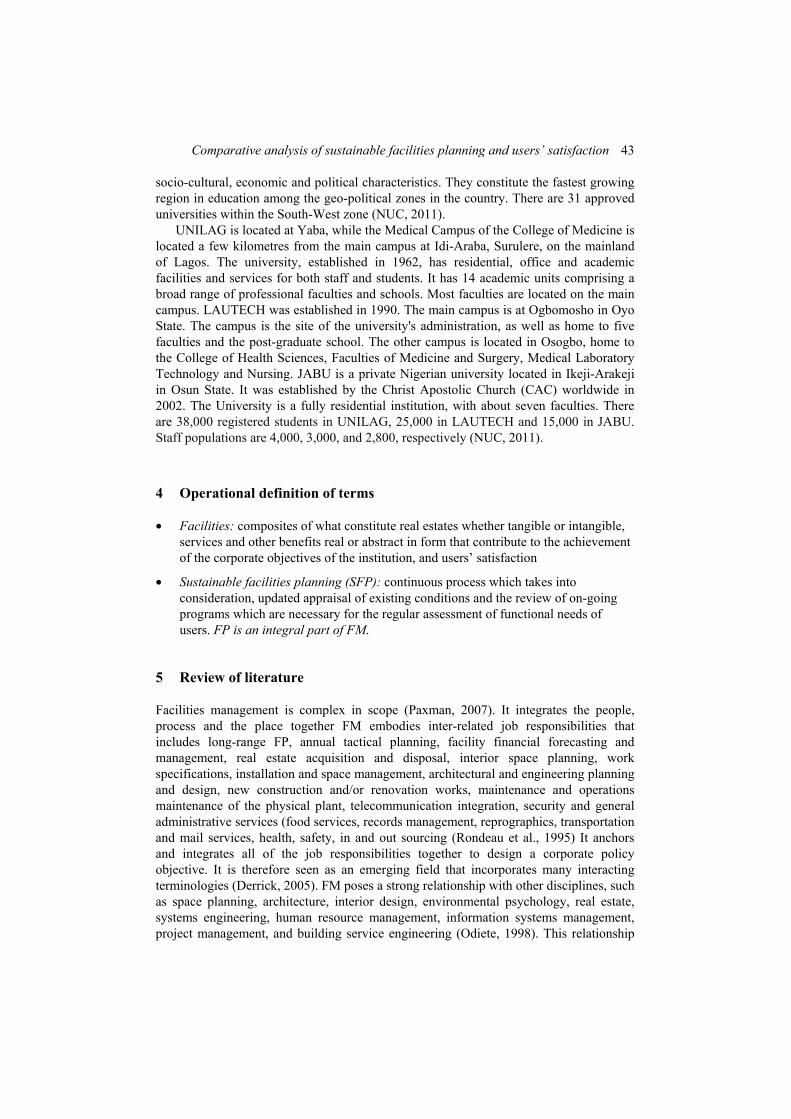
presents a matrix of complex associations in various basic activity areas of an organisation as illustrated in Figure 1.
Figure 1 Scope of facilities management (see online version for colours)
Source: Adapted from Odiete (1998)
Central to basic FM functions and activity areas is planning and programming. Every aspect of facilities management requires detailed planning to achieve its objectives. Long (five years) and short (one year) term programs should be aligned with corporate and departmental operating plans and these should incorporate major activities (Paxman, 2007). Minimisation of facilities costs, tracking and pattern of changes also exert certain impact on firms’ goals, underscoring planning as an imperative in all activities of FM (Somorova, 2007). ASBO (2003) asserted that effective management starts with planning that synthesises collaborative interfaces, but cautioned that planning can result in real problems when large capital investment sums are misappropriated.
Bennett (2010) summarised effective facilities planning and management of public sector property as speculative and one which requires a conceptual framework to operate. He investigated the validity of facilities planning by considering the relationship between customer and business led strategies and how different strategies affect facilities planning. A prototype strategic model for future use decision making process where it is necessary to consider facilities needs and challenges in business was proposed. Bennett restated that facilities or assets strategies within this context are centered on business strategies and organisational aspirations rather than making current assets dictate direction of strategic business goals. The business and organisational focus rather than facilities or asset focus allows strategies to be developed which once in place can provide an informed platform for the more organised facilities management model to come into play with cost-in-use planning, maintenance planning, space planning (Shayler, 2010; Olesand, 2010; Burud, 2010), budget planning, asset planning, operation planning, systems and software planning (Dingley, 2008), capital planning, campus planning (Koppelman, 1975), contract facility planning, environmental planning, scenario planning (Sekula, 2010; IJFM, 2010) and organisation planning (IJFM, 2010).
Facilities management in the education sector possesses a number of challenges not common in other sectors (Dingley, 2008). A university or college will generally have a
Comparative analysis of sustainable facilities planning and users’ satisfaction 45
number of large buildings with various functions, on one or more campuses with a typical mix of teaching spaces, laboratories, cellular and open plan office space, sport facilities, students accommodation, libraries and outside spaces, together with its diversity of people who use the facilities and the activities they pursue. UNM (2014) evaluated sustainable facilities planning assessment criteria used as basic standards for public colleges and universities in the USA. These includes: needs assessment, location advantages and user needs, management planning, physical plant planning, financial planning, total institutional plan, evaluation of facilities program, and annual facilities review of designs and functional connections. To deploy use of computer to aid facilities management in this sector would no doubt involve preparation of strategic integration of user requests. Room use between the teaching, off teaching hours, leisure-based activities, use of multi-purpose halls, squash and tennis courts, bars and other spaces used by students, staff or outside organisations will differ widely. Some organisations hire out facilities to outside organisation during vacations to increase revenues particularly accommodation and meeting spaces. These require adequate planning of every aspect of the facilities to integrate their various strategic focus for corporate objectives to be achieved.
In the literature, it is assumed that the application of FP (and FM in general) is focused on supporting primary processes and contributing to achieving organisational goals (Atkin and Brooks, 2000; Barret and Baldry, 2003). The physical setting of which can aid or hinder the accomplishment of internal organisational goals, and users’ satisfaction (Bitner, 1992). A clear expression of this is the large number of FM-related studies that have been conducted focussing on different aspects of its added value for primary processes (Williams, 1996; Krumm et al., 1998; Amaratunga and Baldry, 2000; Salonen, 2004; Wauters, 2005; Lindholm and Leva¨inen, 2006; De Toni et al., 2007; Chotipanich and Nutt, 2008; De Vries et al., 2008), especially quality (e.g., customer satisfaction), users satisfaction regarding time (e.g., response time), risk (e.g., safety, reputation) and relationship quality (e.g., alignment). It has already been established that FP value concerns a trade-off by the users between benefits, costs and risks. In this study, the scope of FP focuses on the contribution to users’ satisfaction, and its added value can be defined as the users’ perceived contribution of the different facility services to satisfying their needs.
Literature has not shown empirical contributive evidence of SFP to users’ satisfaction, and organisational competitiveness in Nigeria universities. This study also seeks to fill that gap.
6 Research methods
The research design is survey-exploratory, and the survey technique was adopted to collect data.
South-West Nigeria was selected for the study because it has the highest concentration of universities (31) in the country and a good mixture of federal (6), state (9) and private (16) universities (JAMB, 2010). Three of the universities were randomly selected from each cluster of ownership and control structure – one from federal, state, and private ownership respectively, for fair representation and external validity.
46 M. Adenipekun et al.
The secondary information used for this study was gathered from relevant journals, monographs and discourse materials. Others include materials from text books, base maps, workshops, as well as government publications. The National Universities Commission (NUC), the physical development offices of the respective universities, works and services, and other relevant departments were observed directly by the researchers.
The following are the summary of the basic steps followed in conducting the study:
• Research instruments – primary data was collected through the questionnaire survey.
• Questionnaire structure – the questionnaire is a schedule. It is a project specific questionnaire designed to elicit a three-factor, 12 SFP sub-variables that may influence users’ satisfaction in SW Nigeria universities.
• Sampling design, frame and sample size – a total number of 186 students and staff were served with questionnaires (62 questionnaires per university). Respondents were selected using the random technique and categorised into ‘students’ and ‘staff’.
• Responses – a total of 171 responses were received; made up of 82 from students, and 89 from staff. The response rate is 91.9%. Although the response rate is high, we made effort to investigate any selection bias. Sample selection bias is always a potential problem where there are a significant number of non-respondents. Not accounting for it, if it exists, can lead to bias parameter estimates and misleading conclusions (Vossler and Kerkvliet, 1999). However, the respondents were constrained by limited access to classified information, such as facilities acquisition plans and costs, which may limit the scope for generalisation.
• Variables of study: the variables of study were classified in accordance with the parameters for measuring the importance index of SFP, as adapted from UNM (2014).
a) Location advantages and user needs – location advantage of facilities (LAF) and other services in meeting user needs, and demand for the use (DUF) of facilities by staff and students for socio-economic functions
b) adequacy of facilities and functional connection – repairing condition of facilities (RCF), maintenance adequacy of facilities (MAF), use of facilities plans (UFP) in the management of facilities, functional connection of facilities (FCF) to one another with respect to user needs, functional design relationship (FDR) of facilities to one another, adequacy of facilities (AFF) and other services in meeting user needs, effect of facilities condition (EFC) on users’ performance
c) response time – response time to repair dysfunctional facilities (RTDF), impact of dysfunctional facilities (IMDF) on operation of other facilities connected to it, and impact of facilities condition on work efficiency (IMFWE).
The campus facilities, units and services considered in this study include: The main library, division of students affairs, university health services, sports centres,
Comparative analysis of sustainable facilities planning and users’ satisfaction 47
the busary, registry, internal audit, consults, and ventures, bookshops and press. Others are car park, guest houses, conference centre, central industrial liaison placement, main auditorium, botanical/zoological gardens, community pharmacy, academic planning unit, guidance and counselling unit, estate units, media/corporate affairs, works and physical planning unit, hydraulic research unit, alumni relations unit, legal unit, security unit, records and quality assurance, students’ halls of residence, the senate building complex, lecture theatres, shopping complexes, sports complex, students, union building, and banks.
Cross tabulation, symmetric measures, and Crammer’s V statistics were used as test of association and effect size. Reliability analysis was carried out for internal consistencies, and all the items correlated adequately in the construct. The minimum corrected item – total correlation is 0.770, and cronbach alpha coefficient reported 0.799. Generally, Cronbach alpha coefficient ≥ 0.7 average correlation matrix indicate sufficient internal consistencies (Devellis, 2003; Kline, 2005; Pallant, 2011).
• Method of data analysis: descriptive statistics based on distribution of responses. The sub-variables are: LAF, DUF, RCF, MAF, UFP, FCF, FDR, AFF, EFC, RTDF, IMDF, and INFWE. The outcome variable is the users’ satisfaction. Users’ satisfaction was factored was factored on the aggregate of all these twelve sub-variables. A ‘satisfactory’ choice by the respondents on any of the twelve sub-variables indicates concession to ‘user satisfaction’ by that explanatory factor, and the respondent is placed in Category A, whereas a ‘not satisfactory’ choice indicates ‘a user not satisfied’ choice by that explanatory factor, and the respondent is placed in Category B.
7 Results and analyses
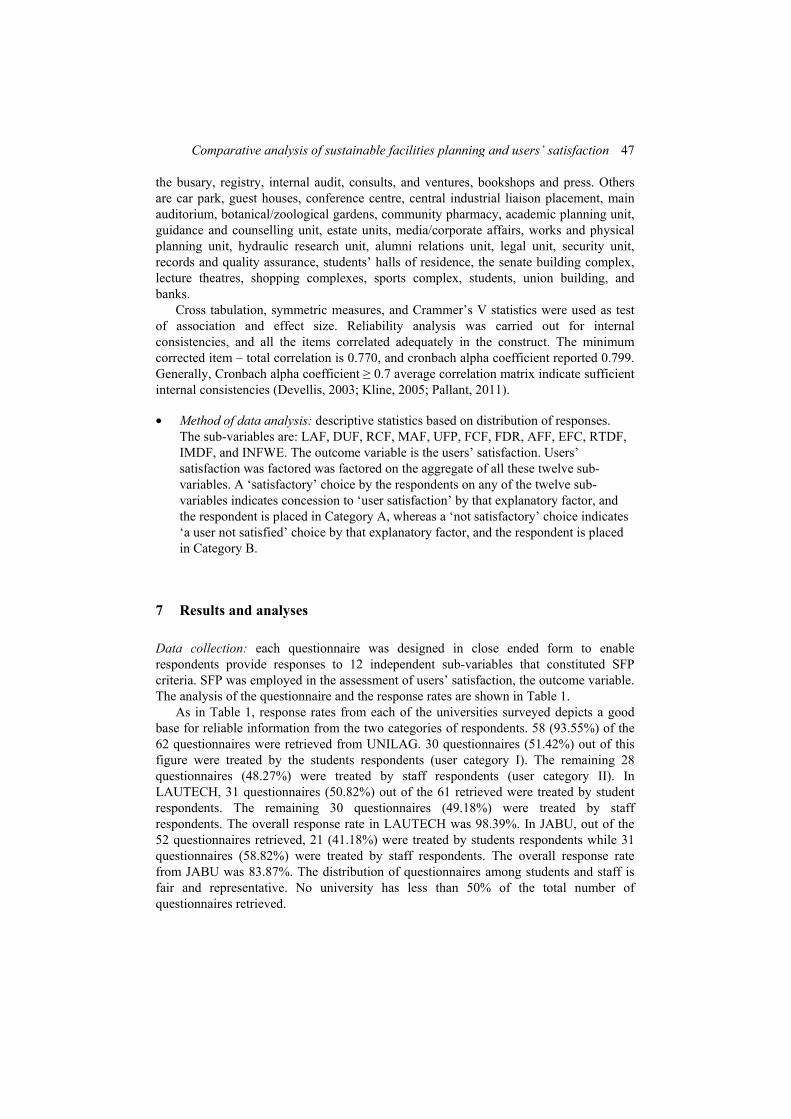
Data collection: each questionnaire was designed in close ended form to enable respondents provide responses to 12 independent sub-variables that constituted SFP criteria. SFP was employed in the assessment of users’ satisfaction, the outcome variable. The analysis of the questionnaire and the response rates are shown in Table 1.
As in Table 1, response rates from each of the universities surveyed depicts a good base for reliable information from the two categories of respondents. 58 (93.55%) of the 62 questionnaires were retrieved from UNILAG. 30 questionnaires (51.42%) out of this figure were treated by the students respondents (user category I). The remaining 28 questionnaires (48.27%) were treated by staff respondents (user category II). In LAUTECH, 31 questionnaires (50.82%) out of the 61 retrieved were treated by student respondents. The remaining 30 questionnaires (49.18%) were treated by staff respondents. The overall response rate in LAUTECH was 98.39%. In JABU, out of the 52 questionnaires retrieved, 21 (41.18%) were treated by students respondents while 31 questionnaires (58.82%) were treated by staff respondents. The overall response rate from JABU was 83.87%. The distribution of questionnaires among students and staff is fair and representative. No university has less than 50% of the total number of questionnaires retrieved.
48 M. Adenipekun et al.
Table 1 Analysis of questionnaire and response rates
Category of respondents Students Staff Total
UNILAG No. of distributed
questionnaire 31 31 62
No. of questionnaire retrieved 30 28 58 Response rate % 97 90.3 93.55 LAUTECH No. of distributed
questionnaire 31 31 62
No. of questionnaire retrieved 31 30 61 Response rate % 100 96.8 98.39 JABU No. of distributed
questionnaire 31 31 62
No. of questionnaire retrieved 21 31 52 Response rate % 67.74 100 83.87
Source: Analysis of responses (2014)
Data analysis: The Likert 4 points summated rating scales was used and it ranged from Poor (1) to Very Good (4).
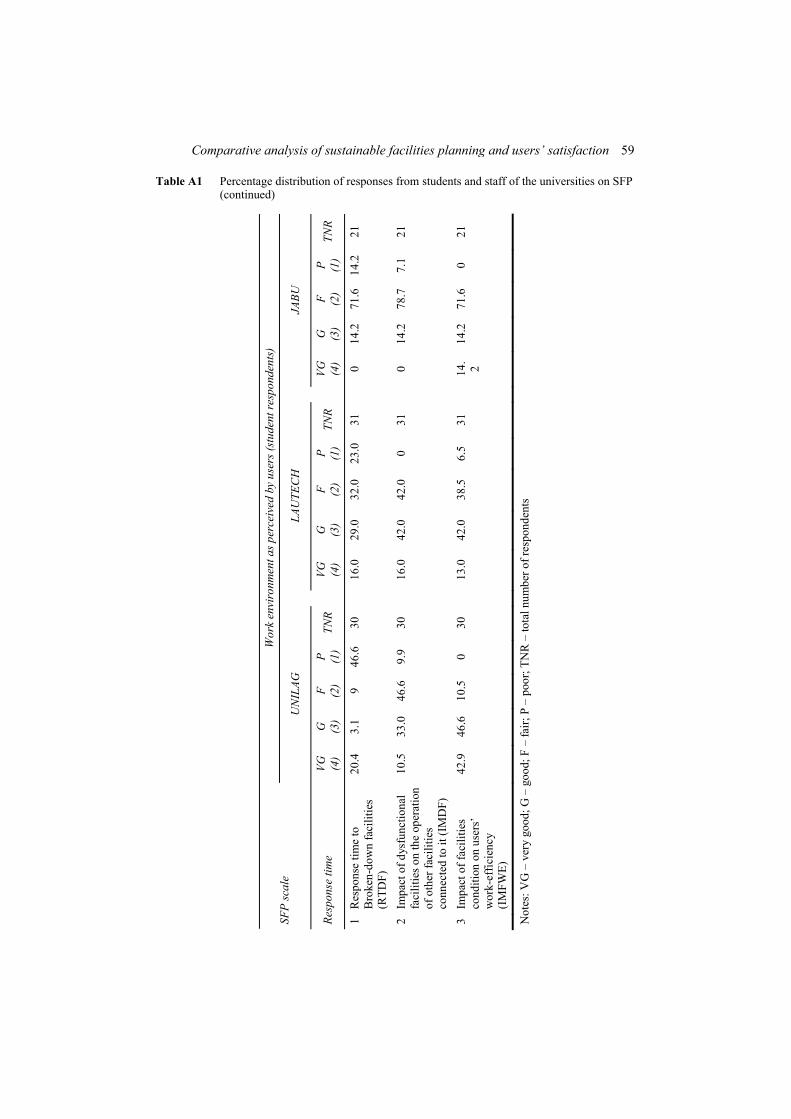
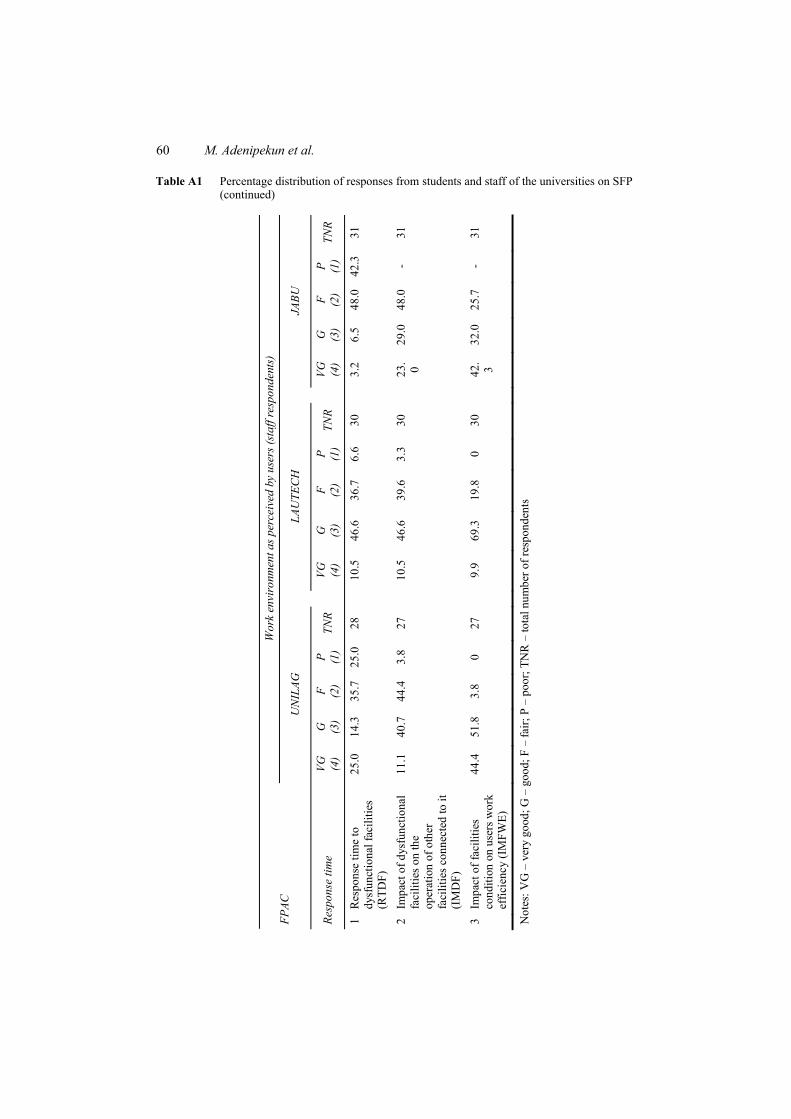
The table of percentage distribution with respect to locational advantage and user needs is shown as Table A1 in the Appendix 1.
Respondents were asked to assess the location benefits/advantage of facilities to users: 73.4% of student respondents from UNILAG, 54.8% from LAUTECH and 19.2% from JABU respectively responded that location benefits/advantages of facilities with respect to needs of users were good. From staff respondents category, 85.2% of respondents from UNILAG, 53.3% from LAUTECH and 29.1% from JABU respectively reported that location benefits/advantages of facilities were good. They were also asked to assess the demand for the use of facilities in the university for social and economic functions: in the student respondents’ category, 93.2% of respondents from UNILAG, 73.6% from LAUTECH and 48.2% from JABU respectively reported good public demand for the use of the various universities’ facilities. In the staff respondents’ category, 92.6% of respondents from UNILAG, 74.3% from LAUTECH and 23.8% from JABU respectively reported good demand for use of university facilities.
The study sought information on the state of repairing conditions of facilities in each of the selected universities: 58% of student respondents from UNILAG, 67.8% from LAUTECH and 23.2% from JABU respectively indicated good condition. In the staff respondents category 54.2% from UNILAG, 70.3% from LAUTECH and 61.3% from JABU respectively indicated good condition.
This study also investigated about the adequacy of maintenance of facilities in the universities: 80.1% of student respondents from UNILAG, 67.8% from LAUTECH and 23.2% from JABU reported that maintenance of facilities in their respective universities were good. 82.1% of staff respondents from UNILAG, 62.1% from LAUTECH and 63.5% from JABU respectively also reported good maintenance of facilities.
Comparative analysis of sustainable facilities planning and users’ satisfaction 49
We asked respondents to assess their respective universities on the use of maintenance plans in the management of universities facilities: in the student respondents’ category, 79.3% from UNILAG, 54.9% from LAUTECH and 28.8% from JABU respectively reported good use of facilities plan in the management of facilities in their universities. In the staff respondents’ category, 78.6% from UNILAG, 63.3% from LAUTECH and 9.7% from JABU respectively reported good use of facilities plan.
We also asked respondents to assess the FCF to one another for smooth and unhindered operation in their respective universities: 69.3% of student respondents from UNILAG, 51.2% from LAUTECH and 14.4% from JABU respectively reported good FCF to one another with respect to the needs of users. In the staff respondents’ category, 82.7% from UNILAG, 58.2% from LAUTECH and 45.2% from JABU reported good FCF to one another.
The research also elicited information on the FDR between facilities to the other with respect to the efficient discharge of user’s works: from the student respondents’ category, 86.2% of respondents from UNILAG, 74.2% from LAUTECH and 24% from JABU respectively reported good FDR of facilities to one another for the purpose of allowing users to discharge their duties effectively and with comfort. 89.3% of staff respondents from UNILAG, 72.4% from LAUTECH and 61.3% from JABU respectively reported good FDR of facilities.
We also implored respondents to assess whether the facilities were adequate in quantity and services to the work users expect those facilities to perform: 96.6% of student respondents from UNILAG, 77.4% from LAUTECH and 23.2% from JABU respectively reported that in terms of AFF and other services, they were good. In the staff respondents’ category, 78.6% from UNILAG, 72.6% from LAUTECH and 96.8% from JABU respectively reported good remarks for AFF and other services.
Respondents were asked to weigh the effect of condition of facilities on user’s performance: 84.2% of student respondents from UNILAG, 71.1% from LAUTECH and 23.2% from JABU respectively reported that effects of facilities condition on users’ performance were good. 85.5% of staff respondents from UNILAG, 79.2% from LAUTECH and 22.6% from JABU respectively reported also that effects of facilities condition on users’ performance were good.
Respondents were asked to rate their respective universities on the period of time it takes to respond to request to repair dysfunctional facilities: from student respondents’ category, 23.5% from UNILAG, 45% from LAUTECH and 14.2% from JABU respectively reported good response time to repair broken-down facilities. In the staff respondents’ category, 39.3% from UNILAG, 57.1% from LAUTECH and 9.7% from JABU indicated good response time.
Respondents were also asked to assess the impact of broken-down and out of operation facilities on the operation of other facilities on performance in the work environment: here, 43.5% of students respondents from UNILAG, 58.2% from LAUTECH and 14.2% from JABU respectively reported that the impact of broken-down facilities on operation of other facilities were good. 51.8% of staff respondents from UNILAG, 57.1% from LAUTECH and 52% from JABU respectively reported similarly that impact of dysfunctional facilities on operation of other facilities connected together with them was good.
50 M. Adenipekun et al.
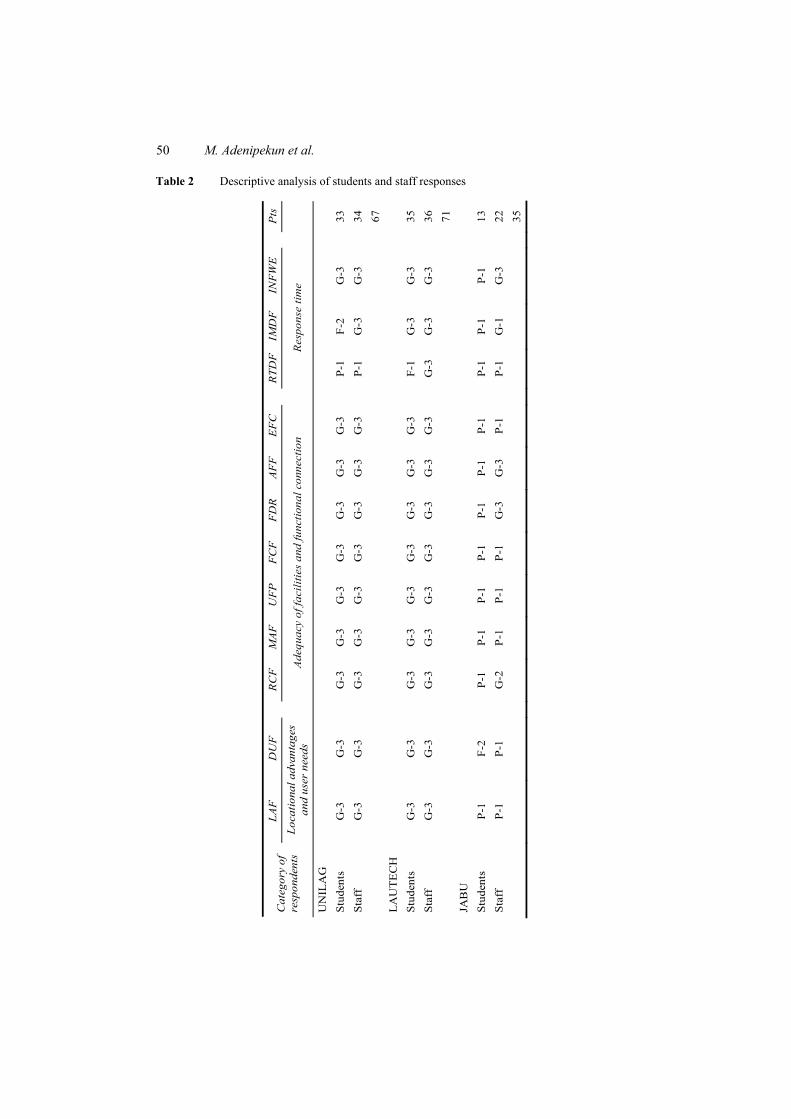
Table 2 Descriptive analysis of students and staff responses
LAF
D
UF
RC
F
MA
F
UF
P
FC
F
FD
R
AF
F
EF
C
R
TDF
IM
DF
IN
FW
E
P
ts
Cat
egor
y of
re
spon
dent
s Lo
catio
nal a
dvan
tage
s an
d us
er n
eeds
Ade
quac
y of
faci
litie
s an
d fu
nctio
nal c
onne
ctio
n
Res
pons
e tim
e
UN
ILA
G
Stud
ents
G
-3
G-3
G-3
G
-3
G-3
G
-3
G-3
G
-3
G-3
P-1
F-2
G-3
33
Staf
f G
-3
G-3
G-3
G
-3
G-3
G
-3
G-3
G
-3
G-3
P-1
G-3
G
-3
34
67
L
AU
TEC
H
Stud
ents
G
-3
G-3
G-3
G
-3
G-3
G
-3
G-3
G
-3
G-3
F-1
G-3
G
-3
35
St
aff
G-3
G
-3
G
-3
G-3
G
-3
G-3
G
-3
G-3
G
-3
G
-3
G-3
G
-3
36
71
JA
BU
St
uden
ts
P-1
F-2
P-
1 P-
1 P-
1 P-
1 P-
1 P-
1 P-
1
P-1
P-1
P-1
13
St
aff
P-1
P-1
G
-2
P-1
P-1
P-1
G-3
G
-3
P-1
P-
1 G
-1
G-3
22
35
Comparative analysis of sustainable facilities planning and users’ satisfaction 51
We asked respondents to rate the impact of facilities condition on their work efficiency: responses from student respondents from UNILAG showed that 99.5% of the respondents reported that impact of condition of facilities on work-efficiency was good. In LAUTECH 55% reported that it was good and 28.4% of respondents from JABU reported it was good. From staff respondents’ category, 96.2% from UNILAG, 79.2% from LAUTECH and 74.3% from JABU respectively reported that it was good.
Table 2 illustrates descriptive analysis of students and staff responses, using a representative likert scale: G – Good – ≥ 50% (3); F – Fair – 45%–49.99% (2); P– Poor –< 45% (1).
As in Table 2, LAUTECH, with 71 points rates highest on the SFP scale, followed by UNILAG, and JABU with 67 and 35 points respectively. It could be implied that LAUTECH implements SFP techniques in the management of facilities more than the others, to the benefit of users, but needs more timely intervention in fixing dysfunctional facilities. UNILAG also needs to improve response time because delay impacts on its operations and interconnectivity with other facilities. JABU exhibits the least influence of SFP in its operations. The performance of JABU is generally poor on the three-factor scale.
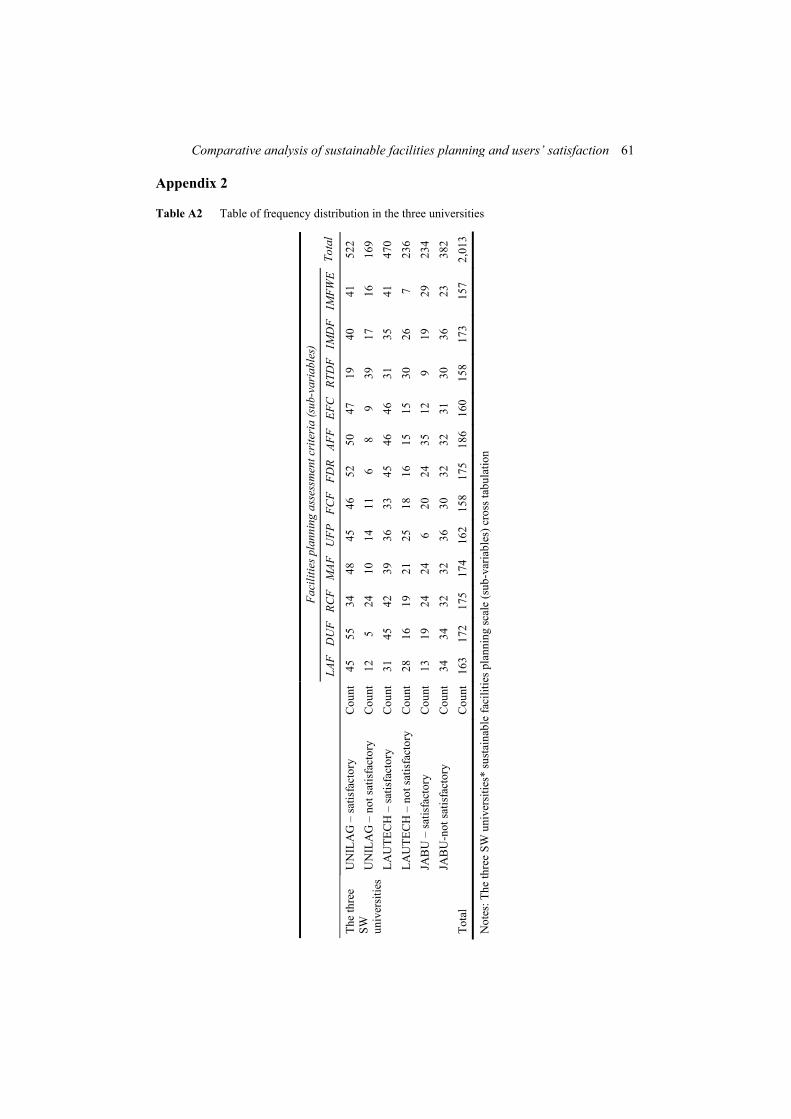
In order to assess the contributory values of identified SFP sub-variables to users’ satisfaction for documentation, and identify SFP sub-variables that contribute to users’ satisfaction in the Universities, the descriptive statistics of the responses in respect of the twelve sub-variables were recoded for ease of application of SPSS22 crosstab statistics. The transformed responses are presented in Table 4, which shows the combined frequency distribution of responses in the three universities is contained in Table A2 in Appendix 2. Responses relating to independent variables were recoded into two nominal categories (satisfactory, 1; not satisfactory, 0); sSatisfactory (very good and good); not satisfactory (fair and poor).
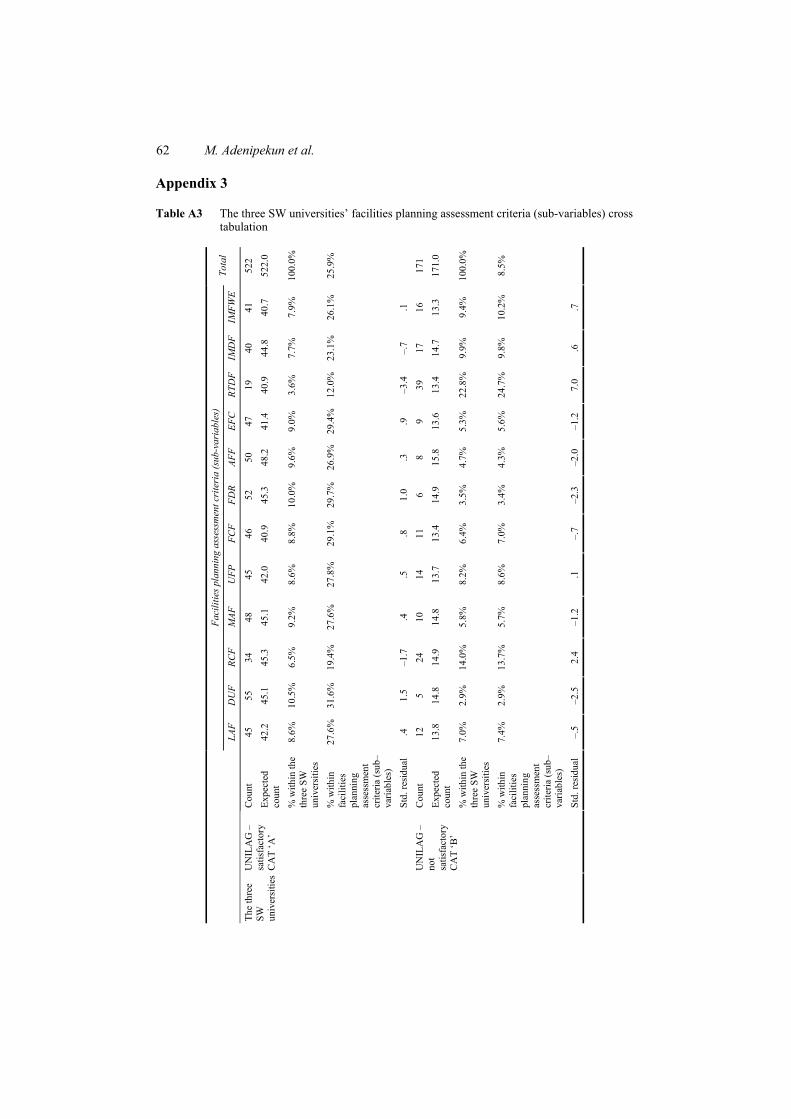
The cross tabulation is attached as Appendix 3 (Table A3) gives the frequency counts, expected frequency and the difference between the two for each of the 72 cells. Expected count frequency in each of the cells generated by the factorial combination of SFP and users’ satisfaction. All the cells have frequencies ≥ 5. This means that the analysis has not violated a main assumption underlying the crosstab test. Preference for the SFP sub-variables examined varied as a function of users’ satisfaction. Considering the magnitude of standardised residuals (STDRes): The residual is the error between what the model predicts (expected frequency) and data actually observed. Residualij = observedij – modelij, in which i and j represent the two variables. The crosstab is the sum of the STDRes, so the relationship is direct (Field, 2009). To determine what contributes to the overall association, chi-square measures individual STDRes in each cell. Each STDRes is a z score. Field (2009) affirms the rule: If the value lies outside of ±1.96, then it is significant at .05.
For this study, STDRes with greater than ±1.96 value in any cell tells us that significantly more respondents than expected considered the sub-variable for user satisfaction, and less number of respondents than expected did not consider the sub-variable for user satisfaction, therefore the sub-variable has influence on the overall association, or outcome. Conversely, STDRes with less than ±1.96 value indicate that, the sub-variable did not significantly contribute to the association. Hence, RTDF (STDres7.0), UFP (STDRes –3.0),AFF (STDres2.9)DUF (STDres-2.5), INFWE (STDres2.5), RCF (STDres 2.4), FDR (STDres –2.3), and LAF (STDres2.0) significantly contributed to the significance of the statistic. The overall indication is that users’
52 M. Adenipekun et al.
satisfaction is influenced by these independent variables at varying magnitudes across the universities. While in UNILAG, RTDF (7.0), DUF (–2.5), RCF (2.4), and FDR (–2.3) have dominant influences on users’ satisfaction, with RTDF exercising the greatest, the position is different in LAUTECH. RTDF (2.7), INFWE (–2.7), and LAF (2.0), are dominant, with RTDF and INFWE having the same scale of dominance (±2.7). For JABU, UFP (–3.0), AFF (2.9), INFWE (2.5), and RTDF (–2.2) are, but UFP has the greatest influence. However, RTDF is a common factor influence for both UNILAG and LAUTECH, while RTDF and INFWE are common to LAUTECH and JABU. This indication underscores the importance of RTDF in the scheme of users’ satisfaction determinants, since RTDF influences users’ satisfaction across the universities.
The chi-square result is shown as Table A4 in Appendix IV, Exhibit 1. As in Table A4, we can conclude that there was statistical association between SFP and users’ satisfaction, for the different sub-variables. Pearson’s chi-square = 167.171, p = .001 (< .05). We could not accept the null hypothesis. Therefore, SFP influences users’ satisfaction in the universities. Table A5 in Appendix IV, Exhibit 2 provides measures of the strength of relationships or the effect size that ranges between 0 and 1. The closer to 0, the weaker the association. In this study, the Cramer’s V at .129 indicates a weak association
8 Summary of findings
The following major findings were discovered from this study: Work environment in the study areas differ from one university to the other, so are
user requirements. This justifies the marked differences in facilities planning needs of respective universities.
LAUTECH implements FP techniques in the management of facilities more than the others, to the benefit of users, but needs to reduce response time for fixing dysfunctional facilities. UNILAG also needs to improve response time because delay could impact on the operation and interconnectivity with other facilities. JABU exhibits the least influence of FP in its operations. The performance of JABU is generally poor on the three-factor scale. SFP influences users’ satisfaction in the universities, and RTDF influence is common to all the universities. The statistical association between them is a weak one. The variables that contribute to the overall association between SFP and users’ satisfaction in each of the universities are as follows: UNILAG-RTDF, DUF, RCF, and FDR; LAUTECH-INFWE, RTDF, and LAF; and JABU-UFP, AFF, INFWE, and RTDF
9 Discussion of findings
All the research questions have been answered and the hypothesis verified in the study, regarding significant association, effect size of the association, and the influences of the sub-variables.
The locational advantage of facilities was determined with respect to needs of users in each of the universities and found to vary from university to university because staff and students are not equally divided among the categories as expected. This could be due to inappropriate planning and misappropriation of funds (ASBO, 2003). AFF and functional connection is expectedly varied, probably in accordance with the degree of awareness
Comparative analysis of sustainable facilities planning and users’ satisfaction 53
about the need to incorporate FP in their institutions. The generally slow response time and the accompanying impacts on other facilities underscores the need for FP and showcases its relevance for users’ satisfaction and realisation of corporate objectives. Work efficiency is dependent on skills and availability of facilities to prosecute the work (Shayler, 2010). Since misappropriation of funds is common occurrence, it is not unexpected that funds allocated for facilities could have been converted to other uses in some of the public universities. The private universities are hardly able to source for the massive funding required for the universities to provide the required facilities and skills. The position of JABU in the study clearly reinforces this submission.
Significant association of SFP with users’ satisfaction and the work environment is expected in UNILAG because the university has just commenced new postgraduate programs in facilities management, and it is suspected that expertise may have been made available from this department to the university management. However, since LAUTECH has the highest points, it may be argued that UNILAG may not have sought this expertise. The results of this study portrayed a true assessment of the various states of users’ satisfaction in the work environment of the respective universities. This was perhaps because the assessment were conducted by the users of those facilities in each of the universities and those respondents are indirectly involved in contributing to achieving the policy objectives of respective university organisations.
10 Conclusions and policy implications
Conclusions: this study has clearly shown that the use of facilities plan in the management of universities facilities may not have gained appreciable recognition in Nigeria. RTDF is the only common denominator. This has a very serious implication fora sustained users’ satisfaction in the universities. The findings therefore have serious concern for all universities’ management. There are clear needs for proactive facilities planning strategies to be implemented. Internally generated revenue needs to be augmented through increased demand for use of university facilities by tapping demands from immediate catchment area of each university’s location. Through facilities planning, universities should reorder use of spaces, phase property maintenance and repair existing stock of facilities to enhance their conditions.
Policy implications: the weak association is an indication that universities in Nigeria have not taken full advantage of the use of facilities planning for successful operation of their respective facilities management. Apart from financial, cost estimate and budgeting, the maintenance of existing stock is required to meet the needs of the present users, while consideration may be extended to other numerous specific facilities issues like feasibility analysis of trading offs between ‘lease or own’ analysis of facilities; consolidation or decentralisation of facilities; merger/acquisition facilities study; analysis of highest and best use; space optimisation plan; project estimating and scheduling; and stay/go analysis or buy/build/remove analysis.
Facilities planning has been greatly facilitated by information technology, and now, there is limited emphasis on physical assets (from the bricks and mortar now to clicks and dotcoms). It is therefore very necessary to redesign and operationalise facilities for a better work environment. University facilities is expected to be part of an internal component of the conditions of learning that must consist of both physical structures and variety of building systems, telecommunication, security, furnishing, architectural
54 M. Adenipekun et al.
landscapes, information technology as well as various aspect of building grounds, such as athletic fields, playgrounds, areas for outdoor learning, vehicular access and parking. All these facilities should be effective and responsive to the changing programs of educational delivery and user need satisfaction. This study has contributed to knowledge and practice by informing researchers who are considering related studies about the need to integrate students-staff perspectives.
Areas of further research: areas of further research on facilities planning and users’ satisfaction could be extended to finding the number of variables that represent a large proportion of the total variance in the SFP and user satisfaction data set; and a student-staff focused post-occupancy evaluation studies in relation to educational facilities.
References Amaratunga, D. and Baldry, D. (2000) ‘Assessment of facilities management performance in
higher education properties’, Facilities, Vol. 18, Nos. 7/8, pp.293–301. ASBO (2003) ‘Association of school business officials international, U.S Department of Education,
National Centre for Education Statistics, National Forum on Education Statistics’, Planning Guide for Maintaining School Facilities, NCES 2003–347.
Atkin, B. and Brooks, A. (2000) Total Facilities Management, Blackwell Publishing, Oxford, UK. Barret, P.S. and Baldry, D. (2003) Facilities Management: Towards Best Practice, 2nd ed.,
Blackwell Publishing, Oxford, UK. Bennett, T. (2010) ‘Strategic facilities planning model for public property’, U.K. Health Care Case
Study, UK [online] https://www.fig.net/pub/proceedings/korea/full-papers/pdf/.../bennett.pdf (accessed 17 October 2014).
Bitner, M.J. (1992) ‘Services capes: the impact of physical surroundings on customers and employees’, Journal of Marketing, Vol. 56, No. 3, pp.57–71.
Burud, S. (2010) ‘Working out of the box, facilities management resource’, Facility Management Journal IFMA, FMLink [online] http://www.FMJONLINE.com (accessed 18 July 2014).
Chotipanich, S. and Nutt, B. (2008) ‘Positioning and repositioning FM’, Facilities, Vol. 26, Nos. 9/10, pp.374–388.
De Toni, A.F., Fornasier, A., Montagner, M. and Nonino, F. (2007) ‘A performance measurement system for facility management: the case study of a medical service authority’, International Journal of Productivity and Performance Management, Vol. 56, Nos. 5/6, pp.417–435.
De Vries, J.C., De Jonge, H. and Van der Voordt, T.J.M. (2008) ‘Impact of real estate interventions on organisational performance’, Journal of Corporate Real Estate, Vol. 10, No. 3, pp.208–223.
Derrick, V.M. (2005) What is Facility Plan? Van Mell Associates, Planners and Project Managers [online] http://www.vanmellassociates.com (accessed 20 July 2014).
DeVellis, R.F. (2003) Scale Development: Theory and Applications, 2nd ed., Sage, Thousand Oaks, California.
Dingley, S. (2008) Learning Curve, Facilities management resources, FMlink [online] http:/www.integratedfun.com (accessed 20 July 2014).
Fareo, D. and Ojo, O.O. (2013) ‘Impact of facilities on academic performance of students with special needs in mainstreamed public schools in Southwestern Nigeria’, Journal of Research in Special Educational Needs, Vol. 13, No. 2, pp.159–167.
Field, A. (2009) Discovering Statistics Using SPSS, 3rd ed., Sage, Thousand Oaks, California. IJFM (2010) A Model of Workplace Environment Satisfaction: A Survey Instrument, Facilities
management resources, FMLink [online] http://[email protected] (accessed 18 July 2014).
Comparative analysis of sustainable facilities planning and users’ satisfaction 55
JAMB (2010) Joint Admissions and Matriculations Board: Ebrochure [online] http://www.jambonline.org (accessed 10 July 2014).
Kline, T.J.B. (2005) Psychological Testing: A practical Approach to Design and Evaluation, Sage, Thousand Oaks, California.
Koppelman, J.D.C.L. (1975) ‘Urban planning and design criteria’, in Lawal (2000): Estate Development Practice in Nigeria, ILCo Books Publishers, Ile-Ife, Nigeria.
Krumm, P.J.M.M., Dewulf, G. and de Jonge, H. (1998) ‘Managing key resources and capabilities: pinpointing the added value of corporate real estate management’, Facilities, Vol. 16, Nos. 12/13, pp.372–379.
Lindholm, A-L. and Leva¨inen, K.I. (2006) ‘A framework for identifying and measuring value added by corporate real estate’, Journal of Corporate Real Estate, Vol. 8, No. 1, pp.38–46.
Marmolejo, F. (2007). Higher education facilities: Issues and trends. OECD. PEB Exchange 2007/1
NUC (2011) National Universities Commission: List of Accredited Universities in Nigeria [online] http://www.nuc.edu.ng. (accessed 20 July 2014).
Odiete, D.E. (1998) Application of Facilities Management in the Nigeria Private and Public Sectors, Nigerian Institution of Estate Surveyors and Valuers Conference [online] http://www.niesv.org.ng (accessed 20n July 2014).
Olesand, N. (2010) The Evolving Workspace, Facilities Management Resources, FMlink [online] http://[email protected] (accessed 23 July 2014).
Pallant, J. (2011) SPSS Survival Manual, 4th ed., Allen and Unwin, UK, NSW, Australia. Paxman, D. (2007) Facilities Management in Practice, IFPI Ltd, Kent UK. Rondeau, E.P., Brown, R.K. and Lapides, P.D. (1995) Facility Management, John Wiley & Sons,
New York, USA. Salonen, A. (2004) ‘Managing outsourced support services: observations from case study’,
Facilities, Vol. 22, Nos. 11/12, pp.317–322. Sekula, M. (2010) Strategic Facility Planning: Now More Important That Ever, Facilities
management resources, FMLink, Facilities Management Journal [online] http://www.FMJONLINE.com (accessed 17 October 2014).
Shayler, S. (2010) Calculating for Change, Facilities management resource, FM Link [online] http://[email protected] (accessed 17 October 2014).
Somorova, V. (2007) ‘The task of the facility management in real estate development’, Vadyba/Management M. Nv, Vol. 8, Nos. 3/4, pp.16–17.
Steiss, A. (2005) Strategic Facilities Planning: Capital Budgeting and Debt Administration [online] http://books.google.com.my/books?id=nRaV98I8bAsC&printsec=frontcover#v=onepage&q&f=false (accessed 18 October 2014).
UNM (2014) University of New Mexico Planning and Campus Development [online] http://iss.unm.edu/PCD/university-planning/capital-planning.html (assessed 14 May 2014).
Vossler, C.A. and Kerkvliet, J. (1999) ‘A criterion validity test of the contingent valuation method: comparing hypothetical and actual voting behaviors for a public referendum’, Journal of Environmental Economics and Management, Vol. 45, No. 3, pp.631–649.
Wauters, B. (2005) ‘The added value of facilities management: benchmarking work processes’, Facilities, Vol. 23, Nos. 3/4, pp.142–151.
Williams, B. (1996) ‘Cost-effectiveness facilities management: a practical approach’, Facilities, Vol. 14, Nos. 5/6, pp.26–38.
56 M. Adenipekun et al.
Appendix 1
Table A1 Percentage distribution of responses from students and staff of the universities on SFP
Wor
k en
viro
nmen
t as p
erce
ived
by
user
s (st
uden
t res
pond
ents
) SF
P sc
ale
UN
ILAG
LAU
TEC
H
JA
BU
Loca
tion
adva
ntag
e VG
(4
) G
(3
) F (2
) P (1
) TN
R
VG
(4)
G
(3)
F (2)
P (1)
TNR
VG
(4
) G
(3
) F (2
) P (1
) TN
R
1 Lo
catio
n ad
vant
age
of
faci
litie
s and
oth
ers
serv
ices
in m
eetin
g us
er’s
requ
irem
ents
26.7
46
.7
20.0
6.
6 30
9.6
45.2
45
.2
- 31
4.8
14.4
71
.4
9.4
21
2 D
eman
d fo
r the
use
of
faci
litie
s for
soci
al a
nd
econ
omic
func
tions
23.0
16
.6
3.4
3.4
30
6.
4 67
.9
22.5
3.
2 31
9.5
14.3
76
.2
- 21
Wor
k en
viro
nmen
t as p
erce
ived
by
user
s (st
aff r
espo
nden
ts)
FPA
C
UN
ILAG
LAU
TEC
H
JA
BU
Loca
tion
adva
ntag
e VG
(4
) G
(3
) F (2
) P (1
) TN
R
VG
(4)
G
(3)
F (2)
P (1)
TNR
VG
(4
) G
(3
) F (2
) P (1
) TN
R
1 Lo
catio
n ad
vant
age
of
faci
litie
s and
oth
er
serv
ices
in m
eetin
g us
er
need
s (LA
F)
25.9
59
.3
14.9
-
27
6.
6 47
.6
43.3
3.
3 30
3.2
25.9
57
.9
12.8
31
2 D
eman
d fo
r the
use
of
faci
litie
s for
soci
al a
nd
Econ
omic
func
tions
(D
UF)
54.5
38
.1
7.4
- 28
6.6
67
26.4
-
30
9.
6 38
.6
51.8
-
31
Not
es: V
G –
ver
y go
od; G
– g
ood;
F –
fair;
P–
poor
; TN
R –
tota
l num
ber o
f res
pond
ents
Comparative analysis of sustainable facilities planning and users’ satisfaction 57
Table A1 Percentage distribution of responses from students and staff of the universities on SFP (continued)
Wor
k en
viro
nmen
t as p
erce
ived
by
user
s (st
uden
t res
pond
ents
) SF
P sc
ale
UN
ILAG
LAU
TEC
H
JA
BU
Adeq
uacy
of f
acili
ties a
nd
func
tiona
l con
nect
ion
VG
(4)
G
(3)
F (2)
P (1)
TNR
VG
(4
) G
(3
) F (2
) P (1
) TN
R
VG
(4)
G
(3)
F (2)
P (1)
TNR
1 R
epai
ring
cond
ition
of
Faci
litie
s (R
CF)
19
.5
38.6
38
.6
3.3
30
12
.9
54.9
32
.2
- 31
13. 6
9.6
67.2
9.
6 21
2 M
aint
enan
ce a
dequ
acy
of F
acili
ties (
MA
F)
9.9
70.2
16
.5
3.3
30
9.
6 58
.2
32.2
-
31
9.
6 13
.6
76.8
-
21
3 U
se o
f fac
ilitie
s pla
n in
th
e m
anag
emen
t of
faci
litie
s (U
FP)
31.0
48
.3
13.8
6.
9 29
19.4
35
.5
41.9
3.
2 31
19. 2
9.6
61.6
4.
6 21
4 Fu
nctio
nal c
onne
ctio
n of
fa
cilit
ies t
o on
e an
othe
r w
ith re
spec
t to
user
’s
requ
irem
ent (
FCF)
27.6
41
.7
20.7
-
29
9.
7 41
.9
48.4
-
31
9.
6 4.
8 85
.1
- 21
5 Fu
nctio
nal d
esig
n re
latio
nshi
p of
faci
litie
s to
one
ano
ther
with
re
spec
t to
user
’s
requ
irem
ent (
FDR
)
17.2
69
.0
13.8
-
30
25
.8
48.4
25
.8
- 31
19. 2
4.8
76.8
-
21
6 A
dequ
acy
of fa
cilit
ies
and
othe
r ser
vice
s in
mee
ting
user
’s
requ
irem
ents
(AFF
)
48.3
48
.3
9.9
- 30
22.5
54
.9
19.4
3.
2 31
9.6
13.6
76
.8
- 21
7 Ef
fect
of f
acili
ties
cond
ition
on
user
’s
perf
orm
ance
(EFC
)
27.6
56
.6
9.9
2 30
12.9
58
.2
29.1
-
31
13
. 6 9.
6 72
.0
4.8
21
Not
es: V
G –
ver
y go
od; G
– g
ood;
F –
fair;
P–
poor
; TN
R–
tota
l num
ber o
f res
pond
ents
58 M. Adenipekun et al.
Table A1 Percentage distribution of responses from students and staff of the universities on SFP (continued)
Wor
k en
viro
nmen
t as p
erce
ived
by
user
s (st
aff r
espo
nden
ts)
SFP
scal
e U
NIL
AG
LA
UTE
CH
JABU
Adeq
uacy
VG
(4
) G
(3
) F (2
) P (1
) TN
R
VG
(4)
G
(3)
F (2)
P (1)
TNR
VG
(4
) G
(3
) F (2
) P (1
) TN
R
1 R
epai
ring
cond
ition
of
faci
litie
s (R
CF)
10
.7
46.5
42
.8
0 28
9.9
60.4
29
.7
0 30
9.6
51.7
35
.5
3.2
31
2 M
aint
enan
ce a
dequ
acy
of fa
cilit
ies (
MA
F)
10.7
71
.4
17.9
0
28
6.
9 55
.2
37.9
0
29
6.
9 56
.6
33.3
3.
2 30
3 U
se o
f fac
ilitie
s pla
n in
th
e m
anag
emen
t of
faci
litie
s (U
FP)
28.6
50
.0
21.4
0
28
0
63.3
36
.7
0 30
3.2
6.5
48.3
42
.031
4 Fu
nctio
nal c
onne
ctio
n of
fa
cilit
ies t
o on
e an
othe
r w
ith re
spec
t to
user
s re
quire
men
ts (F
CF)
21.4
61
.3
13.3
0
26
9.
9 48
.3
41.8
0
30
3.
2 42
.0
54.8
0
31
5 Fu
nctio
nal D
esig
n re
latio
nshi
p of
faci
litie
s to
one
ano
ther
FD
R)
7.1
82.2
10
.7
0 28
16.5
55
.9
27.6
0
30
6.
5 54
.8
35.5
3.
2 31
6 A
dequ
acy
of fa
cilit
ies
and
othe
r ser
vice
s in
mee
ting
user
nee
ds
(AFF
)
28.6
50
.0
17.9
3.
5 28
6.6
66.0
27
.6
0 30
29. 1
67.7
3.
2 0
31
7 Ef
fect
of f
acili
ties
cond
ition
on
user
pe
rform
ance
(EFC
)
35.8
50
.0
7.1
7.1
26
16
.5
63.7
16
.5
3.3
30
0
22.6
77
.4
0 31
Not
es: V
G –
ver
y go
od; G
– g
ood;
F –
fair;
P–
poor
; TN
R –
tota
l num
ber o
f res
pond
ents
Comparative analysis of sustainable facilities planning and users’ satisfaction 59
Table A1 Percentage distribution of responses from students and staff of the universities on SFP (continued)
Wor
k en
viro
nmen
t as p
erce
ived
by
user
s (st
uden
t res
pond
ents
) SF
P sc
ale
UN
ILAG
LAU
TEC
H
JA
BU
Resp
onse
tim
e VG
(4
) G
(3
) F (2
) P (1
) TN
R
VG
(4)
G
(3)
F (2)
P (1)
TNR
VG
(4
) G
(3
) F (2
) P (1
) TN
R
1 R
espo
nse
time
to
Bro
ken-
dow
n fa
cilit
ies
(RTD
F)
20.4
3.
1 9
46.6
30
16.0
29
.0
32.0
23
.031
0 14
.2
71.6
14
.221
2 Im
pact
of d
ysfu
nctio
nal
faci
litie
s on
the
oper
atio
n of
oth
er fa
cilit
ies
conn
ecte
d to
it (I
MD
F)
10.5
33
.0
46.6
9.
9 30
16.0
42
.0
42.0
0
31
0
14.2
78
.7
7.1
21
3 Im
pact
of f
acili
ties
cond
ition
on
user
s’
wor
k-ef
ficie
ncy
(IM
FWE)
42.9
46
.6
10.5
0
30
13
.0
42.0
38
.5
6.5
31
14
. 2 14
.2
71.6
0
21
Not
es: V
G –
ver
y go
od; G
– g
ood;
F –
fair;
P–
poor
; TN
R –
tota
l num
ber o
f res
pond
ents
60 M. Adenipekun et al.
Table A1 Percentage distribution of responses from students and staff of the universities on SFP (continued)
Wor
k en
viro
nmen
t as p
erce
ived
by
user
s (st
aff r
espo
nden
ts)
FPAC
U
NIL
AG
LA
UTE
CH
JABU
Resp
onse
tim
e VG
(4
) G
(3
) F (2
) P (1
) TN
R
VG
(4)
G
(3)
F (2)
P (1)
TNR
VG
(4
) G
(3
) F (2
) P (1
) TN
R
1 R
espo
nse
time
to
dysf
unct
iona
l fac
ilitie
s (R
TDF)
25.0
14
.3
35.7
25
.0
28
10
.5
46.6
36
.7
6.6
30
3.
2 6.
5 48
.0
42.3
31
2 Im
pact
of d
ysfu
nctio
nal
faci
litie
s on
the
op
erat
ion
of o
ther
fa
cilit
ies c
onne
cted
to it
(I
MD
F)
11.1
40
.7
44.4
3.
8 27
10.5
46
.6
39.6
3.
3 30
23. 0
29.0
48
.0
- 31
3 Im
pact
of f
acili
ties
cond
ition
on
user
s wor
k ef
ficie
ncy
(IM
FWE)
44.4
51
.8
3.8
0 27
9.9
69.3
19
.8
0 30
42. 3
32.0
25
.7
- 31
Not
es: V
G –
ver
y go
od; G
– g
ood;
F –
fair;
P–
poor
; TN
R –
tota
l num
ber o
f res
pond
ents
Comparative analysis of sustainable facilities planning and users’ satisfaction 61
Appendix 2
Table A2 Table of frequency distribution in the three universities
Faci
litie
s pla
nnin
g as
sess
men
t cri
teri
a (s
ub-v
aria
bles
)
LAF
DU
F RC
FM
AFU
FPFC
FFD
RAF
FEF
CRT
DF
IMD
F IM
FWE
Tota
l
UN
ILA
G –
satis
fact
ory
Cou
nt
45
55
34
48
45
46
52
50
47
19
40
41
522
UN
ILA
G –
not
satis
fact
ory
Cou
nt
12
5 24
10
14
11
6
8 9
39
17
16
169
LAU
TEC
H –
satis
fact
ory
Cou
nt
31
45
42
39
36
33
45
46
46
31
35
41
470
LAU
TEC
H –
not
satis
fact
ory
Cou
nt
28
16
19
21
25
18
16
15
15
30
26
7 23
6 JA
BU
– sa
tisfa
ctor
y C
ount
13
19
24
24
6
20
24
35
12
9 19
29
23
4
The
thre
e SW
un
iver
sitie
s
JAB
U-n
ot sa
tisfa
ctor
y C
ount
34
34
32
32
36
30
32
32
31
30
36
23
38
2 To
tal
Cou
nt
163
172
175
174
162
158
175
186
160
158
173
157
2,01
3
Not
es: T
he th
ree
SW u
nive
rsiti
es*
sust
aina
ble
faci
litie
s pla
nnin
g sc
ale
(sub
-var
iabl
es) c
ross
tabu
latio
n
62 M. Adenipekun et al.
Appendix 3
Table A3 The three SW universities’ facilities planning assessment criteria (sub-variables) cross tabulation
Faci
litie
s pla
nnin
g as
sess
men
t cri
teri
a (s
ub-v
aria
bles
)
LAF
DU
F RC
F M
AF
UFP
FC
F FD
R AF
F EF
C
RTD
F IM
DF
IMFW
E To
tal
Cou
nt
45
55
34
48
45
46
52
50
47
19
40
41
522
Expe
cted
co
unt
42.2
45
.1
45.3
45
.1
42.0
40
.9
45.3
48
.2
41.4
40
.9
44.8
40
.7
522.
0
% w
ithin
the
thre
e SW
un
iver
sitie
s
8.6%
10
.5%
6.
5%
9.2%
8.
6%
8.8%
10
.0%
9.
6%
9.0%
3.
6%
7.7%
7.
9%
100.
0%
% w
ithin
fa
cilit
ies
plan
ning
as
sess
men
t cr
iteria
(sub
–va
riabl
es)
27.6
%31
.6%
19
.4%
27
.6%
27
.8%
29
.1%
29
.7%
26
.9%
29.4
%12
.0%
23
.1%
26
.1%
25
.9%
UN
ILA
G –
sa
tisfa
ctor
y C
AT
‘A’
Std.
resi
dual
.4
1.
5 –1
.7
.4
.5
.8
1.0
.3
.9
–3.4
–.
7 .1
Cou
nt
12
5 24
10
14
11
6
8 9
39
17
16
171
Expe
cted
co
unt
13.8
14
.8
14.9
14
.8
13.7
13
.4
14.9
15
.8
13.6
13
.4
14.7
13
.3
171.
0
% w
ithin
the
thre
e SW
un
iver
sitie
s
7.0%
2.
9%
14.0
%
5.8%
8.
2%
6.4%
3.
5%
4.7%
5.
3%
22.8
%
9.9%
9.
4%
100.
0%
% w
ithin
fa
cilit
ies
plan
ning
as
sess
men
t cr
iteria
(sub
–va
riabl
es)
7.4%
2.
9%
13.7
%
5.7%
8.
6%
7.0%
3.
4%
4.3%
5.
6%
24.7
%
9.8%
10
.2%
8.
5%
The
thre
e SW
un
iver
sitie
s
UN
ILA
G –
no
t sa
tisfa
ctor
y C
AT
‘B’
Std.
resi
dual
–.
5 –2
.5
2.4
–1.2
.1
–.
7 –2
.3
–2.0
–1
.2
7.0
.6
.7
Comparative analysis of sustainable facilities planning and users’ satisfaction 63
Table A3 The three SW universities’ facilities planning assessment criteria (sub-variables) cross tabulation (continued)
Faci
litie
s pla
nnin
g as
sess
men
t cri
teri
a (s
ub-v
aria
bles
)
LAF
DU
F RC
F M
AF
UFP
FC
F FD
R AF
F EF
C
RTD
F IM
DF
IMFW
E To
tal
Cou
nt
31
45
42
39
36
33
45
46
46
31
35
41
470
Expe
cted
co
unt
38.0
40
.6
40.8
40
.6
37.8
36
.9
40.8
43
.4
37.3
36
.9
40.4
36
.6
470.
0
% w
ithin
the
thre
e SW
un
iver
sitie
s
6.6%
9.
6%
8.9%
8.
3%
7.7%
7.
0%
9.6%
9.
8%
9.8%
6.
6%
7.4%
8.
7%
100.
0%
% w
ithin
fa
cilit
ies
plan
ning
as
sess
men
t cr
iteria
(sub
–va
riabl
es)
19.0
%25
.9%
24
.0%
22
.4%
22
.2%
20
.9%
25
.7%
24
.7%
28
.7%
19
.6%
20
.2%
26
.1%
23
.3%
LAU
TEC
H –
sa
tisfa
ctor
y C
AT
‘A’
Std.
resid
ual
–1.1
.7
.2
–.
2 –.
3 –.
6 .7
.4
1.
4 –1
.0
–.8
.7
C
ount
28
16
19
21
25
18
16
15
15
30
26
7
236
Expe
cted
co
unt
19.1
20
.4
20.5
20
.4
19.0
18
.5
20.5
21
.8
18.7
18
.5
20.3
18
.4
236.
0
% w
ithin
the
thre
e SW
un
iver
sitie
s
11.9
%6.
8%
8.1%
8.
9%
10.6
%
7.6%
6.
8%
6.4%
6.
4%
12.7
%
11.0
%
3.0%
10
0.0%
% w
ithin
fa
cilit
ies
plan
ning
as
sess
men
t cr
iteria
(sub
–va
riabl
es)
17.2
%9.
2%
10.9
%
12.1
%
15.4
%
11.4
%
9.1%
8.
1%
9.4%
19
.0%
15
.0%
4.
5%
11.7
%
The
thre
e SW
un
iver
sitie
s
LAU
TEC
H –
no
t sa
tisfa
ctor
y C
AT
‘B’
Std.
resid
ual
2.0
–1.0
–.
3 .1
1.
4 –.
1 –1
.0
–1.5
–.
9 2.
7 1.
3 –2
.7
64 M. Adenipekun et al.
Table A3 The three SW universities’ facilities planning assessment criteria (sub-variables) cross tabulation (continued)
Faci
litie
s pla
nnin
g as
sess
men
t cri
teri
a (s
ub-v
aria
bles
)
LAF
DU
F RC
F M
AF
UFP
FC
F FD
R AF
F EF
C
RTD
F IM
DF
IMFW
E To
tal
Cou
nt
13
19
24
24
6 20
24
35
12
9
19
29
234
Expe
cted
co
unt
18.9
20
.2
20.3
20
.2
18.8
18
.3
20.3
21
.6
18.6
18
.3
20.1
18
.2
234.
0
% w
ithin
the
thre
e SW
un
iver
sitie
s
5.6%
8.
1%
10.3
%
10.3
%
2.6%
8.
5%
10.3
%
15.0
%
5.1%
3.
8%
8.1%
12
.4%
10
0.0%
% w
ithin
fa
cilit
ies
plan
ning
as
sess
men
t cr
iteria
(sub
–va
riabl
es)
8.0%
10
.9%
13
.7%
13
.8%
3.
7%
12.7
%
13.7
%
18.8
%
7.5%
5.
7%
11.0
%
18.5
%
11.6
%
JAB
U –
sa
tisfa
ctor
y C
AT
‘A’
Std.
resid
ual
–1.4
–.
3 .8
.8
–3
.0
.4
.8
2.9
–1.5
–2
.2
–.2
2.5
C
ount
34
34
32
32
36
30
32
32
31
30
36
23
38
2 Ex
pect
ed
coun
t 30
.9
33.0
33
.2
33.0
30
.7
30.0
33
.2
35.3
30
.3
30.0
32
.8
29.8
38
2.0
% w
ithin
the
thre
e SW
un
iver
sitie
s
8.9%
8.
9%
8.4%
8.
4%
9.4%
7.
9%
8.4%
8.
4%
8.1%
7.
9%
9.4%
6.
0%
100.
0%
% w
ithin
fa
cilit
ies
plan
ning
as
sess
men
t cr
iteria
(sub
–va
riabl
es)
20.9
%19
.5%
18
.3%
18
.4%
22
.2%
19
.0%
18
.3%
17
.2%
19
.4%
19
.0%
20
.8%
14
.6%
19
.0%
The
thre
e SW
un
iver
sitie
s
JAB
U –
not
sa
tisfa
ctor
y C
AT
‘B’
Std.
resid
ual
.6
.2
–.2
–.2
1.0
.0
–.2
–.5
.1
.0
.6
–1.2
Cou
nt
163
174
175
174
162
158
175
186
160
158
173
157
2,01
5 ex
pect
ed
coun
t 16
3.0
174.
0 17
5.0
174.
0 16
2.0
158.
0 17
5.0
186.
0 16
0.0
158.
0 17
3.0
157.
0 2,
015.
0To
tal
% w
ithin
the
thre
e SW
un
iver
sitie
s
8.1%
8.
6%
8.7%
8.
6%
8.0%
7.
8%
8.7%
9.
2%
7.9%
7.
8%
8.6%
7.
8%
100.
0%
Comparative analysis of sustainable facilities planning and users’ satisfaction 65
Appendix 4
Exhibit 1
Table A4 Pearson’s chi-square results
Chi-square tests Value df Asymp. sig. (two-sided) Pearson chi-square 167.171a 55 .000 Likelihood ratio 160.777 55 .000 Linear-by-linear association .006 1 .937 N of valid cases 2,015
Note: a0 cells (0.0%) have expected count less than 5. The minimum expected count is 13.32.
Exhibit 2
Table A5 Symmetric measures of Crammer’s V
Symmetric measures Value Approx. sig. Nominal by nominal Phi .288 .000
Cramer’s V .129 .000 Contingency coefficient .277 .000
N of valid cases 2,015