Embed Size (px)
Citation preview
COMPARATIVE ANALYSIS OF STAIN REMOVAL
METHODS USED ON COTTON FABRICS IN SOME
SELECTED HOSPITALS IN NIGERIA
By
Adekunle Bolarinwa AJAPONNA, B.Sc. Textile Science & Technology
(A.B.U. ZARIA) 1998
M.Sc./SCIE/11832/2010-2011
A THESIS SUBMITTED TO THE SCHOOL OF POSTGRADUATE STUDIES,
AHMADU BELLO UNIVERSITY, ZARIA
IN PARTIAL FULFILLMENT OF THE REQUIREMENTS FOR THE AWARD
OF A
MASTER DEGREE IN TEXTILE SCIENCE & TECHNOLOGY
DEPARTMENT OF TEXTILE SCIENCE & TECHNOLOGY
FACULTY OF SCIENCES
AHMADU BELLO UNIVERSITY, ZARIA
NIGERIA
APRIL, 2014
ii
DECLARATION
I hereby declare that the work in this research entitled “Comparative Analysis of Stain
Removal Methods used on Cotton Fabrics in some selected Hospitals in Nigeria” has been
conducted solely by me under the supervision of Dr. A. Danladi and Dr. A. Kogo in the
Department of Textile Science and Technology. The information derived from the literature has
been duly acknowledged in the text and a list of references provided. No part of this thesis was
previously presented for another degree or diploma at this or any other institution.
Adekunle Bolarinwa Ajaponna
-------------------------------------- --------------------------- ---------------------------
Name of Student Signature Date

iii
CERTIFICATION
This thesis, entitled “COMPARATIVE ANALYSIS OF STAIN REMOVAL METHODS
USED ON COTTON FABRICS IN SOME SELECTED HOSPITALS IN NIGERIA” by
Adekunle Bolarinwa AJAPONNA, meets the regulations governing the award of degree of
Master of Science (M.Sc.) of Ahmadu Bello University, Zaria and is approved for its
contribution to knowledge and literary presentation.
Dr. Abdullahi Danladi
………………………………….. ………………………. ……………………….
Chairman Supervisory Committee Signature Date
Dr. Abdullahi A. Kogo
…………………………………... ………………………… . . ……………….
Member Supervisory Committee Signature Date
Dr. Abdullahi Danladi
……………………………......... ……………………… ………………………
Head of Department Signature Date:
Prof. Adebayo A Joshua
………………………………… ..…………………….. .……………………
Dean, School of Postgraduate Studies Signature Date

iv
DEDICATION
This research is dedicated foremost to God Almighty who gave me the strength,
knowledge and inspiration regarding this work.
This research work is equally dedicated my dear mother late Mrs. L. L. Alabi Ajaponna
and my father in-law late Mr. P. O. Ucherewe for their affectionate love when alive. May their
gentle souls rest in perfect peace.
v
ACKNOWLEDGEMENT
I sincerely express my profound gratitude to God Almighty who gave me the privilege
and ability to write this research.
My gratitude also goes to my supervisor Dr. A. Danladi who has inspired and gave me
that push even when it appears difficult for me to take a step further. Thank you for your
patience, guidance and assistance.
My warm and hearty appreciation goes to my darling wife, for her entire commitment
and support (emotionally, spiritually, and financially) to enable me complete this course of study
with gladness. I am deeply grateful for this since not much can be accomplished alone.
My special thanks goes to Mr. Omata and Mr. Okeji who have given their very best in
guiding and assisting me in the course of my laboratory work.
I appreciate my H.O.D., Department of Laundry & Linen Services, A.B.U. Teaching
Hospital, Alh. T.S. Abdullahi for his timeless support and patience all through this programme.
My thanks go to my siblings- Deji, Gbolani, Goke, Sanya & Kemi. Also my colleague in
the office, Mr. Enoch Adukwu for his support and encouragement all the way.
My appreciation also goes to the Management of A.B.U. Teaching Hospital, Zaria for
given me the approval to embark on this programme.
Finally, my deepest thanks goes to my classmates in the course of this programme, God bless
you all.

vi
ABSTRACT
Some effect of repeated laundering processes with different practical formulations of stain
removal methods of blood and urine stains from 3 healthcare institutions (Ahmadu Bello
University Teaching Hospital- Zaria, Aminu Kano Teaching Hospital- Kano and National
Orthopedic Hospital- Kano) were carried out. Physical fabric properties such as breaking load,
breaking extension, percentage shrinkage, moisture content and moisture regain as well as colour
fastness were analyzed with the hospital white (bed-linen) and green theatre linen made from
100% woven cotton fabrics. Analyses of the sample after the 3rd, 6th and 9th washing cycles
were investigated. The colour change in shades were evaluated from visual observation using the
AATCC Evaluation Procedure 2 Gray Scale for Assessing Staining, which showed a yellowing
effect on the white hospital linen (ABUTH) as a result of the continuous bleaching action on the
repeated blood stained linen with a change in colour of 4 after the 9th
wash. The breaking load
values increased after every washing for all samples analyzed with the ABUTH hospital linen
showing the highest breaking load values up to the 9th
wash. The percentage shrinkage values
also showed an increase in the shrinkage properties up to the 9th
wash for all sample analyzed
with the least shrinkage properties from the blood treated samples of the ABUTH hospital linen.
The moisture content and moisture regain showed the highest percentage values with the blood
treated samples of the ABUTH up to the 9th
laundering. These attributes, specifically on the
blood treated hospital linen from ABUTH amongst other samples analyzed showed an unequal
property along the length and breadth of the fabric to a point of which the fabric stability and
functionality becomes compromised thereby degrading the fabric. This study may help to
improve the blood stain removal methods and fabric performances in hospital laundering.
vii
TABLE OF CONTENT
Title Page - - - - - - - - - i
Declaration - - - - - - - - - ii
Certification - - - - - - - - - iii
Dedication - - - - - - - - - iv
Acknowledgement - - - - - - - - v
Abstract - - - - - - - - - vi
Table of Content - - - - - - - - vii
List of Figures - - - - - - - - - xi
List of Tables - - - - - - - - - xii
CHAPTER ONE
1.0 INTRODUCTION- - - - - - - - 1
1.1 The washing process (Laundering Regime) - - - 1
1.2 Soil removal from fabrics - - - - - - 2
1.2.1 Absorbing - - - - - - - - 2
1.2.2 Washing in water - - - - - - - 2
1.2.3 Solvents - - - - - - - - 2
1.2.4 Bleaching - - - - - - - - 3
1.3 Factors affecting soil removal - - - - - 3
1.3.1 Temperature of operation - - - - - - 3
1.3.2 Duration of each step in the washing systems - - - 4

viii
1.3.3 Concentration of liquid bath detergent in washing systems - - 4
1.4 Detergents - - - - - - - - 4
1.4.1 Types of Detergents - - - - - - - 5
1.5 Cotton (Natural Fibre)- - - - - - - 8
1.5.1 Physical and mechanical properties of cotton fabrics- Physical Properties- 8
1.5.2 Mechanical properties - - - - - - - 10
1.5.3 Tear Test - - - - - - - - 12
1.5.4 Abrasion resistance - - - - - - - 13
1.5.5 Fabric drape - - - - - - - - 14
1.6 Stains/soils - - - - - - - - 15
1.6.1 Blood - - - - - - - - - 15
1.6.2 Urine - - - - - - - - - 16
1.7 Statement of the research problem - - - - - 16
1.8 Justification of the work - - - - - - 17
1.9 Research objectives - - - - - - - 18
1.10 Scope of study- - - - - - - - 18
CHAPTER TWO
2.0 LITERATURE REVIEW - - - - - - 19

ix
CHAPTER THREE
3.0 MATERIALS AND METHODS - - - - - 21
3.1 Materials - - - - - - - - 21
3.1.1 Chemicals - -- - - - - - - 21
3.1.2 Apparatus and Equipment - - - - - - 21
3.2 Methods - - - - - - - - 22
3.2.1 Laundering Regime 1 - - - - - - - 22
3.2.2 Stain Removal Methods - - - - - - 22
3.2.3 Laundering Regime 2 - - - - - - - 23
3.3 Determination of Fabric Properties - - - - 23
3.4 Determination of Moisture Content & Moisture Regain
(Physical Properties) - - - - - - - 24
3.5 Determination of Percentage Shrinkage
(Physical Properties) - - - - - - - 24
3.6 Determination of Standard Fastness - - - - 25
CHAPTER FOUR
4.0 RESULTS AND DISCUSSION - - - - - 26
4.1 Effects of washing cycles on breaking strength- Hospital linen - 26
4.2 Effects of washing cycles on breaking extension- Hospital linen - 31
4.3 Effects of washing cycles on breaking strength- Green theatre linen- 35
4.4 Effects of washing cycles on breaking extension- Green theatre linen 39

x
4.5 Effects of moisture content and moisture regain on hospital linen 43
4.6 Effects of moisture content and moisture regain on green theatre linen 46
4.7 Effects of percentage shrinkage on hospital linen - - - 49
4.8 Effects of percentage shrinkage on green theatre linen - - 50
CHAPTER FIVE
5.0 CONCLUSION AND SUMMARY - - - - - 59
5.1 Recommendation - - - - - - - - 62
REFERENCES - - - - - - - - - 63
APPENDICES- - - - - - - - - 66

xi
LIST OF FIGURES
Fig. 3.3.1: Effect of 3rd
wash of hospital dry and wet linen on breaking load - - 26
Fig. 3.3.2: Effect of 6th
wash of hospital dry and wet linen on breaking load- - 27
Fig, 3.3.3: Effect of 9th
wash of hospital dry and wet linen on breaking load - - 28
Fig. 3.3.4: Effect of 3rd
wash of hospital dry and wet linen on breaking extension - 31
Fig. 3.3.5: Effect of 6th
wash of hospital dry and wet linen on breaking extension - 32
Fig. 3.3.6: Effect of 9th
wash hospital dry and wet linen on breaking extension - 33
Fig. 3.3.7: Effect of 3rd
wash of theatre dry and wet linen on breaking load - - 35
Fig. 3.3.8: Effect of 6th
wash of theatre dry and wet linen on breaking load - - 36
Fig. 3.3.9: Effect of 9th
wash of theatre dry and wet linen on breaking load - - 37
Fig. 3.3.10: Effect of 3rd
wash of green theatre dry and wet linen on breaking extension 39
Fig. 3.3.11: Effect of 6th
wash of green theatre dry and wet linen on breaking extension 40
Fig. 3.3.12: Effect of 9th
wash of green theatre dry and wet linen on breaking extension 41
Fig. 3.4.1: Effect of moisture content and moisture regain for 3rd
wash of hospital linen
on percentage of moisture - - - - - - - 43
Fig. 3.4.2: Effect of moisture content and moisture regain for 6th
wash of hospital linen
on percentage of moisture - - - - - - - 44
Fig. 3.4.3: Effect of moisture content and moisture regain for 9th
wash of hospital linen
on percentage of moisture - - - - - - - 45
Fig. 3.4.4: Effect of moisture content and moisture regain of green theatre linen - 46
Fig. 3.5.1: Effect of treated and untreated hospital linen on percentage shrinkage - 49
Fig. 3.5.2: Effect of treated and untreated green theatre linen on percentage shrinkage- 50

xii
LIST OF TABLES
Table 3.3.1: Breaking load test for 3rd
wash (dry sample) - hospital linen - - 66
Table 3.3.2: Breaking load test for 3rd
wash (wet sample) – hospital linen - - 67
Table 3.3.3: Breaking load test for control sample (dry and wet sample) – hospital linen- 68
Table 3.3.4: Breaking load test for 6th
wash (dry sample) –hospital linen - - 69
Table 3.3.5: Breaking load test for 6th
wash (wet sample) – hospital linen - - 70
Table 3.3:6: Breaking load test for 9th
wash (dry sample) – hospital linen - - 71
Table 3.3.7: Breaking load test for 9th
wash (wet sample) – hospital linen - - 72
Table 3.3.8: Breaking load test for 3rd
wash (dry sample) – green theatre linen- - 73
Table 3.3.9: Breaking load test for 3rd
wash (wet sample) – green theatre linen- - 74
Table 3.3.10: Breaking load test for control sample (dry & wet samples) - green theatre
linen - - - - - - - - - 75
Table 3.3.11: Breaking load test for 6th
wash (dry sample) – green theatre linen - 76
Table 3.3.12: Breaking load test for 6th
wash (wet sample) – green theatre linen - 77
Table 3.3.13: Breaking load test for 9th
wash (dry sample) – green theatre linen - 78
Table 3.3.14: Breaking load test for 9th
wash (wet sample) – green theatre linen - 79
Table 3.4.1: Moisture content and moisture regain for hospital linen at different washing
cycles - - - - - - - - - 79
Table 3.4.2: Moisture content and moisture regain for green theatre linen at different
washing cycles - - - - - - - - 83
Table 3.6.1: Colour fastness result I.S.O (1) of the 3rd
, 6th
and 9th
washings for hospital
linen and theatre linens - - - - - - - 52

xiii
CHAPTER ONE
1.0 INTRODUCTION
Removal of stains from clothes is necessary for proper care of the clothes and to
increase the lifespan of the fabric. Healthcare linen can be subjected to a huge range of
staining, including food, blood, urine, sweat and other body excretions so the laundry‟s
success in producing clean, stain-free linen is a testimony to the effectiveness of the
applied washing regimes (Ian, 2010).
1.1 The Washing Process (Laundering Regime)
The washing or cleaning process in a typical detersive system usually consists of
the following sequence of operations (Omole, 1994);
I. The soiled substrate (fabric) is immersed or otherwise introduced into a large
excess of the bath liquor. Sufficient liquor is used to provide a thick layer over the
whole surface of the substrate. During this stage, air is displaced from the soil and
substrate i.e. they become wetted by the bath.
II. The system is subjected to mechanical agitation, for example, rubbing or shaking,
this provides shearing action which aids in separating soils and other dirt‟s from
the substrate and dispersing them in the bath.
III. The fouled bath, carrying the removed soil and dirt is drained, wiped, squeezed or
otherwise removed from the substrate.
IV. The substrate is rinsed free of the remaining fouled bath. This rinsing step can be
quite important in determining the final cleanliness of the substrate.
V. The clean substrate is dried or otherwise brought to the desired finished state.

xiv
1.2 Soil Removal from Fabrics
All soils on fabrics should be treated gently as hard rubbing or wrong application
of cleaning fluid can ruin the cloth. If the cause of the soil and the type of fabric on which
it has occurred are known, it is more likely to be able to remove the soil successfully
without damaging the fabric (Peter, 1993).
There are four basic methods of soil removing from fabric:
i. Absorbing
ii. Washing in water
iii. Use of solvents
iv. Bleaching
1.2.1 Absorbing
This is used to deal with wet soils spilled on the fabric and also to get rid of
greasy particles on fur and other fabrics that cannot be washed. Typical absorbents are
salts (absorbs urine and fruit-juice soil from carpets etc.) and French chalk or talcum
(absorb grit and dirt from fur etc.).
1.2.2 Washing in water
Soil must be removed immediately with cold water; hot water should be avoided
(i.e. cause soil to be more strongly held onto the fabric). The whole fabric is soaked in
soap solution for washing.
1.2.3 Solvents
Solvents are used to remove soils caused by grease or oil. Many solvents can be
employed and the most common ones being used are trichloroethane (sold as spot
remover under various trade names), carbon tetrachloride, (white spirit, Acetone, acetic

xv
acid, white vinegar, oxalic acid, lemon juice or 50% solution of citric or tartaric acid, fat,
margarine or butter) used to soften tar or oil.
1.2.4 Bleaching
Two types of bleaches are employed in dirt removal. They are oxidizing and
reducing bleaches. Oxidizing bleaches are the ones which destroy dirt‟s by oxidation,
while reducing of bleaches destroy dirt‟s by reduction. Examples of oxidizing bleaches
are hydrogen peroxide and chlorine bleach (usually containing sodium hypochlorite).
While example of reducing bleaches is sulphurdioxide; bleaches of this type are mainly
used by laundries and dry-cleaners (Peter, 1993).
1.3 Factors affecting Soil Removal
Before considering practical washing systems (which are usually quite complex
and difficult to resolve), it is helpful to outline the various factors which determine the
degree of soil removal, and also to see how soil is removed in various simplified model
washing system (Perdue, 1970). These factors are:
i. Temperature of operation.
ii. Duration of each step in the washing system.
iii. Type of degree of mechanical action used.
iv. Concentration of liquid bath detergents in the washing systems.
1.3.1 Temperature of Operation
Practical washing with materials shows that at high temperature of washing at
long cycle‟s causes excessively hard wrinkles and reduces the crease shedding properties.
Some experiments carried out showed that the effect of temperature on various types of
fabrics at a particular concentration of soap and detergent was done keeping

xvi
concentration and time constant. E.g. Increase in temperature increases the degree of
mobility of the soap particles thus increasing the chances of breaking up the dirt‟s or soils
(Perdue,1970).
1.3.2 Duration of Each Step in the Washing Systems
This is the time taken for the soil to be released from the fabric at a particular
concentration of soap and detergent solution, Keeping temperature and concentration
constants.
1.3.3 Concentration of Liquid Bath Detergent in Washing Systems
This is the percentage of detergents used to remove soil on each of the soil fabrics
by varying the concentration and keeping time of washing and temperature of washing
constants. The importance of concentration determination or detergency is that, it helps to
know the exact quantity of detergents to be used in washing processes, when the
quantities of the fabrics are known (Perdue, 1970).
1.4 Detergents
A detergent is a cleansing agent which exerts cleansing action on a material by
helping the water to soak into the material quickly to make washing easier. The dirt is
divided into little particles by the detergent and this can be more easily washed out of the
material. The detergent also keeps the dirt suspended in the water and prevents it from
settling on the fabric again. Any material which exerts a cleansing action is referred to as
a detergent; thus water alone or indeed a solvent such as perchloroethylene can be called
a detergent. Soap is the product of the reaction between caustic soda and a fat by a
process known as „saponification‟ while synthetic detergents are manufactured from
organic chemicals, most of which come from petroleum sources.
xvii
1.4.1 Types of Detergents
There are different groups in which detergents can be classified, namely anionic
detergents, cationic detergents, non-ionic detergents, synthetic or soapless detergents.
The most important thing is to be able to select a suitable detergent for a particular
purpose because if the wrong detergent is used for a particular fabric, it could damage it,
ruin the colours or not clean it efficiently.
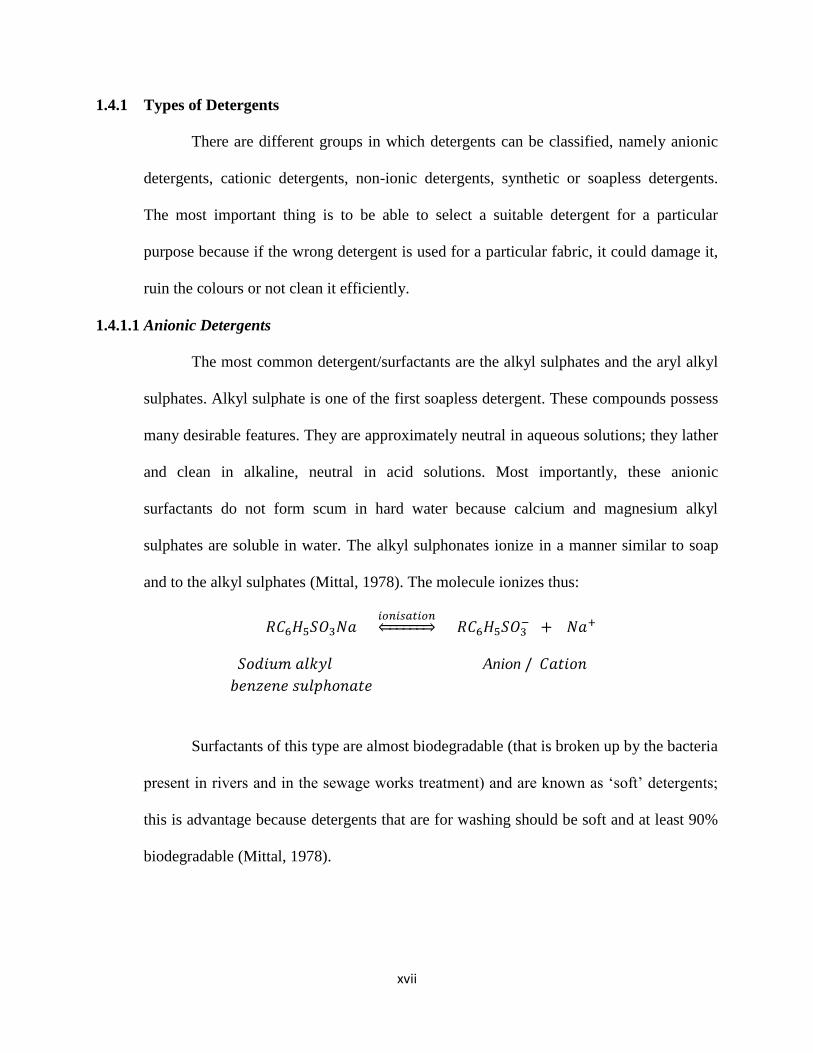
1.4.1.1 Anionic Detergents
The most common detergent/surfactants are the alkyl sulphates and the aryl alkyl
sulphates. Alkyl sulphate is one of the first soapless detergent. These compounds possess
many desirable features. They are approximately neutral in aqueous solutions; they lather
and clean in alkaline, neutral in acid solutions. Most importantly, these anionic
surfactants do not form scum in hard water because calcium and magnesium alkyl
sulphates are soluble in water. The alkyl sulphonates ionize in a manner similar to soap
and to the alkyl sulphates (Mittal, 1978). The molecule ionizes thus:
Anion
Surfactants of this type are almost biodegradable (that is broken up by the bacteria
present in rivers and in the sewage works treatment) and are known as „soft‟ detergents;
this is advantage because detergents that are for washing should be soft and at least 90%
biodegradable (Mittal, 1978).

xviii
1.4.1.2 Cationic Detergents
These materials are cation active that is to say that they ionize or dissociate, they
do not hydrolyze and can be used effectively in hard water.
Ionization of this type of compound takes place as follows:
They have disinfecting powers and are sometimes used, especially in hospital
launderettes for disinfecting articles which cannot be subjected to high temperatures
(Mittal, 1978). Due to this, they are added to the final rinse of the washing process.
Another possible application for cationic substances in the laundry is as textile
softening agents. „Softening‟ in this context refers to the effect of producing a more bulky
fabric with a softer handle than one, which has not been so treated. When used as
softening agent the cationic substances are again added to the final rinse of the washing
process, but in this case there is no need of restriction on the type of detergent used in the
washes (Mittal, 1978).
1.4.1.3 Non Ionic Detergent
As the name implies these material do not ionize and therefore are extremely
stable under any condition likely to be encountered in laundry processing, making them
good wetting and emulsifying agents for stain removal processes (Barry, 1998).
1.4.1.4 Synthetic or Soap Less Detergents
During the Second World War when there was a shortage of oils and fats in Great
Britain a considerable amount of work was done on the production of synthetic detergent
xix
compounds. It was at this time these new detergents came into use in package domestic
washing powders and as a result the general public became aware of the word detergent
(Barry, 1998).
Unfortunately, modern advertisement with its somewhat outrageous claim has
resulted in the public believing that what package detergent provides is the magical
answer to successful washing of all types of textile materials. This often produces
disastrous result, which sometimes land in the hands of the professional launderer. Worse
still, the launderer is expected to work this „magic‟ on wholly suitable textile materials.
Soapless detergents do not react with minerals in hard water. They are formulated
with such ingredients as surfactants, which suspend dirt particles with reduced suds,
builders, which prevent scum formation.
1.4.1.5 Surface Active Agent
These are compounds which when dissolved in water; in a very small amount
considerably reduce the surface tension of water with respect to air or other substances.
They are sometimes called surfactants. They have an organic body made of long
molecular chains, which confer, to its nature. At the end of the body is a hydrophilic
head. It includes soluble detergent in liquid medium, dispersing agents, foaming agents in
penetrating agent and emulsifying agent (Encyclopedia, 1990)
(a) Dispersing agents: increase the stability of the dispersion of one liquid in another.
(b) Emulsifying agent: increase the stability of dispersion of two immiscible liquid
phases.
(c) Foaming agents: increase the stability of suspension of gas bubbles in a liquid
medium.

xx
(d) Penetrating agents: increase the penetration of liquid medium into porous
materials.
(e) Wetting agents: increase the spreading of a liquid medium on the surface (Mittal,
1978).
1.5 Cotton (Natural Fibre)
Cotton is the most versatile and the most used textile fibres. It is the cheapest
natural fibres used in clothing applications. Cotton is attached to the seed of certain plant
of genius „Gossypium‟. Cellulose regardless of source has been shown to consist of
carbon (44.4%), hydrogen (6.2%), and oxygen (49.4%) which corresponds to an empirical
formular of (C₆H₁₂O₅)n thus, classifying it as a carbohydrate (Peter, 1993). Investigations
have shown that hydrolysis of cellulose gives high yield of the sugar D-glucose [1] the
yield of glucose varying with the conditions of hydrolysis. The long linear chain of
cellulose permits the (-OH) group on each hydro glucose to interact with the hydroxyl
group of adjacent chains through hydrogen bonding and van der waal attractions. These
strong intermolecular forces between chains, coupled with the high linearity of the
molecule, account for the crystalline nature of cellulose fibre. All cellulosic fibre are
hydrophilic (water attracting) in character, they crease badly when washed except when
treated with crease resist finish (Peter, 1993)
1.5.1 Physical and Mechanical Properties of Cotton Fabrics- Physical Properties
1.5.1.1 Fabric Thickness
It might be expected that the thickness of a fabric is one of its basic properties
giving information on its warmth heaviness or stiffness in use. In practice, thickness
measurement is rarely used as they are very sensitive to pressure used in the

xxi
measurement. Instead fabric weight per unit area is used commercially as an indicator of
thickness.
Besides fibres, a fabric encloses a large amount of air, which among other things,
is responsible for its good thermal insulation properties. When a fabric is compressed,
the space between the fibers is decreased until they eventually come into contact with one
another. The stages in the deformation of a fabric have been identified (Matsudaira and
Qin, 1995). Firstly, the individual fibers protruding from the surface are compressed.
The resistance to compression in this region comes from the bending of the fibres.
Secondly, contact is made with the surface of the yarn, at which point the inter-yarn
and/or inter-fiber friction provides the resistance to compression until the fibres are all in
contact with one another. In the third stage the resistance is provided by the lateral
compression of fibers themselves.
1.5.1.2 Fabric Shrinkage
The product of textile manufacture, whether yarn or fabric, is stable only to
moderate degree. The instability may manifest itself in shrinkage or in extensibility, and
may assume such properties that garments become unsuitable for further use as soon as
they are laundered or dry-cleaned, and sometimes even during wear.

xxii
1.5.1.3 Fabric Handle
Fabric uses can be roughly divided into industrial, household and apparel. Fabric
for industrial use can be chosen on straight forward performance characteristics such as
tensile strength, extension and resistance to environmental attack. However, fabrics
intended for clothing such as cotton fabrics have less emphasis placed on their technical
specification and more on their appearance and handling characteristic such as luster,
smoothness or roughness, stiffness and draping quality. „Handle‟, the term given to
properties assessed by touch or feel depends upon subjective assessment of a fabric by a
person. Terms such as smooth, rough, stiff or limp depends strongly on the type of fabric
being assessed, for instance the smoothness of a worsted suiting is different in nature
from that of these properties. Attempt has been made over the years to devise the
objective tests to measure some or all of the factors that make up handle. Fabric stiffness
and drape were some of the earliest properties to be measured objectively (Pierce, 1980).
1.5.2 Mechanical Properties
1.5.2.1 Breaking Strength
This is the maximum tensile force extending a test piece to breaking point. The
force at which a specimen breaks is directly proportional to its cross sectional area,
therefore when comparing the strength of different fibres, yarns and fabrics, allowance
has to be made for this (Morten and Hearle, 1993).
1.5.2.2 Stress
Stress is a way of expressing the force on a material in a way that allows for the
effect of the cross sectional area of the specimen on the force needed to break it.

xxiii
In the case of textile materials, the cross sectional area can only be easily
measured in the case of fibres with circular cross section. The cross section of yarns and
fabrics contain an unknown amount of space as well as fibres so that in these cases the
cross sectional area is not clearly defined. Therefore stress is only used in limited
number of application involving fibers.
1.5.2.3 Specific (Mass) Stress
Specific stress is a more useful measurement of stress in the case of yarns as their
cross-sectional area is not known. The linear density of the yarns is used instead of the
cross sectional area as a measure of yarn thickness. This allows the strength of yarns of
different linear densities to be compared.
1.5.2.4 Breaking Length
Breaking length is an older measure of tenacity and is defined as theoretical
length of a specimen of yarn whose weight would exert a force sufficient to break the
specimen. It is usually measured in kilometers.
1.5.2.5 Elongation
Elongation is the increase in length of the specimen from its starting length
expressed in units of length. The distance that a material will extend under a given force
is proportional to its original length; therefore elongation is usually quoted as strain or
percentage extension. The elongation at maximum force is the value some often quoted
(Morten and Hearle, 1993), (McIntyre and Daniels, 1995).

xxiv
1.5.2.6 Strain
The elongation that a specimen undergoes is proportional to its initial length. As a
fraction of the original length.
1.5.2.7 Extension Percentage
This measure is the strain expressed as a percentage rather than a fraction.
Breaking fraction is the extension percentage at breaking point.
After care treatment such as laundering affects the breaking strength of cotton fabric in
the fabrics are relaxed as a result of the mechanical application of laundering. Therefore,
elongation at break or break elongation increase with increase in cotton fabric laundering.
1.5.3 Tear Test
A fabric tears when it is snagged by a sharp object and the immediate small
puncture is converted into a long rip by what may be very small extra effort.
Measuring Tear Strength: The fabric property usually measured is the force
required to propagate an existing tear and not the force required to initiate a tear as this
usually requires a cutting of thread. As part of the preparation of the fabrics specimens, a
cut is made in them and then the force required to extend the cut is measured. This is
conveniently carried out by gripping the two halves of the cut in a standard tensile tester.
The various tear test carried out in this manner differ mainly in geometry of the

xxv
specimen. The simplest is the rip test where a cut is made down the centre of a strip of
fabric and the two tails pulled apart by a tensile tester.
1.5.4 Abrasion Resistance
Fabric abrasion has been defined as a simply rubbing action (Booth, 1968).It is an
aspect of wear and rubbing away of the components fibres and yarns of the fabric.
Hamburger (1994) states that abrasion is a series of repeated stress application,
usually caused by forces of a relatively low order of magnitude, which occur many times
during the life span of the material. The ability of a material to absorb energy repeatedly
by means of low load deformation and recovery is related to abrasion resistance.
1.5.4.1 Factors Affecting Abrasions Resistance
The evidence concerning the various factors that influence, the abrasion resistance
of fabrics is contradictory. This is because experiment has been carried out under widely
different conditions in particular using different modes of abrasion. The results are not
comparable and often opposing results have been reported. The factors that have been
found to affect abrasion include the following (Galbraith, 1975), (Birds, 1984).
Fiber Type:
It is thought that the ability of a fiber to withstand repeated distortion is the key to
its abrasion resistance. Therefore high elongation, elastic recovery and work of rapture
are considered to be more important factors for a good degree of abrasion resistance in
fibre. Nylon is generally considered to have the best abrasion resistance. Cotton has a
moderate abrasion resistance.

xxvi
Fiber properties:
One of the results of abrasion is the gradual removal of fibres from the yarns.
Therefore factors that affect the cohesion of yarns will influence their abrasion resistance.
Longer fibres incorporated into a fabric confer better abrasion resistance than short fibers
because they are harder to remove from the yarns. For the same reason filament yarns
are more abrasion resistant than staple yarns from the same fibre.
Fabric Structure:
The crimp of the yarn in the fabric affects whether the warp or the weft is abraded
the most, Fabrics with crimp evenly distributed between warp and weft give the best wear
because the damage is spread evenly between them. If one set of yarns is predominately
on the surface then this will wear most; this effect can be used to protect the load-bearing
yarns.
Yarn twist:
There has been found to be an optimum amount of twist in a yarn to give the best
abrasion resistance. At low-twist factors fibers can easily be removed from the yarn so
that it is gradually reduced in diameter. At high twist level, fibres are held more tightly
but the yarn is stiffer so it is unable to flatten or distort under pressure when being
abraded. It is this ability to distort that enables the yarn to resist abrasion.
1.5.5 Fabric Drape
Drape is the term used to describe the way a fabric hangs under its own weight. It
has an important bearing on how good a garment looks in use. The draping qualities
required from a fabric will differ completely depending on its end use; therefore a given
value for drape cannot be classified as either good or bad. Knitted fabrics are relatively

xxvii
floppy and garment made from them will tend to follow the body contours. Woven
fabrics are relatively stiff when compared with knitted fabrics so they are used in tailored
clothing where the fabrics hang away from the body and disguise its contour.
Measurement of fabric drape is meant to assess its ability to hang in graceful curves.
In drape test, the specimen deforms with multi-directional curvature and
consequently the results are dependent to a certain amount upon the sheer properties of
the fabric. The results are mainly dependent however, on the bending stiffness of the
fabric (BS 5058). In crusick drape test, a circular specimen is held to its area.A value
known as the drape coefficient, F, is determined by:
100%
The higher the drape coefficient, the stiffer is the fabric.
1.6 Stains / Soils
1.6.1 Blood
Blood is the red fluid that oozes out of the body when sustained with a cut or deep
injury. The composition of the blood is quite complex. Blood is composed of straw-
coloured liquid called plasma which contains suspended cells. The different specialized
cells found in blood are; Red blood cells, White blood cells and Platelets. Approximately
90% of plasma is water-blood`s solvent with the rest composed of dissolved substance,
primary proteins (e.g albumin, globulin and fibrogen). Plasma typically accounts for 55%
by volume of blood and of the remaining 45% the greatest contribution is from the red
blood cells (Membranes, 2011).
xxviii
1.6.2 Urine
Urine is composed mostly of water and organic wastes as well as some salt. The
composition of urine can vary according to diet, time of the day, and diseases. In one
measure the make-up of urine is 95% water and 5% solid. In terms of organic wastes (per
1,500 ml), urine containing 30g of urea, 1-2g each of ceratinine and ammonia, and 1g of
uric acid. In terms of salt or ions, 25g per 1,500 ml of urine contain the positive ions of
sodium, potassium, magnesium and calcium, as well as the negative ions of chlorine,
sulphate and phosphate (Answer.com, 2011).
1.7 Statement of the Research Problem
“Removing stains can sometimes seem like a complex algebra problem”. A
Hospital‟s textile or linen will often become soiled with blood and other organic stains
and the longer the blood stains are left; the more difficult it will be to remove them.
Ordinarily, when someone gets blood on their clothing at home, they will usually sluice it
or rinse off before it dries. In a hospital, blood soiled fabrics would rarely be sluiced
immediately and the stain may not be treated until it reaches the laundry which may be
several days later. By this time the blood would have dried onto and into the fabric and
will no longer respond to normal wash. This means that launderers need to resort to more
drastic measures if they are going to remove the blood successfully and return the item to
the user in a stain free condition. Blood which is one of the prominent coloured stains on
hospital linen is highly contagious and most proteins will set permanently if washed at
high temperature at any stage as the higher temperature will “cook” the protein and make
it difficult if not impossible to remove. Blood albumin and organic iron sometimes
produce stain that are never completely removed, but only lightened.
xxix
Effect of urine in this case is predominantly on the bed linen. Urine discolours
cotton white sheet and cotton blend fabrics. Urine stains are especially visible on white
fabrics. Hot and warm water cause coagulation in the fibres of the material, making the
stain more difficult to washout. Ammonia is also a common cleaning agent, which also
happens to occur naturally in urine. However, when chlorine from bleach mixes with
ammonia, it can create a noxious gas (mustard gas). This research work intends to study
the cleaning processes of these organic stains and the effect of the methods on the
properties of hospital textile linen.
1.8 Justification of the work
Procuring hospital textile linen by the hospital management may be capital
intensive and uneconomical, if the linens are poorly managed. From this research study,
assessing the characteristic changes in the performance of each fabric properties from the
various stain removal methods may help to define the quality of the fabrics after some
use. Hence, from the results obtained and where minimal effects occur on the fabric, a
more sustainable method of upholding hospital spotted linen can be developed enabling a
valuable fabric care handling with minimal damage.

xxx
1.9 Research Objectives
The aims and objectives of the research are;
1. To investigate the effect of laundering regime of three healthcares tertiary
Hospitals with respect to their methods of organic stain removal for blood and
urine.
2. To determine the effects of these procedures on the properties of cotton fabric.
3. To suggest improved method of stain removal with minimal degrading effects on
the fabric properties.
1.10 Scope of Study
The mechanical and physical properties of the samples (theatre outfits and bed
linen) used in this work were studied before and after laundering. The three tertiary
healthcare institutions are;
Ahmadu Bello University Teaching Hospital-Zaria.
Aminu Kano Teaching Hospital-Kano, and
The National Orthopedic Hospital-Kano.
This research was limited to the use of the fabric properties of each hospital, the
available detergents and chemical components (reagents) used in each case, the
laundering regime practiced in each hospital. This research also limits its study only on
blood and urine amongst other organic stains. A standard drying method (Tumble drying)
and drying time was considered for all washings.

xxxi
CHAPTER TWO
2.0 LITERATURE RIVIEW
Some studies have demonstrated success on the effect of repeated laundering
processes with two commercial (liquid detergent- Lira and Ariel) detergents with
different formulations on structural characteristics such as weight per unit area, fabric
thickness, course and wale density, stitch density and dimensional stability as well colour
fastnesss of the single knitted fabrics made from 100% cotton of two different grades
after some finishing process, first and fifth washing cycles were investigated of which the
Lira showed more homogenous characteristics giving knitted fabrics with better
dimensional stability than the Ariel (Emilija and Biljana, 2011). Another study on the
effect of repeated laundering on some physical and mechanical properties of cotton fabric
has been reported and the relationship between the number of laundering cycles and
several key fabric performance parameters have been quantitatively investigated (Ogri,
2009).
During laundering, a fabric can be subjected to complex thermal, mechanical and
physical actions in both wet and dry conditions and as a result the textile products must
be able to withstand a reasonable number of laundering cycles. For shirts, the average life
expectancy is approximately 30 to 40 laundering (Shurkian, et al 2002). Also for hygienic
reasons garment need to be washed. Other studies on the effects of various home
laundering practices on the dimensional stability, wrinkling, and other properties of plain
woven cotton fabrics were carried out. The long-term objective of the investigation was
to develop laundering equipment and regimes that reduce or delay the perceived negative
effects of laundering (Higgins, et al 2003).

xxxii
Today‟s hospital is not only aware of the style and comfort of the cotton fabrics,
but also of their care and durability. With the rising demands for the cotton fabrics,
demand in terms of dimensional instability, shrinkage and colour fading, in contrast to its
excellent attributes, are the most critical quality problems after repeated laundering.
Fabric performance is influenced by a number of variables that occur both in pre-
consumer and post-consumer periods. Fibre quality, yarn formation, fabric construction,
textile wet processes, and in this case hospital washing processes can all have influence
on hospital fabric performances. Organic stains in the hospital – principally blood and
urine – which are mostly protein can set permanently if the washing process exceeds
390C at any stage as the higher temperature will effectively “cook” the protein and make
it very difficult – if not impossible to remove. In this case, it is necessary to monitor the
re-wash and classify it according to the type of stain and treatment needed (Ian, 2010).
Hospitals methods of stain removal process for blood and urine and the laundering
regimes may alter a major role in the ability to retain hospital‟s bed linen and theatre
outfit fabric performance.
From the review of published literatures, efforts to unearth evidences on stain
removal methods and their effects on some properties of cotton fabric with respect to the
laundering regime of some selected hospital laundries are yet to be published.

xxxiii
CHAPTER THREE
3.0 MATERIALS AND METHODS
3.1 Materials
Three samples each of white hospital linens and green theatre outfits respectively
were obtained from three tertiary healthcare hospitals namely:
1. Ahmadu Bello University Teaching Hospital, Shika- Zaria. (A.B.U.T.H.).
2. Aminu Kano Teaching Hospital, Kano. (A.K.T.H.)
3. National Orthopedic Hospital, Kano. (N.O.H.)
The Samples were 100% woven cotton fabrics.
3.1.1 Chemicals
Synthetic Powdered Detergent (Ariel)
Cationic Powdered Detergent (Sigma-aldrich)
Water
Human blood
Urine
Hydrogen Peroxide 3.5% w/v (house-hold brand)
Ammonia Solution 3.5% w/v (house-hold brand)
Sodium Hypochlorite 3.5% w/v (house-hold brand)
3.1.2 Apparatus and Equipment
Kelvinator washer/dryer combo 10.1kg (model number: MET1041ZAS2)
Digital weighing balance
Instron tensile tester (model 1025)
Hotbox oven
Gray Scale for assessing staining
xxxiv
3.2 Methods
Multiple squares shapes of 20 x 20cm of the linens were marked and labeled
stained/treated and unstained/untreated. Samples of the human blood and urine were
stained on the portions marked stained/treated of the linen and exposed for another
24hours. The marked portions of the blood and urine were categorically labeled for
proper identification.
3.2.1 Laundering Regime 1
These samples were collected after 24 hours and laundered separately (according
to similarity of stains) in the Kelvinator washer-extractor machine with a break-wash for
5-7 minutes by the action of 60g of synthetic detergent (Ariel) with 150ml of sodium
hypochlorite bleach in a volume of 50 litres of water at cold wash. The samples were
rinsed with sufficient water and prepared for regular wash. The regular wash was
laundered with 120g of cationic detergent (Sigma-aldrich) in 50 litres volume of water at
room temperature. This is laundered for 30 minutes and rinsed. A second rinse in water
was carried out followed by the action of the hydro-extractor. The samples were then
spread on the spotting tables for further treatment regarding stain removals.
3.2.2 Stain Removal Methods
AHMADU BELLO UNIVERSITY TEACHING HOSPITAL (ABUTH), ZARIA:
For the above hospital, the residual spotted areas of the blood stained white
hospital linen indicated a deep brown colouration which were treated with hydrogen
peroxide followed by the action of the ammonia solution; this gives rise to an
effervescence reaction with a pungent odour. This was allowed to stay for another 5-7
minutes. The urine marked areas of the linen were not treated with any reagent since
there were no residual stains on the linens after washing. The blood stained green theatre
xxxv
linen was equally not treated with any reagent as the stains were completely washed off
with no residual stains.
AMINU KANO TEACHING HOSPITAL (AKTH), KANO:
These samples were laundered as above but the blood stained linens were treated
solely with sodium hypochlorite bleach and allowed to stay for 5-7 minutes.
NATIONAL ORTHOPEDIC HOSPITAL (NOH), KANO:
For this case, the blood stained linens were treated with hydrogen peroxide
followed by sodium hypochlorite bleach and left for 5-7 minutes.
3.2.3 Laundering Regime 2
Further washings were carried out on the blood stained samples of each hospital
after applying the reagents with 35g of synthetic detergent (Ariel) at cold wash and rinsed
twice. The samples were dried in the Kelvinator dryer machine at 65-75oC for 45
minutes. This procedure was carried out for all the nine laundering cycles, after which
marked portions of the treated and untreated samples were removed after the 3rd
, 6th
and
9th
wash respectively for analysis.
3.3 Determination of Fabric Properties
The BS EN 13934-1 method was used to determine the maximum force and
elongation at maximum force for each sample using a strip method in equilibrium with
the standard atmosphere for testing, and of test specimen in the wet state. By this
principle, two sets of test specimen (quantity 5 per set): one in the warp direction and the
other in the weft direction at a dimension of 10cm x 2.5cm, gauge length of 6.7cm and
cross head speed of 50mm per minute were used with the Instron Tensile Tester (model
1025). The maximum load was 50kg for all tests and the rate of extension was 25%.The
test specimen was fixed on the clamp and the upward button was pressed until the sample
xxxvi
break. The rapid downward movement button was pressed for a quick return for another
sample to be clamped. Two readings were taken and recorded for each sample (in both
warp and weft direction) for breaking load and breaking extension. The extension at
break was calculated using the formular below:
100
3.4 Determination of Moisture Content and Moisture Regain (Physical Properties)
The samples of the treated and untreated fabrics were cut into 7cm 7cm and
weighed and dried in an oven temperature of 75⁰C for 15 minutes, followed by cooling
for 10 minutes and then weighed again. The steps were repeated until the weight
remained constant. The moisture regain of the test specimen were expressed as
percentage loss in weight of the final oven dry weight. (Booth, 1968)
3.5 Determination of Percentage Shrinkage (Physical Properties)
The initial length of the treated and untreated samples was measured before initial
laundering. Final lengths of the samples were considered in warp and weft direction after
the 3rd
, 6th
, and 9th
laundering cycles. The percentage shrinkage was then determined by
finding the differences of the initial and final length using the formular below:
100

xxxvii
3.6 Determination of Colour Fastness
The AATCC Evaluation Procedure 2: Gray Scale for Staining was determined.
This evaluation method describes the use of a Gray Scale for evaluating staining of
unstained textiles resulting from colourfastness tests. The original piece of all sample,
untested and tested (treated) specimen side by side in the same plane and going in the
same direction in the Colour Matching Cabinet so it can be viewed at a 45˚angle. The
Gray Scales were placed along the edges of the two fabrics, tested and untested. These
were then compared by visual differences between the two fabrics to the differences
represented by the Gray Scale. The grades were determined by figuring out the grade that
corresponds with the most appropriate change in colour. A grade of 5 is given only when
there is no perceived difference in colour or contrast between the original and the tested
specimen.

xxxviii
CHAPTER FOUR
4.0 RESULTS AND DISCUSSION
4.1 Effects of Washing Cycles on Breaking Strength- Hospital linen.
Fig. 3.3.1: Effect of third wash of hospital dry and wet linen on breaking load.
0
50
100
150
200
250
X₁ W
arp
X₂
War
p
X₃
War
p
X₁ W
eft
X₂
Wef
t
X₃
Wef
t
X₁ W
arp
X₂
War
p
X₃
War
p
X₁ W
eft
X₂
Wef
t
X₃
Wef
t
X₁ W
arp
X₂
War
p
X₃
War
p
X₁ W
eft
X₂
Wef
t
X₃
Wef
t
X₁ W
arp
X₂
War
p
X₃
War
p
X₁ W
eft
X₂
Wef
t
X₃
Wef
t
Untreated
Treated (Blood)
Treated (Urine)
CONTROL SAMPLE
DRY SAMPLE WET SAMPLE
STAINED WASHED SAMPLE
DRY SAMPLE WET SAMPLE
Bre
akin
g Lo
ad
→(N
)
Washed cycle number of hospital linen
X₁=ABUTHX₂=AKTHX₃=NOH

xxxix
Fig.3.3.2: Effect of sixth wash of hospital dry and wet linen on breaking load.
0
50
100
150
200
250X
₁ War
p
X₂
War
p
X₃
War
p
X₁ W
eft
X₂
Wef
t
X₃
Wef
t
X₁ W
arp
X₂
War
p
X₃
War
p
X₁ W
eft
X₂
Wef
t
X₃
Wef
t
X₁ W
arp
X₂
War
p
X₃
War
p
X₁ W
eft
X₂
Wef
t
X₃
Wef
t
X₁ W
arp
X₂
War
p
X₃
War
p
X₁ W
eft
X₂
Wef
t
X₃
Wef
t
Untreated
Treated (Blood)
Treated (Urine)
CONTROL SAMPLE
DRY SAMPLE WET SAMPLE
STAINED WASHED SAMPLE
DRY SAMPLE WET SAMPLE
Bre
akin
g Lo
ad
→(N
)
X₁=ABUTHX₂=AKTHX₃=NOH
Washed cycle number of hospital linen

xl
Fig. 3.3.3: Effect of ninth wash of hospital dry and wet linen on breaking load.
The control samples in the figures 3.3.1, 3.3.2 and 3.3.3 indicate higher breaking
load values in the warp direction of the dry and wet samples than the weft direction of the
dry and wet samples. Graphically, it also applies that as the washing cycle‟s increases
from the 3rd
, 6th
and 9th
the breaking load of the control sample (Untreated) also
0
50
100
150
200
250
X₁ W
arp
X₂
War
p
X₃
War
p
X₁ W
eft
X₂
Wef
t
X₃
Wef
t
X₁ W
arp
X₂
War
p
X₃
War
p
X₁ W
eft
X₂
Wef
t
X₃
Wef
t
X₁ W
arp
X₂
War
p
X₃
War
p
X₁ W
eft
X₂
Wef
t
X₃
Wef
t
X₁ W
arp
X₂
War
p
X₃
War
p
X₁ W
eft
X₂
Wef
t
X₃
Wef
t
Untreated
Treated (Blood)
Treated (Urine)
CONTROL SAMPLE
DRY SAMPLE WET SAMPLE
STAINED WASHED SAMPLE
DRY SAMPLE WET SAMPLE
Bre
akin
g Lo
ad →
(N)
Washed cycle number of hospital linen
X₁=ABUTHX₂=AKTHX₃=NOH

xli
increased. This could be as a result of the shrinkage property of the cotton fabric. This
relaxation shrinkage could be caused by the tension applied to the yarns and fabrics
during construction, as this tension is released when the fabric is washed causing it shrink
to its natural size (Charles, 2010).
It is evident from the figures 3.3.1, 3.3.2 and 3.3.3 that there are higher breaking
load properties in the blood treated samples from ABUTH. This could be as a result of
the combination of the stain removal reagents by the action of the hydrogen peroxide and
the liquid ammonia. The other hospital samples show about an equal breaking load
values.
Also the figures show the effect of a graphical representation for the stained dry
and wet linens of the 3rd
, 6th
and 9th
wash. This illustration shows that as the fabric
undergo more cycles of laundering up to the ninth wash, the breaking load increases. This
increase in strength may be as a result of the shrinkage of fabrics caused by relaxation
during laundering. Shrinkage makes cotton fabric tighter, thicker and heavier. Thus, as
the fabric laundering cycle increases, the strength of the fabric gradually increases up to
the ninth wash. The assessment of the breaking load properties of textile materials is an
important aspect of textile testing and indicates that strength is of great importance in
fabric analysis for the end-use requirement (Booth, 1968).
The breaking load is often defined as the maximum load applied to a specimen in
stretching it to rupture while the extension at this breaking load is referred to as the
breaking extension (B.S. Handbook, 1974). The load-extension characteristics of a fabric
are important in indicating the changes that occur when a fabric is subjected to a certain

xlii
load. Thus, the strength of yarn and other additional factors contributes to the breaking
load of a fabric.
Breaking load alone, though of great importance is not a decisive factor in the
performance of textile materials and no definite conclusions can be drawn from breaking
load figures without reference to other equally important physical properties. As a result
of the assessment of the wet-samples having a higher breaking load property than dry
sample, this is due to the presence of moisture in the fabric from the hygroscopic nature
of cotton fibre which causes them to swell when soaked in water during washing. This is
due to the fact that those cellulose chains within cotton fibres are held in place by
hydrogen bonding (Joseph, 1986). The presence of hydrogen bonding in the structure of
the cellulose allows cotton to resist slippage during an applied force (tensile property)
especially when wet. It is a good hydrophilic fibre because of the presence of hydroxyl
group on the glucose rings. The presence of these groups, as well as its amorphous
content enables cotton to bond well with water (Hatch, 1993). This swelling is
accompanied by shrinkage in fibre length. There are non-uniform breaking load
properties in the warp and weft direction of the blood stained samples compared with the
untreated and urine stained samples of the various hospitals linens.
xliii
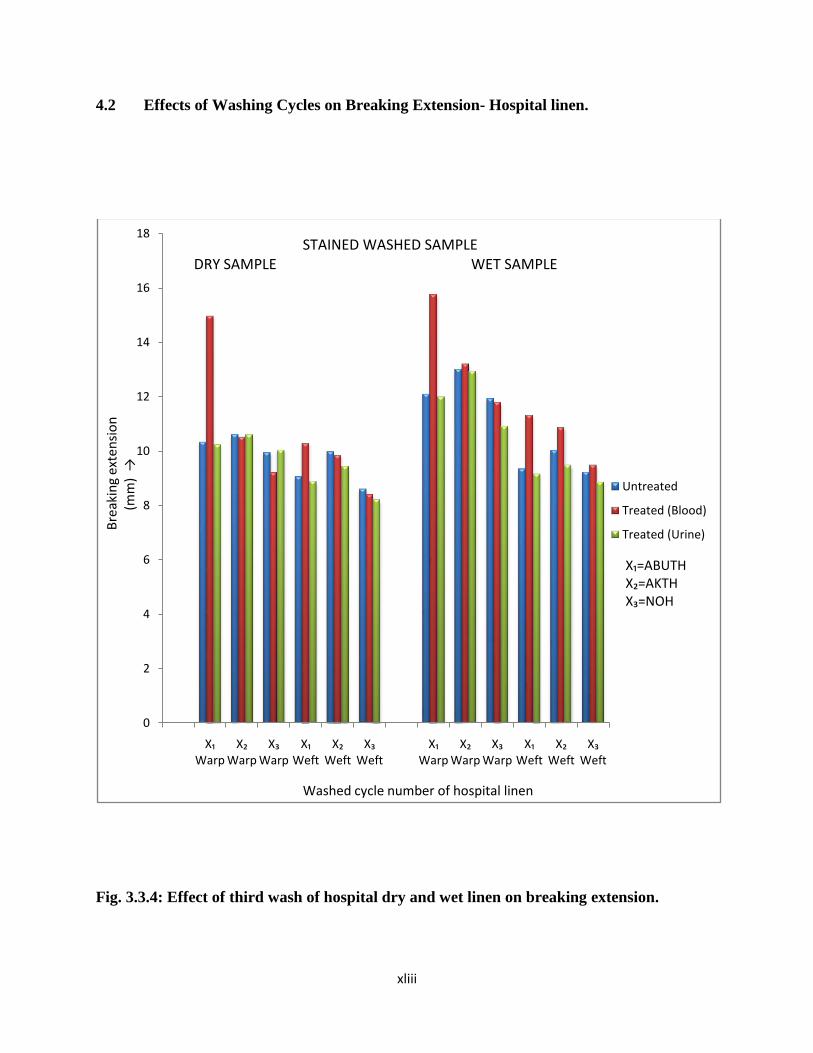
4.2 Effects of Washing Cycles on Breaking Extension- Hospital linen.
Fig. 3.3.4: Effect of third wash of hospital dry and wet linen on breaking extension.
0
2
4
6
8
10
12
14
16
18
X₁ Warp
X₂ Warp
X₃ Warp
X₁ Weft
X₂ Weft
X₃ Weft
X₁ Warp
X₂ Warp
X₃ Warp
X₁ Weft
X₂ Weft
X₃ Weft
Untreated
Treated (Blood)
Treated (Urine)
Bre
akin
g ex
ten
sio
n(m
m)
→
STAINED WASHED SAMPLEDRY SAMPLE WET SAMPLE
X₁=ABUTHX₂=AKTHX₃=NOH
Washed cycle number of hospital linen
xliv
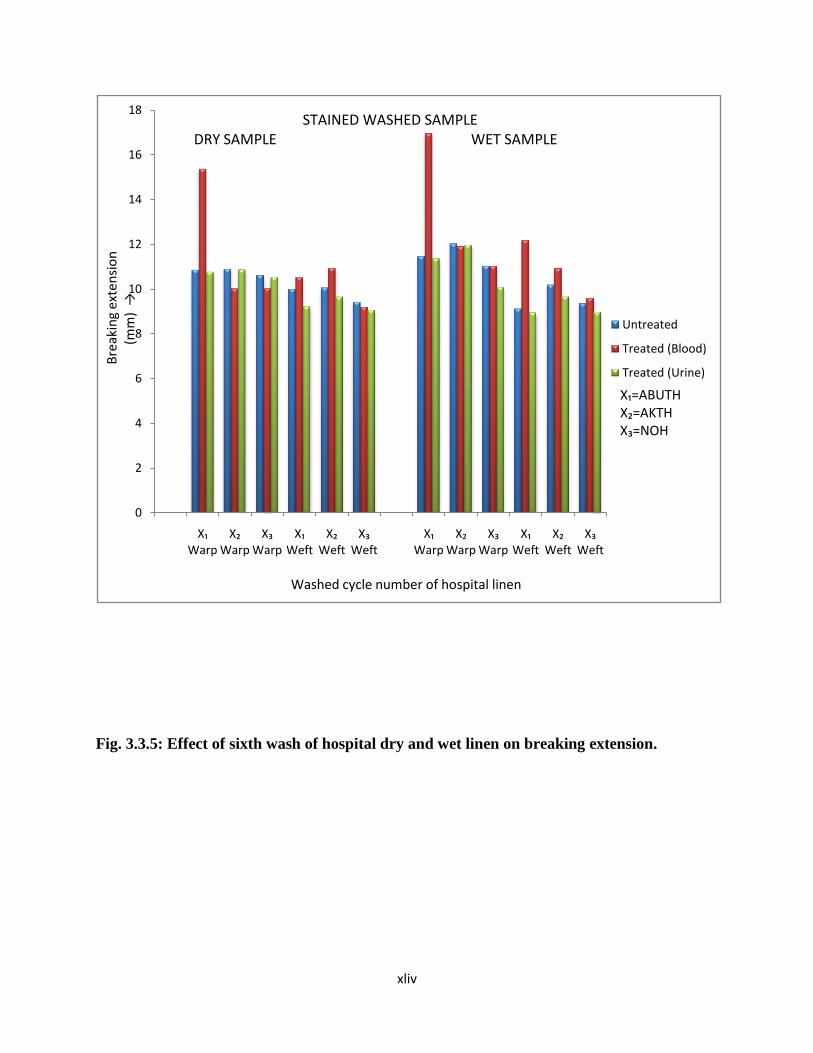
Fig. 3.3.5: Effect of sixth wash of hospital dry and wet linen on breaking extension.
0
2
4
6
8
10
12
14
16
18
X₁ Warp
X₂ Warp
X₃ Warp
X₁ Weft
X₂ Weft
X₃ Weft
X₁ Warp
X₂ Warp
X₃ Warp
X₁ Weft
X₂ Weft
X₃ Weft
Untreated
Treated (Blood)
Treated (Urine)
Bre
akin
g ex
ten
sio
n(m
m)
→STAINED WASHED SAMPLE
DRY SAMPLE WET SAMPLE
X₁=ABUTHX₂=AKTHX₃=NOH
Washed cycle number of hospital linen

xlv
Fig. 3.3.6: Effect of ninth wash of hospital dry and wet linen on breaking extension.
For extension at break, blood treated samples from ABUTH has the highest
extension at break in both warp and weft direction when compared with the untreated
(control sample) and urine treated samples from figures 3.3.4, 3.3.5 and 3.3.6. The dry
samples has the least extension at break in both warp and weft direction when compared
0
2
4
6
8
10
12
14
16
18
X₁ Warp
X₂ Warp
X₃ Warp
X₁ Weft
X₂ Weft
X₃ Weft
X₁ Warp
X₂ Warp
X₃ Warp
X₁ Weft
X₂ Weft
X₃ Weft
Untreated
Treated (Blood)
Treated (Urine)
Bre
akin
g ex
ten
sio
n(m
m)
→
STAINED WASHED SAMPLEDRY SAMPLE WET SAMPLE
X₁=ABUTHX₂=AKTHX₃=NOH
Washed cycle number of hospital linen

xlvi
with the wet samples especially after the 3rd
and 6th
washings. Breaking extension is the
percentage at which fabric stretch before breaking on application of force (Moji, 2000).
Hence, the graph in figure 3.3.6 shows about the same breaking extension value after the
9th
wash for the dry and wet blood stained samples of ABUTH both in the warp and weft
direction; also a decrease in value for the breaking extension of the control, blood and
urine samples for AKTH in the dry and wet condition of the warp and weft direction
when compared with the breaking extension values of the 3rd
and 6th
washings. While all
samples (control, blood and urine) for the NOH shows about the same breaking extension
value for both dry and wet samples in the warp and weft direction for all washings.
From tables 1-14, it is evident that the strength in the warp direction is higher than
the weft direction for almost all samples analyzed; this may be due to the fact that warp
yarns carry a higher yarn linear density than the weft yarns.

xlvii
4.3 Effects of Washing Cycles on Breaking Strength- Green theatre linen.
Fig. 3.3.7: Effect of third wash of theatre dry and wet linen on breaking load.
0
20
40
60
80
100
120
140
160
180
X₁ Warp
X₂ Warp
X₃ Warp
X₁ Weft
X₂ Weft
X₃ Weft
X₁ Warp
X₂ Warp
X₃ Warp
X₁ Weft
X₂ Weft
X₃ Weft
Untreated
Treated (Blood)
Bre
akin
g Lo
ad
→
(N)
DRY SAMPLE WET SAMPLE
X₁=ABUTHX₂=AKTHX₃=NOH
Washed cycle number of theatre linen

xlviii
Fig. 3.3.8: Effect of sixth wash of theatre dry and wet linen on breaking load.
0
20
40
60
80
100
120
140
160
180
200
X₁ Warp
X₂ Warp
X₃ Warp
X₁ Weft
X₂ Weft
X₃ Weft
X₁ Warp
X₂ Warp
X₃ Warp
X₁ Weft
X₂ Weft
X₃ Weft
Untreated
Treated (Blood)
Bre
akin
g lo
ad
→(N
)
DRY SAMPLE WET SAMPLE
X₁=ABUTHX₂=AKTHX₃=NOH
Washed cycle number of theatre linen

xlix
Fig. 3.3.9: Effect of ninth wash of theatre dry and wet linen on breaking load.
Figs. 3.3.7, 3.3.8 and 3.3.9 express the breaking load of the green theatre linen for
control sample (untreated) and blood stained sample. The urine stained sample was not
considered for the green theatre linen since practically there is no usual staining of the
0
20
40
60
80
100
120
140
160
180
200
X₁ Warp
X₂ Warp
X₃ Warp
X₁ Weft
X₂ Weft
X₃ Weft
X₁ Warp
X₂ Warp
X₃ Warp
X₁ Weft
X₂ Weft
X₃ Weft
Untreated
Treated (Blood)
Bre
akin
g lo
ad
→(N
)DRY SAMPLE WET SAMPLE
X₁=ABUTHX₂=AKTHX₃=NOH
Washed cycle number of theatre linen

l
green theatre linen with urine but rather with blood. The breaking load and extension at
break are higher in the warp than the weft direction. It was observed that after the blood
stains were laundered, there were no Iron residual stains on the green theatre linen as it is
on the white hospital linen. Hence, the green theatre linen was not treated with any
reagent after every washing cycle.
Figs. 3.3.7, 3.3.8 and 3.3.9 shows the graphical illustration of the increases in the
breaking load of the warp and weft for the dry and wet samples after the 3rd
, 6th
and 9th
laundering cycles. This could be caused by the tension applied to the yarns and fabrics
during construction, as this tension is released when the fabric is washed causing it shrink
to its natural size (Charles, 2010).

li
4.4 Effects of Washing Cycles on Breaking Extension- Green theatre linen.
Fig. 3.3.10: Effect of third wash of green theatre dry and wet linen on breaking extension.
0
2
4
6
8
10
12
14
16
X₁ Warp
X₂ Warp
X₃ Warp
X₁ Weft
X₂ Weft
X₃ Weft
X₁ Warp
X₂ Warp
X₃ Warp
X₁ Weft
X₂ Weft
X₃ Weft
Untreated
Treated (Blood)Bre
akin
g ex
ten
sio
n(m
m)
→
STAINED WASHED SAMPLEDRY SAMPLE WET SAMPLE
X₁=ABUTHX₂=AKTHX₃=NOH
Washed cycle number of theatre linen

lii
Fig. 3.3.11: Effect of sixth wash of green theatre dry and wet linen on breaking extension.
0
2
4
6
8
10
12
14
X₁ Warp
X₂ Warp
X₃ Warp
X₁ Weft
X₂ Weft
X₃ Weft
X₁ Warp
X₂ Warp
X₃ Warp
X₁ Weft
X₂ Weft
X₃ Weft
Untreated
Treated (Blood)Bre
akin
g ex
ten
sio
n(m
m)
→
STAINED WASHED SAMPLEDRY SAMPLE WET SAMPLE
X₁=ABUTHX₂=AKTHX₃=NOH
Washed cycle number of theatre linen

liii
Fig. 3.3.12: Effect of ninth wash of green theatre dry and wet linen on breaking extension.
Figures 3.3.10, 3.3.11 and 3.3.12 express the breaking extension of the green theatre linen
in the wet and dry samples and in the warp and weft direction of the fabric. It was observed that
there were only little differences in value of the breaking extension for the control (untreated)
0
2
4
6
8
10
12
14
X₁ Warp
X₂ Warp
X₃ Warp
X₁ Weft
X₂ Weft
X₃ Weft
X₁ Warp
X₂ Warp
X₃ Warp
X₁ Weft
X₂ Weft
X₃ Weft
Untreated
Treated (Blood)Bre
akin
g ex
ten
sio
n
(m
m)
→
STAINED WASHED SAMPLEDRY SAMPLE WET SAMPLE
X₁=ABUTHX₂=AKTHX₃=NOH
Washed cycle number of theatre linen
liv
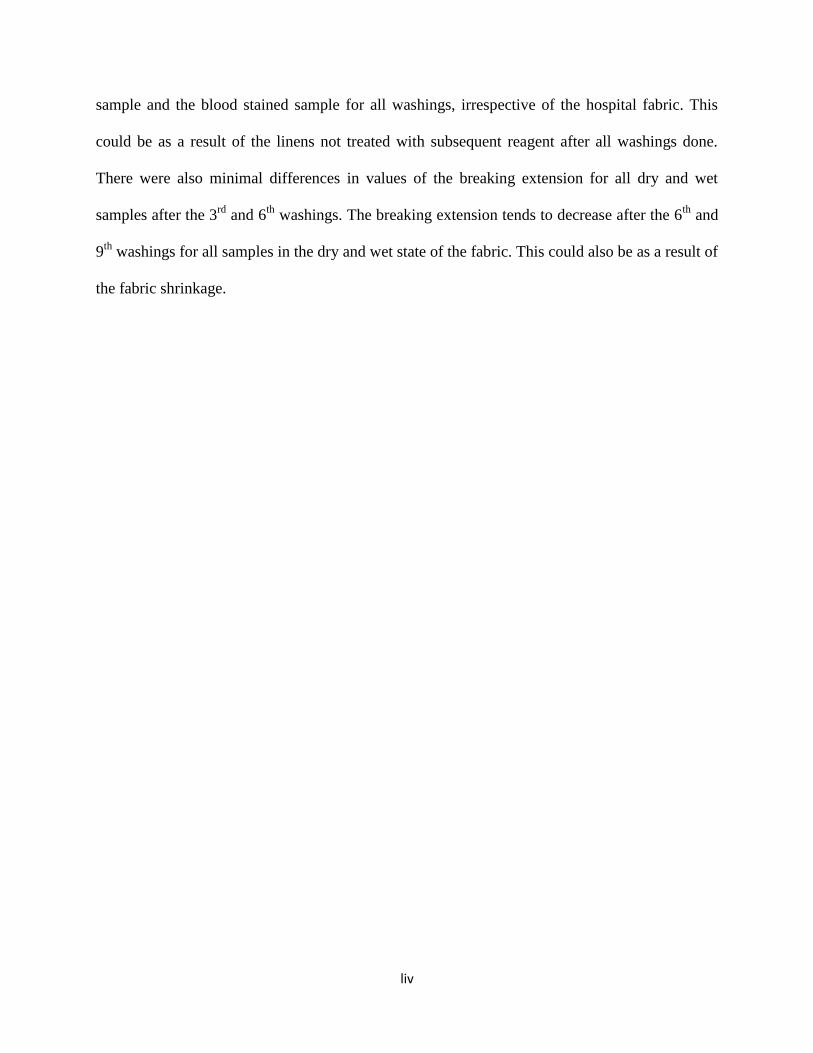
sample and the blood stained sample for all washings, irrespective of the hospital fabric. This
could be as a result of the linens not treated with subsequent reagent after all washings done.
There were also minimal differences in values of the breaking extension for all dry and wet
samples after the 3rd
and 6th
washings. The breaking extension tends to decrease after the 6th
and
9th
washings for all samples in the dry and wet state of the fabric. This could also be as a result of
the fabric shrinkage.

lv
4.5 Effects of Moisture Content and Moisture Regain on Hospital Linen.
Fig. 3.4.1: Effect of Moisture Content and Moisture Regain for third wash of Hospital
Linen on Percentage of Moisture.
0
0.5
1
1.5
2
2.5
3
Moisture Content
Moisture Regain
↑ Moisture content(percentage)
X₁=ABUTHX₂=AKTHX₃=NOH
Washed cycle number of hospital linen

lvi
Fig. 3.4.2: Effect of Moisture Content and Moisture Regain for sixth wash of Hospital
Linen on Percentage of Moisture.
0
0.5
1
1.5
2
2.5
Moisture Content
Moisture Regain
↑MoistureContent(percentage) X₁=ABUTH
X₂=AKTHX₃=NOH
Washed cycle number of hospital linen
lvii
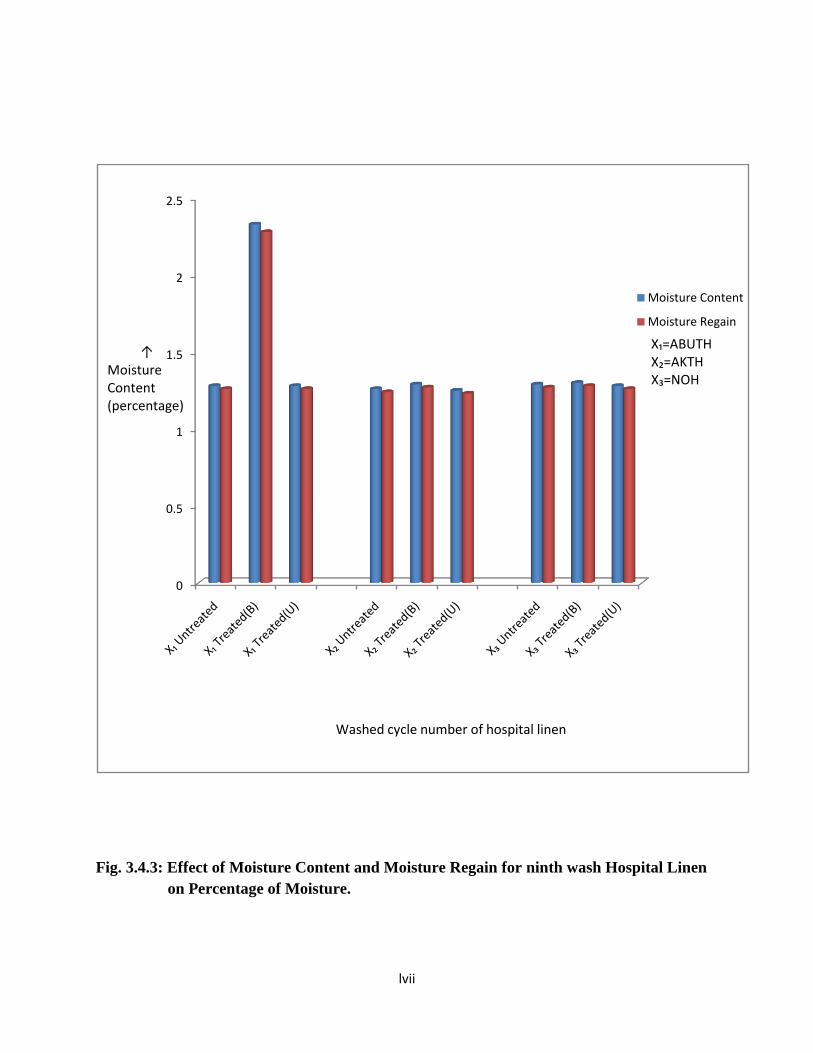
Fig. 3.4.3: Effect of Moisture Content and Moisture Regain for ninth wash Hospital Linen
on Percentage of Moisture.
0
0.5
1
1.5
2
2.5
Moisture Content
Moisture Regain
↑Moisture Content(percentage)
X₁=ABUTHX₂=AKTHX₃=NOH
Washed cycle number of hospital linen
lviii
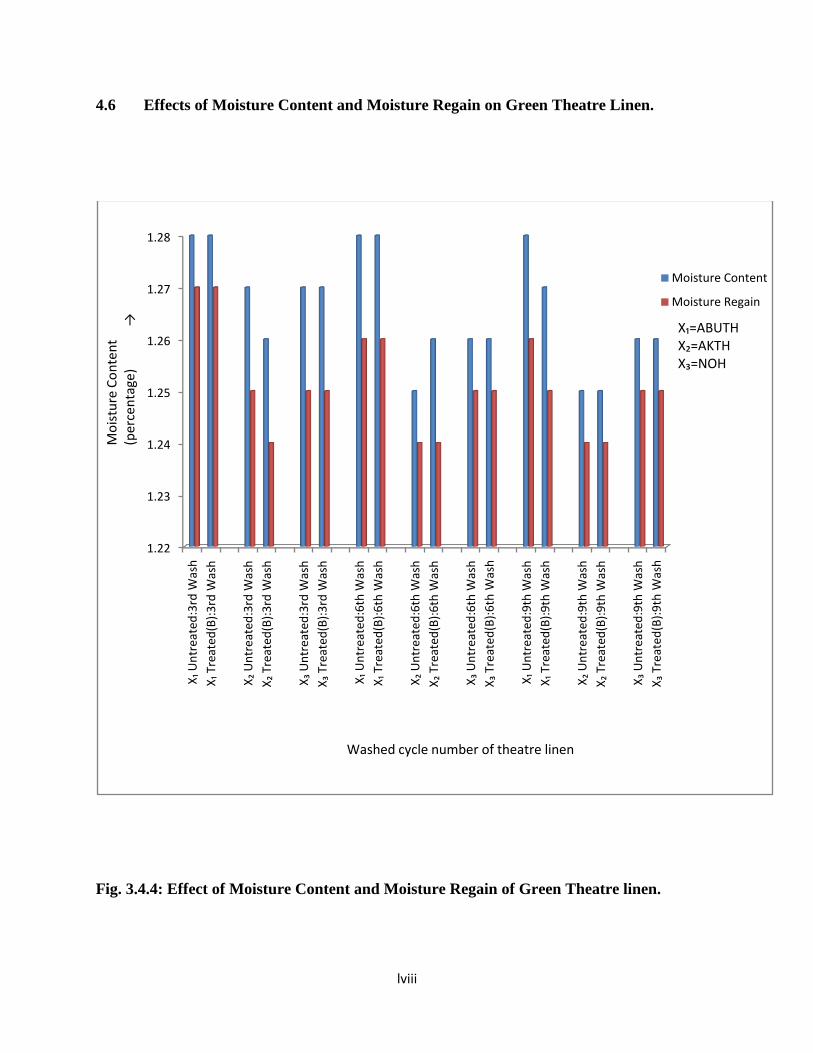
4.6 Effects of Moisture Content and Moisture Regain on Green Theatre Linen.
Fig. 3.4.4: Effect of Moisture Content and Moisture Regain of Green Theatre linen.
1.22
1.23
1.24
1.25
1.26
1.27
1.28
X₁ U
ntr
eate
d:3
rd W
ash
X₁ T
reat
ed(B
):3
rd W
ash
X₂
Un
trea
ted
:3rd
Was
h
X₂
Trea
ted
(B):
3rd
Was
h
X₃
Un
trea
ted
:3rd
Was
h
X₃
Trea
ted
(B):
3rd
Was
h
X₁ U
ntr
eate
d:6
th W
ash
X₁ T
reat
ed(B
):6
th W
ash
X₂
Un
trea
ted
:6th
Was
h
X₂
Trea
ted
(B):
6th
Was
h
X₃
Un
trea
ted
:6th
Was
h
X₃
Trea
ted
(B):
6th
Was
h
X₁ U
ntr
eate
d:9
th W
ash
X₁ T
reat
ed(B
):9
th W
ash
X₂
Un
trea
ted
:9th
Was
h
X₂
Trea
ted
(B):
9th
Was
h
X₃
Un
trea
ted
:9th
Was
h
X₃
Trea
ted
(B):
9th
Was
h
Moisture Content
Moisture Regain
Mo
istu
re C
on
ten
t(p
erce
nta
ge)
→ X₁=ABUTHX₂=AKTHX₃=NOH
Washed cycle number of theatre linen

lix
The moisture content is the weight of water expressed as percentage of total
weight, while the moisture regain is the weight of water in a material expressed as
percentage of oven dry weight. Moisture flow through textiles is an important parameter
governing the comfort properties and how much water vapour can be absorbed by the
clothing material from the skin (Brojeswari et al, 2009). The hygroscopic nature of cotton
fibre causes them to swell when soaked in water during washing. Figures 3.4.1, 3.4.2,
3.4.3 and 3.4.4 express the moisture content and moisture regain both for the hospital
linen and green theatre linen respectively. Figs. 3.4.1, 3.4.2 and 3.4.3 show blood stained
samples from ABUTH for the 3rd
, 6th
and 9th
washing cycles to have the highest
percentages of moisture content and moisture regain. This could be due to the presence of
liquid ammonia which was one of the principal reagents used for treating Iron residual
stains, this has a swelling effect on the fabric and the swelling treatment has also a
positive effect on the crease recovery property (Barbara, 2008). The little differences in
values of the other samples (Control and Urine stain) have relatively minimal differences
in variation depending on the hospital samples as shown in figures 3.4.1, 3.4.2 and 3.4.3
shown above. The blood stained samples from ABUTH indicates the highest moisture
content and moisture regain than the other sample as a result of the treatment of the
sample with liquid ammonia. The other samples have relatively about uniform moisture
content and moisture regained.
Fig. 3.4.4 shows the moisture content and moisture regain for the green theatre
linen at the 3rd
, 6th
and 9th
washing cycles. The control and blood stained sample shows
little differences in the moisture content and moisture regain with respect to the various
lx
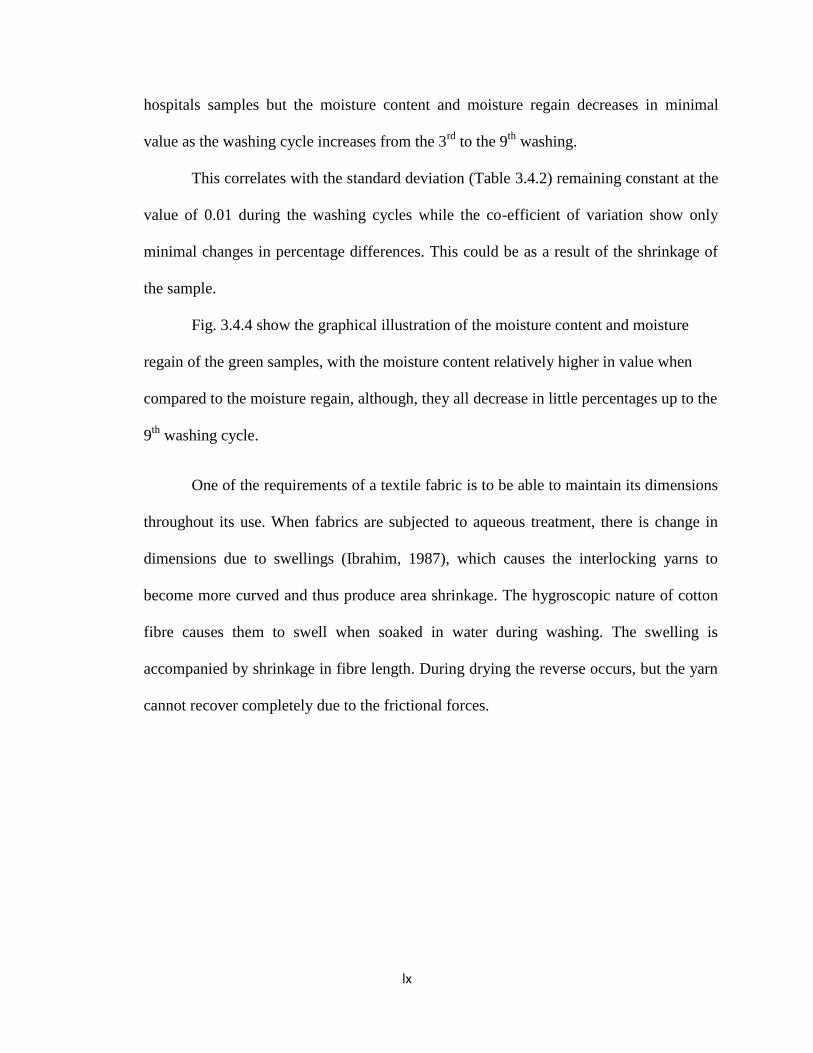
hospitals samples but the moisture content and moisture regain decreases in minimal
value as the washing cycle increases from the 3rd
to the 9th
washing.
This correlates with the standard deviation (Table 3.4.2) remaining constant at the
value of 0.01 during the washing cycles while the co-efficient of variation show only
minimal changes in percentage differences. This could be as a result of the shrinkage of
the sample.
Fig. 3.4.4 show the graphical illustration of the moisture content and moisture
regain of the green samples, with the moisture content relatively higher in value when
compared to the moisture regain, although, they all decrease in little percentages up to the
9th
washing cycle.
One of the requirements of a textile fabric is to be able to maintain its dimensions
throughout its use. When fabrics are subjected to aqueous treatment, there is change in
dimensions due to swellings (Ibrahim, 1987), which causes the interlocking yarns to
become more curved and thus produce area shrinkage. The hygroscopic nature of cotton
fibre causes them to swell when soaked in water during washing. The swelling is
accompanied by shrinkage in fibre length. During drying the reverse occurs, but the yarn
cannot recover completely due to the frictional forces.

lxi
4.7 Effects of Percentage Shrinkage on Hospital Linen.
Fig. 3.5.1: Effect of Treated and Untreated Hospital Linen on Percentage Shrinkage.
0
0.2
0.4
0.6
0.8
1
1.2
1.4
1.6
1.8
23
rd W
ash
:X₁ U
ntr
eate
d
3rd
Was
h:X
₁ Tre
ated
(B)
3rd
Was
h:X
₁ Tre
ated
(U)
3rd
Was
h:X
₂ U
ntr
eate
d
3rd
Was
h:X
₂ Tr
eate
d(B
)
3rd
Was
h:X
₂ Tr
eate
d(U
)
3rd
Was
h:X
₃ U
ntr
eate
d
3rd
Was
h:X
₃ Tr
eate
d(B
)
3rd
Was
h:X
₃ Tr
eate
d(U
)
6th
Was
h:X
₁ Un
trea
ted
6th
Was
h:X
₁ Tre
ated
(B)
6th
Was
h:X
₁ Tre
ated
(U)
6th
Was
h:X
₂ U
ntr
eate
d
6th
Was
h:X
₂ Tr
eate
d(B
)
6th
Was
h:X
₂ Tr
eate
d(U
)
6th
Was
h:X
₃ U
ntr
eate
d
6th
Was
h:X
₃ Tr
eate
d(B
)
6th
Was
h:X
₃ Tr
eate
d(U
)
9th
Was
h:X
₁ Un
trea
ted
9th
Was
h:X
₁ Tre
ated
(B)
9th
Was
h:X
₁ Tre
ated
(U)
9th
Was
h:X
₂ U
ntr
eate
d
9th
Was
h:X
₂ Tr
eate
d(B
)
9th
Was
h:X
₂ Tr
eate
d(U
)
9th
Was
h:X
₃ U
ntr
eate
d
9th
Was
h:X
₃ Tr
eate
d(B
)
9th
Was
h:X
₃ Tr
eate
d(U
)
Warp
Weft
Shri
nka
ge(%
)
→
X₁=ABUTHX₂=AKTHX₃=NOH
Washed cycle number of hospital linen

lxii
4.8 Effects of Percentage Shrinkage on Green Theatre Linen.
Fig. 3.5.2: Effect of Treated and Untreated Green Theatre Linen on Percentage
Shrinkage.
From Figure 3.5.1, it can be seen that the percentage shrinkage is slightly greater
along the warp direction compared to the weft direction. The blood stained samples from
ABUTH shows the least shrinkage than any of the other samples after the 3rd
, 6th
and 9th
0
0.2
0.4
0.6
0.8
1
1.2
1.4
1.6
1.8
2
3rd
Was
h-X
₁:U
ntr
eate
d
3rd
Was
h-X
₁:Tr
eate
d(B
)
3rd
Was
h-X
₂:U
ntr
eate
d
3rd
Was
h-X
₂:Tr
eate
d(B
)
3rd
Was
h-X
₃:U
ntr
eate
d
3rd
Was
h-X
₃:Tr
eate
d(B
)
6th
Was
h-X
₁:U
ntr
eate
d
6th
Was
h-X
₁:Tr
eate
d(B
)
6th
Was
h-X
₂:U
ntr
eate
d
6th
Was
h-X
₂:Tr
eate
d(B
)
6th
Was
h-X
₃:U
ntr
eate
d
6th
Was
h-X
₃:Tr
eate
d(B
)
9th
Was
h-X
₁:U
ntr
eate
d
9th
Was
h-X
₁:Tr
eate
d(B
)
9th
Was
h-X
₂:U
ntr
eate
d
9th
Was
h-X
₂:Tr
eate
d(B
)
9th
Was
h-X
₃:U
ntr
eate
d
9th
Was
h-X
₃:Tr
eate
d(B
)
Warp
Weft
Shri
nka
ge(%
)
→
X₁=ABUTHX₂=AKTHX₃=NOH
Washed cycle number of theatre linen

lxiii
washings respectively. This could be due to the liquid ammonia treatment used for the
removal of the residual Iron on the linen after every wash. Liquid ammonia has a
swelling effect on the fabric and the swelling treatment has also a positive effect on the
crease recovery property. Liquid ammonia strengthens the warp yarns. It also improves
the dimensional stability (Barbara, 2008). The other samples show about uniform value
up to the 9th
laundering cycle.
Figure 3.5.1 show a graphical illustration with evidence of the blood stained
sample from ABUTH indicating the least shrinkage up to the 9th
washing cycle.
Fig. 3.5.2 show the percentage shrinkage of the green theatre linen with the
shrinkage slightly greater along the warp direction compared to the weft. It also shows
the fabric percentage shrinkage increasing up to the 9th
laundering cycles in both warp
and weft direction. This theatre linen has good hydrophilic properties because of the
presence hydroxyl group on the glucose rings. The presence of these groups, as well as its
amorphous content enables cotton to bond well with water (Hatch, 1993). This swelling
is accompanied by shrinkage in fibre length. This could also be caused by the tension
applied to the yarns and fabrics during construction, as this tension is released when the
fabric is washed causing it shrink to its natural size (Charles, 2010).

lxiv
Sample- Hospital linen Change in Colour
ABUTH:
Untreated 4 - 5
Treated (Blood) 3 - 4
Treated (Urine) 4 - 5
AKTH:
Untreated 4 - 5
Treated (Blood) 3 - 4
Treated (Urine) 4 - 5
NOH:
Untreated 4 - 5
Treated (Blood) 3 - 4
Treated (Urine) 4 - 5
Table 3.6.1: Colour fastness result I.S.O. (1) for third wash

lxv
Table 3.6.1 (Contd.) - Colour fastness result I.S.O. (1) for sixth wash
Sample- Hospital linen Change in Colour
ABUTH:
Untreated 4 - 5
Treated (Blood) 3 - 4
Treated (Urine) 4 - 5
AKTH:
Untreated 4 - 5
Treated (Blood) 3 - 4
Treated (Urine) 4 - 5
NOH:
Untreated 4 - 5
Treated (Blood) 3 - 4
Treated (Urine) 4 - 5
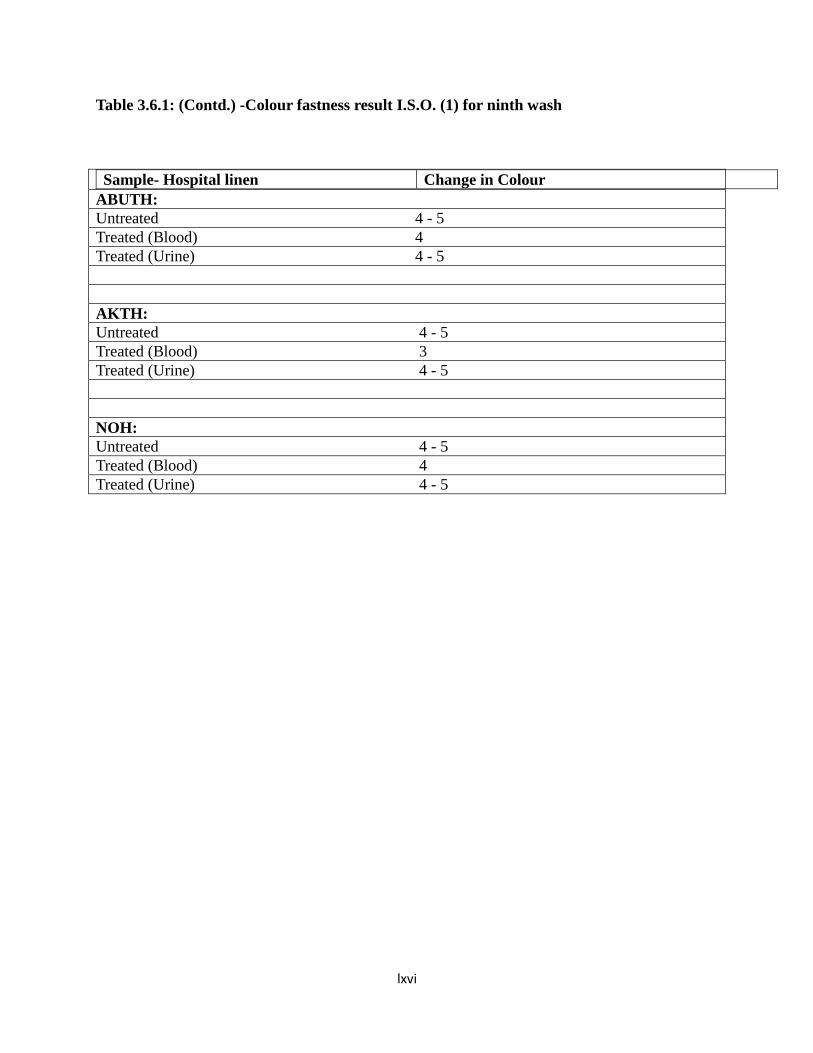
lxvi
Table 3.6.1: (Contd.) -Colour fastness result I.S.O. (1) for ninth wash
Sample- Hospital linen Change in Colour
ABUTH:
Untreated 4 - 5
Treated (Blood) 4
Treated (Urine) 4 - 5
AKTH:
Untreated 4 - 5
Treated (Blood) 3
Treated (Urine) 4 - 5
NOH:
Untreated 4 - 5
Treated (Blood) 4
Treated (Urine) 4 - 5

lxvii
Table 3.6.1: (Contd.) -Colour fastness result I.S.O. (1) for third wash
Sample- Green Theatre Linen Change in Colour
ABUTH:
Untreated 4 - 5
Treated (Blood) 4 - 5
AKTH:
Untreated 4 - 5
Treated (Blood) 4 - 5
NOH:
Untreated 4 - 5
Treated (Blood) 4 - 5

lxviii
Table 3.6.1: (Contd.) -Colour fastness result I.S.O. (1) for sixth wash
Sample- Green Theatre Linen Change in Colour
ABUTH:
Untreated 4 - 5
Treated (Blood) 4 - 5
AKTH:
Untreated 4 - 5
Treated (Blood) 4 - 5
NOH:
Untreated 4 - 5
Treated (Blood) 4 - 5

lxix
Table 3.6.1: (Contd.) -Colour fastness result I.S.O. (1) for ninth wash
Sample- Green Theatre Linen Change in Colour
ABUTH:
Untreated 4 - 5
Treated (Blood) 4 - 5
AKTH:
Untreated 4 - 5
Treated (Blood) 4 - 5
NOH:
Untreated 4 - 5
Treated (Blood) 4 - 5
From Table 3.6.1, it was observed that as a result of the continuous bleaching
action on the blood stained linen, a change in shade of a yellowing colour was established
on the white linen under visual observation after the 3rd
, 6th
and 9th
washings. The after
yellowing effect became more obvious after every bleaching up to the 9th
wash. Because
the untreated and urine stained sample had no residual stain after every regular washings,
no bleaching agent was necessary.
Therefore, the yellowing effect is evident on the blood stained sample changing in
colour from 3 to 4 after the 3rd
and 6th
washing cycle. The blood stained sample after the
9th
wash showed a deeper yellowing discolouration in the shade of 4 with ABUTH and
NOH hospital linens compared with AKTH which showed a change in shade of 3.

lxx
However, the untreated and urine stained samples maintained a uniform slight
change in shade of 4 to 5.
For the green theatre linen (Table 3.6.1); the visual observation of the green
theatre linen samples showed that up to the 9th
washing, a uniform slight change in shade
of 4 to 5 was maintained after the 3rd
, 6th
and 9th
washing cycles. This is attributed to the
absence of any bleaching agent all through the washing cycle.

lxxi
CHAPTER 5
5.0 CONCLUSION AND SUMMARY
In this research project, some mechanical and physical properties of the hospital
cotton fabrics and green theatre linens were assessed to investigate the state of the fabric
properties as a result of being subjected to different stain removal methods after repeated
laundering. A total of 9 laundering cycles were carried out with assessment after the 3rd
,
6th
and 9th
washing cycles.
The hospital linen sample (blood stained samples) from ABUTH show an obvious
increase in the breaking load properties up to the 9th
wash (which is opposite the norms)
when compared the other samples (untreated and urine stained samples). This could be
the result of the combining effect of the stain removal reagents by the action of liquid
ammonia and hydrogen peroxide. From all samples assessed, generally there is an
increasing breaking load up to the 9th
laundering cycles; this could be as a result of
shrinkage in the fabrics caused by relaxation during laundering. Thus, as the fabric
laundering cycles increases within the scope of this work, the strength of the fabrics
gradually increases up to the 9th
washing cycles.
One of the noted effects of this study is that the higher breaking load properties
observed from the selected treated portions of the hospital linen [blood stained samples
from ABUTH] is applicable to only those portions of the fabric and as such the regular
tension across the entire length and breadth of the fabric is disrupted to a point of which
the fabric stability and functionality is compromised, there-by degrading the linen.
Hence, during the physical and mechanical agitation of the washing processes over time

lxxii
and the pulling action exerted on the fabrics when unloading the goods from the washing
machine may generate a tear on the fabric.
The green theatre linen did not show any iron residual stains after the sample were
stained with blood and washed. The breaking load of the green linen increased only
minimally up to the 9th
washings. This could be due to its fabric shrinkage properties.
The fabric moisture content and moisture regain of the hospital linen also
increases up to the 9th
laundering cycles. The blood stained samples ABUTH still showed
the highest percentage of moisture content and moisture regain and this could be as a
result of the ammonia reagent used for treating the iron residual stain on the white
hospital linen after the usual staining and washings as this may have a swelling effect on
the fabric which also have a positive effect on the crease recovery property of the hospital
linen (Barbara, 2008). Other samples show very minimal differences in their variation
after repeated laundering.
After the repeated laundering, the green theatre linen showed a little decrease in
the moisture content and moisture regain caused by shrinkage during laundering. Fabric
shrinkage occurs because of fabric relaxation and also irrecoverable shrinkage of cotton
fibres during repeated wetting and drying.
The spotted fabric colour changes in shades (after every bleaching action)
increases up to the 9th
laundering cycles. It is evident under visual observation that the
hospital linen exhibits an after yellowing colouring effect on the stained area of the sheets
as a result of the repeated bleaching action on the blood stained samples. As a result, the
deeper change in shade occurred with ABUTH and NOH hospital linen up to the 9th
washing. The untreated and urine treated samples showed evident of a slight change in

lxxiii
colour on the bases of no bleaching agent after repeated washings. The green theatre
linen equally showed a slight change in shade after all washings due to the absence of any
bleaching agent.
The fabric shrinkage of the hospital linen increases after repeated laundering up to
the ninth wash but the rate of this shrinkage is lower with the blood stained sample from
ABUTH. This could also be as a result of the ammonia reagent used for removal of the
iron residual stains on the white hospital linen since it has a positive effect on the crease
recovery property and can as well improve the dimensional stability of the hospital linen
(Barbara, 2008). The green theatre linen showed a minimal increase in its percentage
shrinkage which was affected by repeated laundering up to the 9th
wash.
In summary, one can generally assume that the performance of the hospital linen
is limited by the action of the reagents used as stain removal methods by the various
hospitals. While the breaking load, moisture content and moisture regain and even
shrinkage was enhanced from the applicable methods of ABUTH on its white hospital
linen, it showed a high change in shade resulting in an obvious yellowing effect on the
white fabric. Other untreated and urine stained sample were accompanied with lower
tensile strength, moisture content and moisture regain properties when compared with the
blood stained samples from ABUTH.
Blood stains on fabric can usually be removed without any application of reagent
when washed immediately or soaked in water and washed subsequently without getting
dried. But under some unavoidable circumstances in a large hospital setting and
sometimes with poor water supply the reverse may be the case in practical terms.
However, it is advised under best practice to advocate the linen users to minimally wet or

lxxiv
damp areas of the blood stained fabric with substantial amount of water when they cannot
be soaked thereby making them damp and putting them in a size-able poly-laundry bag
and tied so these goods can get to the laundry damp and not dried. When washed wet,
these will eliminate the use of the costly reagents and its consequential effects on the
fabrics. This is cost effective, saves time and improves the quality and use of these
fabrics.
5.1 Recommendation
For further research purposes, it is recommended that other stain removal methods
be performed for removing dried blood stained linen, for instance, the use of common
iodized salts which are less cost effective and other non hazardous chemical reactive
processes be considered and adopted. Additional testing of colourfastness, tear strength
test and other physical parameters after laundering would be beneficial for a more in-
depth study of the use of these types of fabrics for hospital applications.

lxxv
REFERENCES
Answers.com, (2011). What is the composition of urine? Answers.com. Retrieved
January 12th
, 2011,
From http://www.answers.com
Barbara, (2008). Improving Quality of Linen- Cotton Fabrics with liquid ammonia
treatment, Journal of Natural Fibres, Vol. 4 Issue 4, pp. 41-57.
Barry, W.K. (1998). An Introduction to Laundry Chemistry. Pp. 3-7; 10-16 and 28-37. Published
by the Guide of Cleaners and Launderers.
Birds, S. L. (1984). A review of the prediction of Textile wear performance with specific
reference to Abrasion, SAWTRI special publication, Port Elizabeth.
Brojeswari, D., Apurba, D., Vijay, K., (2009). Journal of Engineering Fibre and Fabrics, Vol. 4,
Issue 4.
Booth, J. E. (1968). Principle of Textile Testing, 3rd
Edition, A Butter-Worth Publication.
British Standard Handbook, (1974). No. 11, “Methods of Test for Textiles, British
Standard Institute, London.
BS 5058 method for the assessment of drape of fabrics.
Charles, (2010). City-Data Forum: What causes clothes to shrink? Retrieved
January 3rd
, 2010,
From www.city-data.com/forum/house/909563-what-causes-clothes-shrink.html
Emilija, T. and Biljana, M. (2011). Effect of Laundering of Cotton Knitted Fabrics with
Different Detergents on the Dimensional Stability and Colour Fastness. Retrieved
November 30th
, 2011,
From http://www.fibre2fashion.com
Encyclopedia of Polymer Science and Technology, (1990). Vol. 13, pp. 386.
Galbraith, R. L. (1975). Abrasion of Textile Surface in Surface Characteristics of Fibre and
Textile. Part 1, Shick M. J. edition.

lxxvi
Hamburger, W. J. (1994). Textile Research Journal. 15, pp 169.
Hatch, K. (1993). Textile Science. West Publishing Co., NY.
Higgins, L., Anand, S.C., Holmes, D.A., Hall, M.E., (2003). Textile Research Journal, Vol. 73
No. 4. Pp 357-366.
Ian, H. (2010). Material solutions. Strategies for healthcare laundering. Laundry and Cleaning
News international, LCNi. Retrieved
November 19th
, 2011,
From http://www.laundryandcleaningnews.com
Ibrahim, H. D. (1987). M.Sc. Thesis, Ahmadu Bello University, Zaria.
Lav, L., Fan, J., Siv, T., Siu, L.Y.C. (2002). Textile Research Journal, Vol. 72 No. 10. Pp.
931-937.
Matsudaira, M. and Qin, A. (1995). “Features” and Mechanical Parameters of a fabric‟s
Compressional Property; Journal Textile Institute, pp 86, 476.
Mclntyre, J. E. and Daniels, P. N. (1995), Textile terms and definitions, 10th edition. Textile
Institute, Manchester.
Membranes, (2011). Advanced level- Sim-Science Blood: Composition and Functions. Retrieved
May 21, 2011,
From http://simscience.org/membrane/advanced/essay/blood
Mittal, L.K. (1978). Solution Chemistry of Surfactant, Vol. 1. Plenum Press, London.
Moji, A.B. (2000). Polymers: The Chemistry and Technology of Modern Material. Yaba College
of Technology, Concept Publications Ltd, Yaba, Lagos, pp 193.
Morten, W. E. and Hearle, J. W. S. (1993). Physical Properties of Textile Fibres, 3rd
edition.
Textile Institute, Manchester.
Ogri, K. (2009). A Study on the effect of repeated laundering on some physical and
mechanical properties of cotton fabrics. An Unpublished B.Sc. Project, Ahmadu Bello
University, Zaria.

lxxvii
Omole, M.T. (1994). Criteria for assessing cleaning efficiency of soaps and detergents. An
Unpublished B.Sc. Project. Ahmadu Bello University, Zaria.
Perdue, G.R. (1970). Laundering and Dry-cleaning. Textile Progress, Vol. 2 Issue 2: pp 30-33.
Peter, O.N. (1993). Introductory Textiles. S. Asekome & Co. Publishers, Samaru-Zaria, Nigeria,
pp 5-22, 118-130,119-120.
Pierce, F. T. (1980). The handle of Cloth as a measureable quantity, Journal Textile Institute,
21T 377.
Shurkian, O., Amirbayat, J., Gong, R. H. (2002). Journal of Textile Machinery Society of Japan,
Vol. 55, No. 4, pp. 39-42.

lxxviii
APPENDICES
Table 3.3.1: Breaking Load Test for third Wash (Dry Sample) - Hospital Linen
Sample
Breaking load (N) Extension at break (mm)
ABUTH
Warp
Weft
Warp
Weft
Untreated
95.79
86.75
10.34
9.07
Treated (Blood)
102.48
95.28
14.97
10.29
Treated (Urine)
95.01
85.24
10.25
8.89
AKTH
Untreated
96.98
87.20
10.61
9,98
Treated (Blood)
96.40
87.35
10.50
9.85
Treated (Urine)
95.59
88.04
10.60
9.44
NOH
Untreated
94.14
85.41
9.95
8.59
Treated (Blood)
93.55
84.24
9.20
8.40
Treated (Urine)
92.89
84.58
10.04
8.22
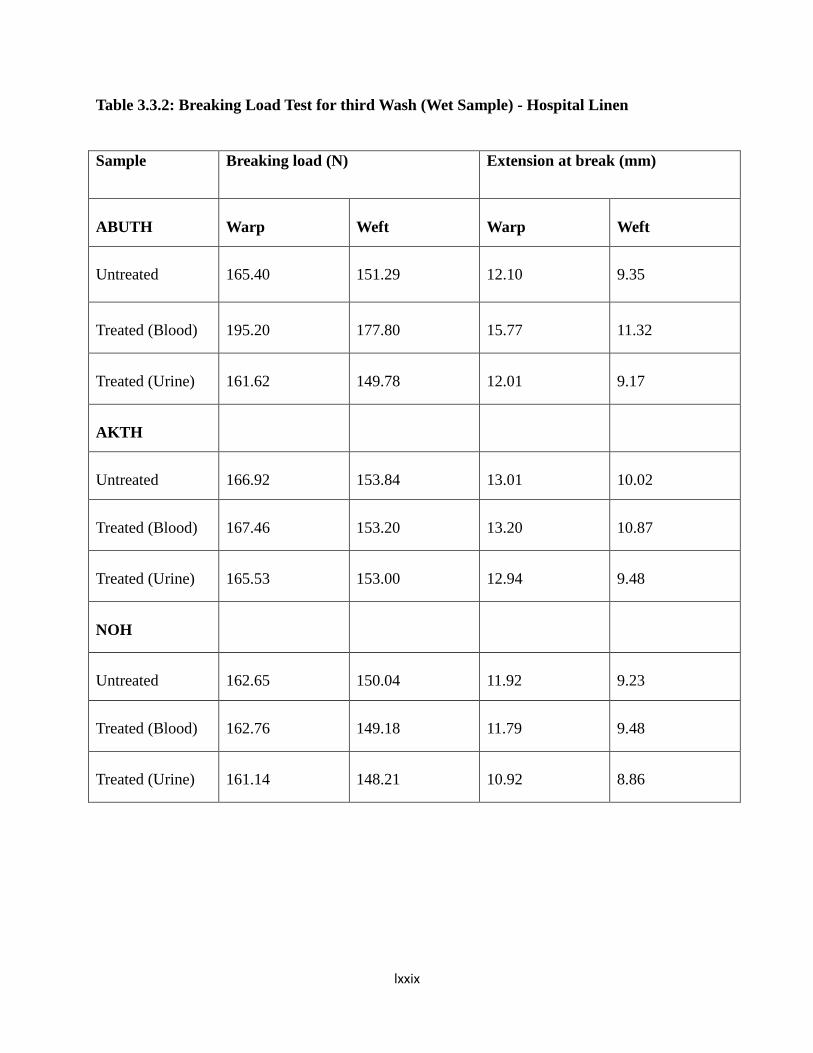
lxxix
Table 3.3.2: Breaking Load Test for third Wash (Wet Sample) - Hospital Linen
Sample
Breaking load (N) Extension at break (mm)
ABUTH
Warp
Weft
Warp
Weft
Untreated
165.40
151.29
12.10
9.35
Treated (Blood)
195.20
177.80
15.77
11.32
Treated (Urine)
161.62
149.78
12.01
9.17
AKTH
Untreated
166.92
153.84
13.01
10.02
Treated (Blood)
167.46
153.20
13.20
10.87
Treated (Urine)
165.53
153.00
12.94
9.48
NOH
Untreated
162.65
150.04
11.92
9.23
Treated (Blood)
162.76
149.18
11.79
9.48
Treated (Urine)
161.14
148.21
10.92
8.86

lxxx
Table 3.3.3: Breaking Load Test for Control Sample (Dry and Wet Sample) Hospital Linen
Sample
Breaking load (N) Extension at break (mm)
ABUTH
Warp
Weft
Warp
Weft
Untreated
165.40
151.29
12.10
9.35
Treated (Blood)
195.20
177.80
15.77
11.32
Treated (Urine)
161.62
149.78
12.01
9.17
AKTH
Untreated
166.92
153.84
13.01
10.02
Treated (Blood)
167.46
153.20
13.20
10.87
Treated (Urine)
165.53
153.00
12.94
9.48
NOH
Untreated
162.65
150.04
11.92
9.23
Treated (Blood)
162.76
149.18
11.79
9.48
Treated (Urine)
161.14
148.21
10.92
8.86

lxxxi
Table 3.3.4: Breaking Load Test for sixth Wash (Dry Sample) - Hospital Linen.
Sample
Breaking load (N) Extension at break (mm)
ABUTH
Warp
Weft
Warp
Weft
Untreated
110.63
94.21
10.84
9.98
Treated (Blood)
120.59
109.35
15.37
10.52
Treated (Urine)
109.22
92.70
10.75
9.22
AKTH
Untreated
113.46
97.86
10.89
10.06
Treated (Blood)
114.49
97.98
10.02
10.94
Treated (Urine)
112.07
97.20
10.87
9.64
NOH
Untreated
106.16
92.64
10.62
9.42
Treated (Blood)
105.89
91.18
10.04
9.18
Treated (Urine)
104.91
90.81
10.53
9.05

lxxxii
Table 3.3.5: Breaking Load Test for sixth Wash (Wet Sample) - Hospital Linen Sample
Breaking load (N) Extension at break (mm)
ABUTH
Warp
Weft
Warp
Weft
Untreated
167.20
138.08
11.46
9.12
Treated (Blood)
201.02
146.34
16.94
12.17
Treated (Urine)
166.42
136.57
11.37
8.94
AKTH
Untreated
171.83
140.34
12.03
10.18
Treated (Blood)
170.27
140.12
11.89
10.92
Treated (Urine)
170.44
139.50
11.96
9.64
NOH
Untreated
163.19
134.07
11.01
9.34
Treated (Blood)
162.44
133.22
10.64
9.59
Treated (Urine)
161.68
132.24
10.08
8.97

lxxxiii
Table 3.3.6: Breaking Load Test for ninth Wash (Dry Sample) - Hospital Linen
Sample
Breaking load (N) Extension at break (mm)
ABUTH
Warp
Weft
Warp
Weft
Untreated
136.46
130.82
11.24
10.09
Treated (Blood)
150.88
141.91
16.48
12.83
Treated (Urine)
135.05
129.31
11.15
9.33
AKTH
Untreated
135.18
128.24
10.94
9.95
Treated (Blood)
135.32
128.16
10.12
9.04
Treated (Urine)
133.79
127.58
10.92
9.58
NOH
Untreated
133.63
127.14
9.04
9.62
Treated (Blood)
132.24
126.39
9.87
8.47
Treated (Urine)
132.38
125.31
8.95
9.25

lxxxiv
Table 3.3.7: Breaking Load Test for ninth Wash (Wet Sample) - Hospital Linen
Sample
Breaking load (N) Extension at break (mm)
ABUTH
Warp
Weft
Warp
Weft
Untreated
179.80
163.20
11.24
11.28
Treated (Blood)
205.21
172.01
16.37
12.38
Treated (Urine)
179.02
161.69
11.55
11.10
AKTH
Untreated
179.60
162.47
9.67
8.04
Treated (Blood)
178.72
163.94
9.01
9.20
Treated (Urine)
178.21
161.63
9.60
7.50
NOH
Untreated
176.53
162.47
9.86
10.04
Treated (Blood)
176.07
161.22
10.23
10.44
Treated (Urine)
175.02
160.64
8.93
9.67

lxxxv
Table 3.3.8: Breaking Load Test for third Wash (Dry Sample) - Green Theatre Linen
Sample
Breaking load (N) Extension at break (mm)
ABUTH
Warp
Weft
Warp
Weft
Untreated
96.81
87.77
11.36
10.09
Treated (Blood)
96.03
86.26
11.27
9.91
AKTH
Untreated
98.00
88.23
11.63
11.02
Treated (Blood)
96.61
89.06
11.06
10.46
NOH
Untreated
95.16
86.43
10.97
9.61
Treated (Blood)
93.91
84.60
11.07
9.25

lxxxvi
Table 3.3.9: Breaking Load Test for third Wash (Wet Sample) - Green Theatre Linen
Sample
Breaking load (N) Extension at break (mm)
ABUTH
Warp
Weft
Warp
Weft
Untreated
166.43
152.31
13.13
10.37
Treated (Blood)
162.65
150.81
13.03
10.19
AKTH
Untreated
167.95
154.86
14.04
11.05
Treated (Blood)
166.55
154.03
13.97
10.51
NOH
Untreated
163.67
151.07
12.95
10.25
Treated (Blood)
162.17
149.23
11.88
9.69

lxxxvii
Table 3.3.10: Breaking Load Test for Control Sample (Dry and Wet Sample) Green Theatre
Linen
Sample
Breaking load (N)
Extension at break (mm)
DRY:
Warp
Weft
Warp
Weft
ABUTH
106.03
82.59
11.07
9.15
AKTH
103.45
80.11
10.89
9.11
NOH
103.13
81.67
10.27
9.45
WET:
ABUTH
163.43
114.57
11.55
10.39
AKTH
160.83
112.05
11.97
10.35
NOH
160.97
113.60
10.85
10.01
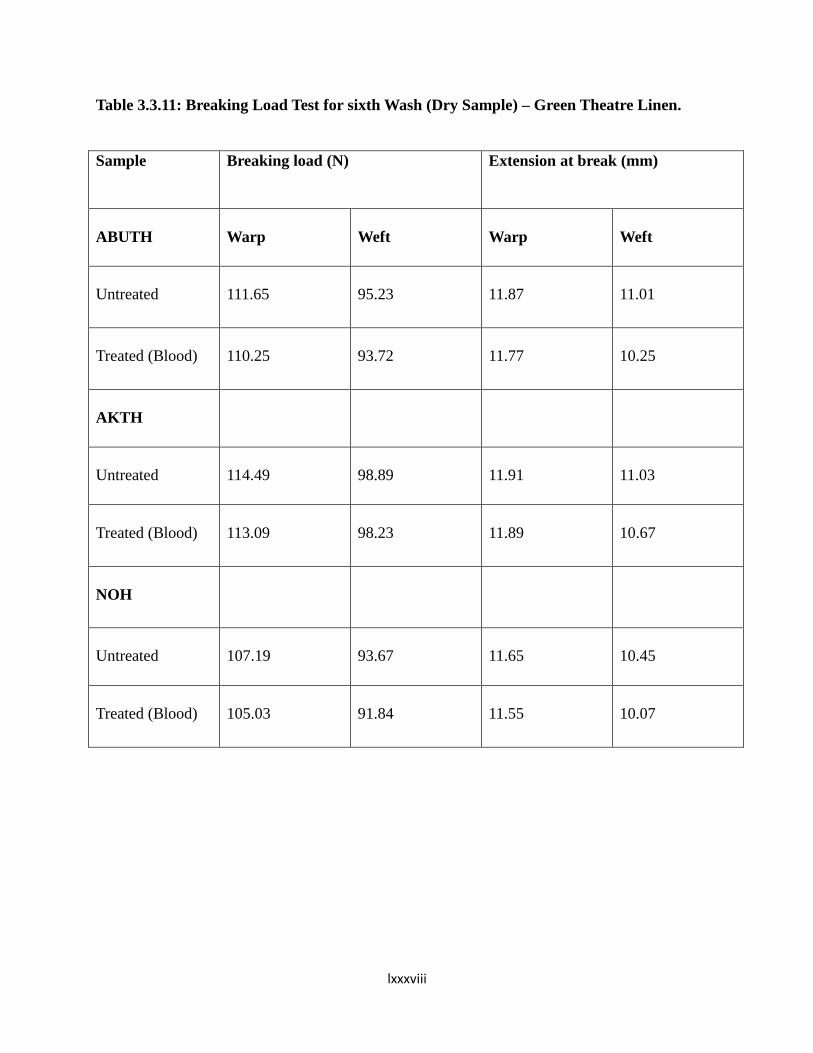
lxxxviii
Table 3.3.11: Breaking Load Test for sixth Wash (Dry Sample) – Green Theatre Linen.
Sample
Breaking load (N) Extension at break (mm)
ABUTH
Warp
Weft
Warp
Weft
Untreated
111.65
95.23
11.87
11.01
Treated (Blood)
110.25
93.72
11.77
10.25
AKTH
Untreated
114.49
98.89
11.91
11.03
Treated (Blood)
113.09
98.23
11.89
10.67
NOH
Untreated
107.19
93.67
11.65
10.45
Treated (Blood)
105.03
91.84
11.55
10.07

lxxxix
Table 3.3.12: Breaking Load Test for sixth Wash (Wet Sample) – Green Theatre Linen Sample
Breaking load (N) Extension at break (mm)
ABUTH
Warp
Weft
Warp
Weft
Untreated
168.23
139.11
12.48
10.15
Treated (Blood)
167.45
137.59
12.39
9.97
AKTH
Untreated
172.85
141.37
13.05
11.21
Treated (Blood)
171.47
140.52
12.99
10.67
NOH
Untreated
164.21
135.09
12.03
10.37
Treated (Blood)
162.71
133.27
11.11
9.99

xc
Table 3.3.13: Breaking Load Test for ninth Wash (Dry Sample) – Green Theatre Linen
Sample
Breaking load (N) Extension at break (mm)
ABUTH
Warp
Weft
Warp
Weft
Untreated
137.49
131.85
12.27
11.11
Treated (Blood)
136.07
130.33
12.19
10.35
AKTH
Untreated
136.21
129.27
11.97
10.99
Treated (Blood)
134.81
128.61
11.95
10.61
NOH
Untreated
134.65
128.17
10.07
10.65
Treated (Blood)
133.41
126.33
9.98
10.27

xci
Table 3.3.14: Breaking Load Test for ninth Wash (Wet Sample) – Green Theatre Linen
Sample
Breaking load (N) Extension at break (mm)
ABUTH
Warp
Weft
Warp
Weft
Untreated
180.83
164.23
12.67
12.31
Treated (Blood)
180.05
162.71
12.59
12.12
AKTH
Untreated
180.63
137.49
10.69
9.07
Treated (Blood)
179.23
136.65
10.63
8.25
NOH
Untreated
177.55
163.49
10.89
11.07
Treated (Blood)
176.05
161.67
9.95
10.69

xcii
Table 3.4.1: Moisture Content and Regain for Hospital Linen, at different washing cycles
3
rd Wash
Hospital linen Moisture
Content (%)
Moisture
Regain (%)
Standard
deviation
C.V (%)
ABUTH:
Untreated
1.35
1.33
0.01
0.75
Treated(Blood)
2.53
2.47
0.03
1.21
Treated(Urine)
1.35
1.33
0.01
0.75
AKTH:
Untreated
1.26
1.24
0.01
0.81
Treated(Blood)
1.26
1.24
0.01
0.81
Treated(Urine)
1.25
1.23
0.01
0.81
NOH:
Untreated
1.27
1.25
0.01
0.80
Treated(Blood)
1.32
1.30
0.01
0.77
Treated(Urine)
1.27
1.25
0.01
0.80
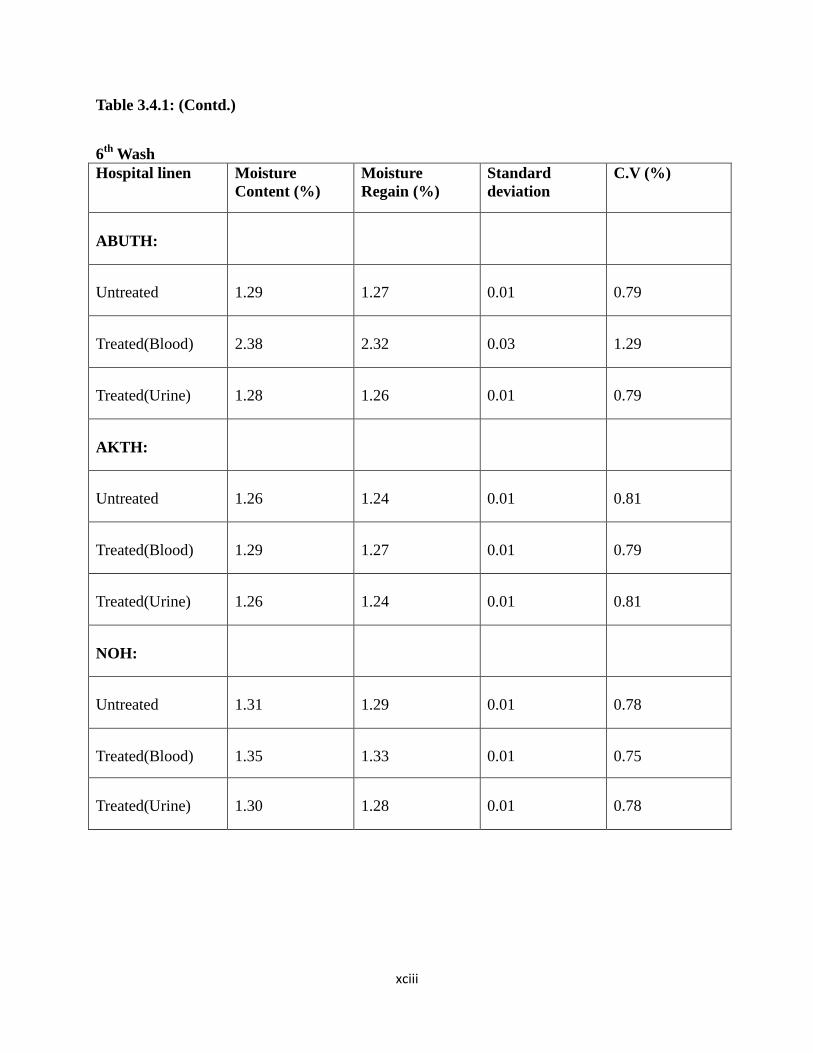
xciii
Table 3.4.1: (Contd.)
6
th Wash
Hospital linen Moisture
Content (%)
Moisture
Regain (%)
Standard
deviation
C.V (%)
ABUTH:
Untreated
1.29
1.27
0.01
0.79
Treated(Blood)
2.38
2.32
0.03
1.29
Treated(Urine)
1.28
1.26
0.01
0.79
AKTH:
Untreated
1.26
1.24
0.01
0.81
Treated(Blood)
1.29
1.27
0.01
0.79
Treated(Urine)
1.26
1.24
0.01
0.81
NOH:
Untreated
1.31
1.29
0.01
0.78
Treated(Blood)
1.35
1.33
0.01
0.75
Treated(Urine)
1.30
1.28
0.01
0.78

xciv
Table 3.4.1: (Contd.)
9th
Wash
Hospital linen Moisture
Content (%)
Moisture
Regain (%)
Standard
deviation
C.V (%)
ABUTH:
Untreated
1.28
1.26
0.01
0.79
Treated(Blood)
2.33
2.28
0.03
1.31
Treated(Urine)
1.28
1.26
0.01
0.79
AKTH:
Untreated
1.26
1.24
0.01
0.81
Treated(Blood)
1.29
1.27
0.01
0.79
Treated(Urine)
1.25
1.23
0.01
0.81
NOH:
Untreated
1.29
1.27
0.01
0.79
Treated(Blood)
1.30
1.28
0.01
0.78
Treated(Urine)
1.28
1.26
0.01
0.79

xcv
Table 3.4.2: Moisture Content & Moisture Regain for the Green Theatre Linen at
different washing cycles 3
rd Wash
Green Theatre
linen
Moisture
Content (%)
Moisture
Regain (%)
Standard
deviation
C.V (%)
ABUTH:
Untreated
1.36
1.34
0.01
0.75
Treated(Blood)
1.35
1.33
0.01
0.75
AKTH:
Untreated
1.27
1.25
0.01
0.80
Treated(Blood)
1.27
1.25
0.01
0.81
NOH:
Untreated
1.27
1.25
0.01
0.80
Treated(Blood)
1.27
1.25
0.01
0.80
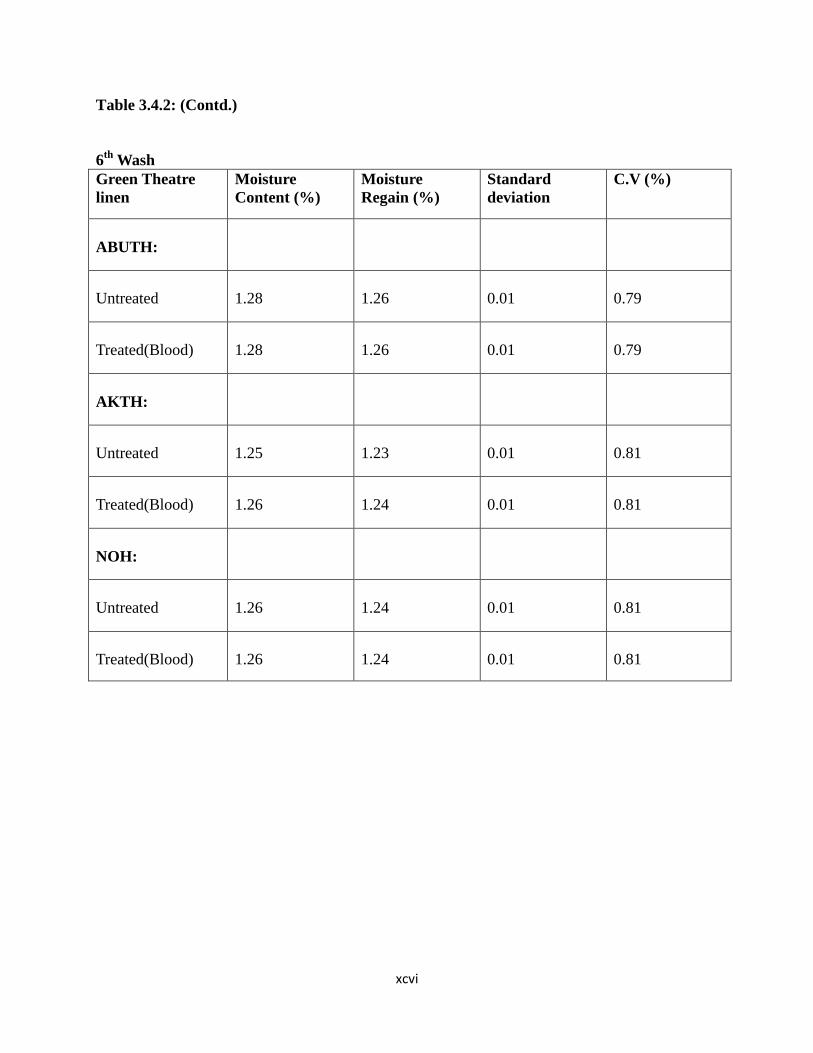
xcvi
Table 3.4.2: (Contd.)
6
th Wash
Green Theatre
linen
Moisture
Content (%)
Moisture
Regain (%)
Standard
deviation
C.V (%)
ABUTH:
Untreated
1.28
1.26
0.01
0.79
Treated(Blood)
1.28
1.26
0.01
0.79
AKTH:
Untreated
1.25
1.23
0.01
0.81
Treated(Blood)
1.26
1.24
0.01
0.81
NOH:
Untreated
1.26
1.24
0.01
0.81
Treated(Blood)
1.26
1.24
0.01
0.81

xcvii
Table 3.4.2: (Contd.)
9
th Wash
Green Theatre
linen
Moisture
Content (%)
Moisture
Regain (%)
Standard
deviation
C.V (%)
ABUTH:
Untreated
1.28
1.26
0.01
0.79
Treated(Blood)
1.27
1.25
0.01
0.80
AKTH:
Untreated
1.25
1.23
0.01
0.81
Treated(Blood)
1.25
1.23
0.01
0.81
NOH:
Untreated
1.26
1.24
0.01
0.81
Treated(Blood)
1.26
1.24
0.01
0.81