Embed Size (px)
Citation preview
Comparative Analysis ofSmall ILEC CHCF-A Carriers to
Non-CHCF-A Carriers2011
Communications Division December 2011
2
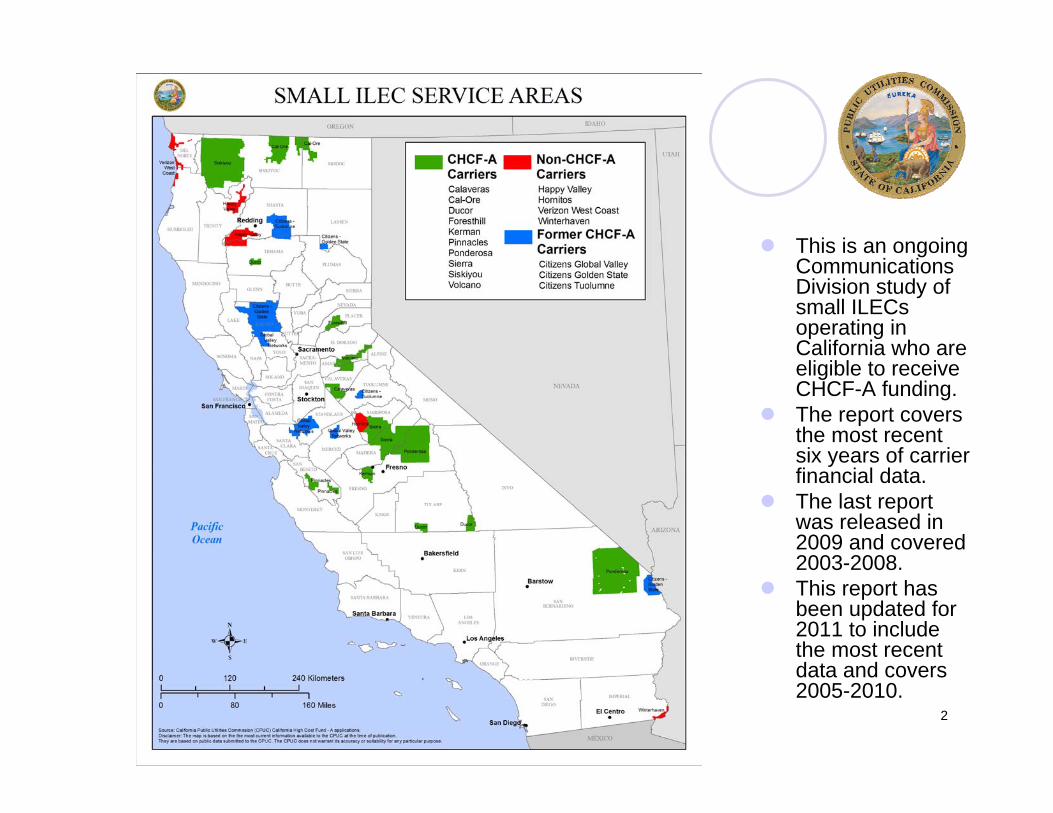
This is an ongoing Communications Division study of small ILECsoperating in California who are eligible to receive CHCF-A funding.The report covers the most recent six years of carrier financial data.The last report was released in 2009 and covered 2003-2008.This report has been updated for 2011 to include the most recent data and covers 2005-2010.
3
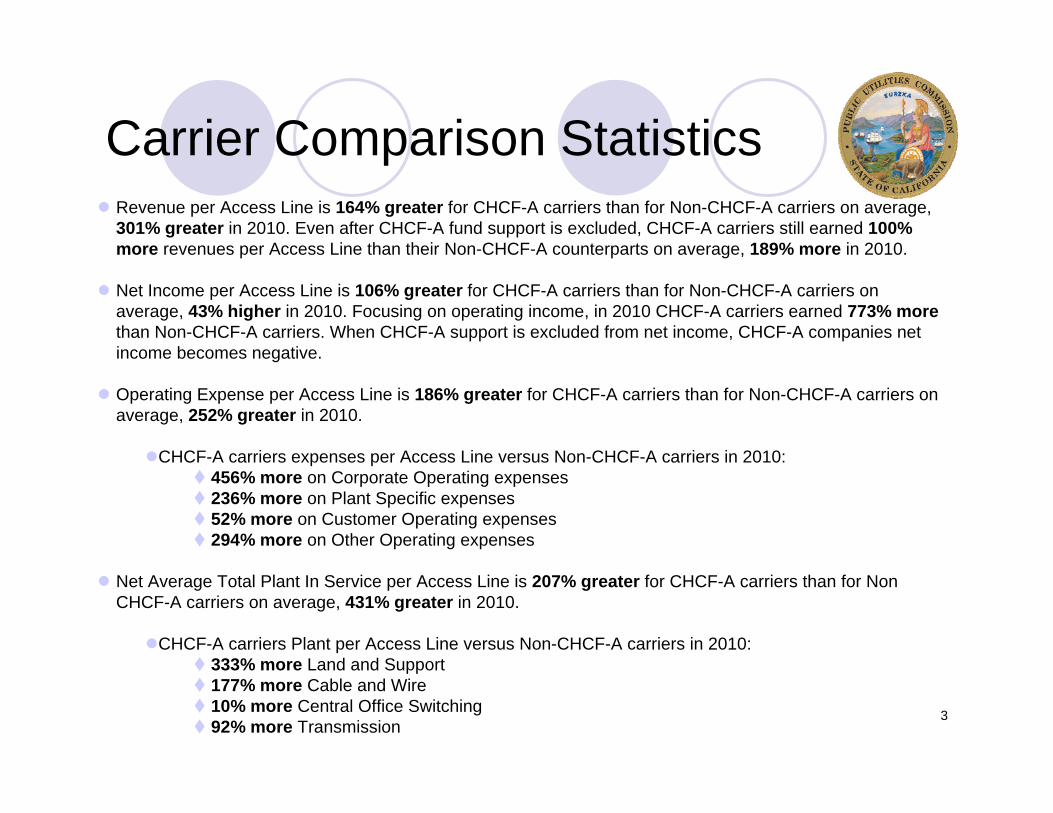
Carrier Comparison StatisticsRevenue per Access Line is 164% greater for CHCF-A carriers than for Non-CHCF-A carriers on average, 301% greater in 2010. Even after CHCF-A fund support is excluded, CHCF-A carriers still earned 100% more revenues per Access Line than their Non-CHCF-A counterparts on average, 189% more in 2010.
Net Income per Access Line is 106% greater for CHCF-A carriers than for Non-CHCF-A carriers on average, 43% higher in 2010. Focusing on operating income, in 2010 CHCF-A carriers earned 773% morethan Non-CHCF-A carriers. When CHCF-A support is excluded from net income, CHCF-A companies net income becomes negative.
Operating Expense per Access Line is 186% greater for CHCF-A carriers than for Non-CHCF-A carriers on average, 252% greater in 2010.
CHCF-A carriers expenses per Access Line versus Non-CHCF-A carriers in 2010:456% more on Corporate Operating expenses236% more on Plant Specific expenses52% more on Customer Operating expenses294% more on Other Operating expenses
Net Average Total Plant In Service per Access Line is 207% greater for CHCF-A carriers than for Non CHCF-A carriers on average, 431% greater in 2010.
CHCF-A carriers Plant per Access Line versus Non-CHCF-A carriers in 2010:333% more Land and Support177% more Cable and Wire10% more Central Office Switching92% more Transmission
4
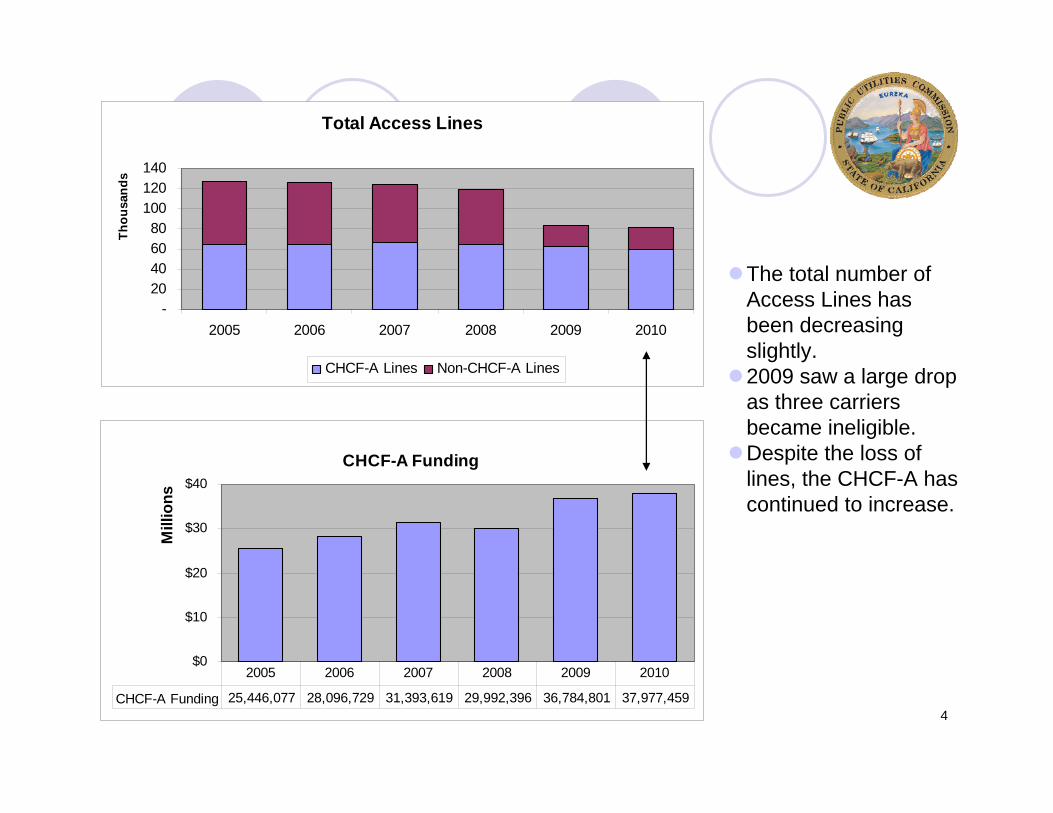
The total number of Access Lines has been decreasing slightly.2009 saw a large drop as three carriers became ineligible.Despite the loss of lines, the CHCF-A has continued to increase.
Total Access Lines
-20406080
100120140
2005 2006 2007 2008 2009 2010
Thou
sand
s
CHCF-A Lines Non-CHCF-A Lines
CHCF-A Funding
$0
$10
$20
$30
$40
Mill
ions
CHCF-A Funding 25,446,077 28,096,729 31,393,619 29,992,396 36,784,801 37,977,459
2005 2006 2007 2008 2009 2010
5
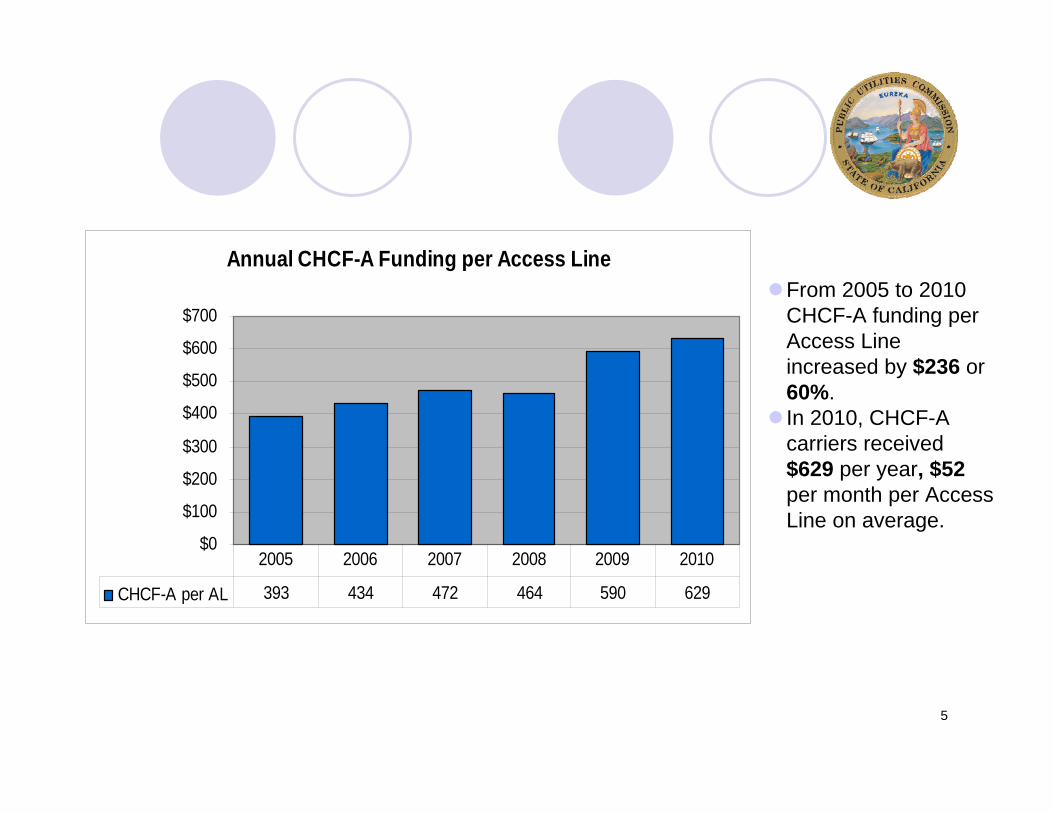
From 2005 to 2010 CHCF-A funding per Access Line increased by $236 or 60%.In 2010, CHCF-A carriers received $629 per year, $52per month per Access Line on average.
Annual CHCF-A Funding per Access Line
$0
$100
$200
$300
$400
$500
$600
$700
CHCF-A per AL 393 434 472 464 590 629
2005 2006 2007 2008 2009 2010
6
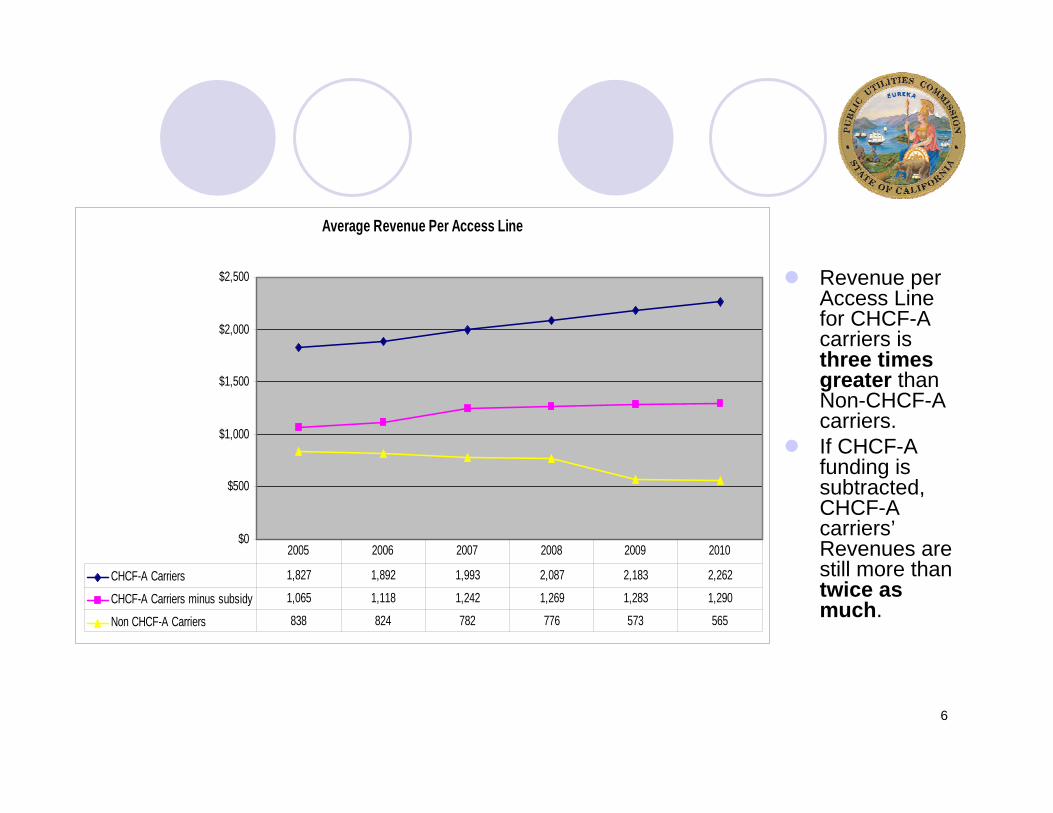
Revenue per Access Line for CHCF-A carriers is three timesgreater than Non-CHCF-A carriers.If CHCF-A funding is subtracted, CHCF-A carriers’Revenues are still more than twice as much.
Average Revenue Per Access Line
$0
$500
$1,000
$1,500
$2,000
$2,500
CHCF-A Carriers 1,827 1,892 1,993 2,087 2,183 2,262
CHCF-A Carriers minus subsidy 1,065 1,118 1,242 1,269 1,283 1,290
Non CHCF-A Carriers 838 824 782 776 573 565
2005 2006 2007 2008 2009 2010
7
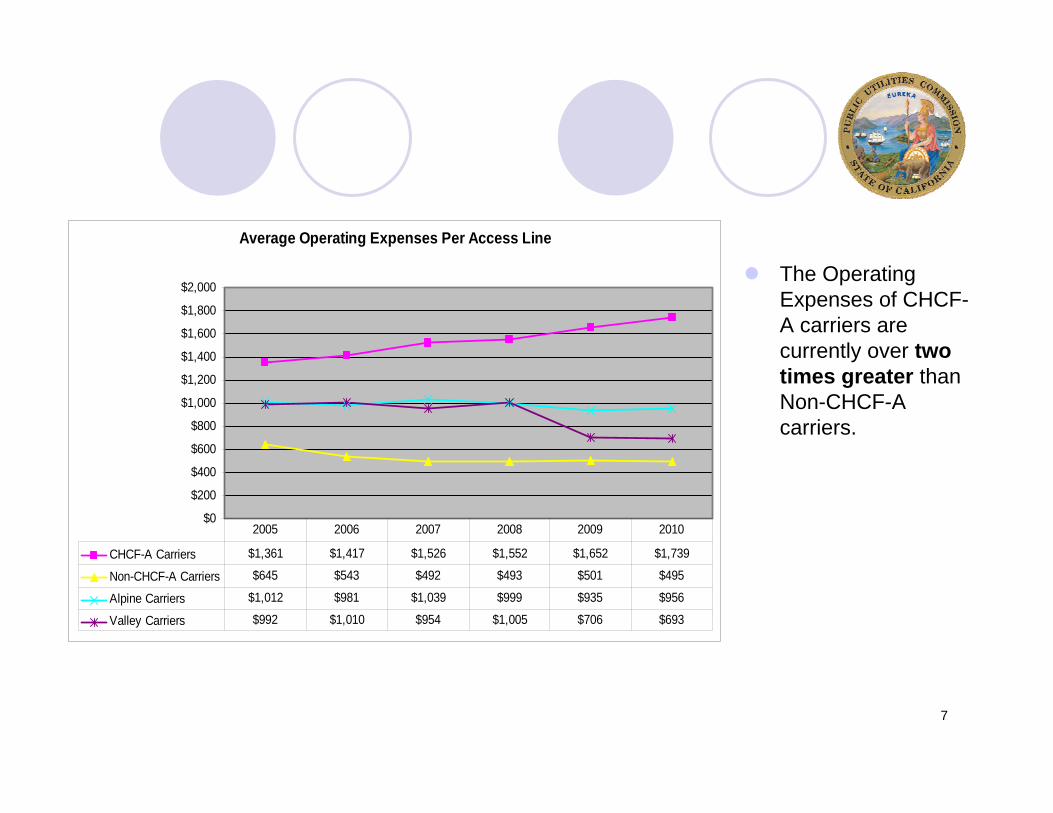
The Operating Expenses of CHCF-A carriers are currently over two times greater than Non-CHCF-A carriers.
Average Operating Expenses Per Access Line
$0
$200
$400
$600
$800
$1,000
$1,200
$1,400
$1,600
$1,800
$2,000
CHCF-A Carriers $1,361 $1,417 $1,526 $1,552 $1,652 $1,739
Non-CHCF-A Carriers $645 $543 $492 $493 $501 $495
Alpine Carriers $1,012 $981 $1,039 $999 $935 $956
Valley Carriers $992 $1,010 $954 $1,005 $706 $693
2005 2006 2007 2008 2009 2010
8
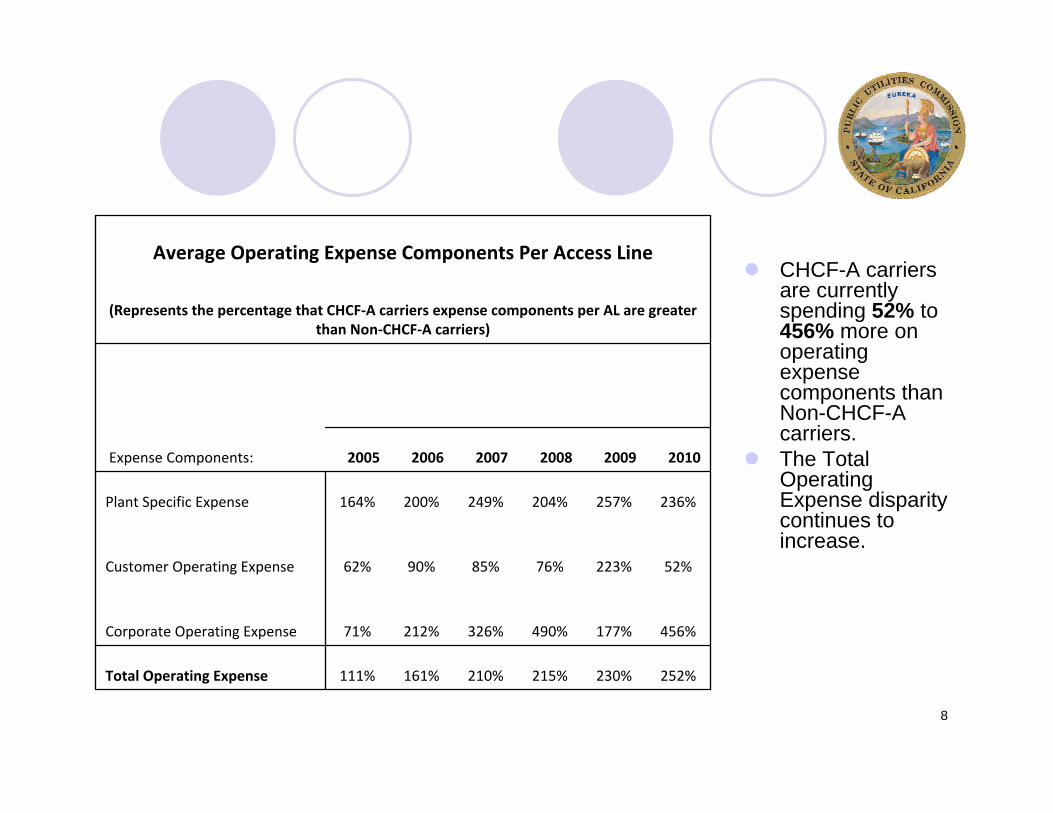
CHCF-A carriers are currently spending 52% to 456% more on operating expense components than Non-CHCF-A carriers.The Total Operating Expense disparity continues to increase.
252%230%215%210%161%111%Total Operating Expense
456%177%490%326%212%71%Corporate Operating Expense
52%223%76%85%90%62%Customer Operating Expense
236%257%204%249%200%164%Plant Specific Expense
201020092008200720062005Expense Components:
(Represents the percentage that CHCF‐A carriers expense components per AL are greater than Non‐CHCF‐A carriers)
Average Operating Expense Components Per Access Line
9
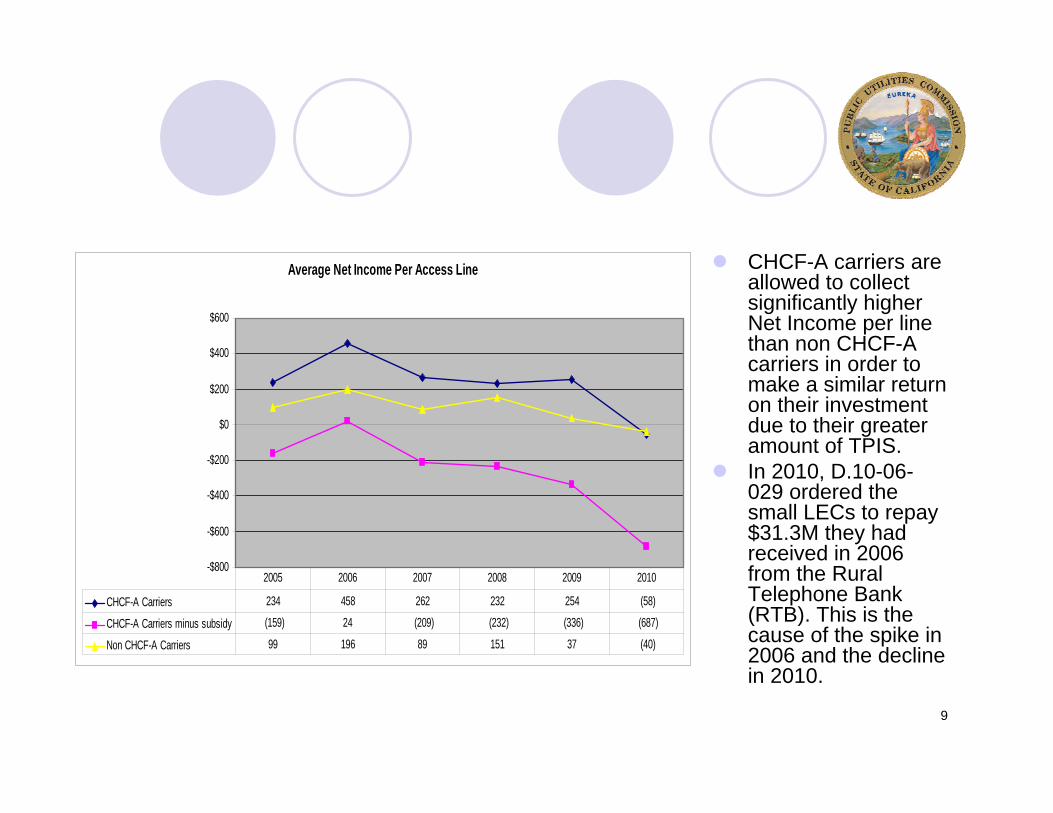
CHCF-A carriers are allowed to collect significantly higher Net Income per line than non CHCF-A carriers in order to make a similar return on their investment due to their greater amount of TPIS.In 2010, D.10-06-029 ordered the small LECs to repay $31.3M they had received in 2006 from the Rural Telephone Bank (RTB). This is the cause of the spike in 2006 and the decline in 2010.
Average Net Income Per Access Line
-$800
-$600
-$400
-$200
$0
$200
$400
$600
CHCF-A Carriers 234 458 262 232 254 (58)
CHCF-A Carriers minus subsidy (159) 24 (209) (232) (336) (687)
Non CHCF-A Carriers 99 196 89 151 37 (40)
2005 2006 2007 2008 2009 2010
10
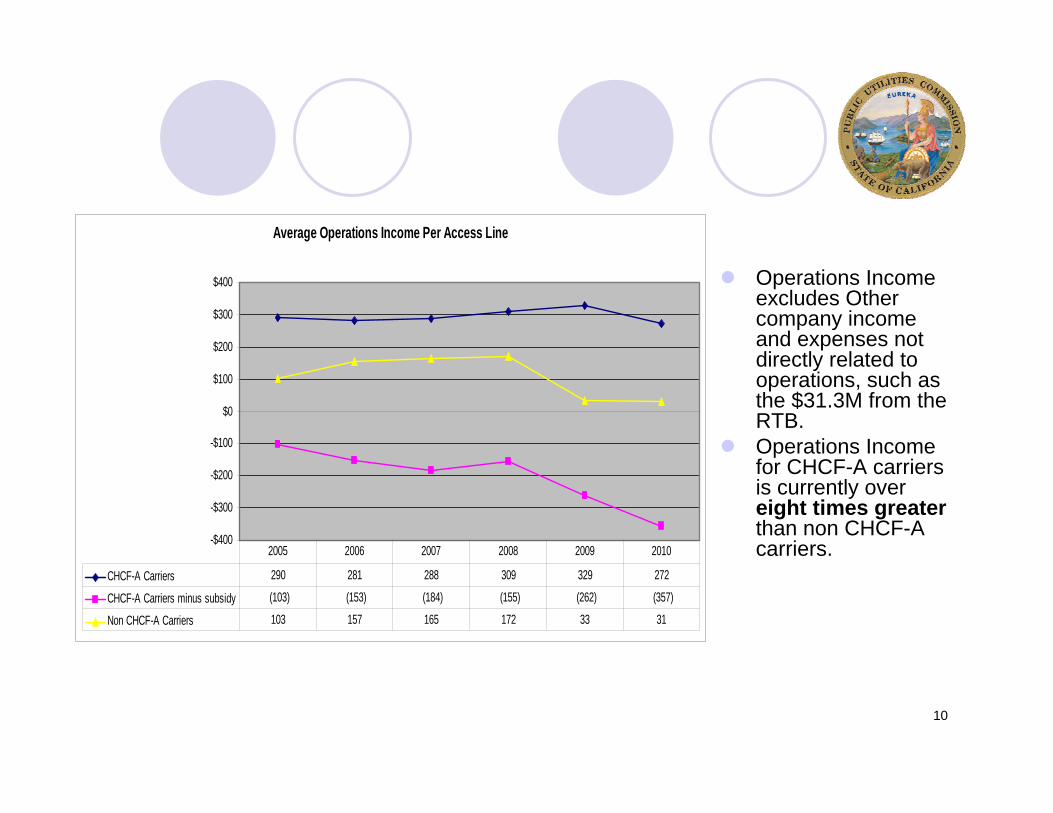
Operations Income excludes Other company income and expenses not directly related to operations, such as the $31.3M from the RTB.Operations Income for CHCF-A carriers is currently over eight times greaterthan non CHCF-A carriers.
Average Operations Income Per Access Line
-$400
-$300
-$200
-$100
$0
$100
$200
$300
$400
CHCF-A Carriers 290 281 288 309 329 272
CHCF-A Carriers minus subsidy (103) (153) (184) (155) (262) (357)
Non CHCF-A Carriers 103 157 165 172 33 31
2005 2006 2007 2008 2009 2010
11
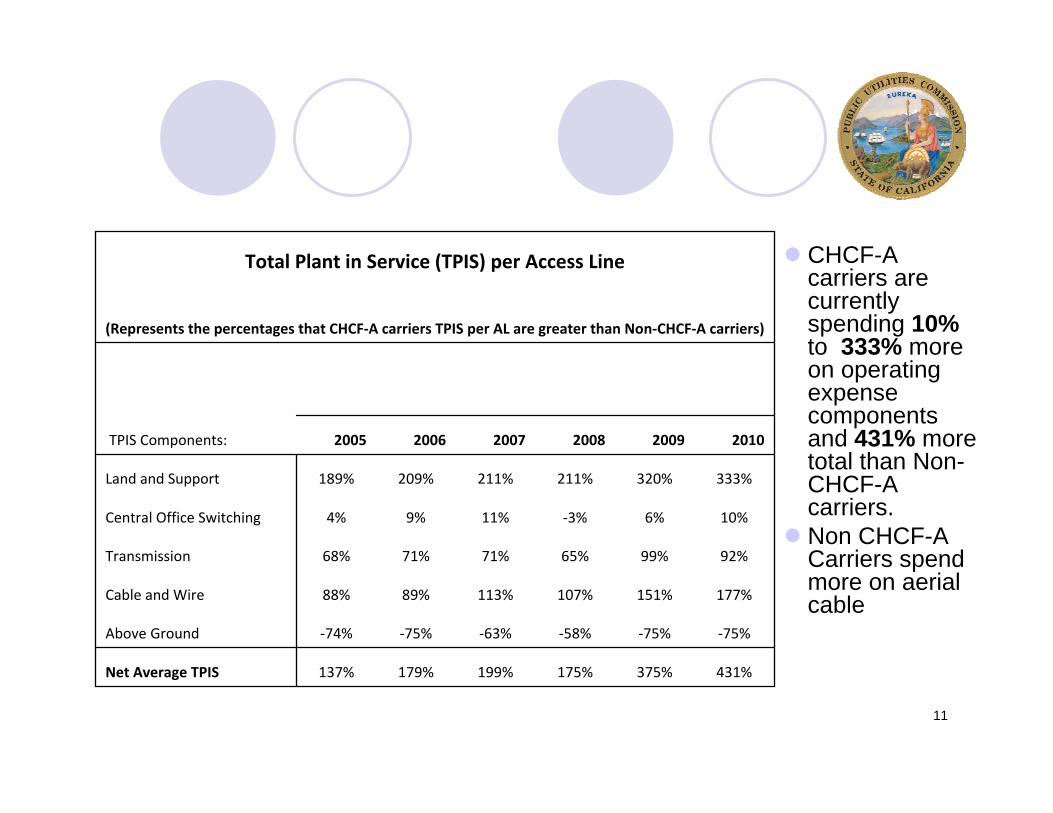
CHCF-A carriers are currently spending 10%to 333% more on operating expense components and 431% more total than Non-CHCF-A carriers.Non CHCF-A Carriers spend more on aerial cable
431%375%175%199%179%137%Net Average TPIS
‐75%‐75%‐58%‐63%‐75%‐74%Above Ground
177%151%107%113%89%88%Cable and Wire
92%99%65%71%71%68%Transmission
10%6%‐3%11%9%4%Central Office Switching
333%320%211%211%209%189%Land and Support
201020092008200720062005TPIS Components:
(Represents the percentages that CHCF‐A carriers TPIS per AL are greater than Non‐CHCF‐A carriers)
Total Plant in Service (TPIS) per Access Line
12
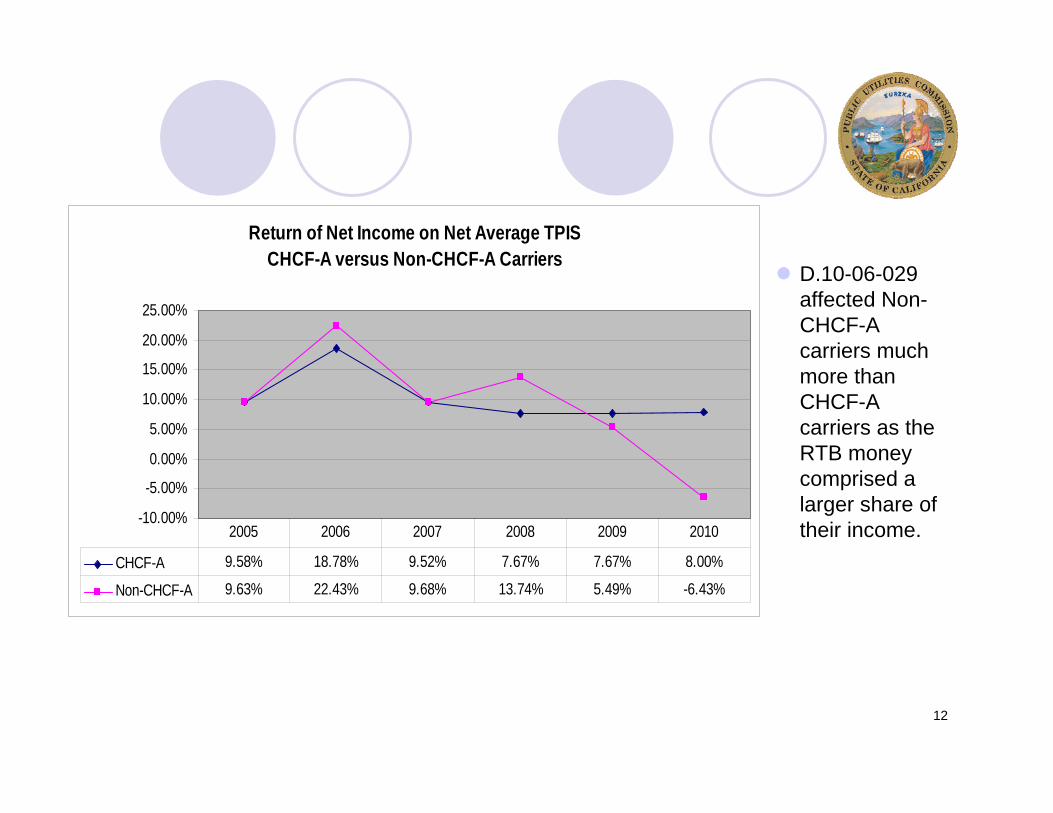
D.10-06-029 affected Non-CHCF-A carriers much more than CHCF-A carriers as the RTB money comprised a larger share of their income.
Return of Net Income on Net Average TPISCHCF-A versus Non-CHCF-A Carriers
-10.00%
-5.00%
0.00%
5.00%
10.00%
15.00%
20.00%
25.00%
CHCF-A 9.58% 18.78% 9.52% 7.67% 7.67% 8.00%
Non-CHCF-A 9.63% 22.43% 9.68% 13.74% 5.49% -6.43%
2005 2006 2007 2008 2009 2010
13
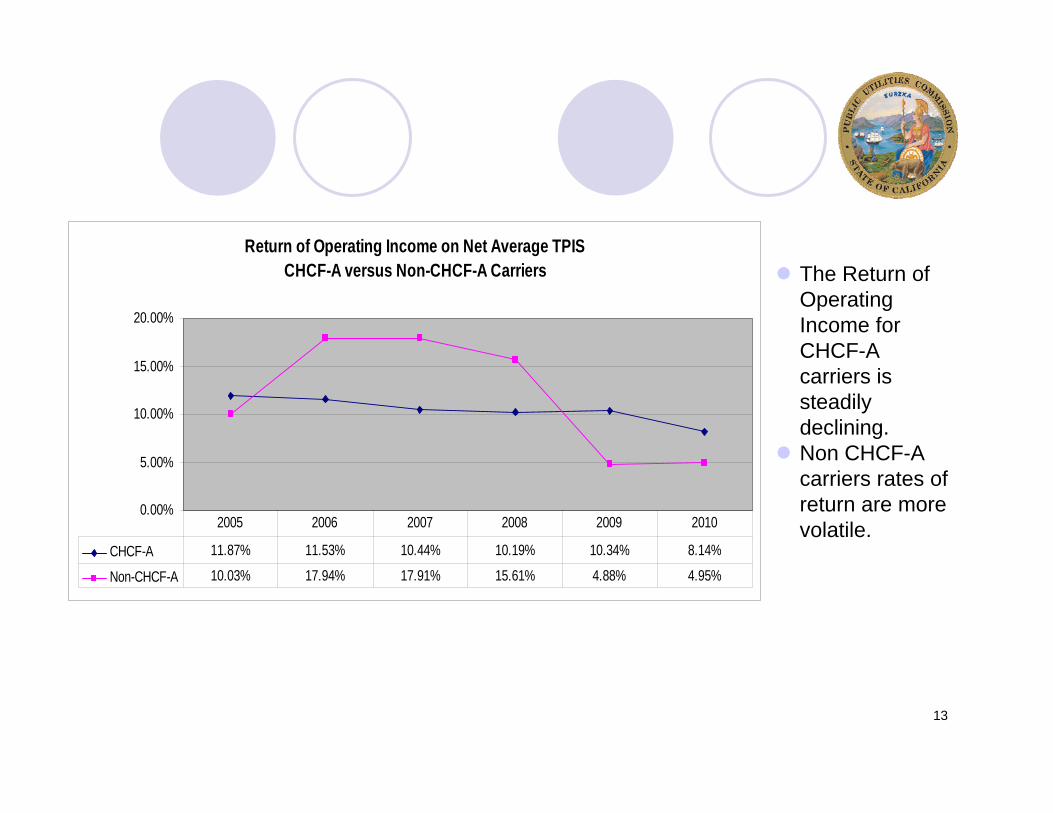
The Return of Operating Income for CHCF-A carriers is steadily declining.Non CHCF-A carriers rates of return are more volatile.
Return of Operating Income on Net Average TPISCHCF-A versus Non-CHCF-A Carriers
0.00%
5.00%
10.00%
15.00%
20.00%
CHCF-A 11.87% 11.53% 10.44% 10.19% 10.34% 8.14%
Non-CHCF-A 10.03% 17.94% 17.91% 15.61% 4.88% 4.95%
2005 2006 2007 2008 2009 2010
14
This second study of CHCF-A carriers was conducted as a continuing effort to determine whether significant differences continue to exist in the business practices of CHCF-A and Non-CHCF-A carriers that may explain their increasingly higher draws from the CHCF-A fund.
The 2009 report found that per line, CHCF-A carriers:Significantly outspent Non-CHCF-A carriersEmployed more plant in service than Non-CHCF-A carriersGenerated greater revenues and net income than non-CHCF-A carriers
These findings remain true in 2011. In fact the disparity between CHCF-A and Non-CHCF-A carriers has increased for all three categories. This growth in disparity is a result of changes in CHCF-A carrier finances. Non CHCF-A carriers’ revenues, expenses, and plant remain relatively even.
Findings
15
Definitions and Information
Access lines: Unique telecommunications access points. One Access Line generally indicates one customer.Alpine Carriers: Carriers with a substantial part of their territory in the mountainous / foothill terrain. They included all carriers except those listed as Valley below.Valley Carriers: Carriers with substantial parts of their territory in non mountainous/mostly flat terrain. For the purpose of this study they were; Ducor, Global Valley, Kerman, and Winterhaven.CHCF-A: California High Cost Fund-ACHCF-A Carriers: Small Local Exchange Carriers (LECs) that receive CHCF-A subsidy funding. They include; Calaveras, Cal-Ore, Ducor, Foresthill, Kerman, Pinnacles, Ponderosa, Sierra, Siskiyou, and Volcano.Non-CHCF-A carriers: Happy Valley, Hornitos, Verizon WC, Winterhaven and Citizens-G, Citizens-T, and Global Valley which, in 2009, become part of Citizens California and are no longer Non-CHCF-A carriers.Revenue: Local, Network, Long Distance, Miscellaneous, and Uncollectible Revenues.Net income: Operating Revenues less Operating Expenses less Taxes and Interest.Operations income: Operating Revenue less Operating Expenses less Other operating income and expenses less operating taxes.Operating Expense Components: Depreciations and Amortizations, (D&A), Plant Specifics, Customer Operations, and Corporate Operations.Rate of Return: Income as a percentage of net average TPIS.TPIS: Telephone Plant In Service.TPIS Components: Land and Support, Central Office Switching, Transmission, Cable and Wire, Above GroundNet Average TPIS: average of beginning year TPIS and end of year TPIS.
Carrier information was obtained from reports based on FCC Form M filed annually with the Commission.CHCF-A and federal USF subsidy data were obtained from Commission records.
Data Collection